




Abstract
Temporal signal-to-noise ratio (tSNR) and the amplitude of low-frequency resting-state fluctuations (signal amplitude [SA]) can vary between magnetic resonance imaging sessions, thereby decreasing the reliability and reproducibility of measurements of resting-state connectivity between regions of interest (ROIs) in the human brain. In this study, a new metric for quantifying the strength of resting-state connections is introduced, which possesses low sensitivity to tSNR and SA but maintains high sensitivity to expected changes in connectivity magnitude or region volume caused by the presence of neurological disease, for example. This new metric is one that essentially divides the temporal cross-correlation of two ROIs by the temporal cross-correlation of one the ROIs with itself (i.e., a relative connectivity [RelCon]). The robustness of the new metric is demonstrated and compared with several existing metrics, using simulated datasets of varying tSNR and SA, as well as in data collected over multiple sessions from healthy subjects. For both simulated and real datasets, relative connectivity exhibited lower sensitivity to tSNR and SA compared with existing (i.e., absolute) connectivity metrics. Further, simulation suggests that for RelCon, it is better to calculate the correlation between all possible pairs of ROI voxel signals and then appropriately average the correlation coefficients, whereas for absolute connectivity it is better to average signals within the ROIs and then determine the correlation between the averaged signals. RelCon permits the comparison of connectivity across datasets acquired with different scanners or imaging parameters that potentially generate data with differing tSNR and SA.
Introduction
F
Whatever the means for connectivity quantification, the dependence on the temporal signal-to-noise ratio (tSNR) of the collected images and the low-frequency (<0.1 Hz) resting-state signal fluctuation amplitude (signal amplitude [SA]) remains. Thermal noise, scanner noise, physiological noise from the subject, confounding transient (i.e., higher frequency) cognitive processes, changes in subject position, and field inhomogeneity can all vary between sessions. These variations can greatly impact tSNR and SA and thus reduce the reliability and reproducibility of connectivity measurements. In a recent task-based fMRI study, it was demonstrated that the reliability of individual activity maps was largely explained by individual differences in global SNR, and between-subject differences in whole-brain spatial SNR explained the majority of intersubject differences in regional brain activation (Raemaekers et al., 2007). Also, high variability of SA has been reported within- and between-subject groups (Geissler et al., 2007). Although these were task-based studies, the findings can be easily extended to resting-state fMRI, because the concepts of SNR and SA remain the same.
In a typical task-related fMRI experiment, brain activity is quantified during one state relative to a control or alternate brain state. Hence, fMRI predominantly provides a measure of activity within a brain region relative to the activity within the same brain region during the control or alternate state, which inherently helps reduce intersession variability associated with absolute measurements of activity. To date, however, resting-state connectivity remains an absolute measure of the similarity of a brain region with another. Thus, it remains difficult to compare connectivity between subjects, sessions, and MR sites.
The objective of the present study was to develop a means to calculate resting-state connectivity between brain ROIs that is sensitive to meaningful physiological changes associated with the ROIs (e.g., change in the strength of connectivity or change in volume of regions in response to a disease process), but insensitive to tSNR and SA. We introduce a connectivity metric that calculates connectivity between two ROIs, but is relative to the connectivity of one of the ROIs with itself, that is, the connectivity of an ROI to itself becomes the baseline for comparison. Our hypothesis was that such a relative connectivity metric (RelCon) decreases intersession measurement variability caused by intersession differences in tSNR and SA, while maintaining sensitivity to changes in brain region volume that is connected and/or changes in the connectivity of a brain region without a volume change. To investigate this hypothesis, fMRI simulations were first performed to compare our method of calculating connectivity to existing similar methods and to evaluate sensitivity to changes in strength of connectivity, volume of regions, as well as changes in tSNR and SA. Further, resting-state connectivity between the left and right motor cortices was determined for six healthy subjects who participated in multiple sessions, and the methods of connectivity calculation were evaluated in terms of intra- and intersession variability.
Materials and Methods
Calculations of resting-state connectivity
In general, connectivity between two ROIs (ROIa and ROIb) can be measured by a means of temporal cross-correlation. However, the correlation coefficient will depend on the signals that are entered into the correlation analysis. Three methods of signal generation were investigated in this study: 1. Obtain the average signal from each of ROIa and ROIb, and calculate the correlation coefficient between the two signals (ROIa:Avg/ROIb:Avg). 2. Obtain the average signal from ROIa, calculate its correlation with each and every voxel signal within ROIb, Fisher transform each correlation coefficient and average, and then inverse Fisher transform the result (ROIa:Avg/ROIb:NoAvg). 3. Calculate the correlation between all possible ROIa and ROIb voxel pair signals, Fisher transform each correlation coefficient and average, and then inverse Fisher transform the result (ROIa:NoAvg/ROIb:NoAvg).
Each of these techniques, however, gives an absolute measurement of connectivity (AbCon). RelCon was calculated for methods 2 and 3 by dividing by the connectivity of ROIa to itself. That is, for method 2, the denominator for the division was obtained by averaging the time courses of all voxels in ROIa, calculating the correlation coefficient of each voxel in ROIa with this average signal, averaging the Fisher transformation of the correlation coefficients, and finally, computing the inverse Fisher transformation of the average. For method 3, the denominator for the division was obtained by computing the correlation coefficient of every possible pair of voxels in ROIa, averaging the Fisher transformation of the correlation coefficients, and finally, computing the inverse Fisher transformation of the average. Note that RelCon cannot be calculated for method 1, because the connectivity of the seed to itself is equal to 1. RelCon thus represents a new metric to quantify connectivity between two ROIs that have been preselected by an apposite task or by anatomy, analogous to calculating percent change for task fMRI studies. That is, RelCon is not itself a statistic, but rather a metric to permit further ROI-based analyses of connectivity.
Simulations
Two sets of 150 voxels simulating resting-state time series data were digitally generated using Matlab (The Mathworks, Natick, MA). Rician distributed noise (Gudbjartsson and Patz, 1995; Pickens et al., 2005) with a tSNR of 30, 50, and 70 (i.e., three separate simulations, one at each tSNR) was added to each voxel at each of 330 time points with a simulation repetition time (TR) of 1 sec. tSNR was defined as the mean voxel intensity over time divided by the temporal standard deviation of the noise. A signal of interest simulating a typical resting-state signal was generated for each voxel by the summation of sinusoid functions with frequencies between 0 and 0.1 Hz (in steps of 0.01 Hz) with random amplitude and phase. The sampling rate of the reference signal was 100 Hz, which was then down-sampled to 1 Hz (corresponding to TR=1 sec). This signal was then added to a voxel after scaling SA to one of 1%, 2%, or 3% of the average background signal, depending on the simulation. These levels of tSNR and SA were estimated from several real resting-state fMRI datasets in our laboratory and from values reported in previous fMRI simulation studies (Ardekani et al., 2001; Pickens et al., 2005; Triantafyllou et al., 2011). For each level of tSNR and SA, 25 datasets were generated.
Reduction in connectivity between the two ROIs was investigated via two mechanisms: (1) a reduction in the degree of signal synchronization between the voxels in ROIb and the voxels of ROIa and (2) a reduction in the proportion of voxels within ROIb that are connected with ROIa. To change the degree of signal synchronization, the signal of interest for all the voxels in ROIb was temporally shifted such that the Pearson correlation coefficient of the temporal cross-correlation with the original signal of interest varied from 0.5 to 0.9 (in steps of 0.2). To change the proportion of connected voxels within ROIb, a signal of interest whose temporal cross-correlation with the original signal of interest exhibited a Pearson correlation coefficient of 0.9 was added to n voxels (50<n<150, in steps of 50, corresponding to proportions of 0.33, 0.67, and 1.00, respectively). Resting-state connectivity between ROIa and ROIb was then computed using the methods described earlier.
Analyses of variance (ANOVAs) were separately performed for the three ROI proportions containing signal (0.33, 0.67, and 1.00) and the three levels of signal synchronization (0.9, 0.7, and 0.5), with SNR and SA as factors. For AbCon, Fisher-transformed correlation coefficients were used to obtain more normally distributed data.
For each level of tSNR and SA, connectivity values were plotted, and lines were fitted to the data by least squared error. The slopes of the lines were considered as measures of the sensitivity of connectivity to changes in the proportion of signal voxels and the degree of signal synchronization. For a good connectivity metric, the rate of change of connectivity (i.e., slope) should not differ between levels of tSNR and SA. Hence, for each of method of connectivity calculation, a two-factor ANOVA (tSNR and SA as factors) was used to determine whether slope was dependent on tSNR or SA.
In practice, SA is likely to vary within and between brain regions. This has the potential to influence RelCon measurements between two ROIs, depending on which a region is selected as ROIa or ROIb. To investigate this potential issue, we conducted additional simulations by also varying between-region SA and within-region SA.
Real data
This study was approved by the Conjoint Health and Research Ethics Board of the University of Calgary. Six healthy subjects (two men and four women; age: 28±5 years) participated in three sessions performed on different days. All MR images were collected using a 3-Tesla General Electric MR scanner (Signa VHi; GE Healthcare, Waukesha, WI) equipped with an eight-channel phased-array head coil. T1-weighted anatomical images were collected for anatomical registration of the resting-state data (3D spoiled gradient echo: TR/echo time (TE)=8.8/4.1 ms; matrix size=384×256×112; voxel size=0.83×1.25×2 mm). During subject rest, two sets of T2*-weighted gradient-echo echo planar images were acquired with the following parameters: TR/TE=900/30 ms; flip angle=55 degrees; FOV=24×24 cm; 64×64 matrix. Four hundred forty-four volumes of ten 5-mm-thick axial slices were collected. Slice locations were selected to fully encompass the superior-to-inferior extent of the motor cortex. During image acquisition, subjects were asked to lie still and visually fixate on a small black cross at the center of a video projection screen (Avotec, Inc., Stuart, FL). Cardiac waveforms were recorded using a pulse oximeter, and respiration waveforms were collected using a pneumatic belt around the abdomen. An additional scan was collected during the performance of a bilateral finger movement task (220 volumes with TR=1 sec; remaining parameters were the same as for resting state). The task consisted of five visually cued blocks of 30 sec of self-paced bilateral finger flexion alternating with 30 sec of rest.
Preprocessing of images collected during rest and during the finger movement task was performed using the FMRIB software library (FSL;
For the resting-state data, temporal low-pass filtering was included to eliminate frequencies exceeding 0.1 Hz. Images were further processed by entering them into a GLM with eight image-based retrospective correction (RETROICOR) regressors (four respiration regressors, including sinϕr, cosϕr, sin2ϕr, and cos2ϕr, and four cardiac regressors, including sinϕc, cosϕc, sin2ϕc, and cos2ϕc) (Glover et al., 2000), one regressor for respiratory volume change (respiration volume per time convolved with the respiratory response function) (Birn et al., 2008), one regressor for cardiac volume change (heart rate convolved with the cardiac response function) (Chang et al., 2009), and six head motion regressors. This produced a set of zero-mean physiologically corrected residual images for connectivity analysis. For each scan, resting-state connectivity between the left and right motor cortices was computed using the methods described earlier as a function of ROI size, and an average over all scans and sessions was obtained for each subject. Intrasession and intersession coefficients of variation (CVs) were also computed for each ROI size using an ANOVA with scan and session as factors, as described by Eliasziw et al. (1994).
Results
Simulations
Figure 1 shows measured connectivity as a function of the degree of signal synchronization (i.e., true connectivity), averaged over 25 simulations. For AbCon, the best performance was observed when voxel signals were averaged for both ROIs before cross-correlation (i.e., ROIa:Avg/ROIbAvg). Any form of cross-correlation using individual voxels underestimated true connectivity and was strongly dependent on tSNR and SA. The best performance overall was observed for RelCon with cross-correlation between all possible voxel pairs before averaging (i.e., ROIa:NoAvg/ROIbNoAvg). ANOVA confirmed these observations. Connectivity for all methods exhibited a strong dependence on tSNR [all F(2,48)>7.0, p<0.008], with the exception of RelCon with no signal averaging [F(2,48)=2.97, p>0.05]. Similar results were found for SA [all F(2,48)>205, p<0.001], except that RelCon with no signal averaging did exhibit a weak but significant dependence on SA [F(2,48)=7.13, p=0.01]. Follow-up t-tests, however, revealed that this significant dependence was due to the lowest SA (SA=1%), which significantly differed from SA=2% (p=0.02) and SA=3% (p=0.03), whereas there was no difference between SA=2% and SA=3%. Thus, at typical SA levels, RelCon does not depend on SA or tSNR.

Simulation data: Measured connectivity for each method of connectivity calculation as a function of true connectivity. The graphs in the left column are the absolute measurements of connectivity (AbCon) and the graphs in the right column are the relative measurements of connectivity (RelCon). At the top, connectivity is calculated after averaging all the voxel signals in each of ROIa and ROIb. In the middle, connectivity is calculated after averaging the voxels signals in ROIa only. At the bottom, connectivity is calculated with no averaging of voxel signals. Each line is the average of 25 simulations. The dashed line is the desired result, given the true level of connectivity in the simulations. RelCon with no signal averaging (bottom right graph) exhibits the expected result for all levels of tSNR and SA. ROIs, regions of interest; SA, signal amplitude; SNR, signal-to-noise ratio.
Figure 2 shows the values of the slope of the lines fitted to the connectivity data in Figure 1. For AbCon with voxel signal averaging for both ROIs, the expected sensitivity to changes in connectivity (i.e., slope=1) was observed only for SA=3%, whereas for RelCon with no signal averaging, the expected sensitivity was observed for all levels of tSNR and SA. These observations were also confirmed by ANOVA. For all methods, sensitivity was dependent on tSNR [all F(2,48)>9.16, p<0.001], with the exception of RelCon with no signal averaging [F(2,48)=3.34, p>0.05]. Similarly, sensitivity was dependent on SA for all methods [all F(2,48)>3400, p<0.001], expect that RelCon with no signal averaging did exhibit a dependence on SA [F(2,48)=9.06, p=0.006]. Follow-up t-tests revealed that this significant difference was due to SA=1% at SNR=30. Hence, for more typical levels of SA and tSNR, the sensitivity of RelCon to changes in connectivity does not depend on SA or tSNR.
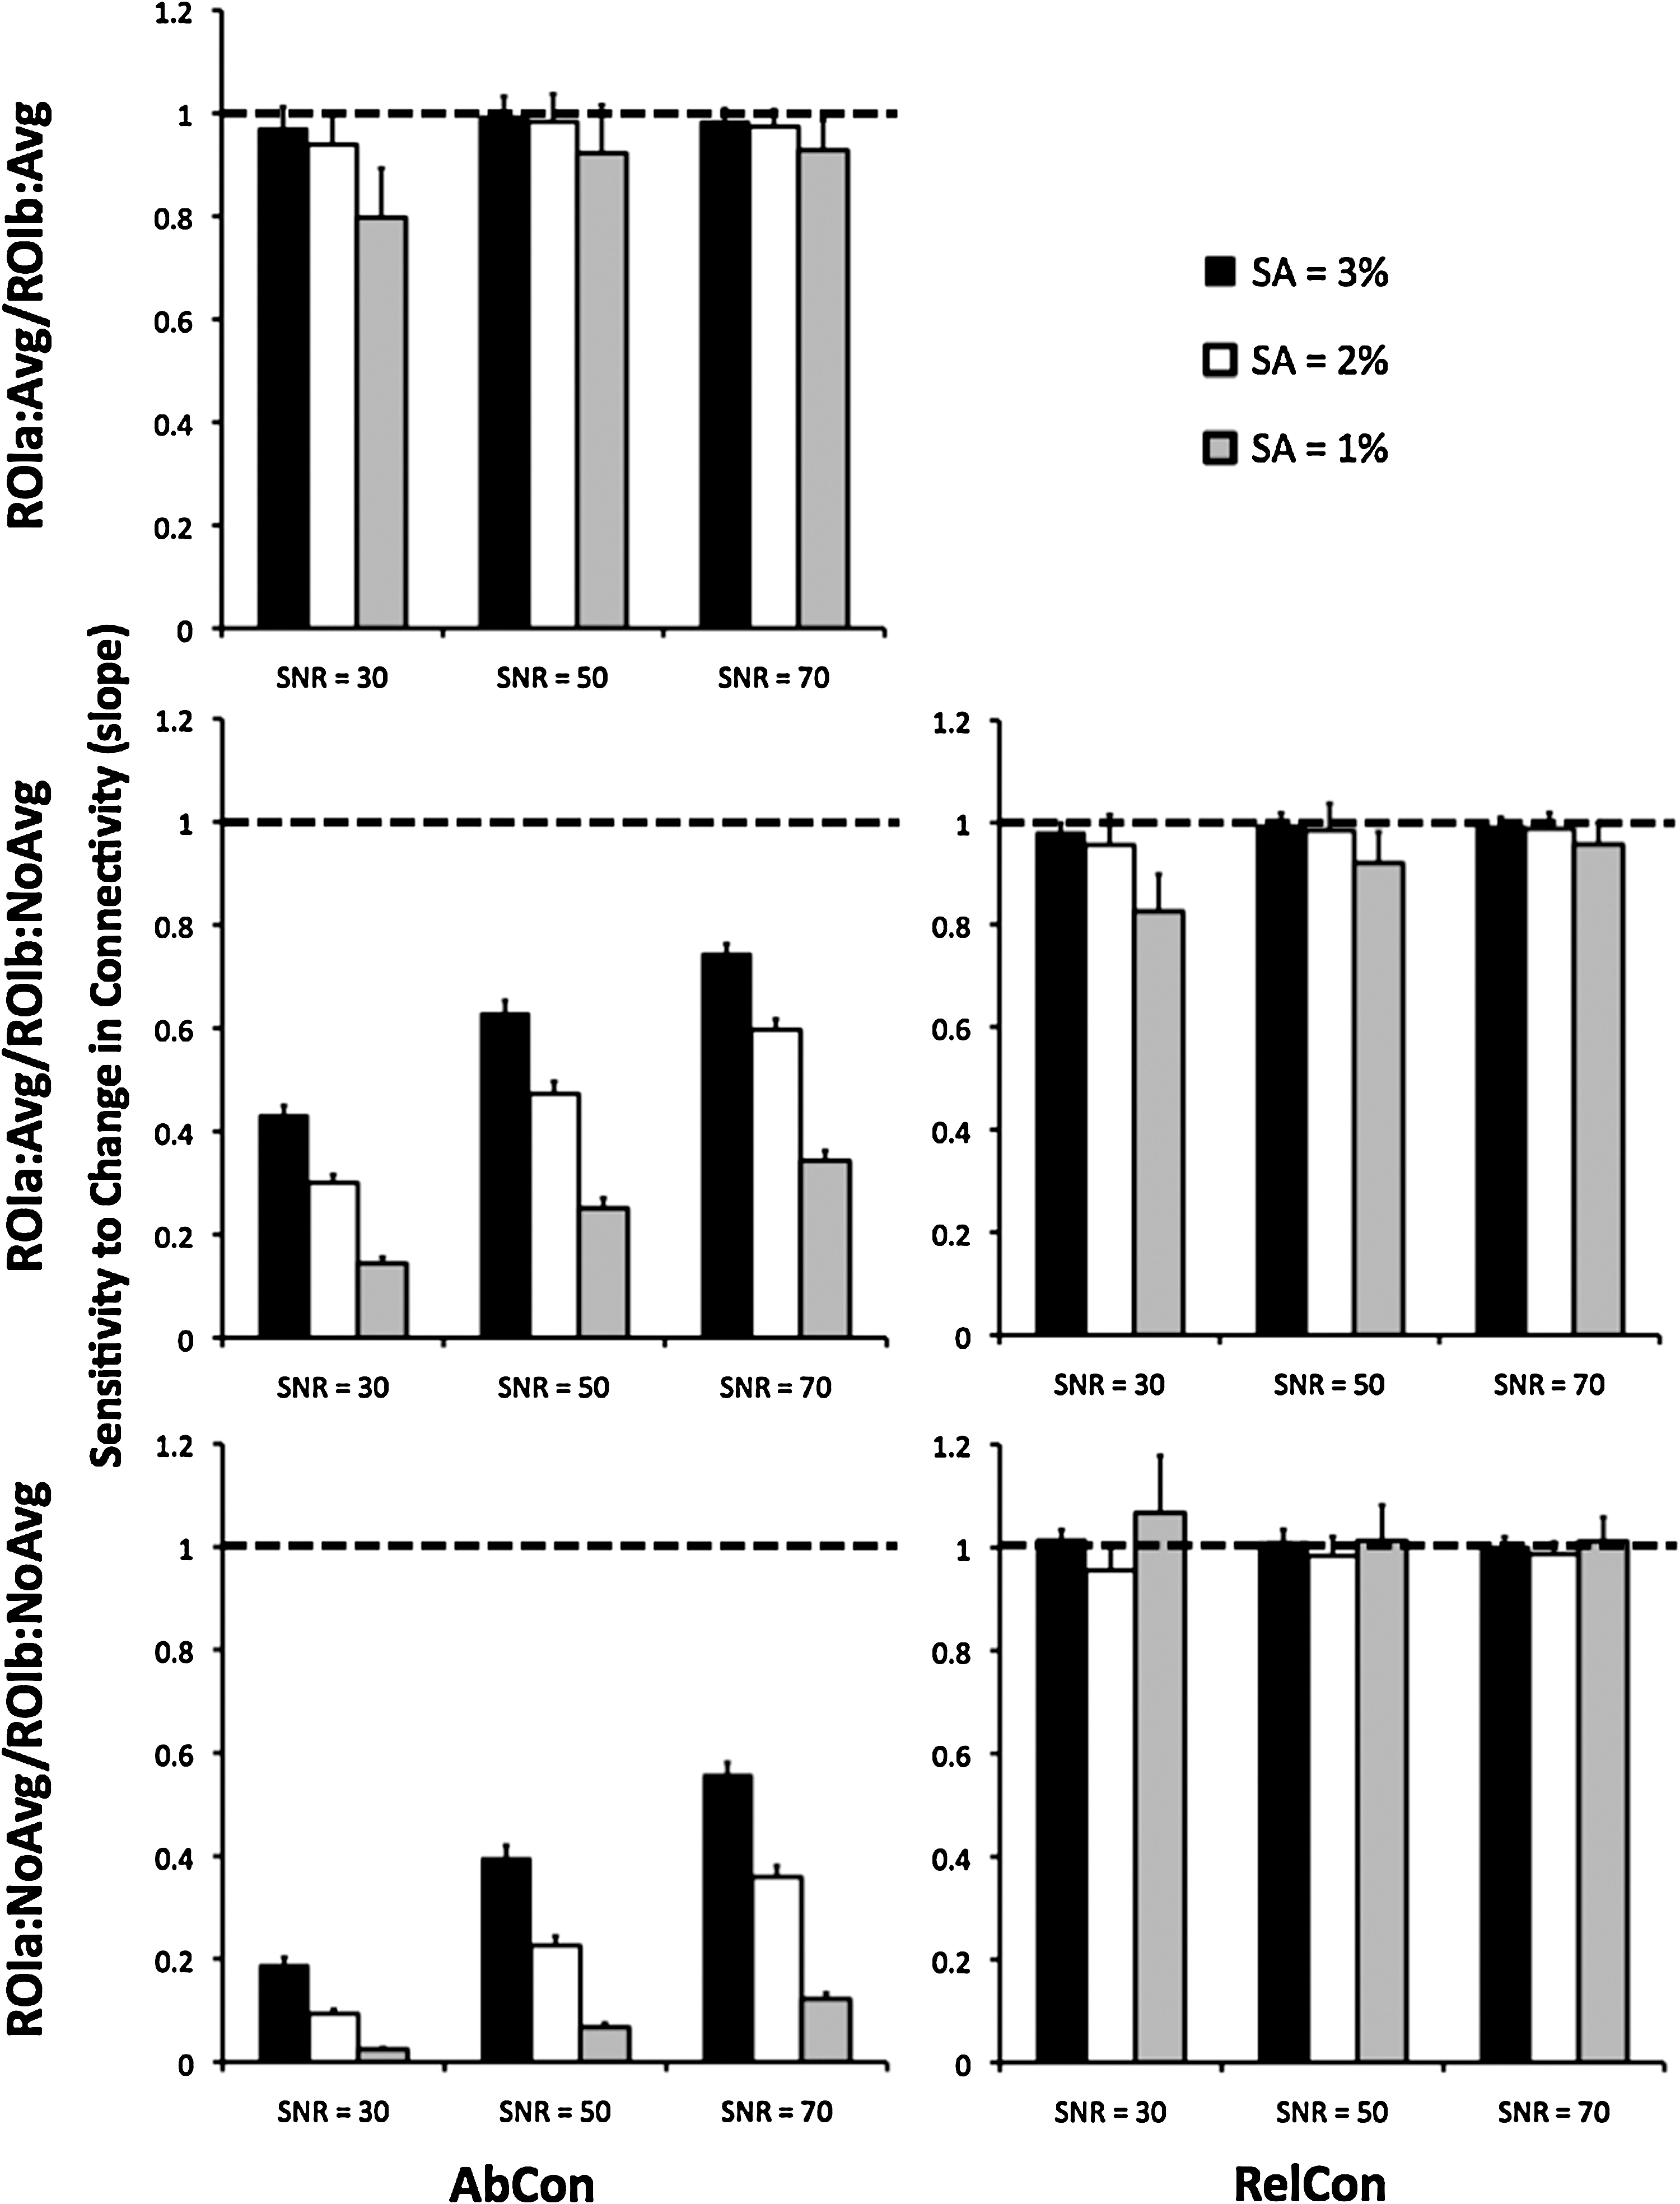
Simulation data: The sensitivity of method of connectivity calculation to change in connectivity (i.e., the slope of the lines in Fig. 1). The graphs in the left column are the absolute measurements of connectivity (AbCon) and the graphs in the right column are the relative measurements of connectivity (RelCon). The rows correspond to the same connectivity calculation methods as shown in Figure 1. Each bar is the average of 25 simulations. Error bars are standard deviation. The dashed line is the desired result of a slope of 1, that is, for a change in true connectivity, the same change in calculated connectivity should be observed. RelCon with no signal averaging (bottom right graph) exhibits the expected result for all levels of tSNR and SA.
Figure 3 shows measurements of connectivity as a function of the proportion of ROIb voxels containing the signal of interest. AbCon performs poorly; in the case of voxel signal averaging for both ROIa and ROIb (top left of Fig. 3), noise is reduced, thus reducing the sensitivity to the number of voxels in an ROI that contains the signal of interest. RelCon with no signal averaging generates the expected values of connectivity. These observations were confirmed by ANOVA. For all methods, connectivity is dependent on tSNR [all F(2,48)>4.0, p<0.04] and SA [all F(2,48)>88, p<0.001] at all proportion levels, with the exception of RelCon with no signal averaging [all F(2,48)<3.55, p>0.05]. Hence, RelCon for any proportion of voxels containing signal is not dependent on SA or tSNR.

Simulation data: Measured connectivity for each method of connectivity calculation as a function of the proportion of ROIb voxels containing signal. The graphs in the left column are the absolute measurements of connectivity (AbCon) and the graphs in the right column are the relative measurements of connectivity (RelCon). At the top, connectivity is calculated after averaging all the voxel signals in each of ROIa and ROIb. In the middle, connectivity is calculated after averaging the voxel signals in ROIa only. At the bottom, connectivity is calculated with no averaging of voxel signals. Each line is the average of 25 simulations. The dashed line is the desired result given the true level of connectivity in the simulations. RelCon with no signal averaging (bottom right graph) exhibits the expected result for all levels of tSNR and SA.
Figure 4 shows the values of the slope of the lines (i.e., sensitivity to the proportion of ROI voxels containing signal) fitted to the connectivity data in Figure 3. Only RelCon with no signal averaging generated the expected sensitivity (i.e., the slope of the line should be 0.9, because true connectivity is 0.9 when all voxels contain the signal). For all other methods, there was a dependence of sensitivity on tSNR [all F(2,48)>10.1, p<0.001] and SA [all F(2,48)>905, p<0.001]. RelCon with no signal averaging exhibited a weak dependence on tSNR [F(2,48)=4.23, p=0.03] and SA [F(2,48)=14.3, p=0.001]. Follow-up t-tests revealed once again that these dependencies were for SA=1% at SNR=30. Hence, for more typical levels of SA and tSNR, the sensitivity of RelCon to the change in the proportion of voxels containing signal is not dependent on SA or tSNR.

Simulation data: The sensitivity of method of connectivity calculation to change in the proportion of voxels in ROIb containing signal (i.e., the slope of the lines in Fig. 3). The graphs in the left column are the absolute measurements of connectivity (AbCon) and the graphs in the right column are the relative measurements of connectivity (RelCon). The rows correspond to the same connectivity calculation methods as shown in Figure 3. Each bar is the average of 25 simulations. Error bars are standard deviation. The dashed line is the desired result of a slope of 0.9. RelCon with no signal averaging (bottom right graph) exhibits the expected result for all levels of tSNR and SA.
For typical levels of tSNR in resting-state datasets, that is, greater than 50 (Triantafyllou et al., 2011), we obtained the same results for varying the between-region and within-region SA.
Real Data
The average measurements of connectivity across all subjects are shown in Figure 5 as a function of ROI size. Neither AbCon nor RelCon was sensitive to ROI size, and the relative difference between them was the same for all ROI sizes. The intrasession and intersubject CVs were also independent of ROI size; for AbCon with voxel signal averaging for both ROIs, the intrasession and intersession CVs were 0.62 and 0.75, respectively, and 0.41 and 0.55 for RelCon with no voxel signal averaging, respectively. Representative maps of AbCon and RelCon from a single subject are shown in Figure 6. Better intersession agreement is observed for RelCon, for data collected on separate days.
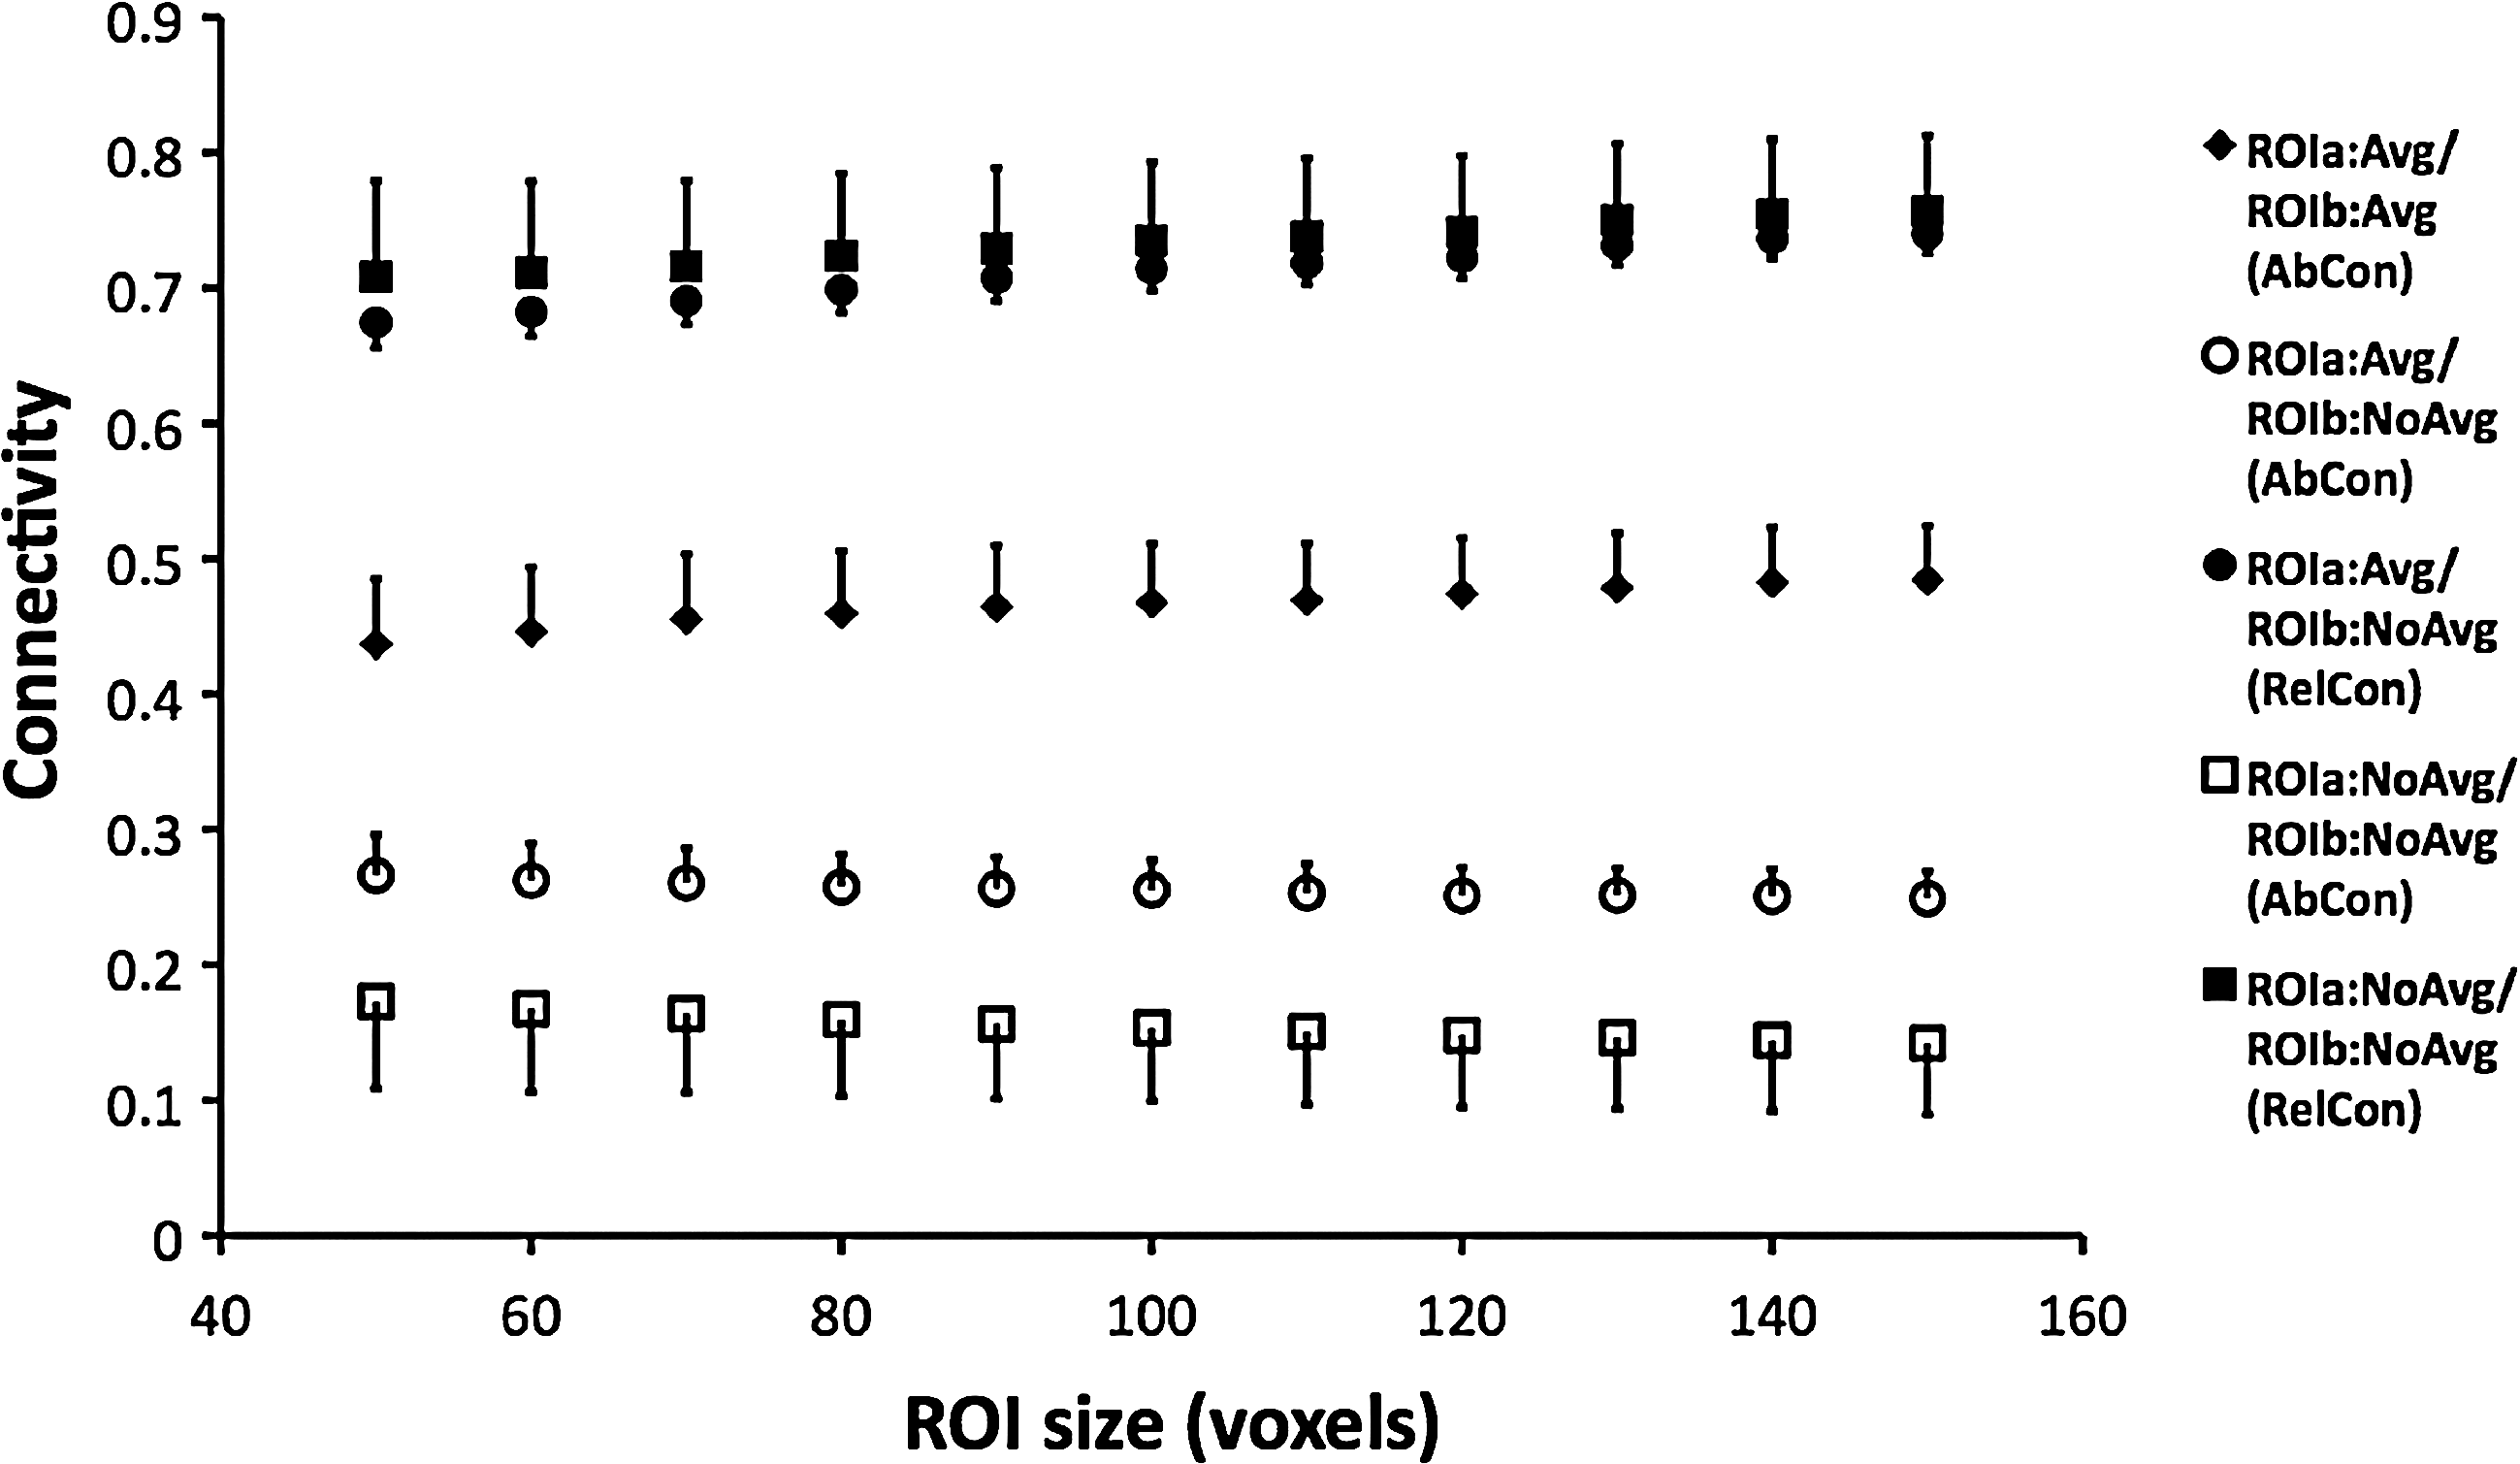
Real data: Resting-state connectivity between left and right motor cortex ROIs as a function of ROI size; ROIs were selected as the n most activated voxels during a bilateral finger movement task. Data from each subject are the average over two scans and three sessions, and each data point in the figure is the average over all six subjects. Error bars are the standard error of the mean across subjects. Connectivity does not exhibit a dependence on ROI size for any method.
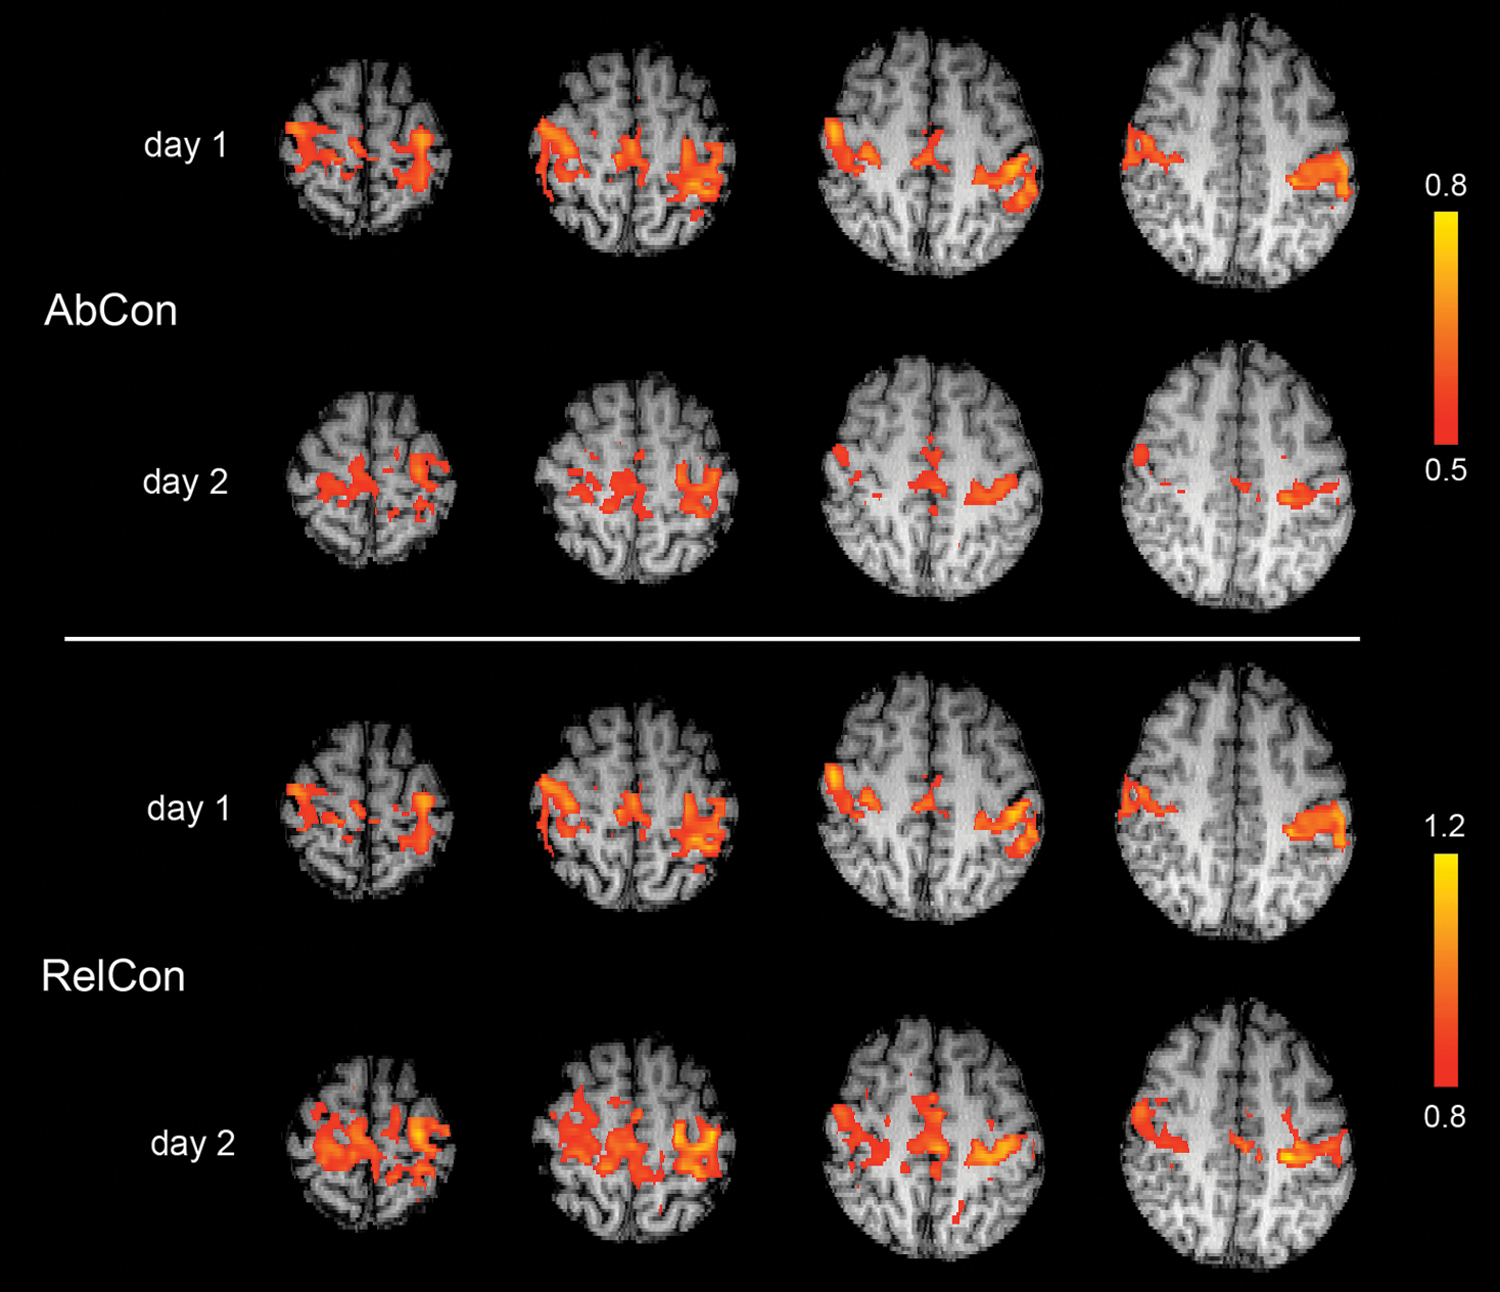
Real data: Voxel-based maps of AbCon (top) and RelCon (bottom) generated from a single subject. Better agreement is observed between sessions (days) for RelCon. For day 1, AbCon and RelCon generate near identical maps; however, on day 2, AbCon and Relcon exhibit noticeable differences, especially interhemisphere.
Discussion
In this study, we have demonstrated through simulations that resting-state connectivity between two ROIs is independent of tSNR and the amplitude of resting-state signals (SA), when it is computed relative to the connectivity of one of the ROIs with itself. This relative connectivity metric (or RelCon) also possesses lower intra- and intersession variability relative to simple temporal cross-correlation of averaged voxel signals. Low intersession variability ensures reliability and reproducibility, which is of particular importance for potential clinical application to assess changes in brain function in the presence of neurological disease and during its progression (Bennett and Miller, 2010). Intersubject variability was not investigated in the present study, because differences between subjects may actually reflect meaningful intersubject differences in resting-state connectivity that predict behavioral responses, as have been previously reported (Liu et al., 2011). Hence, attempting to minimize intersubject variability may not be of importance for resting-state methods.
The presence of neurological disease has been shown to reduce the size of coherent brain regions (Paakki et al., 2010; Wu et al., 2010), thus decreasing intraregional connectivity. The findings of the present study suggest that connectivity as computed by existing absolute methods, like AbCon, is not accurate for or sensitive to changes in the proportion of coherent voxels (Fig. 3). That is, when the proportion of voxels within a brain region that contains the signal of interest decreases (as, for example, in the case of atrophy), averaging the signal over the brain region simply averages the noisy voxels within the atrophic portions; thus, AbCon is insensitive to the change in the proportion of connected voxels. As a result, patient–control differences in between-region connectivity are likely to be exaggerated, or even missed, using these approaches. RelCon computes all possible correlation pairs, even the noisy pairs. As a result, averaging will reflect the degree to which noise, or atrophy, has become part of the brain region. In addition, RelCon can also indicate the proportion of voxels that remain coherent. Thus, RelCon is a more accurate means to investigate connectivity differences between patients and control subjects.
Although we have demonstrated the benefits of RelCon for motor cortex, the technique is not restricted to this brain region or network. Any region that consists of multiple voxels can be used for RelCon. A single-voxel ROI approach will remain an absolute measure of connectivity and will thus exhibit relatively greater variability. The application of RelCon in other brain regions, such as those involved in cognitive processes, is certainly warranted. RelCon likely possesses the same sensitivity to transient (i.e., at frequencies higher than those associated with the resting state) cognitive processes as other methods that do not temporally resolve resting-state connectivity. If one ROI and not the other is involved in a transient process, the voxels within the first ROI would likely be more self-coherent but less coherent with voxels of the other ROI; this would reduce both AbCon and RelCon. If both ROIs are involved, the voxels within each ROI will be more self-coherent as well as somewhat more coherent between ROIs, thus increasing AbCon and either maintaining or increasing RelCon, depending on the magnitude of the increase in coherence. Temporally resolving RelCon, however, may help identify times at which transient processes occur, and whether one ROI or both are involved. This issue warrants further investigation.
Although RelCon compensates for global differences in tSNR and SA between datasets, such as thermal noise, scanner noise, differences in attention, and arousal of the subject, it cannot overcome spatially localized differences within images, such as B0 inhomogeneities and cardiac and respiration artifacts. Correction schemes for these factors will thus still be required before RelCon application. RelCon, like other methods, possesses SNR limitations. For low tSNR, RelCon will not perform well. Because of the inherent variation in SA between voxels and brain regions, low SA may be masked by noise. Hence, RelCon measurements may become dependent on the assignment of ROIa or ROIb. However, in practice, this is not a concern, because resting-state images typically possess adequate tSNR (Triantafyllou et al., 2011).
Conclusion
Resting-state connectivity between two brain ROIs relative to the connectivity of one the ROIs to itself (RelCon) is independent of tSNR and SA of resting-state signals. RelCon also possesses low intersession variability and thus more readily permits comparisons between sessions, between subject groups, between MR scanners, wherein tSNR and SA may vary, as well as between datasets collected with different imaging parameters (e.g., voxel size, flip angle, echo time, receiver bandwidth, slice gap, and k-space trajectory).
Footnotes
Acknowledgment
This research was supported by Natural Sciences and Engineering Research Council of Canada (NSERC).
Author Disclosure Statement
The authors have no conflicts of interest to declare.