
Abstract
Functional imaging studies have shown reduced activity within the default mode network during attention-demanding tasks. The network circuitry underlying this suppression remains unclear. Proposed hypotheses include an attentional switch in the right anterior insula and reciprocal inhibition between the default mode and attention control networks. We analyzed resting state blood oxygen level dependent (BOLD) data from 1278 subjects from 26 sites and constructed whole-brain maps of functional connectivity between 7266 regions of interest (ROIs) covering the gray matter at ∼5 mm resolution. ROIs belonging to the default mode network and attention control network were identified based on correlation to six published seed locations. Spatial heterogeneity of correlation between the default mode and attention control networks was observed, with smoothly varying gradients in every hub of both networks that ranged smoothly from weakly but significantly anticorrelated to positively correlated. Such gradients were reproduced in 3 separate groups of subjects. Anticorrelated subregions were identified in major hubs of both networks. Between-network connectivity gradients strengthen with age during late adolescence and early adulthood, with associated sharpening of the boundaries of the default mode network, integration of the insula and cingulate with frontoparietal attentional regions, and decreasing correlation between the default mode and attention control networks with age.
Introduction
L
The default mode network, or task negative network, of the brain (Raichle et al., 2001) consists of the posterior cingulate/precuneus, bilateral temporoparietal junction, medial prefrontal, bilateral superior frontal, inferior temporal, cerebellar tonsils, and bilateral parahippocampal regions (Fox et al., 2005). Across a wide assortment of cognitive tasks (Gusnard and Raichle, 2001), this network shows greater activity during the resting state than during the task (Mayer et al., 2010), and it has been proposed that this network may be involved in attending to internal stimuli, internal narrative, or self-reflection (Andrews-Hanna et al., 2010a; Cavanna and Trimble, 2006; Gusnard et al., 2001; Northoff et al., 2006), and may be preferentially involved in the neuropathology of psychiatric and neurodegenerative disorders such as Alzheimer disease (Broyd et al., 2009; Greicius et al., 2004; Seeley et al., 2007a). Recent evidence suggests that this network may be comprised of a midline core active during self-referential thought, and a medial temporal core active during memory of past events (Andrews-Hanna et al., 2010b), with the precuneus showing three anterior/posterior subdivisions with differing connectivity patterns (Margulies et al., 2009).
The attention control network, or task positive network, is comprised of the bilateral intraparietal sulcus, bilateral dorsolateral prefrontal cortex, precentral sulcus including frontal eye fields, bilateral anterior superior insula, bilateral middle temporal (MT+) and bilateral anterior cingulated, and supplementary motor area regions (Fox et al., 2005). This network includes the dorsal and ventral attention networks (Fox et al., 2006; Seeley et al., 2007b) and the cingulo-insular or salience detection network (Dosenbach et al., 2008; Seeley et al., 2007b). This network is more active during tasks requiring attention to external stimuli or assessment of stimulus salience or novelty (Corbetta and Shulman, 2002; Seeley et al., 2007b). Because the terminology “task-negative” and “task-positive” depends greatly on the particular tasks selected, we use the term “attention control network” instead to refer to this network (Harrison et al., 2008).
It has been postulated that the default mode and attention control networks are intrinsically anticorrelated, switching the focus of attention between internal and external stimuli (Fox et al., 2005; Fransson, 2005). Such anticorrelations, however, have only been observed following a postprocessing technique that forces anticorrelations to exist between networks of sufficient size, and thus may be artifactual (Anderson et al., 2011b; Fox et al., 2009; Murphy et al., 2009). Nevertheless, it has been argued that true anticorrelations between networks are hidden by larger, artifactual positive correlation throughout the brain due to shared variance from technical factors such as respiration and scanner noise (Fox et al., 2009).
There is evidence for spatial heterogeneity in the relationships between the default mode and attention control networks. A study examining the differences in seed-based anticorrelated networks showed differences between seeds in the medial prefrontal and precuneus regions (Uddin et al., 2009). An regions of interest (ROI)-based study including regions in both default mode and attention control networks also showed heterogeneity of connections between these networks, with correlated and anticorrelated connections (He et al., 2009). In addition to intrinsic anticorrelation, it has been proposed that relative activity of default mode and attention control networks may be controlled by specific brain regions, such as the right frontoinsula (Menon and Uddin, 2010; Sridharan et al., 2008).
To evaluate hypotheses underlying control of default mode network suppression, we performed whole-brain measurements of correlation between default mode and attention control networks in a large sample of subjects using open access datasets from international data-sharing initiatives. Such high spatial resolution connectivity measurements have yielded information in previous studies about the internal architecture of connectivity within a network (Anderson et al., 2010) and between voxels within a network and seeds outside the network to identify functional parcellations (Cohen et al., 2008), and resting state analysis of large subject samples has helped to characterize neuroanatomical features shared across subjects (Biswal et al., 2010; Tomasi and Volkow, 2011).
Materials and Methods
Subject characteristics: 57 subjects
Blood oxygen level dependent (BOLD) fMRI data were obtained from 57 normal, healthy adolescent and adult volunteers, examined after informed consent in accordance with procedures approved by the University of Utah Institutional Review Board. Data from all subjects in this dataset have been previously reported in other contexts (Anderson et al., 2010, 2011a, 2011b, 2011c), although analyses presented here are all novel to this report. All participants underwent psychiatric screening via the Structured Clinical Interview for DSM-IV Patient Version (SCID-P) (First et al., 1996). All subjects were screened for anxiety by Hamilton Anxiety Rating Scale (Hamilton, 1969) and depression by Hamilton Depression Rating Scale (Hamilton, 1960) immediately before MRI scanning. Exclusion criteria for all subjects included major sensorimotor handicaps; full-scale IQ<70, learning disability, history of claustrophobia, head trauma, loss of consciousness, autism, schizophrenia, anorexia or bulimia nervosa, alcohol or drug dependence/abuse based on DSM-IV criteria (during 2 months before scan, or total past history of ≥12 months), electroconvulsive therapy; active medical or neurological disease; metal fragments or implants; and current pregnancy or lactation.
Data acquisition
Images were acquired on Siemens 3 Tesla Trio scanner with a 12-channel head coil. The scanning protocol consisted of initial 1 mm isotropic MPRAGE acquisition for an anatomic template. BOLD echoplanar images (TR=2.0 sec, TE=28 msec, GRAPPA parallel acquisition with acceleration factor=2, 40 slices at 3 mm slice thickness, 64×64 matrix, 220 mm FOV) were obtained during the resting state, where subjects were instructed, “Keep your eyes open and remain awake and try to let thoughts pass through your mind without focusing on any particular mental activity.” Prospective motion correction was performed during BOLD imaging with PACE sequence. An 8-min resting scan (240 volumes) was obtained for each subject.
Publicly released datasets: 1221 subjects
An additional 1221 subjects were analyzed from publicly available datasets released with the open-access “1000 Functional Connectomes Project” (
The mean age of all subjects was 18.8±6.1 standard deviation years (range 7–35). Subject ages are shown graphically in Fig. 1. Seven hundred twenty-three subjects were male; 555 were female. All subjects were processed in the same manner regardless of the site from which they were obtained.

Distribution of ages from 1278 subjects used in the analysis, grouped into bins of 1 year, with a range from 7 to 35 years.
fMRI preprocessing
The following sequence was used for image postprocessing of all BOLD image datasets. Using SPM8 toolbox (Wellcome Trust), BOLD images were realigned (realign, estimate, and write), coregistered to MPRAGE image (coregister, estimate, and write), and normalized to MNI template (normalize, estimate, and write, T1.nii template). Gray matter, white matter, and cerebrospinal fluid (CSF) were segmented from MPRAGE image using SPM8 segment function (modulated, normalized, and thorough clean). Images were bandpass filtered between 0.001 and 0.1 Hz, and a linear detrend was performed at each voxel in the brain. Time series were averaged from 2 ROIs in the white matter (bilateral centrum semiovale), CSF (lateral ventricles), soft tissues of the head and face, and 6 rigid motion correction parameters from realignment step as previously described (Anderson et al., 2010, 2011b), and for each voxel, a general linear model was used to find a best fit for white matter, CSF, soft tissues, and motion parameter time series, which were subtracted from the voxel's time series. No regression was performed of the global signal or gray matter to avoid introducing artifactual correlations between networks.
Calculation of functional connectivity matrices
An MNI template for gray matter (SPM8, gray.nii, intensity>0.5) was parcellated into 7266 ROIs by removing voxels from the image that were less than 5 mm from other retained voxels. Then, all gray matter voxels were assigned to the closest remaining voxel's ROI. The ROIs ranged from 2 to 12 voxels in extent (mean 4.9±1.3 voxels at isotropic 3 mm resolution). Time series data for each ROI were generated from the averaged time series of all voxels pertaining to the respective ROI. Postprocessed time series data from every ROI were compared to the time series from all other ROIs using Pearson correlation coefficients. The resultant 7266 by 7266 matrix of correlation coefficients constituted a whole-brain functional correlation matrix for an individual subject. The whole-brain correlation matrices for each subject were Fisher transformed to improve normality (Fox et al., 2005) and averaged across all subjects to produce a mean functional correlation matrix.
Identification of default mode and attention control networks
From preprocessed BOLD data, time series data from each of the 7266 ROIs of the brain in each subject were compared to time series averaged from voxels within the ROI containing one of 6 seed regions. Three seed regions were obtained from Talairach to MNI conversion of coordinates reported (Fox et al., 2005) for hubs of the attention control network: Left intraparietal sulcus x=−23, y=−70, z=46; left anterior insula x=−45, y=5, z=9; and right frontal eye field x=28, y=−10, z=58. Three additional seed regions were used from a report of default mode network architecture (Andrews-Hanna et al., 2010b) to define the default mode network: posterior cingulate x=−8, y=−56, z=26; medial prefrontal x=−6, y=52, z=−2; and left temporoparietal junction x=−54, y=−54, z=28.
For each seed independently, the Fisher-transformed correlation was measured for each of the 7266 ROIs with the seed ROI. The peak of the distribution of correlation values across ROIs was obtained from a histogram with bin spacing of 0.01 units, and ROIs greater than 2 standard deviations from the peak value were included in the default mode or attention control network. The union of ROIs meeting criteria for the three seeds for each network was used to define network boundaries for further analysis.
Results
The default mode and attention control networks were identified by significant correlation across subjects to seed locations for each network obtained from prior reports. To minimize dependence on any one particular seed, three seeds were chosen for each network to represent core hubs of the network. For the default mode network, seeds were located in the posterior cingulate, medial prefrontal, and left temporoparietal junction (Andrews-Hanna et al., 2010b). For the attention control network, seeds were located in the left intraparietal sulcus, right frontal eye field, and left anterior insula (Fox et al., 2005). With the large subject sample used in this report, correlation to a given seed for most regions of the brain will be significantly different from zero and thresholding is necessary to identify core regions of the network. To identify these core regions, we included all regions that showed correlation with one of the three seeds that was higher than 2 standard deviations from the peak of the distribution of correlation with the rest of the brain regions to the seed. Distributions of correlation for each seed to the 7266 ROIs used in the analysis are shown in Fig. 2A. The standard deviation for correlation of brain regions to the six network seeds ranged from 0.061 to 0.079. Using this criterion, 631 of the 7266 regions were assigned to the attention control network and 817 of 7266 regions were assigned to the default mode network. No regions satisfied criteria for both networks. The network boundaries used for the remainder of the results are shown in Fig. 2B.
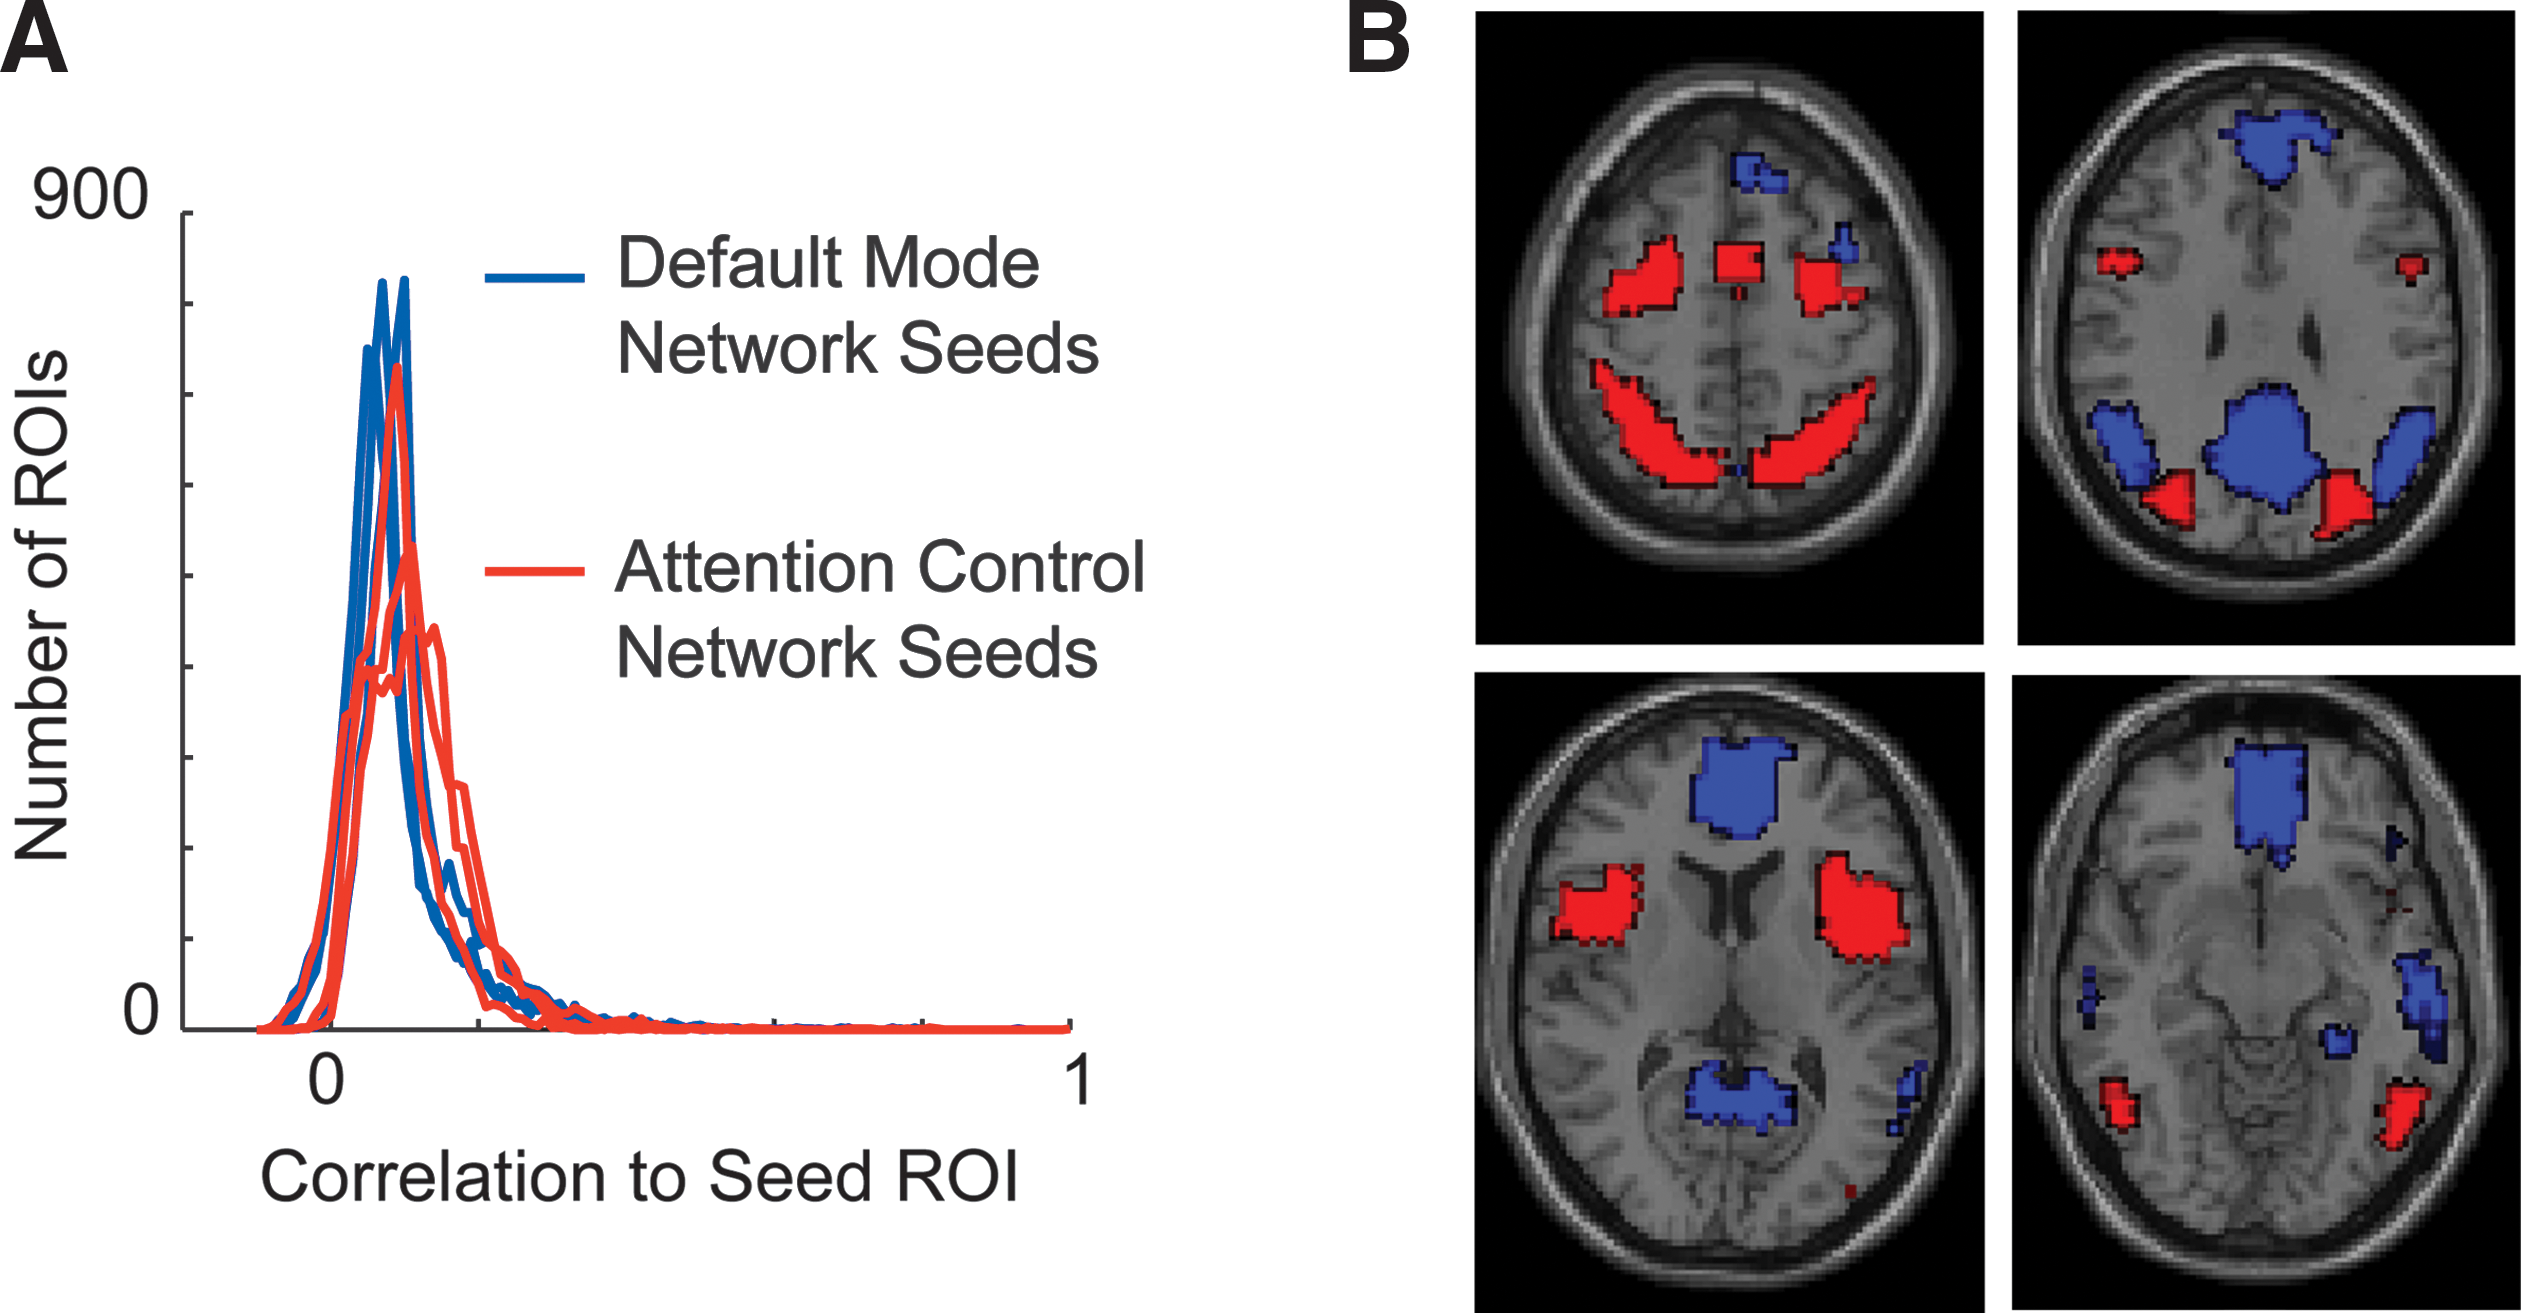
Identification of default mode and attention control networks.
For each ROI in the gray matter, correlation with every other ROI's time series was obtained for each of the 1278 subjects, with Fisher transformation of correlation values to improve normality. To evaluate the spatial distribution of connectivity between the two networks, Fisher-transformed correlation values for each region were averaged with ROIs belonging to the default mode and attention control networks to obtain a mean correlation for all brain regions to the two networks. Between-network connectivity is shown in Fig. 3, where mean correlation of all default mode ROIs to the attention control network and mean correlation of all attention control network ROIs to the default mode network is illustrated for three groups of subjects. Subjects were randomly assigned to one of three groups to evaluate reproducibility of connectivity between the networks. The groups all had identical means and standard deviation of subject age of 18.8±6.1 years. Each group had 426 subjects, with no subjects in common between the three groups.
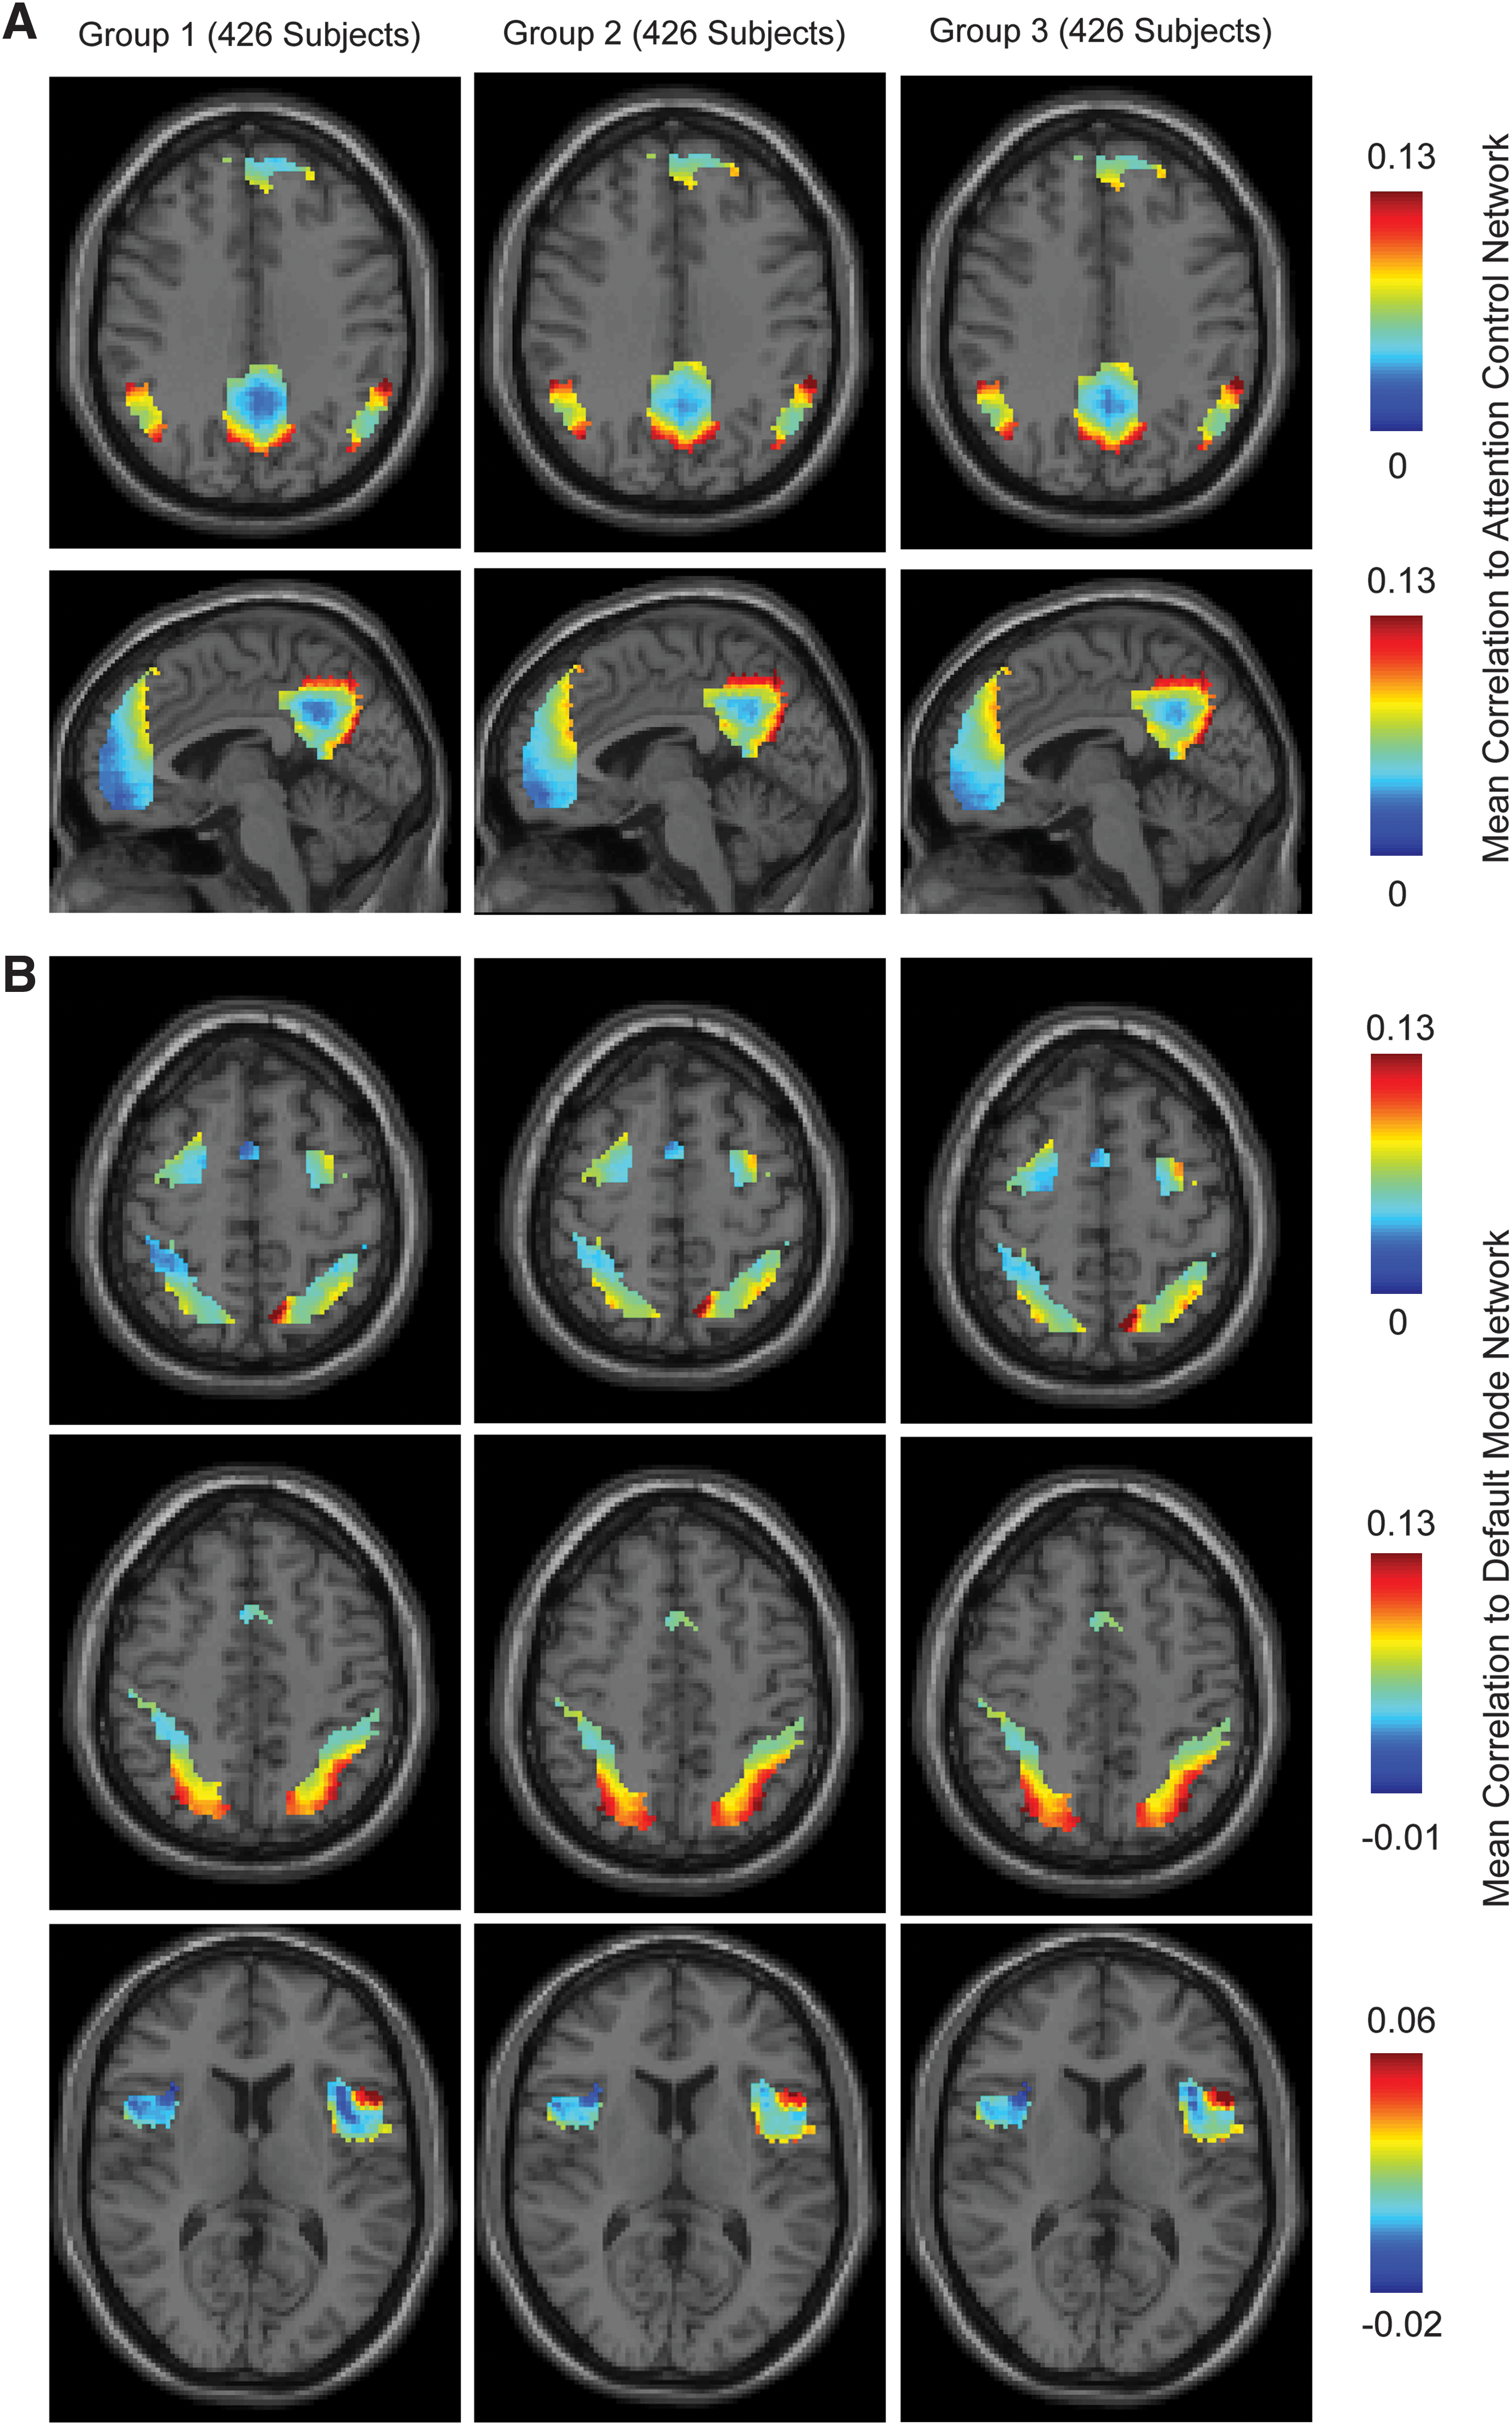
Connectivity gradients between default mode and attention control networks.
Correlation between the two networks is reproducible, both qualitatively and quantitatively across the three subject groups, and characteristic patterns can be described from the images in Fig. 3. Regions of the default mode network show connectivity to the attention control network that consists of a gradient from low correlation to higher correlation in each hub of the network. The posterior cingulate hub shows lowest connectivity centrally, with a radial gradient of higher connectivity to the attention control network extending peripherally. The temporoparietal junction hubs show gradients extending from lowest connectivity in lateral and central regions of the hub extending anteriorly, posteriorly, and medially. The medial prefrontal cortical hub shows a single smoothly varying gradient from lower to higher connectivity with the attention control network from inferior to superior.
In hubs of the attention control network, a similar pattern is seen. Gradients vary from a single point of lower connectivity to higher connectivity with the default mode network in the intraparietal sulcus (low inferior and lateral to high superior and medial), anterior insula (low anterior and medial to high lateral and posterior), and frontal eye fields (low posterior and medial to high anterior and lateral).
For each of the major hubs of both networks, a single point could be identified with lowest connectivity to the opposite network. These points of least correlation (or greatest anticorrelation) are listed in Table 2. Although these points of least correlation were selected for because of low correlation to the opposite network, it is unclear whether they represent merely less correlated or uncorrelated points, or whether they are actually anticorrelated to opposite regions of the network. To assess whether significant anticorrelations are present at these points, we calculated for each of the 6 ROIs listed in Table 2 in each network correlation with every other ROI in the brain and determined whether they were significantly anticorrelated with any other ROI across subjects.
Coordinates represent the central point of the ROI. ROIs were ∼5 mm in diameter.
MNI, Montreal Neurological Institute; ROI, regions of interest.
Results are shown in Fig. 4. Three of the six points of lowest correlation in the attention control network and five of the six points of lowest correlation in the default mode network with the opposite network showed significant anticorrelations after multiple comparison correction. Moreover, the ROIs showing significant anticorrelation reproduced points of lowest correlation in hubs of the opposite network. For example, the anterior insula points of lowest correlation were anticorrelated to points within the inferior medial frontal, central posterior cingulate, and lateral temporoparietal junction hubs where results from Fig. 3 show lowest correlation from the default mode network to the attention control network. The results for significant anticorrelation with the left and right posterior cingulate and left and right medial prefrontal ROIs were virtually identical, and the left posterior cingulate and left medial prefrontal results only are shown in Fig. 4. The most significant anticorrelations were seen between anterior insula hubs of the attention control network and both medial prefrontal and posterior cingulate hubs of the default mode network.
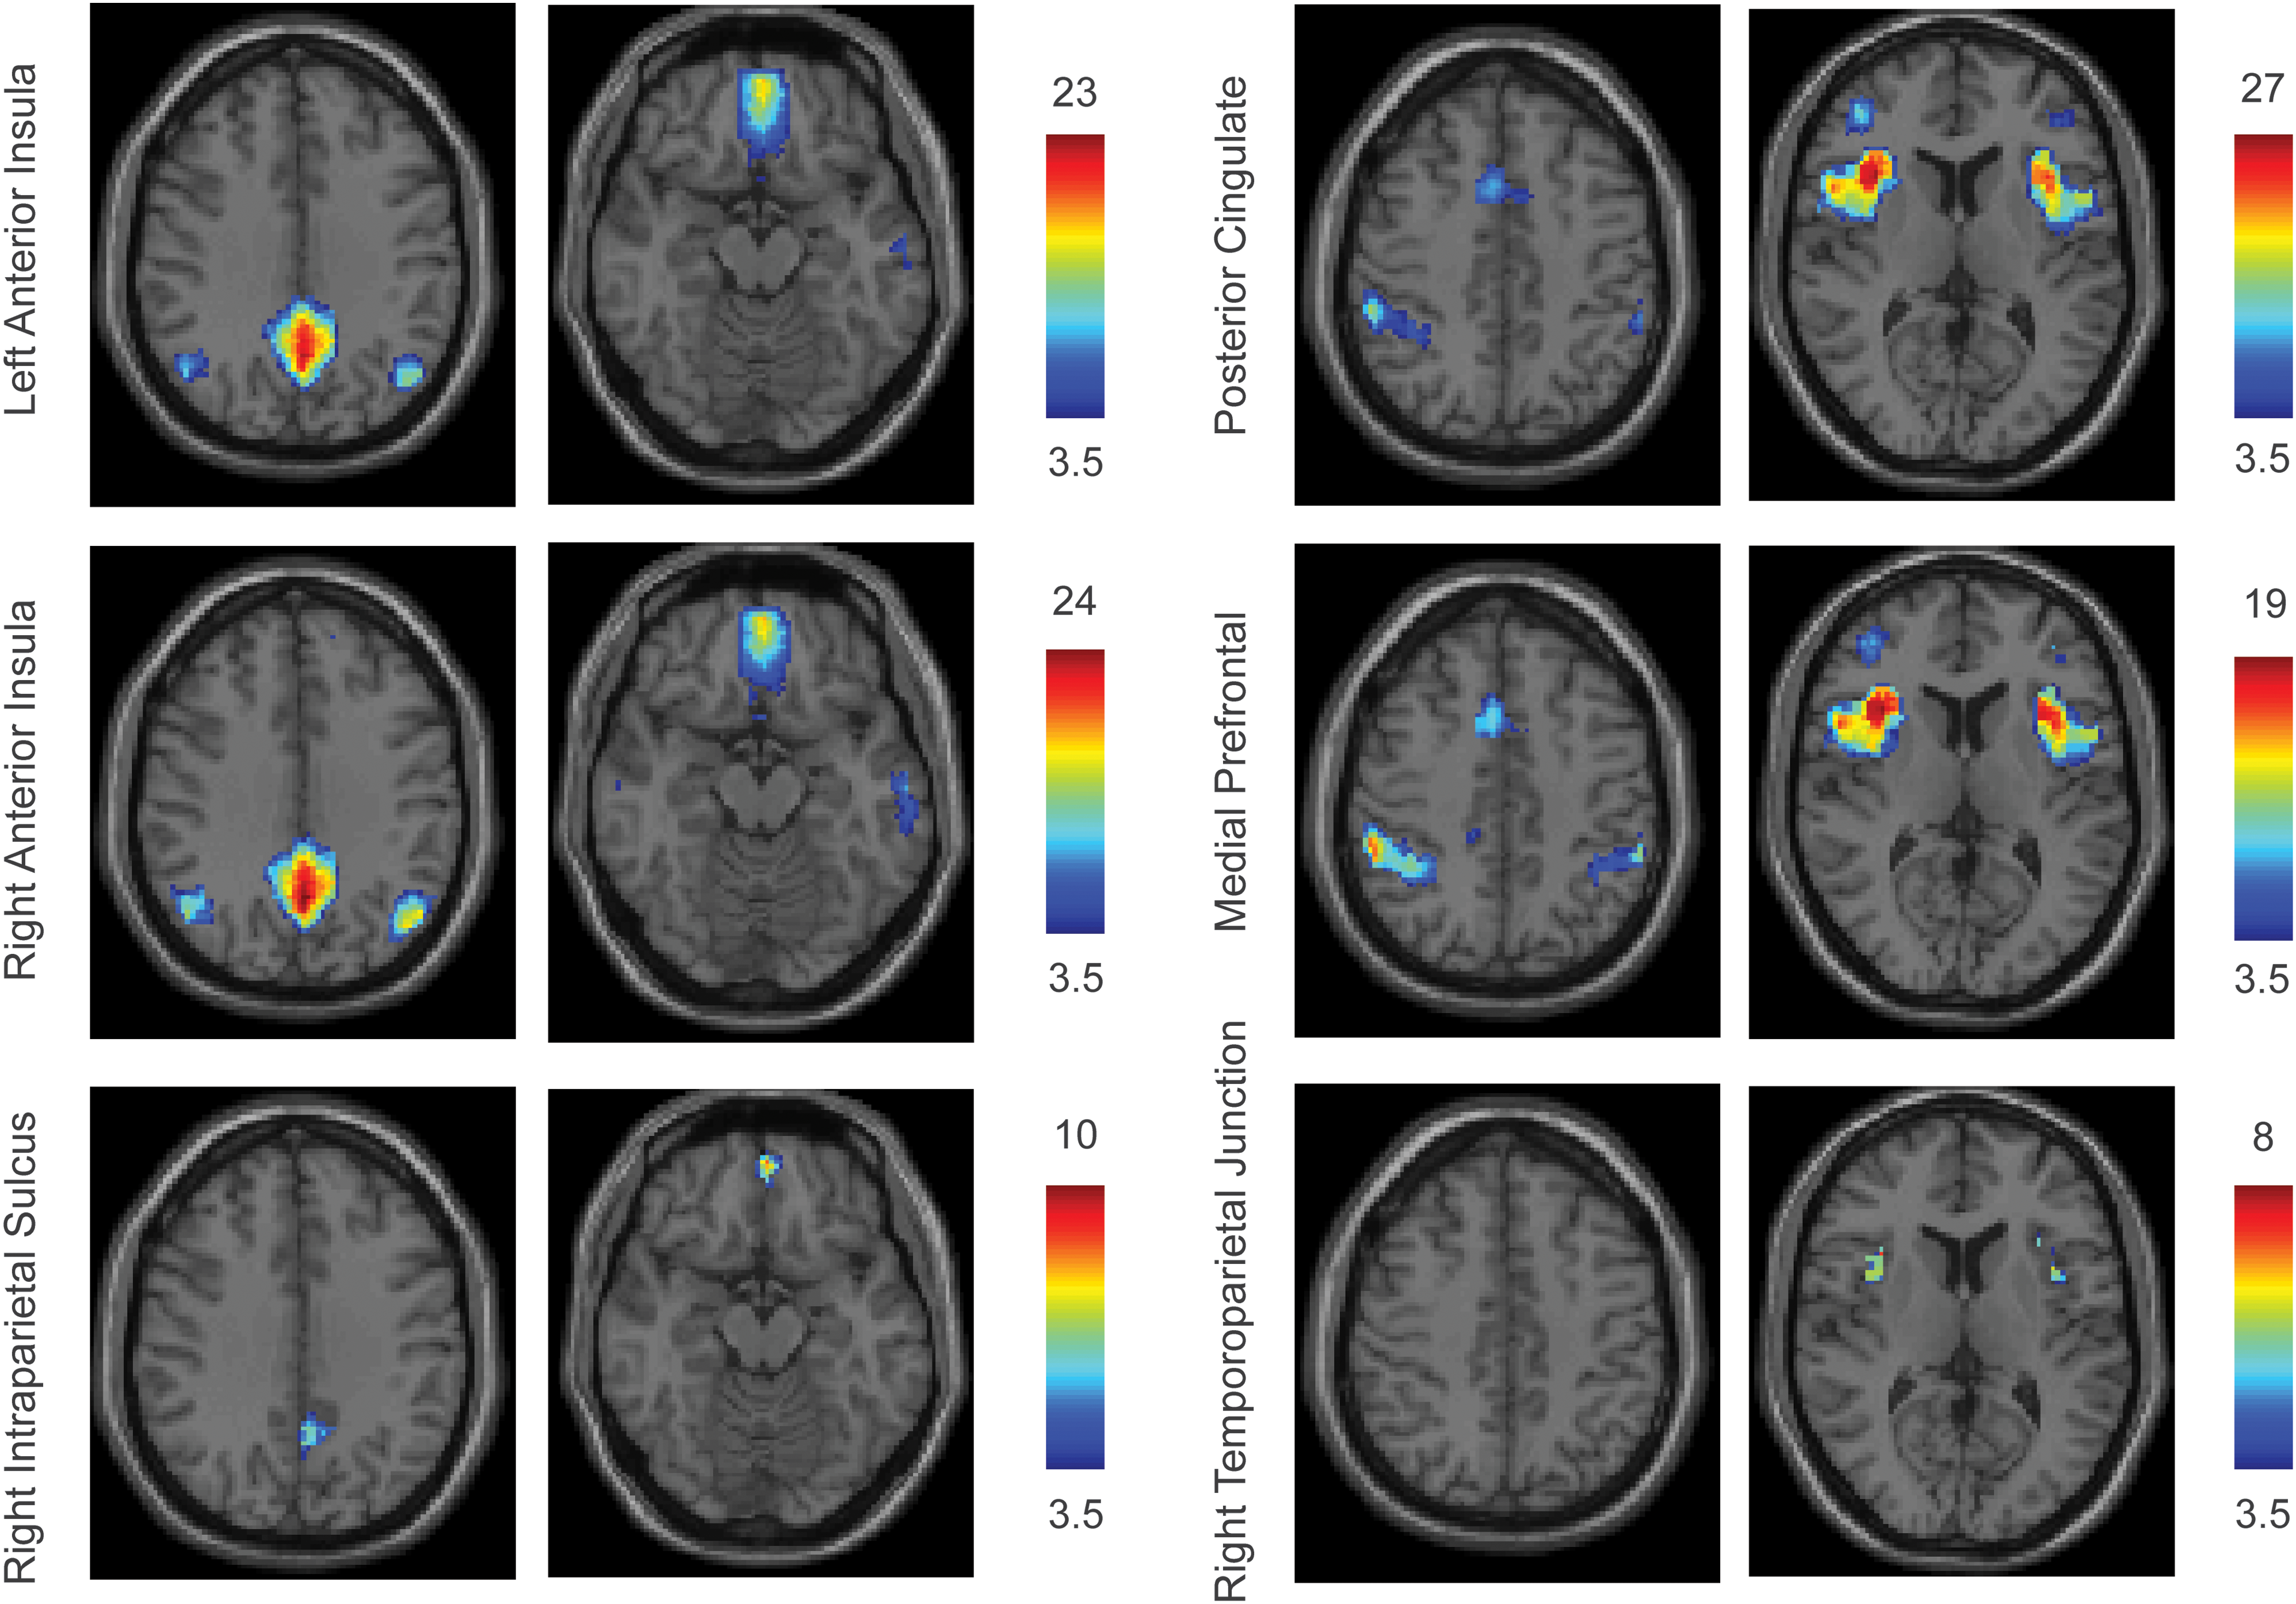
Significant anticorrelations between networks. Twelve ROIs were identified as having lowest correlation with the opposite network among major hubs. Time series from these ROIs were correlated with those from every other ROI in the brain, and significantly anticorrelated regions are shown above, thresholded at acceptable false discovery rate q<0.05. Color scale shows T-score for anticorrelation across subjects. Posterior cingulate and medial prefrontal examples were from the left ROIs, and were almost indistinguishable from results from the right-sided ROIs from the same hubs. Images are in radiologic format, with patient left on image right. Slice locations by column: z=35, z=−15, z=45, z=10.
We evaluated the extent to which connectivity gradients between the default mode and attention control networks change during adolescence and early adulthood. For this purpose, we measured correlation between subject age (which ranged from 7 to 35) and correlation to the 2 networks for each of the 7266 brain regions. Significant changes in correlation with age are reported in Fig. 5 separately for the default mode and attention control networks, showing only results with significant change with age after false discovery rate correction for multiple comparisons at q<0.05.
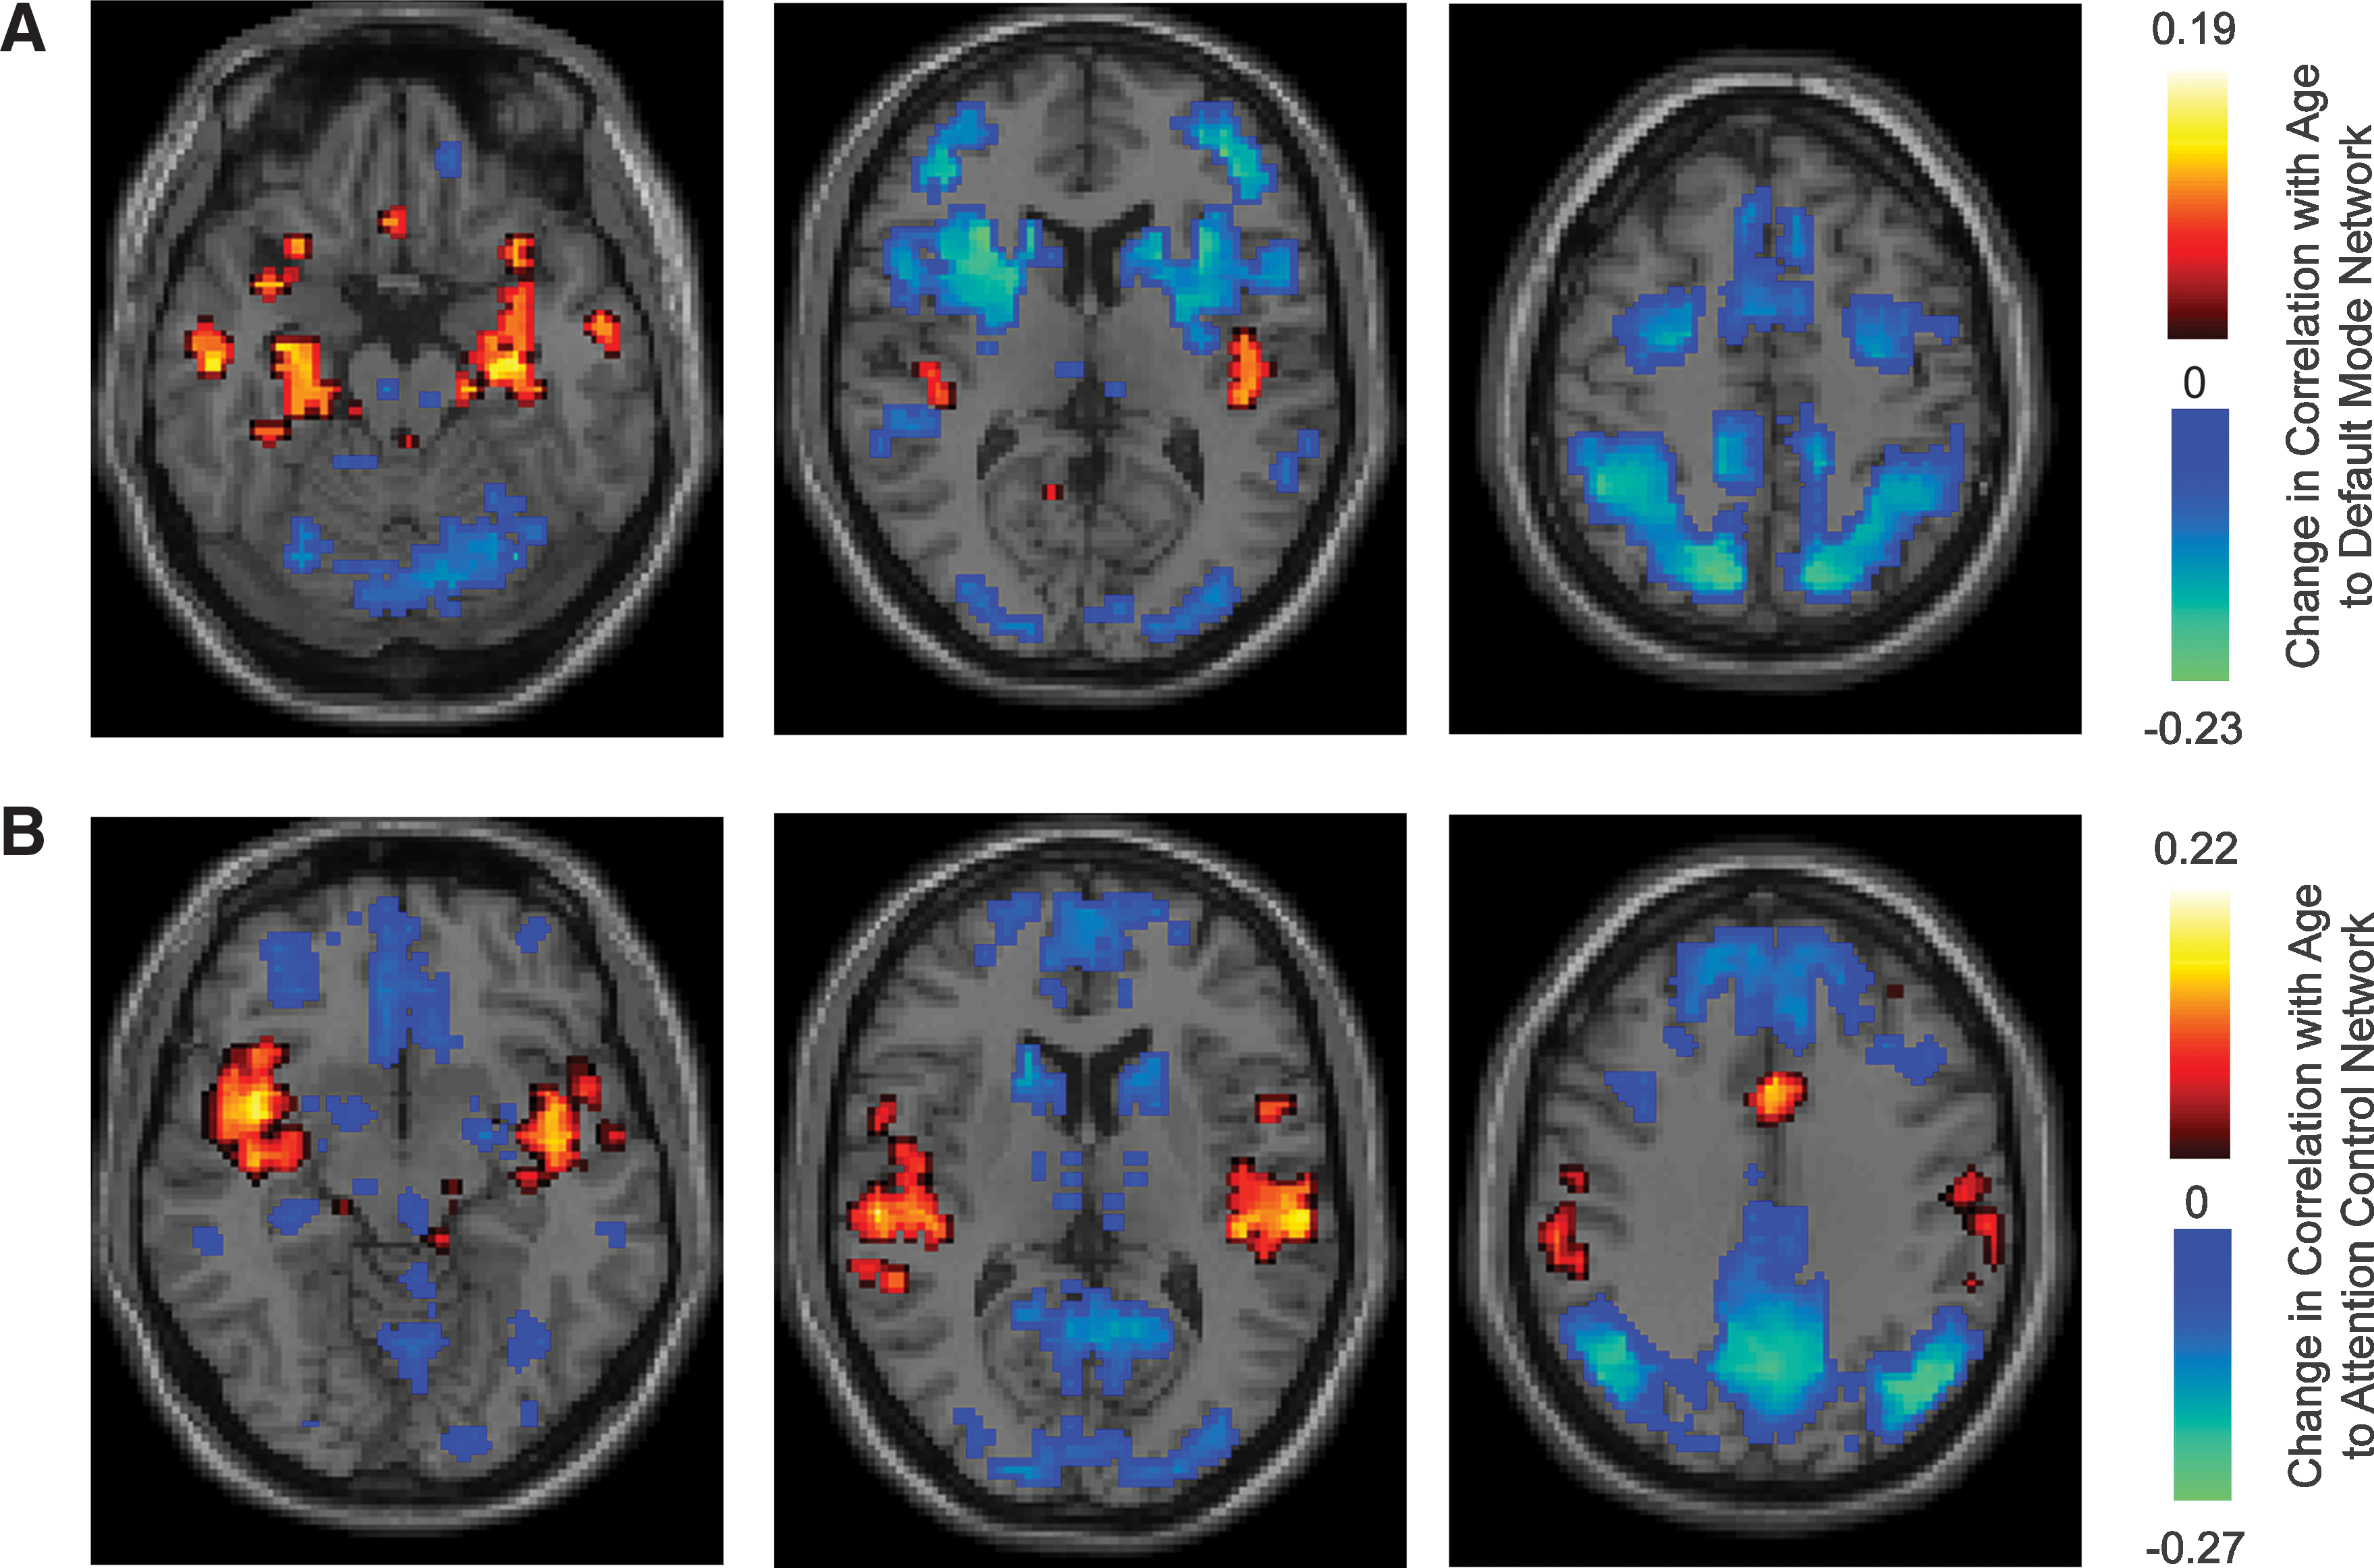
Significant changes in correlation with age.
With increasing age during adolescence and early adulthood, a clear pattern emerges that connectivity decreases between the attention control and default mode networks. The regions becoming significantly less correlated to the default mode network are specific to core hubs of the attention control network. Similarly, default mode regions almost exclusively comprise brain areas that become less correlated (more anticorrelated) to the attention control network during late neurodevelopment. A few regions also show significant increase in connectivity to each network with age. The medial temporal regions, including hippocampi and parahippocampal gyrus, become increasingly correlated with age to the default mode network, and the insula and anterior cingulate become increasingly correlated to the attention control network with age.
This result can be extended by considering both within-network and between-network connectivity across the age range we studied. Figure 6 illustrates changes in within- and between-network connectivity for each of the ROIs in the two networks. For default mode network ROIs, the more strongly connected an ROI was to the network, the more strongly its connectivity to the default mode network increased with age (r=0.57, p=0.8×10−72). This is consistent with a sharpening of the boundaries of the default mode network during development. The most strongly connected regions to the default mode network are located centrally within each hub where greatest anticorrelation is present to the attention control network. These changes with age effectively increase the magnitude of connectivity gradients to that attention control network across default mode network hubs. This can also be seen in Fig. 6B, where areas that are most connected to the default mode network also show the biggest decreases in connectivity to the attention control network with age (r=−0.6, p=0.5×10−81).

Change in within-network and between network correlation with age.
A different pattern emerges with increasing age in the attention control network. ROIs within the frontoparietal hubs of the network that are most connected to the attention control network do not show increased connection to the network with age. Rather, almost all of the frontoparietal ROIs show slight decreases in within-network connectivity with age. Instead, there is increased connectivity between the anterior cingulate and insular hubs of the network with the rest of the network. ROIs that showed the highest correlation to the default mode network showed the greatest decreases in connectivity to the attention control network (r=−0.71, p=0.2×10−96). This change also helps generate the decreasing correlation between the two networks with age illustrated in Fig. 5 and serves to increase connectivity gradients between the two networks.
Discussion
These results reconcile reports of anticorrelated behavior between the default mode and attention control networks (Biswal et al., 2010; Fox et al., 2005; Fransson, 2005) with those where no such relationship was seen (Anderson et al., 2011b; Murphy et al., 2009). Although the mean time series of the networks may not be anticorrelated and most of the voxels in the networks are positively correlated, specific subregions of the networks do show reproducible anticorrelations.
Changes in the default mode and attention control network we report during late neurodevelopment are consistent with other reports in the literature of increasing functional segregation of adjacent regions and integration of distributed hubs into common networks (Fair et al., 2007). Increased within-network connectivity in the default mode network, increased cingulo-insular connectivity to other networks, and decreased frontoparietal connectivity with age have also been reported in a subject sample covering the same age range (Dosenbach et al., 2010).
The architecture suggests a mechanism whereby increased activity of the internally directed default mode network may lead to decreased activity in the attention control network, depending on the spatial distribution of activity within the default mode network. Alternately, activity within the anticorrelated regions of the attention control network may preferentially deactivate the default mode network. This may be desirable in cognitive environments where default mode activity may be more relevant to the individual than external stimuli. In one study in which the default mode network was explicitly activated by a task that required subjects to resolve moral dilemmas, the difference in default mode activation was greatest within an area of the precuneus that corresponds precisely to the location of the anticorrelated subregion we observe (see, for example, Harrison et al., Fig. 3 compared to Fig. 3 in the present study) (Harrison et al., 2008).
It is provocative that precisely one anticorrelated subregion is seen in each hub of both the default mode and attention control networks. There is evidence that different clusters in the default mode network may perform slightly different functions with different connectivity patterns (Uddin et al., 2009). If functional specialization of network regions is correct, then this organization would allow the functional information unique to each region to contribute toward the balance of activity in the default mode and attention control networks. For example, if the spatial distribution of activity within the precuneus favored more anticorrelated subregions over more correlated subregions with the attention control network, this would contribute to a relative deactivation of the attention control network, thus allowing local processing within a single region to affect global attentional states, possibly competing with other regions in the network with different functional information. This would suggest a testable prediction that more salient information in one network should create a greater imbalance between activity in the correlated and anticorrelated subregions within brain regions in which that information is processed, leading to greater focus of cognitive resources within the more relevant brain network. If a single anticorrelated subregion is present in each functional unit within the brain, this information may be exploited to help in brain parcellation or identification of boundaries between functional domains in the brain.
Our measurements are of correlation only, and correlation or anticorrelation does not necessarily imply a direct excitatory or inhibitory relationship between two voxels. With the identification of precise locations for correlated and anticorrelated relationships between the networks, it should be possible to confirm these results by evaluating electrophysiological activity, such as can be obtained from electrocorticography grids or reconstructions in source space of magnetoencephalography data and determine, for example, the extent to which inhibition occurs between areas such as right intraparietal sulcus and right temporoparietal junction during an attentional task (Fransson, 2006). It is possible that these results underestimate the prevalence of anticorrelations between the networks because of residual shared artifactual correlations despite our preprocessing efforts to remove them short of regressing a global signal from the data, which would make interpretation of internetwork connectivity problematic.
A literature is emerging in which functional connectivity is used to infer structural relationships associated with disease, specific tasks, and normal development or aging. Many of these results specifically investigate anticorrelated network relationships quantitatively as exploratory analyses into pathophysiological mechanisms and studies of large-scale brain architecture (Cole et al., 2009; Fox et al., 2005; Honey et al., 2007; Izhikevich and Edelman, 2008; Kelly et al., 2008; Sadaghiani et al., 2009; Seeley et al., 2007a; Wang et al., 2006; Williamson, 2007). As our understanding increases on the effects of preprocessing techniques and spatial heterogeneity on connectivity relationships, this will likely require evolution of existing models to incorporate internetwork connectivity information at finer spatial scales.
Finally, the successful identification of internal architecture within the default mode and attention control networks may serve as a model for characterizing communication between other networks. By applying higher-resolution connectivity mapping to different developmental or neuropathological populations, it may also be possible to characterize differences in between-network connectivity that relate to development or pathology.
Conclusion
Gradients of connectivity between the default mode and attention control networks vary smoothly between correlated and anticorrelated subregions in each major hub of both networks. These connectivity gradients become stronger during adolescence and early adulthood, with sharpening of the boundaries of the default mode network, decreased correlation between the default mode and attention control networks, and greater integration of cingulo-insular regions with frontoparietal attentional areas.
Footnotes
Acknowledgments
The project described was supported by NIH grant numbers K08 MH092697 (J.S.A.) and RO1 DA020269 (D.Y.T.), and by the Ben B. and Iris M. Margolis Foundation (J.S.A.). Investigators and funding sources who contributed to the 1000 Functional Connectome Dataset and ADHD 200 Dataset are available at
Author Disclosure Statement
No competing financial interests exist.