
Abstract
Spontaneously emerging coherent fluctuations have been long observed in electrophysiological and functional magnetic resonance imaging studies. These dynamics have been identified in multiple brain areas in the 1–100 and <0.1 Hz frequency ranges spanning neurophysiological oscillations and blood oxygen level dependent (BOLD) signals, respectively. In this article, we demonstrate that transient neural synchronization between two sites may lead to the emergence of ultra-slow frequency fluctuations in the BOLD signal at another (third) site. Starting with a network model comprised of three neural oscillators, we illustrate the critical role of time delay and coupling strength in generating these slow coherent fluctuations as a function of intermittently occurring neural coherence. When extending the network toward biologically realistic primate connectivity, we find that the BOLD activation patterns arise from neurophysiological coherence, especially among medial cortical areas. This finding demonstrates a network-level mechanism whereby the BOLD activity at a given region is critically influenced by the neuroelectric synchronization patterns of other regions in the network.
Introduction
F
Computational studies (Chawla et al., 1999, 2000; Lumer et al., 1997) have established some of the biophysical mechanisms that link fast neuronal synchronization to slow variations in population firing rates reported by BOLD signals. In brief, there is a circular causality that requires fast discharge rates to suppress effective membrane time constants, which sensitize the neuron to synchronized presynaptic inputs. This is referred to as synchronous gain and, put simply, means one can only observe fast synchronous interactions when mean activity levels are high and vice versa. In this work, we pursue the hypothesis that slow fluctuations in synchronized activity are associated with slow fluctuations in population activity and the associated BOLD response. To induce variations in synchronization, we will here examine neural networks with varying connection complexity and broken coupling symmetry by modeling different conduction delays among neuronal populations. In an effort to understand the underlying mechanism of these oscillations, previous studies used the biologically realistic primate brain connectivity obtained from the CoCoMac database (Deco et al., 2009; Ghosh et al., 2008). These studies suggested that the combination of anatomical structure and time delays creates a space-time structure, where the neural noise enables the brain to explore various functional configurations representing its dynamic repertoire for the emergence of specific functional networks. Deco et al. (2009) have emphasized that systematic variations in propagation velocity and coupling strength with the optimal noise level are highly sensitive to the emergence of spatiotemporal patterns of brain activity at rest, suggesting that slow 0.1 Hz fluctuations of the BOLD signal result from alternations in the level of synchronization between sub-networks.
Here, we extend this work by investigating the mechanisms underlying ultra-slow fluctuations of spatiotemporal patterns in more detail. Honey et al. (2007) suggested that transient synchronization patterns of neural activity are responsible for the coherent fluctuations in the BOLD signal. Ghosh et al. (2008) and Deco et al. (2009) put forward a stochastic mechanism, for which in the former case the role of synchronization is unclear. To shed light on the role of synchronization in Ghosh et al. (2008), we study first a network model comprised of a reduced number of nodes and vary systematically the time delay and coupling weights. Much of the early computational work on synchronization and mean activity levels used realistic populations of neurons. However, in our work, we want to simulate distributed dynamics over the whole brain (see below) and, therefore, needed to use a reduced (canonical) form of neuronal dynamics that could be integrated efficiently for large networks. We, therefore, established that changes in fast synchronization, as measured by neuronal coherence, predict slow fluctuations in activity levels using a simple three-node network. This allows us to perform numerical stability analyses and optimize the parameters so that the resulting dynamics are in a critical regime, characteristic of real neuronal activity. Using coherence, we demonstrate how fast dynamics (range 10 Hz) of neural population activity between each area are related to slow fluctuations (range 0.1 Hz) of the BOLD signal. Having established the basic phenomena and having identified the critical values of the model parameters, we reproduce the simulations in a more realistic setting using empirical estimates of connectivity among many brain regions.
Methods
The network model with three nodes
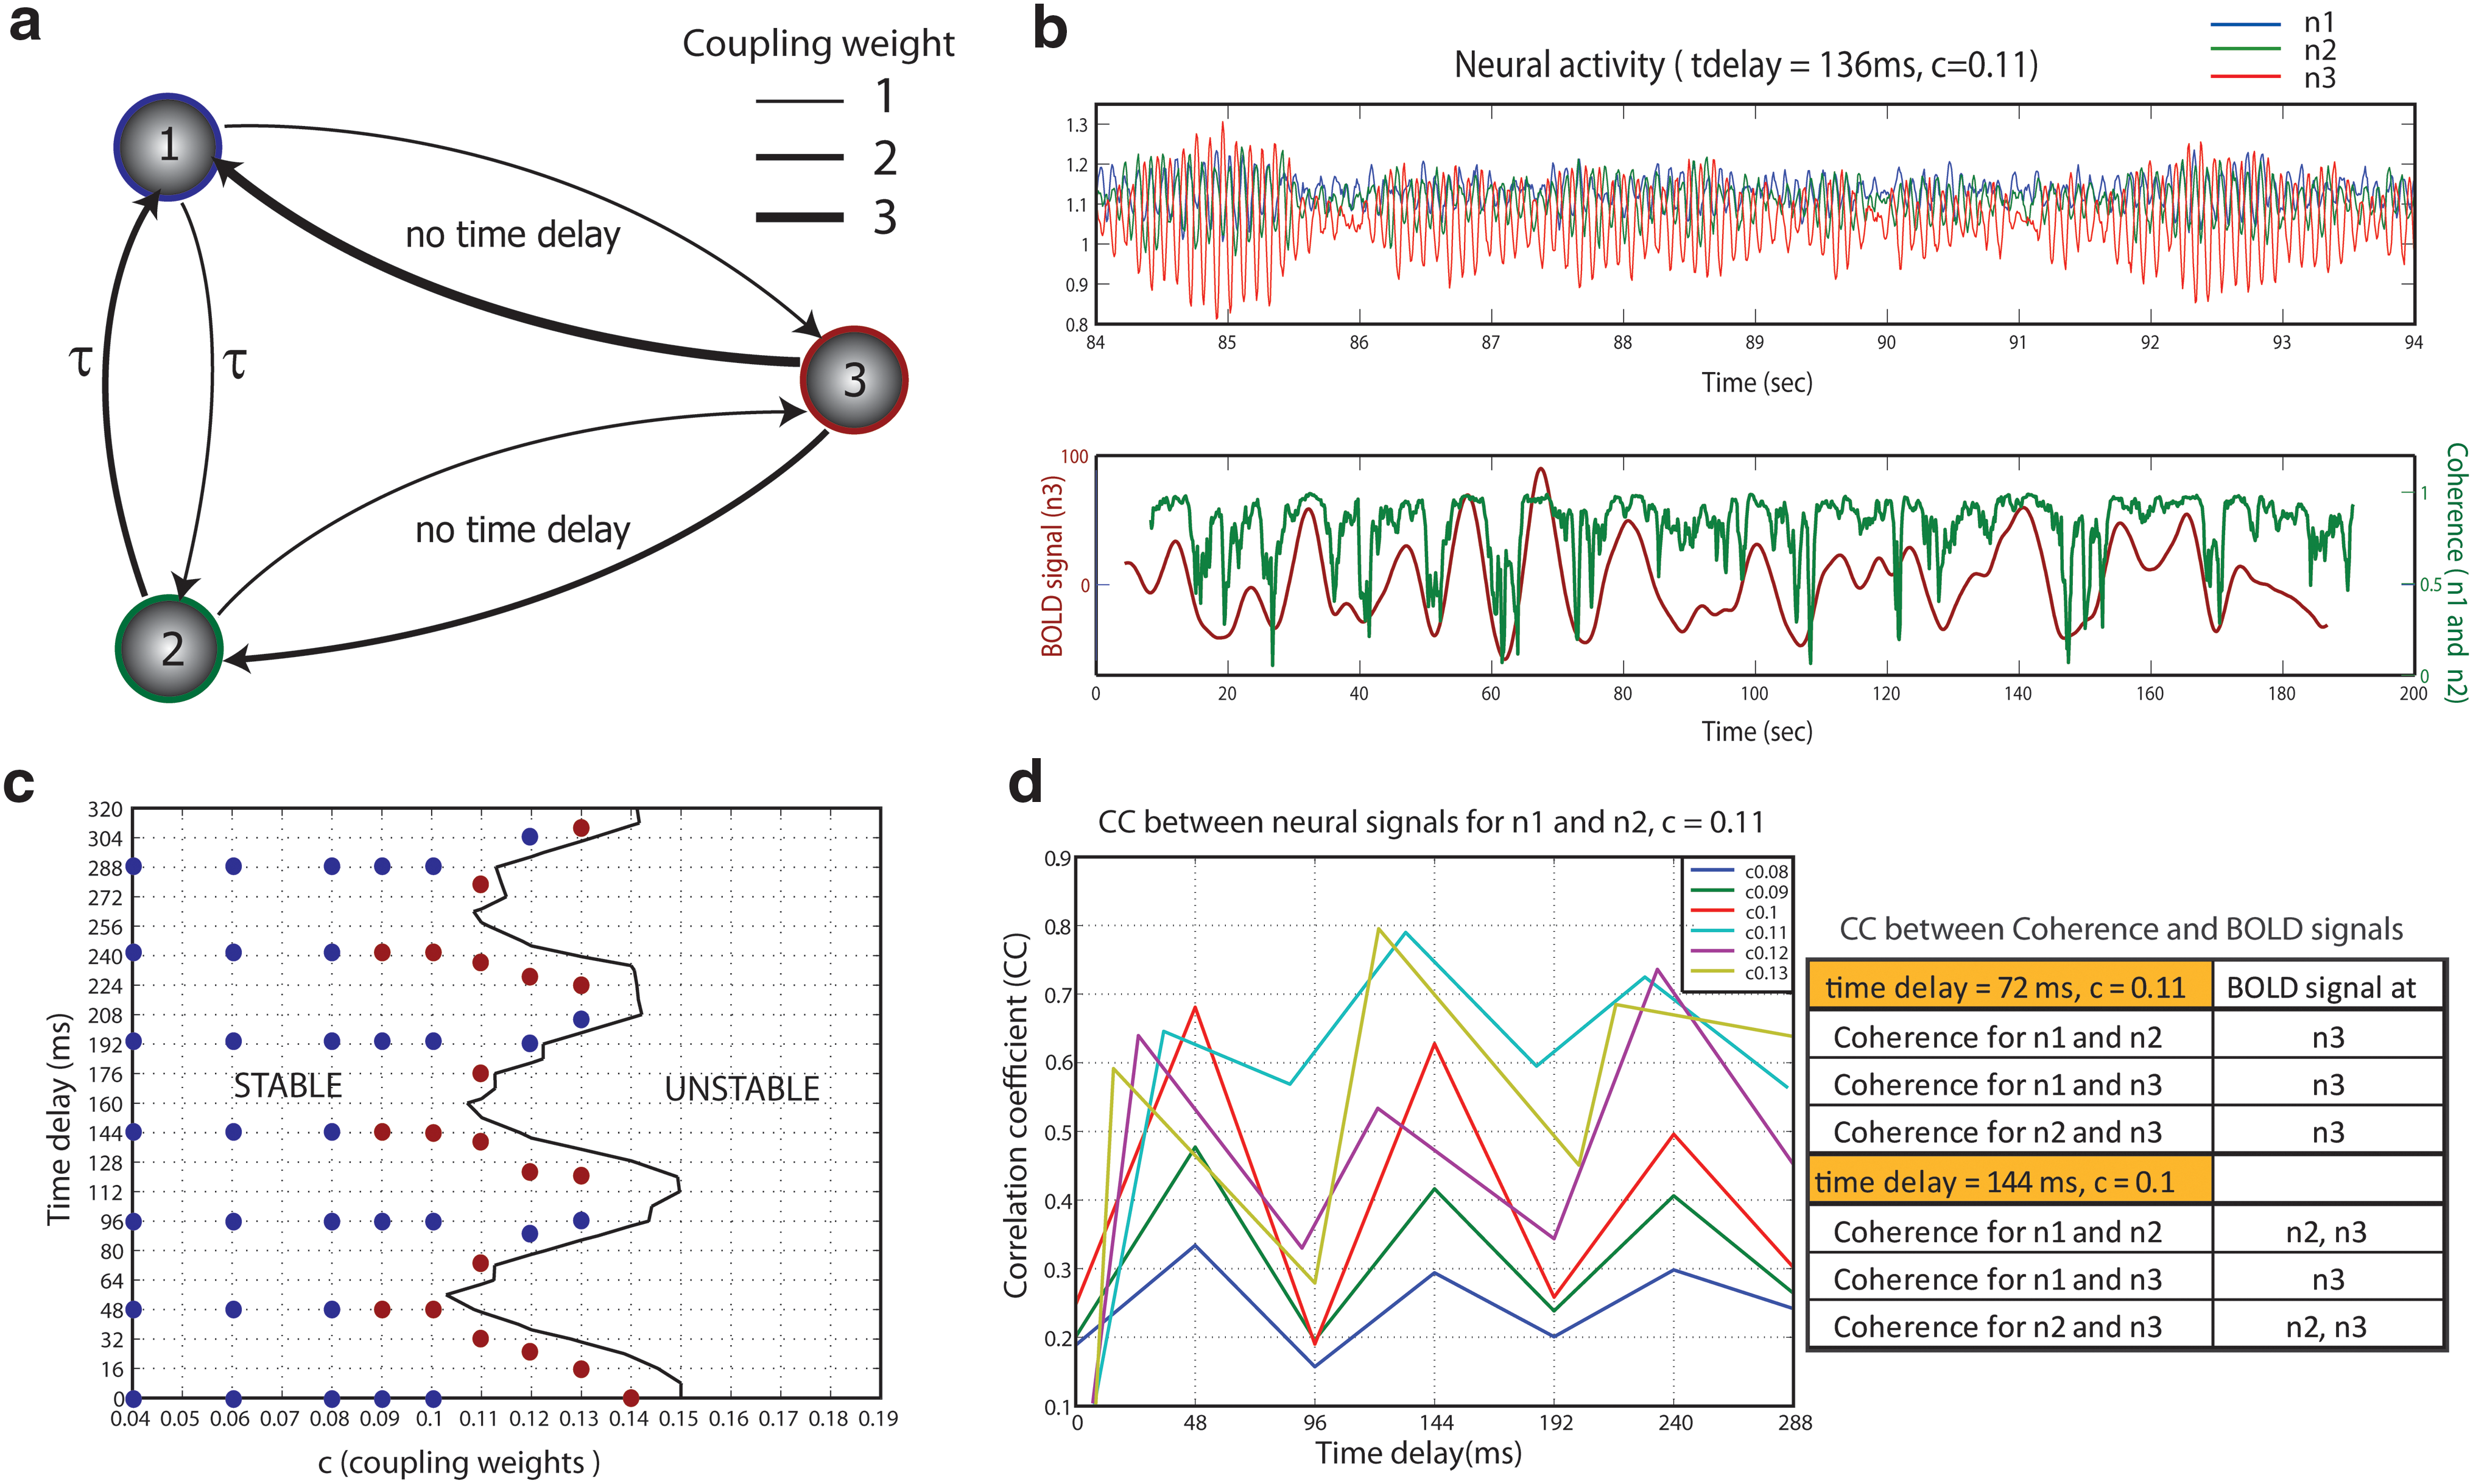
The simplified network model of three nodes had different coupling weights ranging from one to three, which were randomly assigned. The range of values is the same range as used in the biologically realistic connectivity matrix (see below). Each node was reciprocally connected, and only two nodes (one and two) were coupled via time delays as shown in Figure 1(a). The architecture defines a characteristic connection pattern, a so-called motif. The motif is artificial in the sense that the time delays are situated between node three and nodes one and two, this means node three should be close to both nodes one and two, if the time delays are due to signal transmission and separation in physical space. In this case, however, nodes one and two are separated by a large distance, given the conduction delays in the order of 100 millisec, which causes the scenario to be artificial. The motif chosen here, though it has the advantage that the (artificial) phase lag in between the neural signals of nodes one and two, has an instantaneous effect on the BOLD signal in node three, rather than the latter undergoing an additional transmission delay, which would complicate the analysis. Hence, we choose the motif for reasons of clarity in the analysis and do not wish to imply that it plays any functional role in biologically realistic connection matrices.
Network model of three neural oscillators and their stability diagram as a function of time delay and coupling weight c:
Each node represents a neural population described by the following equations governing the intrinsic dynamics of each neural population (Assisi et al., 2005; Jirsa and Stefanescu, 2011; Stefanescu and Jirsa, 2008, 2011):
where x i and y i represent the fast and slow variables of the i-th neural population, respectively, and α=1.05, β=0.2, γ=1.0, τ=1.25. x i corresponds to the mean membrane potential within the population, whereas y i is a more generic state variable absorbing various effects (such as channel opening variability on different temporal scales). The characteristic frequency of the population is around 10 Hz. This choice of model and parameters is motivated by the various efforts on reduced population models (Assisi et al., 2005; Stefanescu and Jirsa, 2008).
The full network model is given by:
where f ij indicates the connectivity between nodes for i, j=1, 2, 3 such that f 12=1, f 21=2, f 13=1, f 31=3, f 32=2 and f 23=1, and Δt is time delay between node one and node two. To quantify the total connectivity strength (the so-called global coupling weight) of the network, the parameter c was introduced that scales all the coupling strength weights. Gaussian noise n x(t) and n y(t) was employed additively and is independent for each node. The coupled delay differential equations with additive noise were solved by the Euler–Maruyama method. The step size for the simulation was 0.001, and we confirmed that no better convergence of solution was achieved using smaller step sizes to ensure numerical convergence.
The network model with biologically realistic connectivity
We generate the neural signals simulated in a large-scale network model based on biologically realistic primate cortical connectivity as previously described by Ghosh et al. (2008).
The connectivity matrix c ij collated from macaque tracing studies comprises 38 nodes with weights ranging from zero to three. It is to be noted that some connections between some areas are not known, which is why we assign random weights to these unknowns within the range of zero and one for the subsequent simulations. The connectivity matrix is analyzed graph-theoretically in Ghosh et al. (2008). The Gaussian noise terms for the i-th node are n xi(t) and n yi(t). The time delays Δtij are computed from the Euclidean distance matrix of the locations of the brain areas i and j (see Ghosh et al. [2008] for details) assuming a propagation velocity of 10 m/sec. The methods of numeric simulations were the same as for the three-node network.
Coherence
To quantify synchronization between neural populations, we used coherence. Coherence was calculated for short overlapping time segments (1.2 sec) to obtain time series that were used for comparison with the BOLD signals. The segments were slid in steps of 0.12 sec at a sampling rate of 8.3 Hz, which makes them comparable with the temporal resolution of the BOLD signal fluctuations. Coherence was computed for each segment and frequency of 10 Hz.
BOLD signal
We calculated the BOLD signals for all nodes using a hemodynamic model that combines the Balloon/Windkessel model for regional cerebral blood flow with a linear dynamical model describing how synaptic activity affects regional cerebral blood flow. Within each region, neural activity causes an increase in a vasodilatory signal inducing blood flow, which, in turn, changes blood volume and deoxyhemoglobin content. The BOLD signal was calculated as the volume-weighted sum of extra- and intra-vascular signals and is, thus, a function of volume and deoxyhemoglobin content (see the Method section in Ghosh et al. [2008] for a detailed description). The local neural activity, which is taken to be the absolute value of the time derivative of the output generated by each node in the network, was down sampled and used as the main model input to estimate the BOLD signal. All parameters regarding blood flow deoxyhemoglobin content and vessel volume in the model are taken from Friston et al. (2000).
Results
The network dynamics of three neural oscillators with one time delay
Using the three-node network model as shown in Figure 1(a), we systematically generated a time series of the neuroelectric and BOLD signals (shown in Fig. 1[b]) as a function of coupling weight c and time delay. For the stability analysis, the effect of noise was neglected, and stability was determined numerically by estimating the growth rate of subsequent amplitudes on a cycle per cycle basis. Figure 1(c) shows the stability diagram separating stable and unstable states by a critical boundary. We simulated neural signals using parameters near the onset of instability with different coupling weights. In the top trace of Figure 1(b), the neural activity for all the nodes generated with a parameter set (time delay=136 ms, and c=0.11 in the stability diagram) are displayed in colors (node one [n1] in blue, node two [n2] in green, and node three [n3] in red). Here, we were interested in neural synchronization, particularly at frequencies around 10 Hz, as a possible mechanism for the origin of ultra-slow fluctuations in the BOLD responses. To measure the level of neural synchrony near 10 Hz, coherence analysis as a function of frequency and time was performed on all the simulated neural signals, and then the coherence time courses of two neural signals at around 10 Hz were extracted. The extracted coherences for pairwise combinations of the three nodes were compared with BOLD signals at each node using a cross-correlation analysis. Coherence of neural signals between n1 and n2 represented in green and the BOLD signal in n3 represented in red are shown in the bottom trace of Figure 1(b). Due to the hemodynamic delay around 3 sec, the BOLD signal in Figure 1(b) is offset. The peaks in the coherence curve are well-matched with the peaks in the BOLD signal. To investigate the dependence of parameters on the existence of such a correlation between coherence and the BOLD signal, we performed the same analysis on all the neural signals and BOLD signals generated with parameters indicated by circles in the stability diagram (Fig. 1[c]) and the correlation threshold between coherences of neural activity and the BOLD signals set at 0.4. We find that large correlations can be found in the parameters near a critical boundary. The red circles indicate those values of parameters for which there was a large correlation between BOLD signals and neuronal coherence, whereas the blue circles report those parameter regimes where this correlation was small. The crucial observation here is that the red circles are universally close to a phase transition between stable and unstable dynamics (i.e., in a critical regime). The largest number of areas captured by this correlation scheme (i.e., the correlation of the BOLD signal at each node with different pairwise coherences) occurred for the parameter sets c=0.11, time delay=136 ms, 176 ms, 232 ms when neural activities at n1 and n2 had time correlation coefficients greater than 0.6, indicating that they had a high degree of phase synchronization. This approximately periodic variation of the stability boundary is characteristic for systems with one-time delay (see for instance Jirsa and Ding, 2004). When two neural nodes had correlation coefficients in the moderate range between 0.4 and 0.6, the number of areas captured by the correlation between coherence and the BOLD signal decreased. When neural activity was correlated with coefficients less than 0.4, no area was found to have a correlation between coherence and BOLD signal. The correlation coefficients calculated for neural activity between n1 and n2 within all the parameter regimes indicated by circles are shown on the left side of Figure 1(d), and the correlations between coherent neural activity and the BOLD signal are shown on the right. All these results lead to the conclusion that ultra-slow fluctuations in BOLD signals are strongly related to the level of synchronization of neural activity with fast dynamics.
Functional connectivity identified in a large-scale network model with 38 areas
To explore the collective network dynamics emerging from low-frequency fluctuations and how they topographically organize into specific networks, we performed the identical analysis of network simulations studied in Ghosh et al. (2008). This network model is comprised of 38 nodes with connection weights ranging from zero to three based on a biologically realistic cortical connectivity matrix of a single hemisphere obtained from the CoCoMac database. The dynamics of each node are governed by the same neural oscillators as in the three node model.
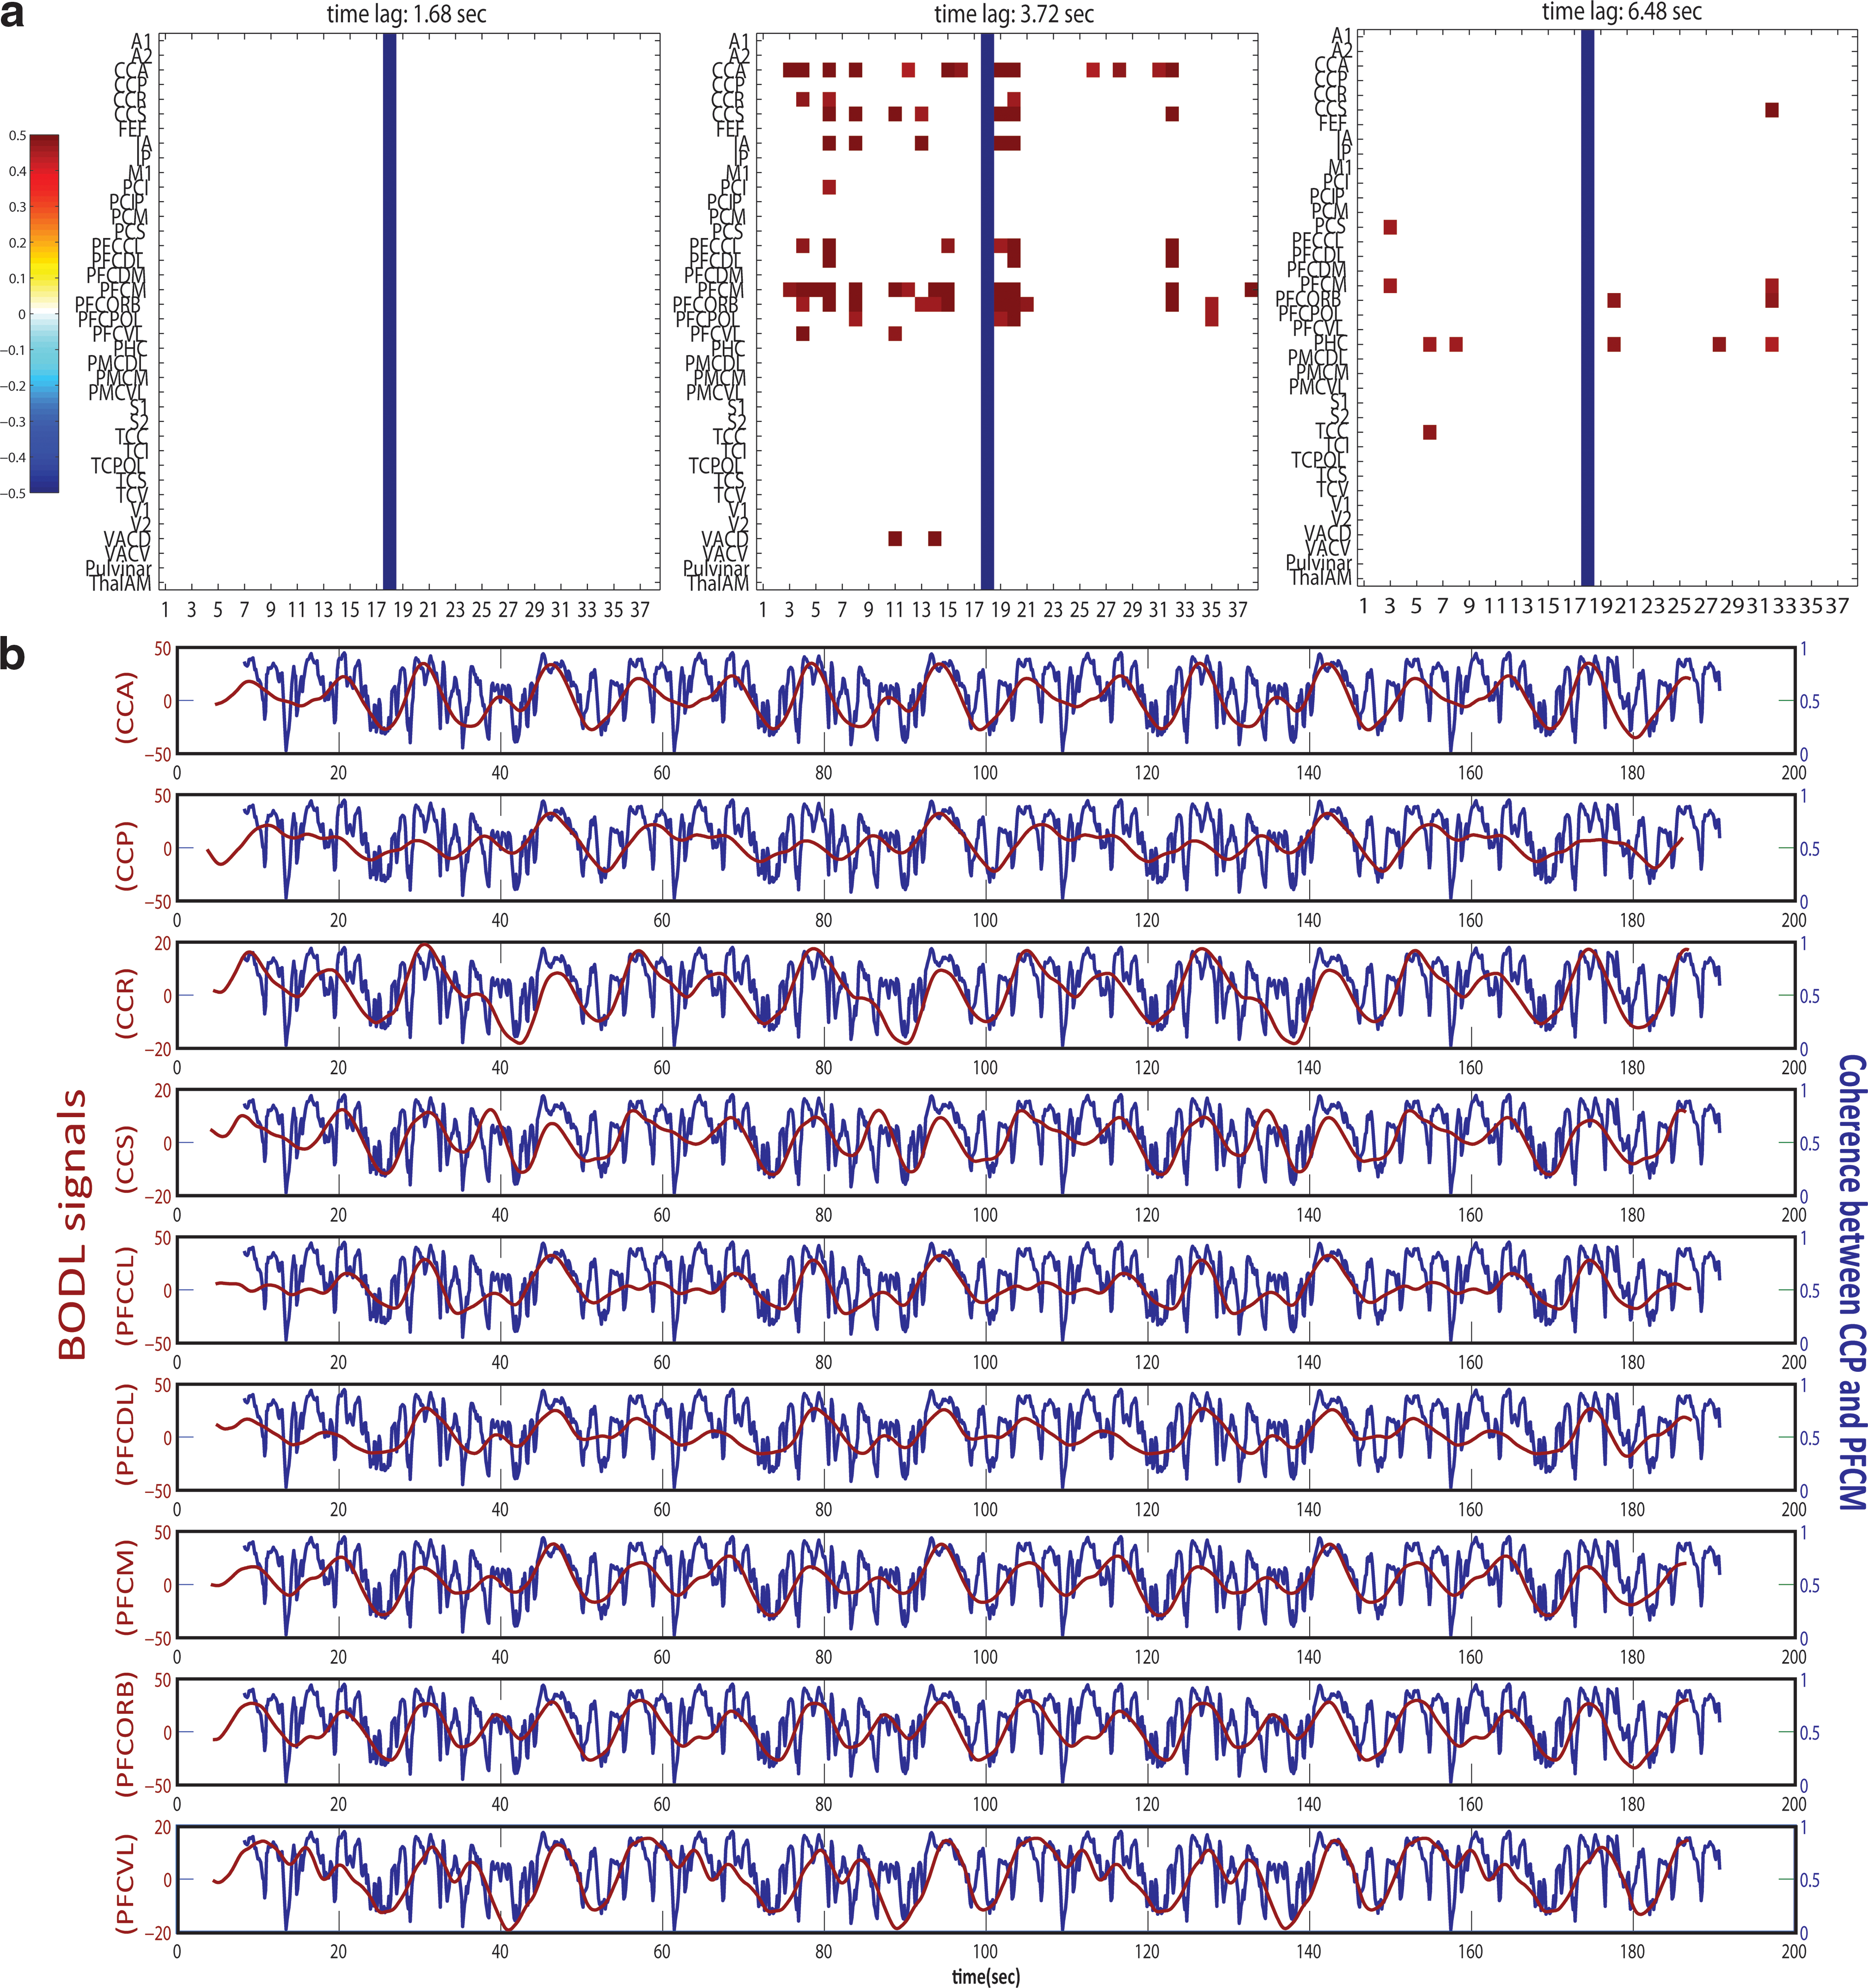
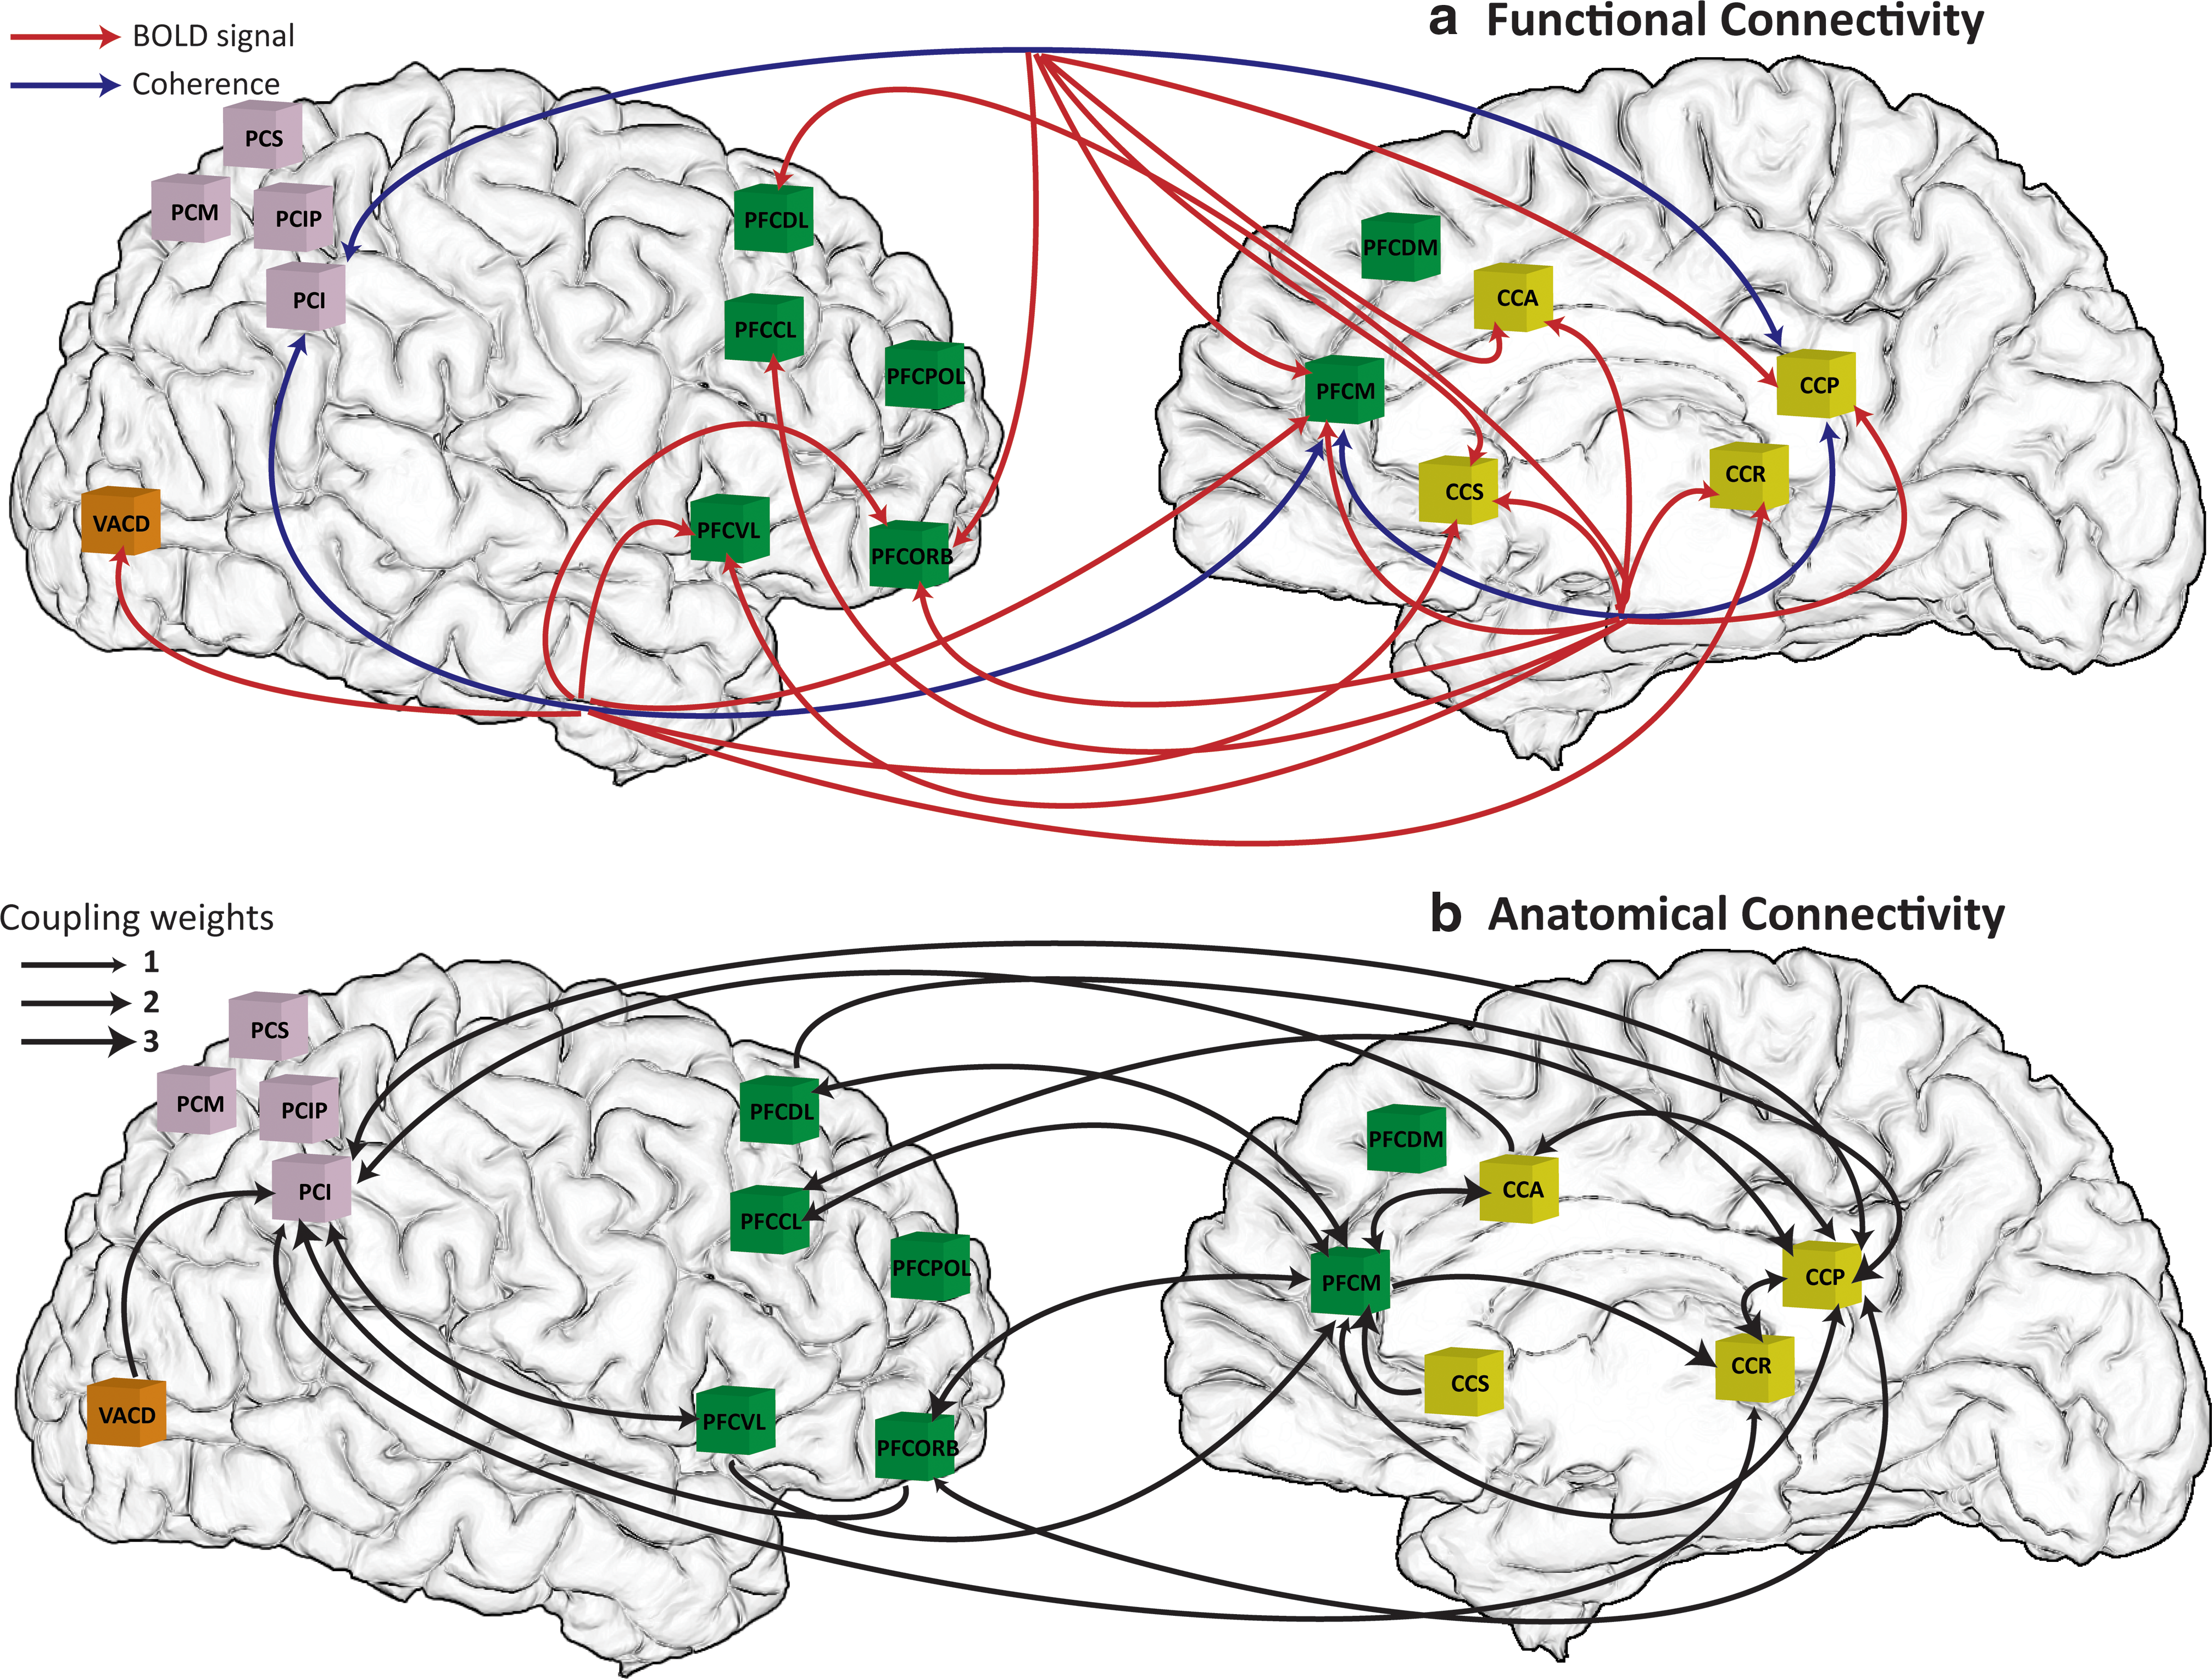
Based on the stability analysis shown in previous work (Ghosh et al., 2008), we chose parameter settings just below the critical boundary that separates stable and unstable states. The transmission speed was chosen as 10 m/sec. The neural signal at each node was simulated for 180 sec, and the measurement of synchronization was performed on all the synthetic neural signals. First, the pairwise coherence between all 38 areas was extracted near 10 Hz. Figure 2(a) shows a cross-correlation matrix at different time lags of pairwise coherence between PFCM and the others that are correlated with the BOLD signal in areas such as cingulate, parietal, and prefrontal cortex indicated by red dots with the blue bar signifying a coherence of neural signals in PFCM (node 18) with itself. Table 1 shows a list of all abbreviations for area names used. The column corresponds to the BOLD signal in each area, and the row represents coherence of neural signals between PFCM and all the others. The correlations between coherences of neural activity and the BOLD signals were thresholded at 0.45. Due to the hemodynamic delay, the highest correlations are found at around 3–4 sec and as the time lag is increased, the areas that show high correlations disappear. In Figure 2(b), coherences and BOLD signals captured from the cross-correlation matrix are displayed, showing that the coherence curve of neural signals between CCP and PFCM is well-matched with BOLD signals in CCA, CCP, CCR, CCS, PFCCL, PFCDL, PFCM, PFCORB, and PFCVL. Various patterns of functional connectivity emerge, some of them known from previous studies of the resting state, as well as the default mode network. To illustrate this along with an example, we identify the regions of interest CCP, PCI, and PFCM and compare their coherence signal of neural activity with the BOLD signals of all other areas. Based on the correlation matrices at different time lags of the regions of interest, we identify the emerging networks after thresholding at 0.45. The captured network is shown in Figure 3(a) where the blue curve represents coherence of neural signals between the two areas indicated by arrows and the red curve points to areas in which the coherence between areas indicated by the blue curve is correlated with the BOLD signals. For example, coherence between PCI and CCP is correlated with the BOLD signal in PFCORB, PFCM, CCS, CCA, and CCP indicated by the red curve, respectively. The time courses of the coherence between PFCM and CCP with the correlated BOLD responses are shown in Figure 2(b). The functional network obtained from our analysis (Fig. 3[a]) resembles the default mode network reported in fMRI studies composed of prefrontal, parietal, and cingulate brain areas (Fox et al., 2005), which survive the threshold analysis. This suggests that the level of synchronization of neural activity can play an important role for the emergence of the topographically organized cortical networks, which are characterized by ultra-slow frequency (0.1 Hz) fluctuations.
Correlation matrix between coherence of neural signals and BOLD signals simulated in a large-scale network model comprised of 38 nodes based on a primate cortical connectivity matrix:
Functional connectivity and anatomical connectivity.
Discussion
In this study, the origin of ultra-slow fluctuations in the BOLD response has been studied in a simplified computational network model, such that three neural oscillators are reciprocally connected with randomly assigned coupling weights ranging from one to three, and only two of them are coupled via time delay. This particular motif has the advantage that its dynamics can be systematically studied as a function of various parameters, including the time delay. Together with the connectivity, the time delay spans the space-time structure of the couplings, which is particularly simple in this motif. Here, we have focused on neural synchronization as a possible mechanism for the origin of ultra-slow frequency fluctuations. The extracted coherences of neural activities near 10 Hz were compared with the BOLD signals. We found that the coherence of two neural populations with high correlations is correlated with the BOLD response. This finding suggests that the level of neural phase synchronizations is strongly related with BOLD fluctuations at 0.1 Hz. Neural activities generated in two areas, namely A and B, oscillate coherently with a given time delay. These areas transmit their coherent signals to a third area C, which generates its own neural activity. This activity in C may or may not be coherent with the signals in area A and B, but its energy (power) and, hence, BOLD signal is a function of the coherence of signals in A and B exhibiting sensitivity to time delays and coupling strengths.
To strengthen these findings, we applied the same analysis to the large-scale network model comprised of 38 nodes studied by Ghosh et al. (2008). In fact, the generalization from the so far discussed simple motif to the complex connectivity in Ghosh et al. (2008) is the space-time structure of the couplings, but not the motif itself. Put differently, our results do not assume that the complex connectivity matrix can be decomposed into sets of the discussed motif. We found that the level of synchronization of two neural populations at 10 Hz was strongly related with slow frequency 0.1 Hz BOLD fluctuations, which are topographically organized into specific cortical networks resembling the default mode network and implicated during resting state activations (Fox et al., 2005). As the threshold of correlation between coherences of neural activity and the BOLD signals is increased, the number of captured areas reduces, but default mode network elements such as cingulate, parietal, and prefrontal cortex mostly survived.
Deco et al. (2009) have shown that fast dynamics in the gamma frequency range (40 Hz) are related to the slow dynamics at the global level (BOLD), suggesting that differences in the level of synchronization of the ensuing two functional clusters in the network are modulated at 0.1 Hz and are the origin of the 0.1 Hz slow oscillations in the BOLD signal. Each cluster, however, does not individually show 0.1 Hz modulations of neural synchronization for each neural population. Indeed, several studies have reported significant correlations between LFP power in the gamma range, and the BOLD signal during simultaneous measurements (Shmuel and Leopold, 2008; Logothetis et al., 2001). Further, Mantini et al. (2007) show correlations between the coherent BOLD signal time course and power fluctuations in various EEG bands such as delta, theta, alpha, beta, and gamma ranges, thus indicating that more than one rhythm is related in the same network.
In this article, we have focused on conduction delays as introducing transient de-synchronization that underpins the slow fluctuation seen in BOLD. The role of conduction delay differences is critical here. In the absence of any symmetry breaking among the connections, it is well known that networks show a high degree of synchronization or coherence (Breakspear, 2002; Tsuda et al., 2004). Further, the phase lag of coherent interactions is usually centered around zero (Chawla et al., 2001). There has been a large body of computational modeling work addressing this issue from the perspective of synchronization manifolds in globally coupled maps. However, we were interested in the transient de-synchronizations that lead to fluctuating BOLD signals. These rest on having critical connectivity or systematic differences among connections. Here, we used conduction delays. However, similar results might also have been obtained by changing the connection strengths in an activity-dependent way. This may be important, because it is possible that the fast coherent fluctuations we have modeled could arise in neighboring neuronal populations within an area. In other words, similar sorts of mechanisms may also be at play, when generating slow BOLD fluctuations, at the within-area level, and the between-area level that we have discussed.
Conclusions
Through both simple and more elaborate neural models, we confirm the intuition that an increase in the BOLD signal can be achieved by increasing the input into the neural site, but show that this can be accomplished in a network through synchronization mechanisms exhibiting sensitivity to coupling strength and time delays. In the large-scale model, we show that this relationship between neuroelectric coherence and BOLD signal changes is most often seen in medial cortical regions, many of which are associated with the default-mode network (Greicius et al., 2003). Recent graph-theory work from human diffusion spectrum data has suggested that these regions may represent hubs having the anatomical capacity to interact with many other regions (Hagmann et al., 2008). Our model suggests one functional consequence of this anatomical capacity showing the widespread impact of coherence among the medial regions on the activity of other brain regions. Although the specific implications of this behavior require further simulation work and empirical comparison, it is quite clear from the present work, and preceding simulations (Deco et al., 2011), that the constant flow and ebb of network activity is a vital facet that needs to be considered when BOLD activity changes are observed in a given region.
Footnotes
Acknowledgment
We are grateful for funding received by the James S. McDonnell Foundation, Grant Brain NRG (JSMF22002082).
Author Disclosure Statement
No competing financial interests exist.