
Abstract
A multivariate source-based morphometry (SBM) method for processing fractional anisotropy (FA) data is presented. SBM utilizes independent component analysis (ICA) and decomposes an FA image into spatial maps and loading coefficients. The loading coefficients represent the relative degree each component contributes to a given subject's FA map. We hypothesized that SBM analysis on a large dataset of age- and gender-matched patients with schizophrenia (n=65, ages 18–60 years) and healthy controls (n=102, ages 18–60 years) would show a similar, specific pattern of frontal and temporal group differences as a recent voxel-based morphometry meta-analysis. Two approaches using (a) the loading coefficients obtained from the ICA analysis and, alternatively, (b) the weighted mean FA values obtained from the ICA-defined clusters were compared for group analysis. Six of the 10 selected components had significant group differences with the loading coefficients. Each component was composed of several white matter tracts distributed throughout the brain. Nine of the 10 nonartifactual components had significant group differences with the weighted mean FA values. The weighted mean FA values for each ICA spatial map generally had larger effects sizes relative to the loading coefficients. These networks were consistent with regions identified in previous voxel-based studies of schizophrenia. SBM identified several components that covered disjoint brain regions and multiple white matter tracts that would not have been possible with previous voxel-based univariate techniques. Overall, these results suggest the importance of utilizing multivariate approaches in morphometric studies in schizophrenia.
Introduction
S
Previous studies primarily used univariate approaches such as region of interest (ROI), voxel-based morphometry (VBM), and tract-based spatial statistics (TBSS) to locate group differences in DTI data. ROI analysis is performed by separating the brain into specific regions and then testing for group differences in mean FA. For ROI analysis, the regions are often selected based on atlases using prior knowledge. The placement of the ROI is subjective and can be influenced by anatomical differences between groups (Kanaan et al., 2005). VBM is another univariate approach (Ashburner and Friston, 2000). VBM analyzes white matter throughout the brain and is useful in examining widely distributed abnormalities as seen in schizophrenia. VBM is automated and utilizes a voxel-based approach to show group differences. VBM requires normalization algorithms that may create false-positive errors at the high-contrast edges of fiber tracts (Jones et al., 2005; Kanaan et al., 2005). Another approach used to compare groups using FA is TBSS. This approach uses a nonlinear registration and then a projection onto an alignment-invariant tract representation (Smith et al., 2006). Although TBSS does not utilize the Gaussian smoothing used by other methods such as VBM, it is still a voxel-based method for group analysis.
In a recent work, Wahl et al. (2010) examined correlations of DTI scalar measures (such as FA, mean diffusivity, radial diffusivity [RD], and axial diffusivity [AD]) across healthy subjects for white matter tracts obtained from tractography. They studied cross-correlations across different tracts. This approach would identify interactions between tracts selected a priori based on theoretical considerations. On the other hand, our method is data-driven and the goal is to identify regions and tracts with FA (or other DTI measures) correlated across subjects.
Source-based morphometry (SBM) is an alternative method for group analysis based on independent component analysis (ICA) (Xu et al., 2009a). SBM has been previously applied to assess gray matter differences between patients with schizophrenia and controls (Xu et al., 2009b). However, it has not been applied for group analyses of DTI data. In contrast to ROI analysis and VBM, SBM is a data-driven, multivariate approach that does not require a priori selection of regions to analyze. ICA decomposes FA maps into maximally independent FA spatial maps (components), each of which shows distinct covariation among subjects (loading coefficients). It also has the advantage of capturing noise in some of the spatial components and hence provides a spatial filtering that effectively de-noises the results (Xu et al., 2009a). In this article, we discuss two alternative methods for group analysis based on ICA components. The first approach uses loading coefficients, which represent the relative degree each ICA component contributes to a given subject's FA map and can be used for group analysis. The loading coefficients are related to FA but are not in the range 0 to 1. Second, we use the ICA maps to define clusters. The weighted mean of the FA values for these clusters can then be used for group analysis. The weighted mean is easier to interpret and has the same range as FA. Comparisons of the two approaches revealed that although both were useful to detect group differences, the weighted mean FA values resulted in larger effect sizes for most components.
The aim of this study was to examine a large dataset derived from patients with schizophrenia and healthy comparison subjects to identify group differences in FA components using ICA. A recent meta-analysis of VBM studies found two regions of FA reduction in the frontal white matter region and the temporal white matter region supporting a “macrocircuit theory” of schizophrenia (Volkow et al., 1988; Ellison-Wright and Bullmore, 2009). This theory posits that specific white matter tracts are affected in schizophrenia (Volkow et al., 1988) as opposed to global, uniform white matter abnormalities (Davis et al., 2003). We predicted that our SBM analyses would show a similar, specific pattern of disruption of white matter tracts in frontal and temporal regions.
Methods
Subjects
We combined data from several different imaging studies based at Yale University and Hartford Hospital, which utilized the same scanner to create a large dataset of schizophrenia patients (n=65, ages 18–60 years) and healthy controls (n=125, ages 18–60 years). These groups did not differ with age (t 165=1.46, p=0.15), gender (χ 2=1.33, p=0.25), or premorbid intelligence (t 57=−0.91, p=0.37) as measured by the North American Adult Reading Test (Blair and Spreen, 1989). Demographic characteristics of the patients and controls are presented in Table 1. Yale University and Hartford Hospital Institutional Review Boards approved the studies and data sharing agreements. All subjects provided written informed consent. Structural clinical interview for DSM-IV (SCID) (Williams et al., 1992) and review of case files confirmed the diagnosis of schizophrenia in the patient group. The SCID-Non Patient version confirmed no DSM-IV Axis I or Axis II psychopathology in the healthy controls. Healthy controls also had no first-degree relatives with a history of psychosis. All subjects were screened to ensure safety in the magnetic resonance imaging (MRI) environment.
Estimated premorbid IQ was measured by the North American Adult Reading Test.
Image acquisition
Images were acquired using a 3T Siemens Allegra scanner at the Institute of Living in Hartford Connecticut, with a single-channel transmit and receive head coil. DTI images were acquired via a single-shot spin-echo echo planar imaging with a twice-refocused balanced echo sequence to reduce eddy current distortions. The parameters of the DTI sequence were TR/TE=5900/83 ms, FOV=220 mm, acquisition matrix=128×96, reconstruction matrix=128×128, 8 averages, b=0, and 1000 sec/mm2 along 12 noncollinear directions, and 45 contiguous axial slices with 3 mm slice thickness.
DTI analysis
DTI preprocessing included three steps:
1. Data quality check. The DTI data quality was checked for (a) signal dropout due to subject motion, producing striated artifacts on images; (b) excessive background noise in the phase encoding direction due to external radiofrequency leakage in the MRI scan room or to subject motion; and (c) large amounts of motion in the absence of signal dropout. If for a specific gradient direction any slice was found to have a problem, we decided to exclude the whole volume rather than some specific slices. The motion artifacts were comparable for the two subject groups and <9% of the gradient directions were dropped for each group.
2. Motion and eddy current correction. After pruning of the above data, we had derived one 4D DTI volume and a table of corresponding b-values and gradient direction vectors. Next, we registered all the images to a b=0 sec/mm2 image. Twelve degrees of freedom, affine transformation with mutual information cost function was used for image registration.
3. Adjusting the diffusion gradient direction. Two corrections were applied to the diffusion gradients. The nominal diffusion gradient directions were prescribed in the magnet axis frame. We rotated them to correspond to the image slice orientation. No correction was required if the imaging slice was pure axial. A second correction accounted for any image rotation during the previous motion and eddy current correction step. The rotation part of the transformation previously found was extracted, and each gradient direction vector was accordingly corrected. All the image registration and transformations were done with the FLIRT (FMRIB's Linear Image Registration Tool) program (FMRIB Software Library [FSL];
SBM analysis
The FA maps were smoothed using SPM5 and an 8×8×8 smoothing kernel (Jones et al., 2005). Following this, we used Group ICA fMRI Toolbox (GIFT) software (
Interpretation of the loading coefficients of the spatial ICA-DTI maps requires some care in comparison to the FA values corresponding to those same regions. The sign of the ICA loading coefficients is arbitrary in the sense that the sign of both the loading coefficients and the spatial maps can be simultaneously inverted and they are still consistent with respect to ICA decomposition. This is because the sum of the product of all ICA maps with the loading coefficients for a specific subject approximates the FA map for that subject. The GIFT program arranges the sign of ICA maps so that the maximum value is also the absolute maximum value of the ICA map. This does not guarantee that the relationship of the loading coefficients to the FA values is monotonically increasing. In addition, during the ICA analysis the mean FA map across all subjects is removed. Thus, the loading parameter values by themselves do not range from 0 to 1, as do FA values.
Converting ICA maps to ROI
To study group difference directly in terms of FA values, we obtained an ROI corresponding to each ICA map. Each ICA spatial map is defined across the whole brain and its value at each voxel determines the relative weighting across the brain. The ROI corresponding to the ICA spatial map is defined as the voxel values, which contribute the most to the ICA weighting. In ICA analysis, the spatial mean of the map is removed and its scaling is arbitrary. We convert the ICA map to a Z-score map by normalizing to its standard deviation. The standard deviation of all the voxels in the ICA map was computed using the usual equation.
We define each ROI to have the same fraction α of the total number of voxels in the ICA map. Let Nα
be this total number of voxels in each ROI for all ICA maps. In this study, we choose α=0.01. Then, for each ICA component the ROI is defined by
where r is an image voxel and Zn is chosen so that the number of voxels in the ROI is Nα . Thus, ROIs corresponding to each ICA map will have the same number of voxels but the threshold Zn will be slightly different for each component.
The above definition of the ROI does not depend on how the ICA map is scaled. It is also equivalent to calculating the histogram of the Z-score map fz (z) and defining Zn by the probability that |fZ (z)| > Zn is α. The distribution fz (z) is not Gaussian and it is slightly different from one ICA map to another. Although the ROI cannot be defined by one threshold Zn for all ICA maps, in this study Zn =4.0 gave similar ROIs to α=0.01. A larger value of α implies a larger region.
ICA maps are defined over the whole image and they extend over CSF and grey matter. To get a comparison of group differences based on white matter FA values, we restricted the cluster to regions where FA is >0.2 over the mean FA map across the subjects. The weighted mean FA for the ICA map was calculated based on the white matter within the previously calculated ROI. The FA value is weighted by the ICA voxel values across the cluster. The exact formula is defined in Equations 2 and 3. We define the white matter to be regions where the mean subject FA map, FA(r)>0.2. Then, the white matter ROI for an ICA map is defined by
The weighted mean FA for an ICA map is calculated as
We calculated the correlation between the loading coefficients and the weighted mean FA value for each map. If the correlation is negative, then we invert the sign of the ICA map and the sign of the loading coefficients. This ensures that if we find the loading coefficients are higher in healthy controls, then the corresponding FA values will also tend to be higher. In the Results section, we show scatter plots of the loading coefficients and the weighted mean FA values after this correction.
For further group difference analysis, we selected those components that displayed significant contribution from white matter regions. A component map was retained for further group analysis if the number of voxels in ROIwm is >300. These voxels can belong to disjoint clusters from the same ICA map.
Statistical analysis
Group differences in demographics were assessed with either a t-test or chi-squared test. We tested for differences in the ICA loading parameters between patients and controls with a two-sample t-test of the selected components. The loading coefficients represent the relative degree each of the components contributes to a given subject's FA map. We then assessed group differences in the weighted mean FA values calculated from clusters defined by the ICA spatial maps with a two-sample t-test. Finally, we performed an analysis of covariance for the components that had significant group differences to assess the impact of gender, age, and group interactions.
Results
Component selection
Twenty independent components and their corresponding subject loading parameters were computed from the FA data using the GIFT software package, with the relationship between the components and the loading coefficients described in Figure 1 (Xu et al., 2009a). Ten components, from this initial set of 20, were selected based on criteria outlined in the SBM analysis section. Figure 2 shows the selected components and the corresponding MNI coordinates. Comparing these components to the Johns Hopkins atlas, the contribution of white matter tracts was calculated for each component and tabulated in Table 2. This was done to facilitate comparison of our study with other studies in the literature, which describes abnormal white matter regions associated with major tracts.
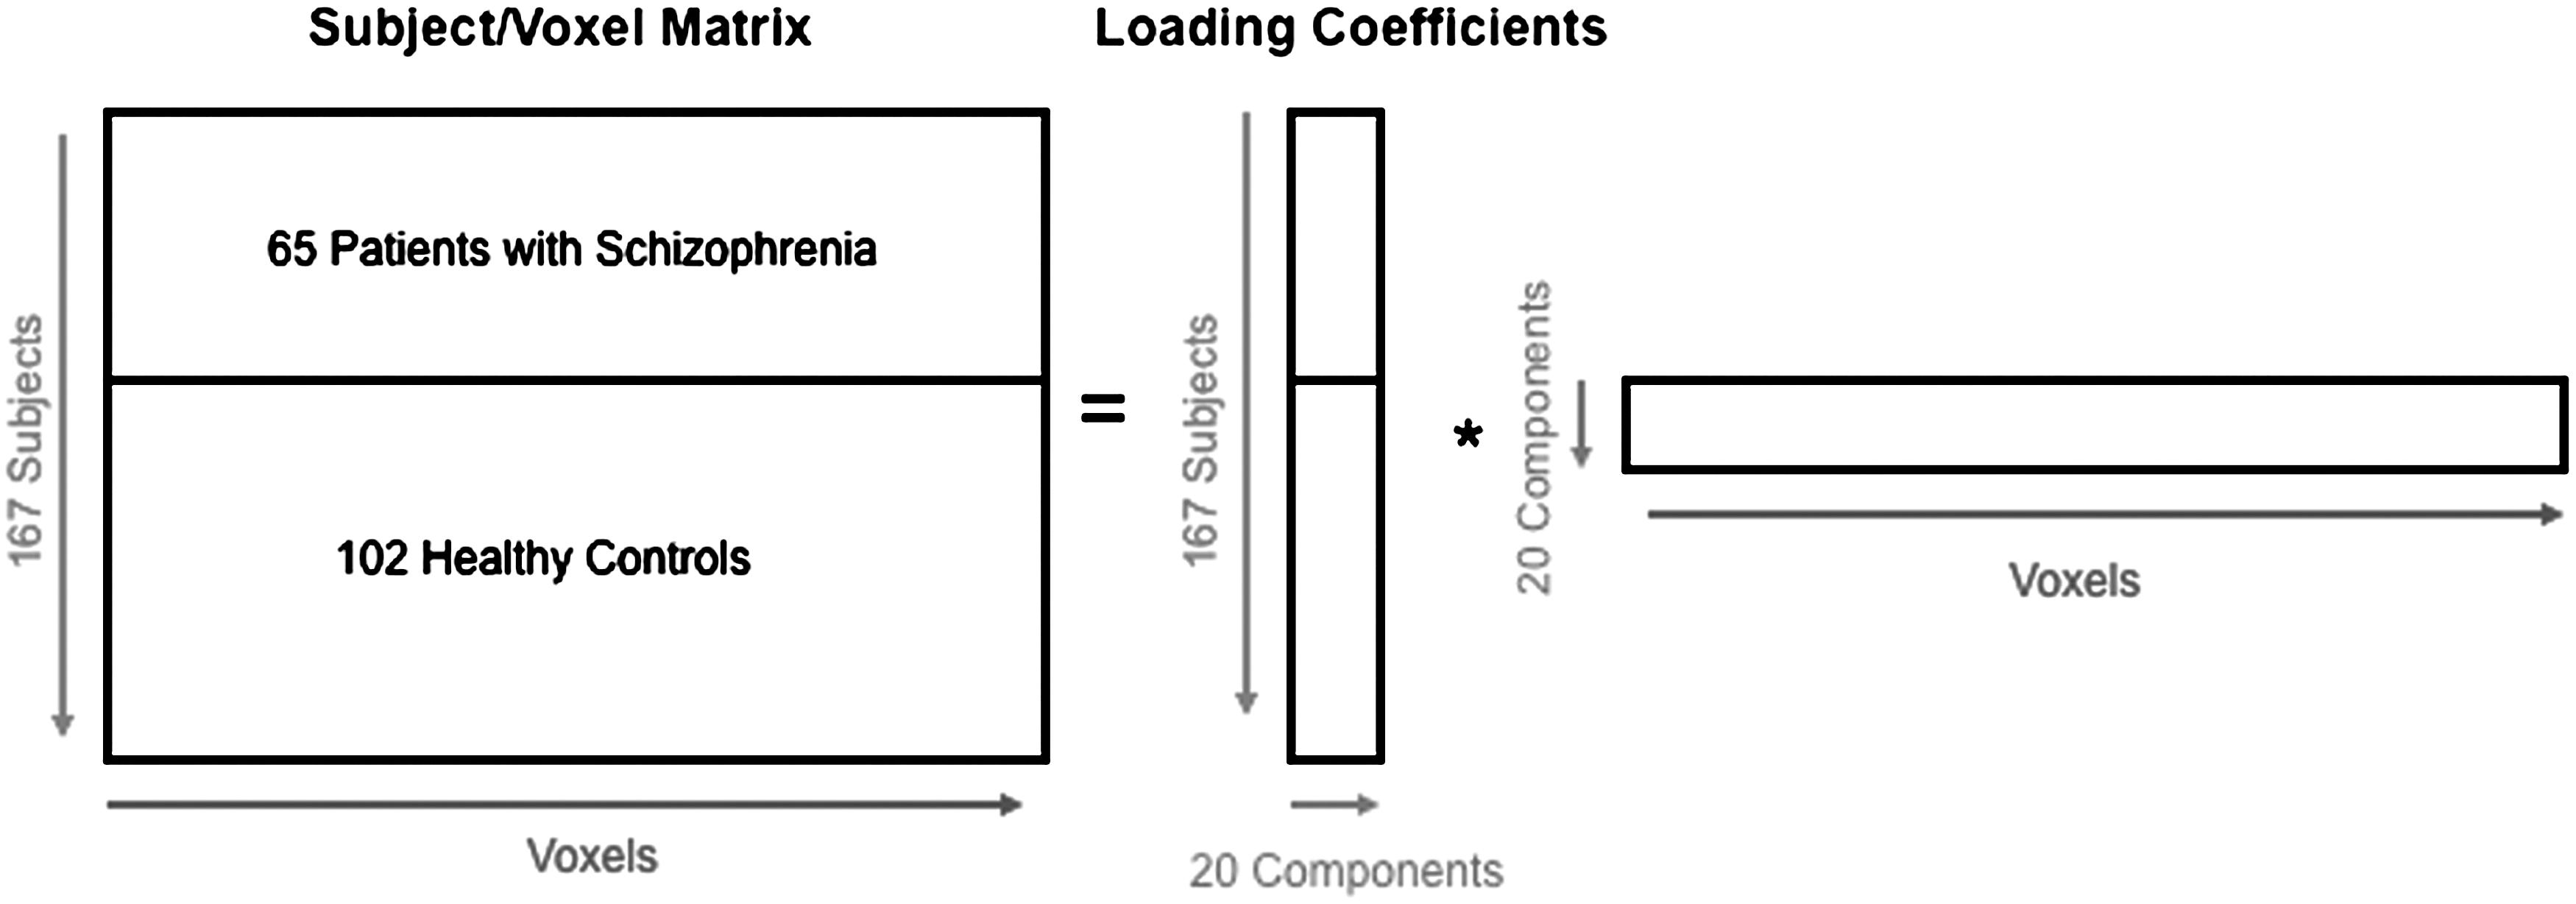
FA voxels are concatenated for each subject. ICA decomposes the subject/voxel matrix into loading coefficients (mixing matrix) and a source matrix (spatial maps). The loading coefficients are unique for each subject and permit group comparisons. ICA, independent component analysis; FA, fractional anisotropy.
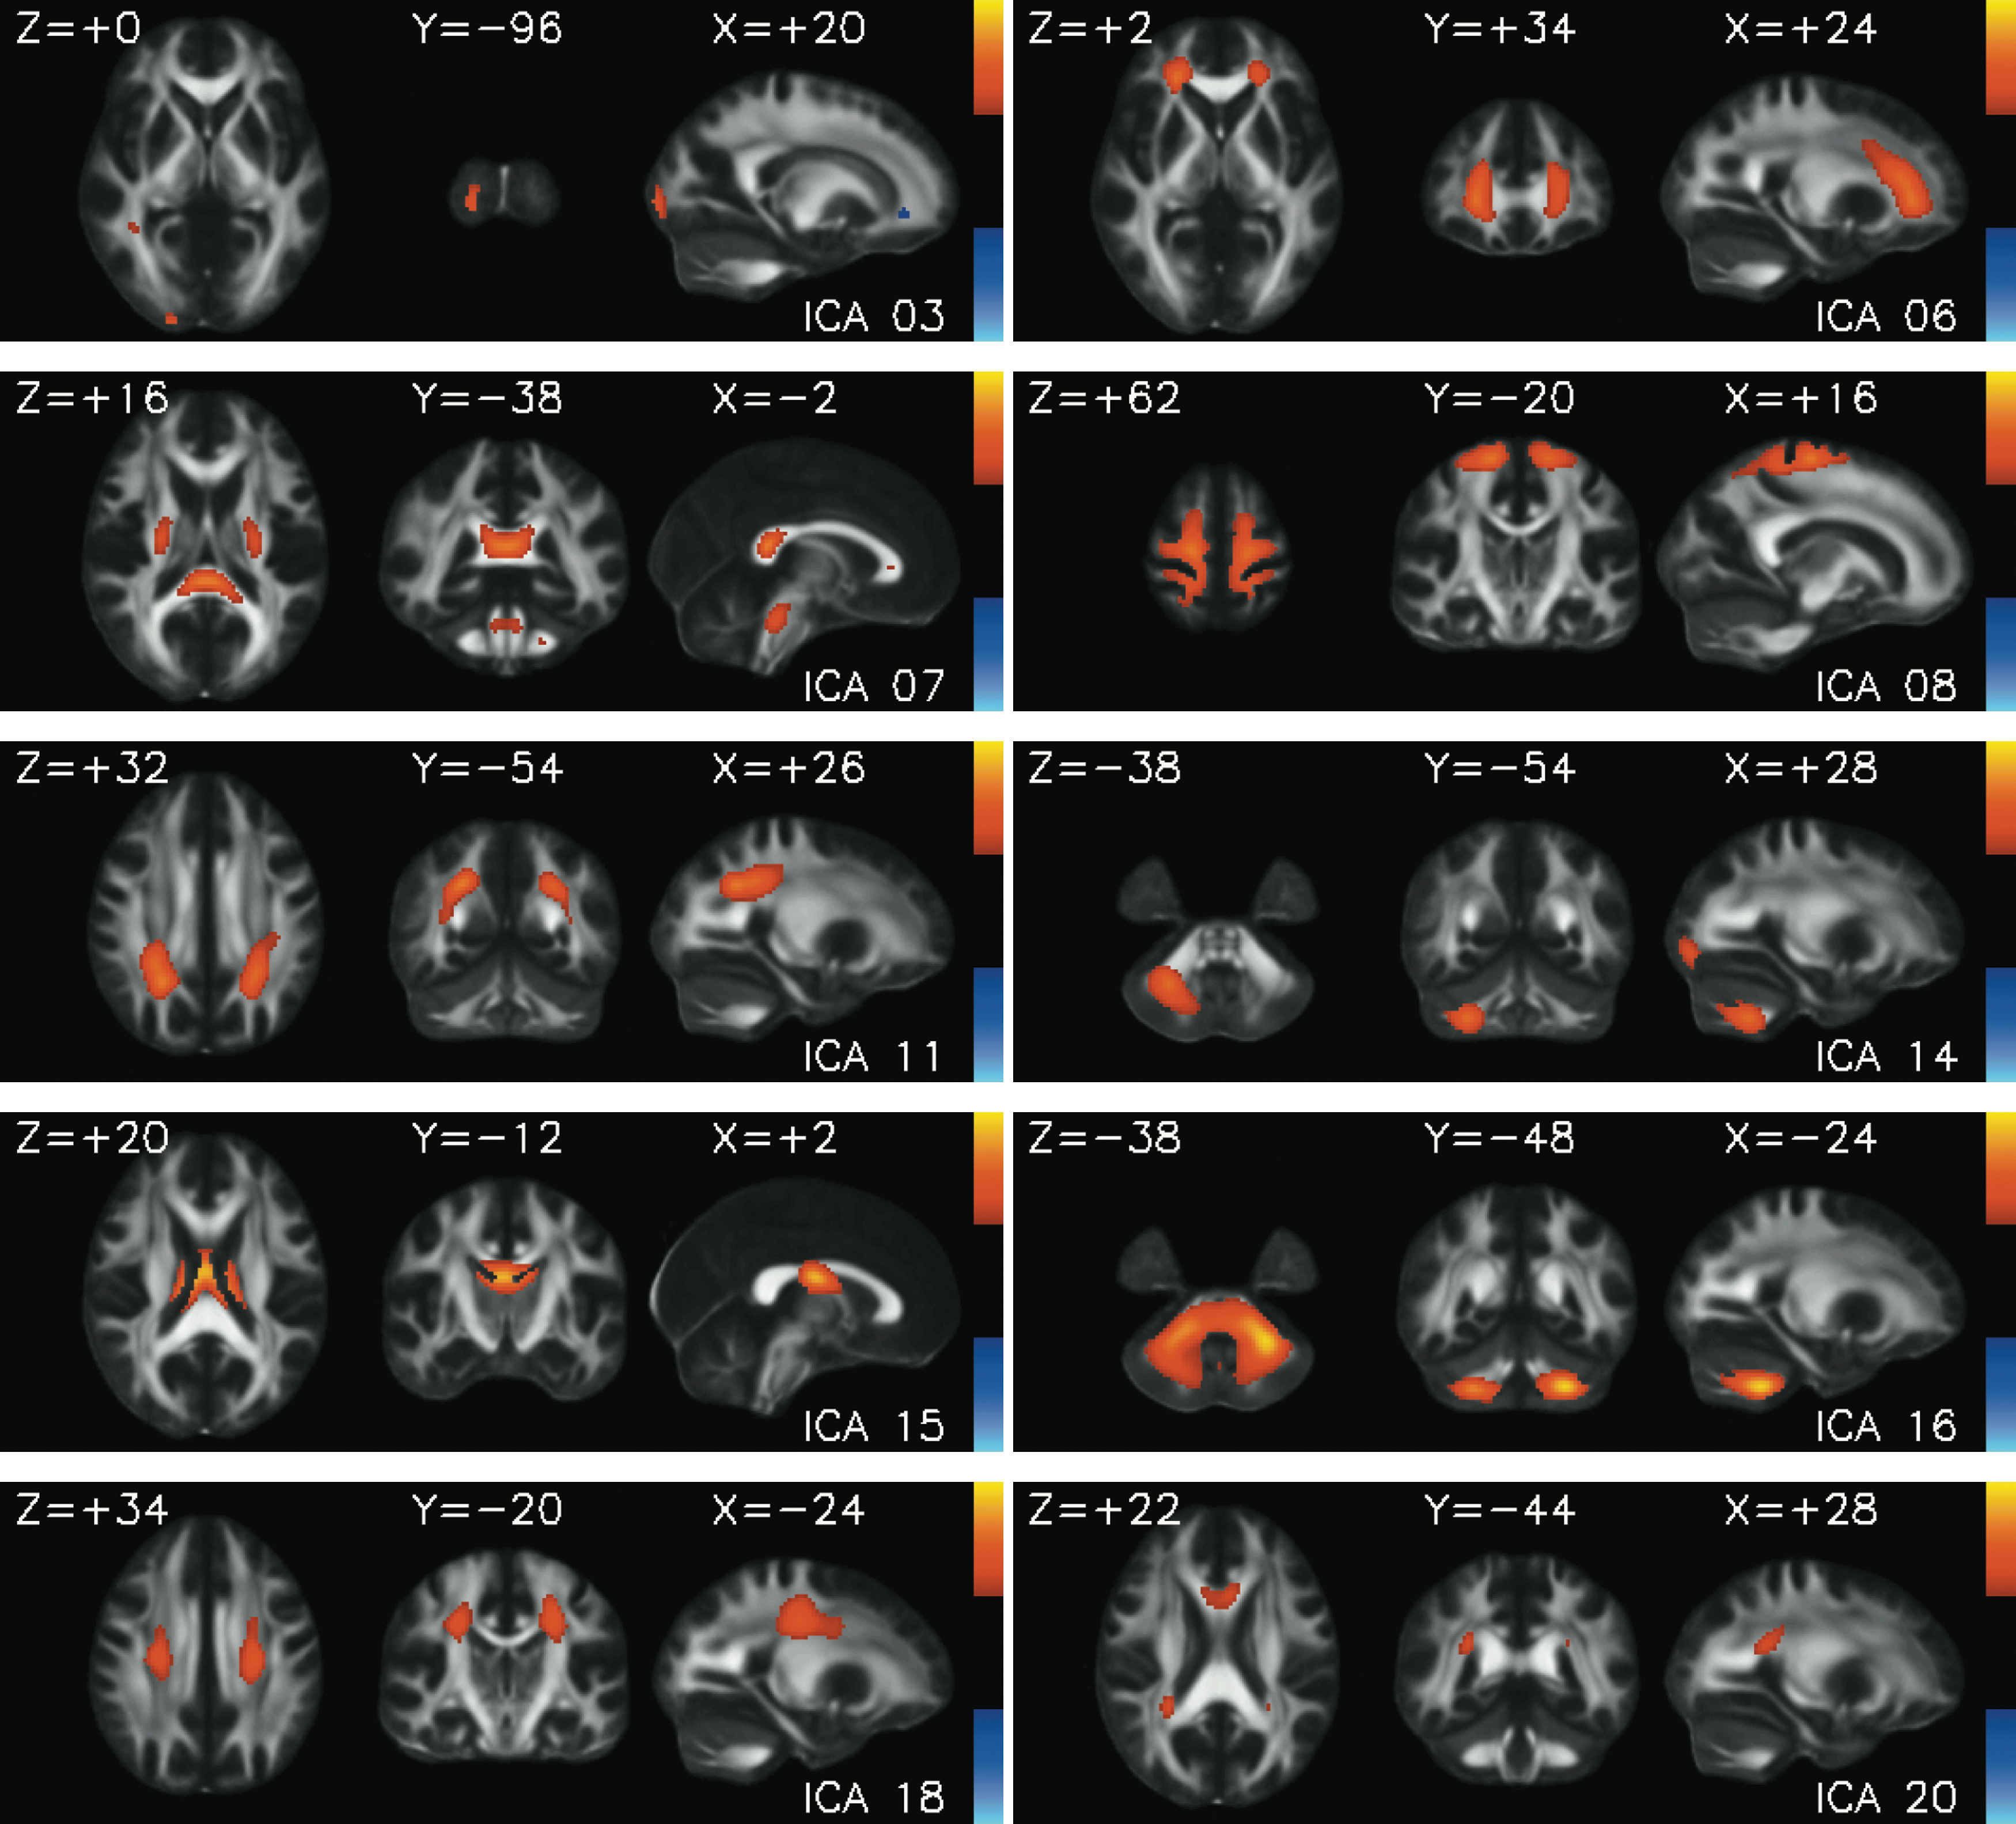
The 10 selected ICA spatial maps (components) and their corresponding Montreal Neurologic Institute (MNI) coordinates. The same threshold shown on one color bar was used for all images.
The fractional amount of each component contained in the white matter tracts is given. The white matter tract designations are based on the Johns Hopkins University Atlas. Criteria for selection are outlined in the SBM analysis section.
Relationship between ICA loading coefficients and FA values
To address the sign ambiguity of ICA, we adjusted the signs of the ICA maps so that the correlation of the loading coefficients with the FA values is positive. In Figure 3, we show a plot of loading coefficients against the weighted mean FA values for each map. The red dots are patients and the blue dots are the healthy controls. The loading coefficients and the FA values are positively correlated, but considerably vary across different ICA components. The correlation between the loading coefficients and the weighted mean FA values is higher if the corresponding ICA map has a high peak defining a focal region in the FA image.

The loading coefficients were plotted against the weighted mean FA values for each map (red=schizophrenia; blue=healthy controls). The loading coefficients and the FA values are positively correlated but vary considerably across different ICA components.
Group results with loading coefficients
Patients with schizophrenia had significant differences in the ICA loading coefficients in Components 6 (t 165=−2.91, p=0.004), 7 (t 165=−3.71, p<0.001), 11 (t 165=−2.28, p=0.024), 15 (t 165=3.00, p<0.001), 18 (t 165=−2.45, p=0.015), and 20 (t165 =−3.33, p=0.001) relative to the control group after correcting for multiple comparisons using the false-discovery rate at p<0.05 (Genovese et al., 2002). These results are presented in Table 3 and are shown in Figure 4. The relative location of the six components discussed above are shown in Figure 5 with the ICA maps thresholded for z>4.0. In this figure, components that overlap at a particular voxel are represented by the component with the larger value. The composition of the tracts in terms of the white matter is shown in Figure 6. In our white matter atlas, the forceps minor includes the genu and the forceps major the splenium. Component 6 covers the anterior brain that includes anterior thalamic radiation, forceps minor, cingulum, and inferior fronto occipital fasciculus. Component 7 is dominant in the internal capsule (part of corticospinal tract in the atlas) and the splenium. Component 11 covers the superior longitudinal fasciculus. Component 15 covers the anterior thalamic radiation near the thalamus. Component 18 covers the corticospinal tract superior to that covered by ICA 7. Finally, Component 20 covers the genu, part of cingulum, and the inferior fronto-occipital fasciculus on the right side.


The ICA maps of the six significant components were thresholded at z>4.0. Components that overlapped at a particular voxel are represented by the component with the larger value.
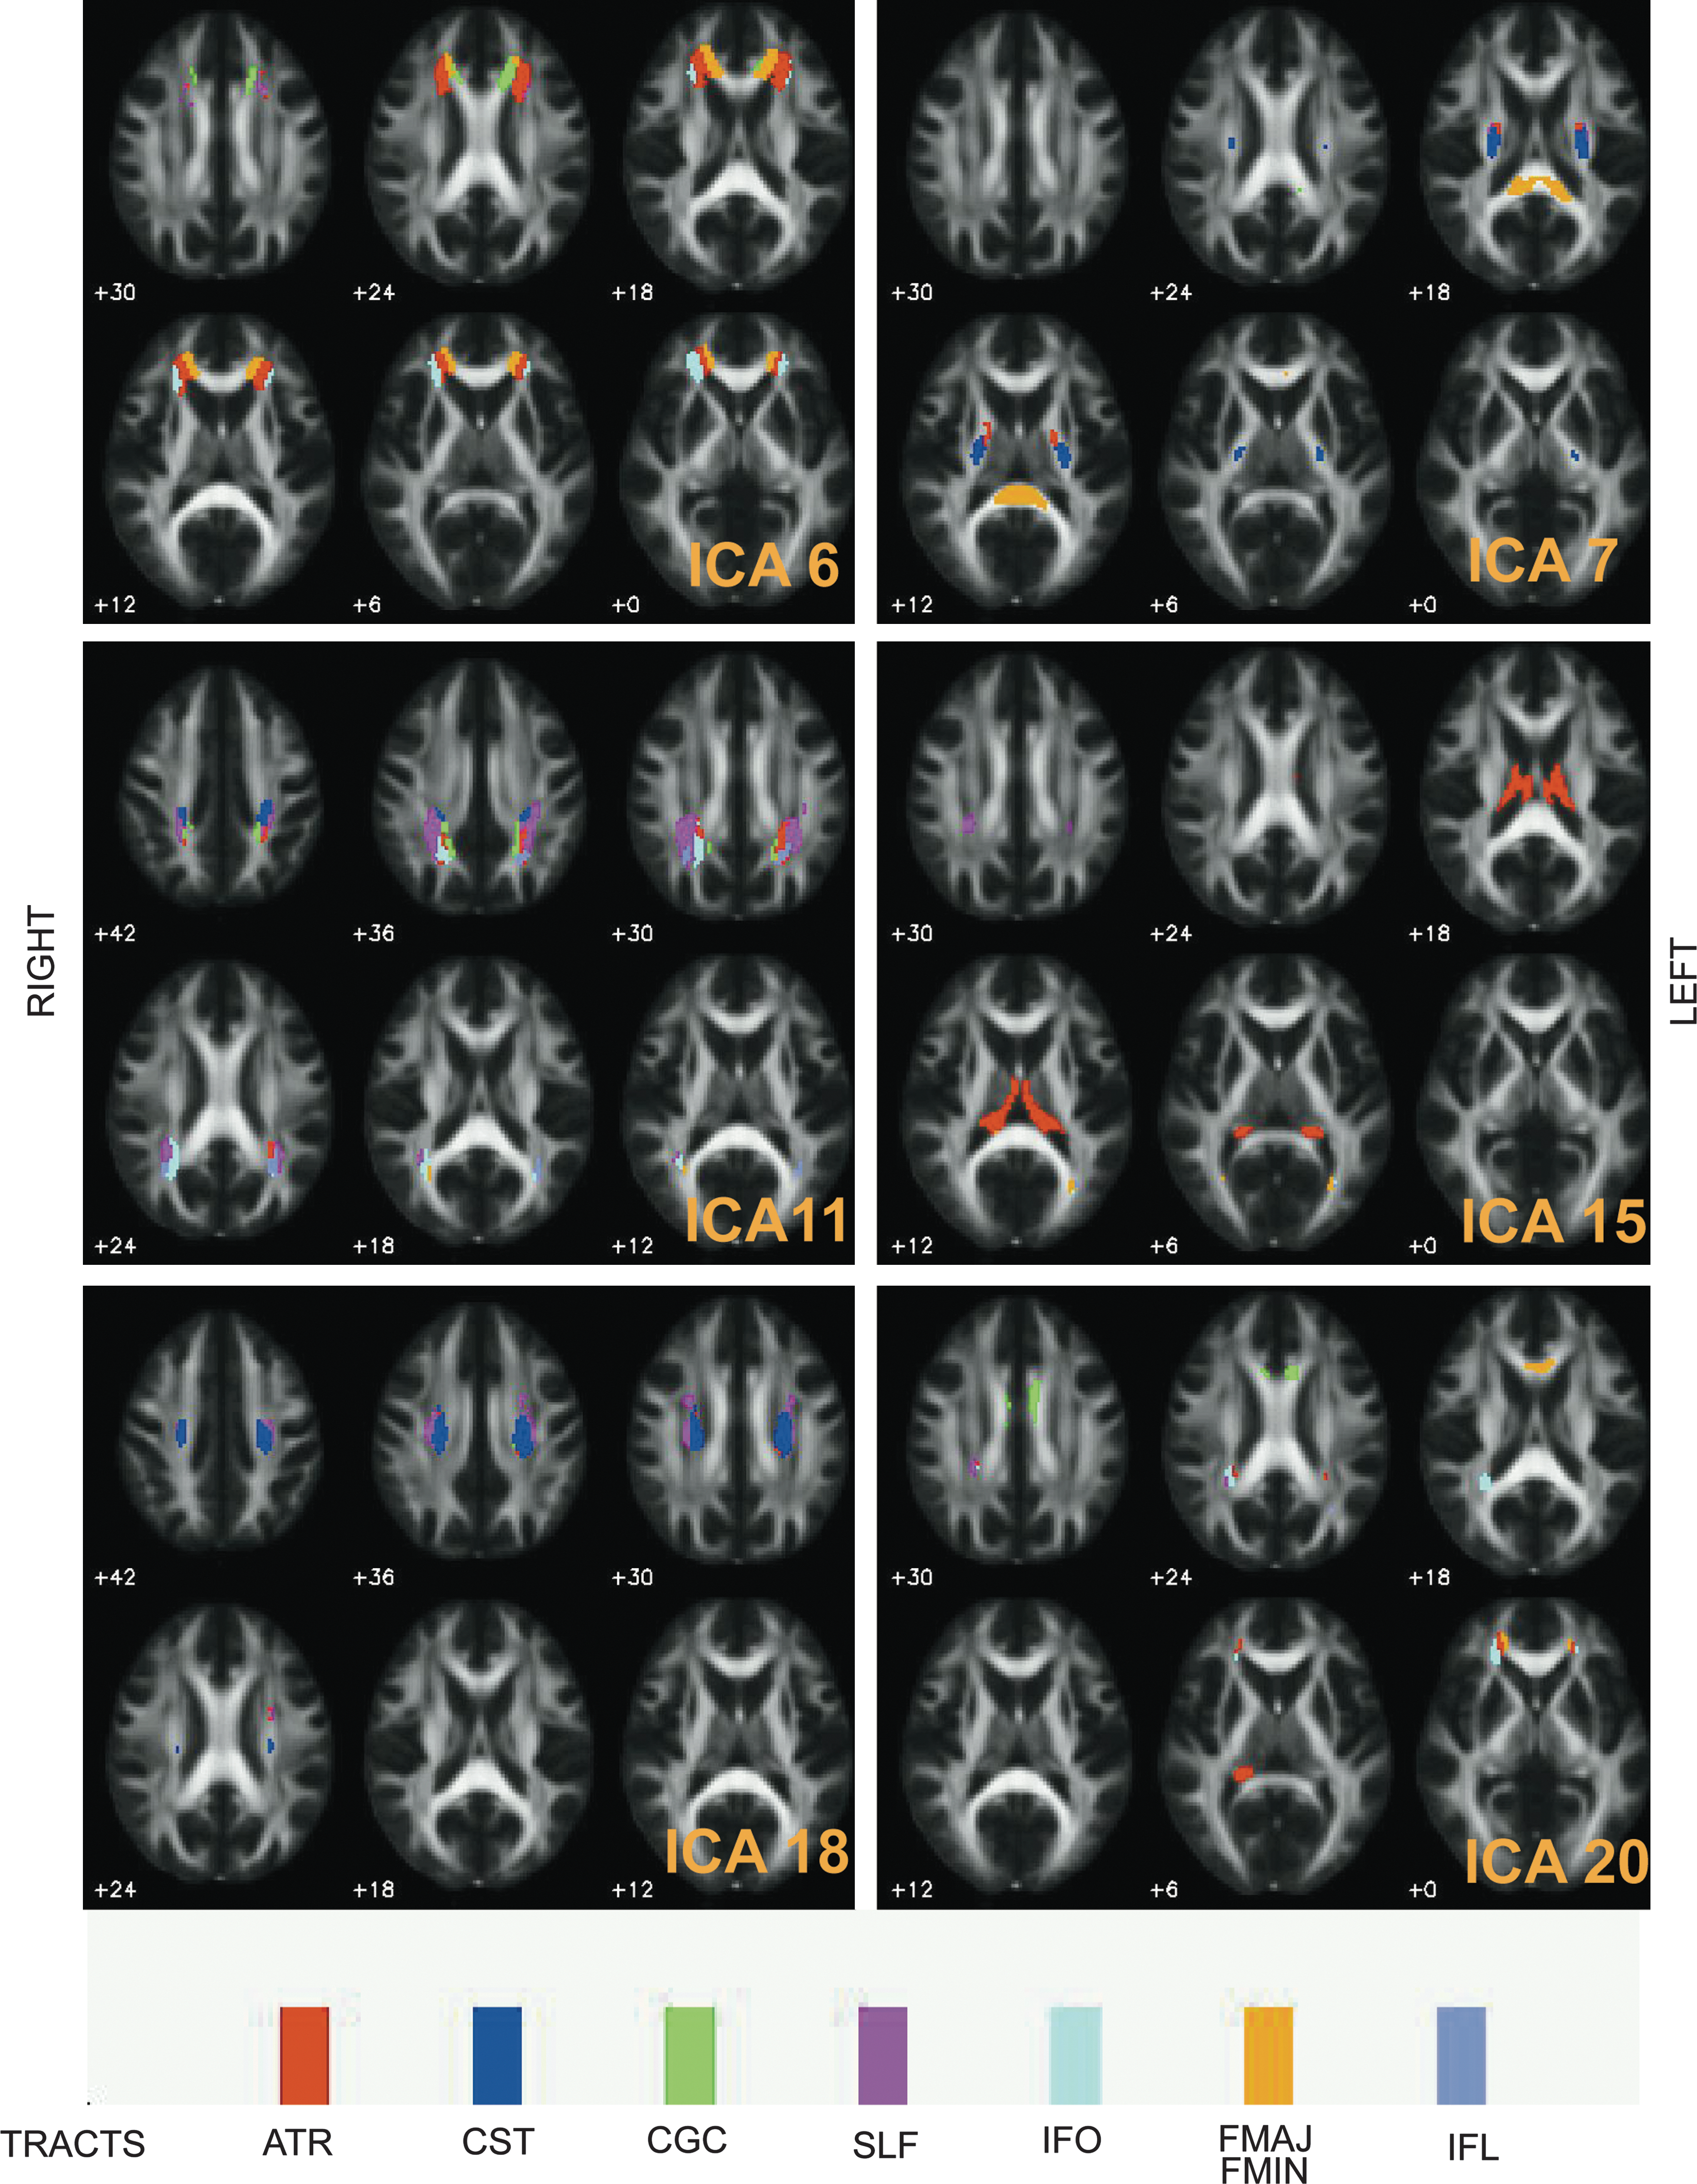
The significant ICA components are decomposed into major white matter tracts.
Summary of means, standard deviations, t-statistics, and effect sizes for the group differences of the loading coefficients (top) and weighted FA values (bottom). The components marked with asterisk (*) were significant with a false-discovery rate correction of <0.05. The FA values generally had larger effect sizes than the loading coefficients.
FA, fractional anisotropy.
We assessed the effect of age, gender, and interactions with the loading coefficients of the components that had significant group differences. Components 6, 7, 11, 15, and 18 had significant age-related decline in white matter integrity (F 1, 159>14.16, p<0.001), but these components did not have significant age by group interactions (p>0.20). Component 20 did not show age-related changes (F 1, 159=3.08, p=0.08). Gender differences were only significant with Component 11 (F 1, 159=4.14, p=0.04), but Component 11 did not have a gender by group interaction (p=0.56).
Group results with weighted mean FA values
We next tested whether the weighted mean FA values calculated from clusters defined by ICA maps showed any group differences. This is an alternative approach to testing the loading parameters, so we started again from the original 10 nonartifactual components. Patients had significant differences in the mean FA values in 9 of the 10 selected components relative to the control group after correcting for multiple comparisons using the false-discovery rate at p<0.05. The results are shown in Table 3. The weighted mean FA values had larger effect sizes (Cohen's d) relative to the results directly calculated from the loading coefficients for all components except for Components 6 and 7. This observation points out an application of ICA as a method of clustering brain regions. The group differences can then be directly evaluated in terms of FA values defined for these clusters.
Discussion
Several prior studies reported decreased FA values in patients with schizophrenia compared with healthy controls. However, given the considerable variability in the methodologies used and the patient population analyzed in such studies, it is difficult to draw general conclusions about which white matter tracts are consistently affected. Several factors including DTI acquisition parameters, analysis methodology, sample size, and characteristics such as age or treatment duration may account for this variability (Jones et al., 2006; Ellison-Wright and Bullmore, 2009; Jones and Cercignani, 2010). Although most analysis methods used univariate approaches such as ROI, VBM, or TBSS, we used ICA, a multivariate method whose results take into account cross-voxel information and, as a result, may be more robust than univariate voxel-wise approaches (Calhoun et al., 2008). In contrast to most previous studies that used relatively small subject numbers, our investigation included 167 participants (65 with schizophrenia), which provided increased power to detect group differences. From the entire sample, patients with schizophrenia had significant group differences in the loading coefficients relative to healthy controls in 6 of the 10 selected components. The affected white matter tracts in the patients with schizophrenia included the anterior thalamic radiations, corticospinal tracts, forceps major, forceps minor, superior longitudinal fasciculus, and the inferior fronto-occipital fasciculus. The weighted mean FA values for each ICA spatial map generally had larger group differences and effect sizes relative to the group differences derived from the loading coefficients.
We hypothesized that SBM would produce results consistent with a recent VBM meta-analysis that showed reduced FA in frontal and temporal white matter regions in patients with schizophrenia (Ellison-Wright and Bullmore, 2009). The frontal regions from the meta-analysis included the thalamic radiation, inferior fronto-occipital fasciculus, and the cingulum bundle. This region overlapped with the location of the anterior thalamic radiation from Component 6. Diminished white matter integrity of the anterior thalamic radiation disrupts frontal projection fibers from the mediodorsal thalamic nuclei and the frontal cortex (Mori et al., 2005) and has been associated with executive impairment and deficits in working memory in patients with schizophrenia (Mamah et al., 2010). The temporal regions from the meta-analysis included the left inferior longitudinal fasciculus and the left inferior fronto-occipital fasciculus. This region appeared to overlap with our Component 20, which also included the inferior fronto-occipital fasciculus. Diminished white matter integrity of the inferior fronto-occipital fasciculus disrupts frontal connectivity with association fibers connecting the frontal and occipital cortices (Mori et al., 2005). Previous research has shown that this white matter tract has aberrant FA in patients with schizophrenia and may be associated with positive symptomatology (Szeszko et al., 2008). The data-driven SBM component that included the inferior fronto-occipital fasciculus had a strong right-sided asymmetry (21% of this component; <1% from the left inferior fronto-occipital fasciculus). Reductions in right hemisphere anisotropy have been associated with positive symptomatology in patients with schizophrenia (Mitelman et al., 2007) and warrant further investigation.
Other significant group differences in the loading coefficients not found in the VBM meta-analysis included white matter tracts in the forceps minor (Component 6), forceps major (Component 7), corticospinal tracts (Component 7), and the superior longitudinal fasciculus (Component 11). These white matter tracts have all been implicated in the pathophysiology of schizophrenia (Hubl et al., 2004; Mitelman et al., 2007; Friedman et al., 2008; Karlsgodt et al., 2008; Seal et al., 2008; Szeszko et al., 2008; Rotarska-Jagiela et al., 2009). Overall, our SBM results are consistent with prior studies outside of the VBM meta-analysis and do not support the macrocircuit theory of schizophrenia. The widespread changes in white matter integrity suggest that patients with schizophrenia may have global as opposed to specific white matter changes. The results of the weighted mean FA values, which showed 9 of the 10 white matter tracts as significant, provide even more convincing support of global changes in white matter changes.
Previous DTI studies assessing the impact of age on the disease process have had mixed results. Several studies have shown accelerated, age-related reductions in FA in schizophrenia (Carpenter et al., 2008; Friedman et al., 2008), whereas other studies did not replicate this relationship (Jones et al., 2006; Voineskos et al., 2010). Age was related to the loading coefficients from Components 6, 7, 11, 15, and 18. However, these components did not have an age by group interaction, suggesting similar age-related changes in all selected components in patients and controls. Our results may be attributable to the upper age range of the matched sample (<60 years of age). Across the lifespan, FA increases during the first two decades and peaks as late as the fifth decade (Bartzokis et al., 2001; Raz et al., 2005; Carpenter et al., 2008). A sample that includes older patients and age-matched controls may more definitively assess age-related changes and possible nonlinear age-related changes in white matter integrity.
The above comparisons of prior DTI studies with the SBM results indicate that SBM is an attractive alternative to voxel-based methods for studying FA differences in patients with schizophrenia. ICA is a multivariate technique and ICA maps are defined across the whole image. An advantage of the ICA method is that image artifacts and registration errors, which may overlap with regions in the brain that are of interest, will likely be contained in a different independent map, thus “cleaning” up the areas of interest. Although our group has previously used a similar ICA-based method to characterize gray matter differences in subject populations, this application to FA offers new insights: (a) We show that loading coefficients calculated from the ICA maps are useful in studies assessing group differences. (b) We define a method of obtaining clusters from the ICA map and show that underlying FA values can have strong correlation with the loading coefficients across several ICA maps. Because of the multivariate nature of the ICA method and the fact that components also show common intersubject covariation, the clusters defined by ICA need not be connected in a given tract. This will distinguish it from the other type of “connection,” which is intersubject covariation. Thus, we can treat ICA as a method to identify clusters and then look for group differences directly based on the FA values. (c) The correlation between FA and loading coefficients not being 1 implies that FA has slightly different information from that contained in the loading coefficients. The ICA loading coefficients come from the entire brain, not just an ROI, and subsequently have more variability than the FA values. The FA values also have the benefit of being taken from regions that have similar covariation among subjects as these regions were defined by the ICA. Thus, it is not surprising that the FA values in this particular dataset have less variability. The FA values are dependent on the ICA analysis, not independent of it. We consider the cluster-based ICA analysis to be complimentary to the loading coefficients and suggest that both methods should be done.
This pilot investigation is based on only one parameter (FA) derived from the diffusion tensor. Similar analyses can be done either with other diffusion tensor components or based on AD and RD measures. There are two obvious ways in which AD and RD information can be incorporated. In one approach, a separate ICA analysis for AD and RD can be performed. The resulting spatial maps will be different but the loading coefficients can be studied for group differences in combination with data from the FA-based analysis. In an alternate approach, the AD and RD analysis can be restricted to the spatial maps obtained from the above FA analysis. In that case we can study whether FA differences seen in specific FA maps is also accompanied by corresponding AD and RD changes.
The ICA method can be compared to voxel-based, ROI, and tract-based methods. It is similar to the TBSS and VBM approaches, as no prior ROI information is used. However, one important advantage of our method is that the number of maps tested for group differences is considerably reduced (to ∼10), which helps minimize the multiple-comparison problem. In this sense, it is similar to an ROI analysis in which a limited number of regions have been selected. For ICA analyses, the maps are data-driven, whereas in an ROI analysis the regions are based on prior knowledge. Further, the white matter tract identified with ROI and univariate, voxel-based approaches may include voxels covarying in dramatically different ways. The data-driven approach that generates the FA ICA maps does not distinguish between different tracts. Each component is a mixture of different white matter tracts showing similar intersubject covariation. We intersect these components with known tracts for convenience; however, our approach should not be confused with a tract-tracing approach, which provides a direct measure of structural connectivity. A purely tract-based method will miss group differences that involve multiple tract regions. In contrast, our approach may show changes only in parts of any given tract and may span multiple tracts. It is thus asking a different question than a tract-tracing approach and is most appropriately considered a multivariate generalization of the VBM approach, which has been applied to FA maps in previous work. The full consequence of ICA giving regions, which contain multiple tracts, has not been fully understood and requires further work. Grouping white matter voxels that have similar covariation may more effectively capture group differences based on a common biological process (fiber crossings, for example) or disease.
Several limitations must be considered when interpreting the results of this study. First, we did not have complete clinical or demographic information on the patients and control subjects. We were therefore unable to assess important clinical variables such as symptoms or antipsychotic dose on FA. However, we focused our results and discussion only on diagnosis and age- and gender-related effects on FA. Second, our analysis is based on FA calculated from a diffusion tensor and, as such, has some limitations. It is known that a diffusion tensor estimated using only 12 diffusion-sensitizing directions suffers from limitations such that a probabilistic tractography method cannot be used (Behrens et al., 2003, 2007), and voxels with crossing fibers will have reduced FA values. Q-ball imaging and diffusion spectrum imaging have been proposed to address the limitation of crossing fibers (Tuch, 2004; Wedeen et al., 2005; Behrens et al., 2007). Our approach works with FA values and thus can be used with 12 directions or with a larger number of directions. Third, a number of parameters have arbitrarily set values. These include the amount of smoothing, the number of ICA components, and the thresholds used in selecting the ICA components for further group analysis. Systematically varying these parameters to study their effect on group differences is outside the scope of this work. We show that ICA can be used as a preprocessing step in a DTI-based group study. Finally, tracts from different subjects may be blurred into each other from image alignment and smoothing. This is probably true but the ICA method gives a broad region for further group analysis by not focusing on specific voxels. The method detected broad brain areas, which showed significant differences between the two groups.
Conclusion
To summarize, SBM has two useful properties. First, it does not restrict analysis to a priori specific ROI, and second, the method of finding ICA spatial maps filters the variation across subjects, providing maps in which the variation has higher coherence as measured by mutual information. In our experience, this helps identify interesting regions, which have common intersubject covariation, and filter and separate noise from the other components of interest. Our data suggest that SBM is a useful, alternative approach to voxel-based analysis of DTI imaging studies using FA. Our data-driven results support the global deficits of white matter integrity in patients with schizophrenia. The consistency of our SBM results with a recent VBM meta-analysis (Ellison-Wright and Bullmore, 2009) and as well as other diffusion tensor methodologies support the proof of concept of SBM as a valid, multivariate approach for DTI.
Footnotes
Acknowledgments
This study was supported by NIH grants 2R01 EB000840, 5P20RR021938, 1RC1MH089257, and 1R01EB006841 (to V.D.C.) and R37 MH43775, R01 MH074797, and R01 MH077945 (to G.P.).
Author Disclosure Statement
No competing financial interests exist.