




Abstract
Recently, functional connectivity analyses using spontaneous functional magnetic resonance imaging (fMRI) fluctuations have been applied in the context of neurological and psychiatry diseases. In the analyses procedure, preprocessing steps are commonly utilized in exploring functional connectivity, the same strategy as what was conducted in the fMRI process. However, the effectiveness of these preprocessing steps on resting-state fMRI (rs-fMRI) was rarely investigated, and the significance of preprocessing steps on rs-fMRI needs to be studied. Therefore, the main purpose of the current study was to evaluate the effects of multiple preprocessing procedures, including slice-timing correction, smoothing, and spatial normalization, on rs-fMRI signal. Through a seed-based correlation analysis on the motor network, we empirically estimated three indices of spontaneous fMRI fluctuations induced: correlation coefficients (CC), amplitude of low-frequency fluctuations (ALFFs), and fractional ALFF (fALFF), with different strategies of three preprocessing steps. Multiple repetition times (TRs=2, 3, 4 sec) were also compared to address the issue of temporal mismatch. In the temporal preprocess, we found that the use of slice-timing correction and different TRs had minimal effects on CC and fALFF. However, ALFF was significantly affected using different TR but not affected by slice-timing correction as well. In the spatial preprocess, fALFF was insensitive to both smoothing and normalization. Smoothing consistently increased spatial extents and CC, but suppressed ALFF values. Performing normalization before index calculations provided better spatial sensitivity with larger variability in ALFF, whereas performing normalization after index calculations might preserve the ALFF level as in the unnormalized data. Conclusively, the effects of choosing preprocessing parameters and strategies were presented in the current study, providing practical considerations when conducting rs-fMRI analyses.
Introduction
U
Even though rs-fMRI has rapidly become a viable methodology that assesses brain assembly, the exact neurophysiological mechanisms giving rise to brain connectivity during the “resting” state are not fully understood (Bianciardi et al., 2009; Leopold et al., 2003). Electrophysiology evidence supported that spontaneous fluctuations may be driven by neuronal activity (Dóra and Kovách, 1981; Mantini et al., 2007; Shmuel and Leopold, 2008), but the undetermined underlying mechanism beyond BOLD theorem makes it difficult to optimize the analysis procedure of rs-fMRI signal. Under such circumstances, current preprocessing pipeline for rs-fMRI signals follows traditional protocols based on task-activation fMRI procedure. However, the effectiveness of these preprocessing steps on rs-fMRI was seldom investigated, and the significance of preprocessing steps on rs-fMRI needs to be studied. For example, the effective rs-fMRI signal for functional connectivity slowly fluctuates in a quasi-sinusoidal and low-amplitude manner, in which the slice-timing correction may not be as effective as in the activation-evoked design. In the spatial domain, the smooth kernel might reduce the spatial specificity in synchronized brain regions or even affect the spontaneous fluctuations in time domain due to the spatiotemporal covariance in the fMRI signal (Worsley, 2005). Currently, most of the preprocessing investigations on rs-fMRI focused on the regressors to minimize intrinsic physiological noise (Chang and Glover, 2009; Gavrilescu et al., 2008; Jo et al., 2010; Murphy et al., 2009; Weissenbacher et al., 2009). The spatiotemporal transformations in the preprocessing procedures in rs-fMRI were less appealed in this field. Lowe and colleagues investigated the effect of motion correction specific to rs-fMRI and reported a correlation-enhanced outcome after the realignment process, suggesting the necessity of performing realignment before connectivity analysis (Lowe et al., 1998). Nandy and Cordes (2007) addressed the necessity to correct temporal autocorrelation in the fMRI dataset. Van Dijk and associates (2010) reported consistent correlation coefficients (CC) using different acquisition time structures and spatiotemporal resolutions. Nevertheless, the question remains unsolved: How much effect could the spatiotemporal transformations of preprocessing methods impose on the spontaneous fluctuations and corresponding functional indices?
To this end, the effects of preprocessing procedures were divided into two groups (temporal preprocess and spatial preprocess), estimated with practical parameters in each processing method, and evaluated based on three functional indices: CC, amplitude of low-frequency fluctuation (ALFF), and fractional ALFF (fALFF) in the motor network. The temporal preprocess group included the selection of different repetition times (TRs) in the acquisition and usage of slice-timing correction. The spatial preprocess group contained smoothing with multiple kernel sizes and three normalization strategies: normalize before index calculations, normalize after index calculations, and without any normalization process. Through the evaluations just mentioned, we expected to provide an effective strategy and parameters in the preprocessing pipeline for rs-fMRI analyses.
Materials and Methods
Study subjects
Ten healthy adults (5 men, aged 24±3 years) volunteered to participate in this study. They were screened to ensure no history of neurological illness, psychiatric disorders, or past drug usage before the experiment. Written informed consents were obtained from all participants before the scanning sessions in accordance with the protocol approved by the Internal Review Board of National Yang-Ming University.
Imaging protocol
The experiments were conducted on a 3.0 T Siemens Tim Trio scanner (Erlangen, Germany) using a 12-channel volume coil. Each subject's head was immobilized with a custom-made holder to minimize motion artifacts. A single-shot, gradient-echo-based echo-planar imaging sequence was adopted for the functional scans. Thirty-three axial slices (220×220 mm2 field of view, 64×64 in-plane matrix size, and 4 mm slice thickness) were acquired in an interleaved manner, aligned along the anterior commissure–posterior commissure line with whole-brain coverage. Other imaging parameters were set as follows: echo time (TE)=30 ms and bandwidth=2368 Hz/pixel.
The experiment contained four sessions. Three runs at resting conditions were acquired corresponding to three TRs (2 to 4 sec), respectively, to evaluate the effect of temporal parameters, and one session with the finger-tapping task was conducted subsequently to better localize the functional area involved in the motor task. Before the resting scans, the subjects were instructed to close his or her eyes, not to fall asleep, not to move their head, and not to think of anything in particular. Three resting scans in total were conducted in a counterbalanced order using TR=2000, 3000, and 4000 ms with flip angles=79°, 85°, and 87°, respectively, for optimal signal-to-noise ratio (SNR). After three dummy scans, 100 measurements were acquired for TR=3 and 4 sec scans, corresponding to 5 min and 6 min 40 sec of total acquisition time, respectively. As for TR=2 sec, a total of 900 measurements were scanned for the stability test, while only the first 150 measurements were used to illustrate the effectiveness of preprocessing on functional connectivity. After the three resting runs, a finger-tapping task was conducted (TR=2 sec, 100 measurements), consisting of two sets of a 40-sec tapping period followed by a 40-sec fixation period with additional 46-sec fixation at the beginning of the scan. The subjects were requested to tap the fingers of both hands while hearing the instructions during the scan. At the end of the imaging protocol, one high-resolution, T1-weighted anatomical image (3D-MPRAGE with 192×192×176 matrix size; 1×1×1 mm3 in-plane resolution; TI=900 ms; TR/TE=1900/2.28 ms; flip angle=9°; bandwidth=200 Hz/pixel; NEX=1) was acquired for each subject.
Processes
The flowchart shown in Figure 1 outlines the categories of preprocessing/analysis workflow in the current work. The functional dataset with finger-tapping tasks first underwent the standard preprocessing procedure (Fig. 1a, including slice-timing, realignment, smoothing with a kernel size of 6 mm, and spatial normalization) using statistical parametric mapping (SPM5, Wellcome Trust Center, Department of Cognitive Neurology, London, United Kingdom). After preprocessing, the general linear model (GLM) was performed on two task datasets, with and without spatial normalization, respectively. Voxels with the highest t-scores were identified from spmT maps in both individual and template coordinates, regarded as the center of seed points for the following seed-correlation analysis of the rs-fMRI dataset. Subsequently, the resulting beta maps in Montreal Neurologic Institute (MNI) coordinates were taken as inputs of second-level group analysis. The group result of activation maps will be used as a referencing region of interest (ROI) to evaluate three indices (i.e., CC, ALFF, and fALFF) under different preprocessing strategies. T1-weighted anatomical images were segmented into white matter and cerebrospinal fluid (CSF) probability maps using SPM5. The two generated maps with a probability larger than 95% were used as the masks of white matter and CSF for the following functional connectivity analysis.

Diagram of multiple preprocessing procedures.
Among the preprocessing methods in rs-fMRI analyses, regressor type and motion correction were not tested in the current study, as the related issues have been addressed in previous literature (Chang and Glover, 2009; Gavrilescu et al., 2008; Jo et al., 2010; Murphy et al., 2009; Weissenbacher et al., 2009) and Lowe and associates (1998) have confirmed the positive effect of realignment on the resting-state dataset. Based on seed-correlation analyses, three other methods (slice-timing correction, smoothing, and normalization) in the preprocessing pipeline combined with a multiple-TR resting-state dataset were divided into two preprocess groups (temporal and spatial) according to the characteristics in temporal (TR and slice-timing correction) and spatial (smoothing and normalization) domains, respectively.
Temporal preprocess
The resting-state dataset with multiple TRs (2, 3, and 4 sec) went through the standard process with isotropic normalization (2×2×2 mm3) into the standard Talairach space and with a smooth kernel of 6 mm, as shown in Figure 1b. Seed points were chosen from the normalized task results for each subject and fed into the functional connectivity analyses. Each dataset was divided into two subgroups: one with slice-timing correction (w/ST, using the first bottom image as the reference image and underwent an interleaved correction) and the other without slice-timing correction (w/o ST). To prevent unbalanced total acquisition time and provide a general observation of TR influences, the three indices were observed in two scenarios: fixed time duration and fixed scan number. In the fixed-time-duration scenario, a total acquisition time of 300 sec was applied, resulting in 150 scans for TR=2 sec, 100 scans for TR=3 sec, and 75 scans for TR=4 sec, respectively. In the fixed-scan-number scenario, the same scan number (100 scans) was applied for each TR dataset.
Spatial preprocess
For simplicity, the resting-state dataset with a TR of 2 sec (150 scans) went through slice-timing correction and was then used for the following spatial preprocesses. Smoothing effect was evaluated by applying six different isotropic Gaussian kernels (0, 2, 4, 6, 8, and 10 mm) on the dataset, while the image resolution was around 3.44×3.44×4 mm3. Three normalization strategies were applied: (1) Prenorm (Fig. 1b)—A rigid-body affine normalization process was performed before calculating CC and ALFFs, which is the typical strategy for functional connectivity analysis. Seed points were chosen from the normalized task results of each subject. (2) Postnorm (Fig. 1c)—Rigid-body affine normalization was performed after calculation of CC and ALFFs, which reflects functional connectivity with minimal transformation errors. Seed points were chosen from voxels with the highest t-score values of unnormalized individual task results. (3) Without (w/o) Norm (Fig. 1d)—The dataset went through realignment and smoothing only, without applying any normalization process. Seed points were selected from voxels with the highest t-score of unnormalized task results in individual spaces. The motor-task fMRI dataset was also preprocessed with both Prenorm and Postnorm to estimate the normalization effect on task-based activation maps.
Subsequently, the Analysis of Functional Neuroimaging (AFNI) software package (Cox, 1996) was used for detrending (to eliminate signal drift induced by system instability), low-pass filtering in the range of 0.01 to 0.1 Hz, and calculating three functional indices (CC, ALFF, and fALFF). Regarding the temporal preprocess group, an effective degree of freedom (DOF) was estimated by dividing the scan number with the estimated auto-covariance for each testing strategy (slice-timing correction and TR) in the temporal preprocess group to monitor the independent frames subsided in the preprocessed dataset (Fox et al., 2005). On the other hand, since additional spatial correlation would be introduced into the dataset by conducting the smoothing and normalization methods, the full-width half-maximum (FWHM) of the spatial correlation in each voxel was computed in the spatial preprocess group to estimate the spatial extent of the point-spread function. Spherical seeds (3 mm in radius) were selected from the right side of the primary motor area based on the maximum beta value of the individual task dataset, either normalized (in an MNI template space) or unnormalized (in individual spaces). An averaged time series from each spherical seed was taken as the major predictor in connectivity calculations. Functional indices were calculated for each subject in both spatial and temporal preprocess groups. To correct global systematic noise and the respiratory artifact (Chang and Glover, 2009), time courses from white matter and CSF masks were used as covariables along with six motion parameters to regress out potential artifacts in the calculation of functional indices. Physiological estimation by temporal independent component analysis (PESTICA) was also applied for generating cardiac and respiratory estimators (Beall and Lowe, 2007). Specifically, 12 components were identified by PESTICA from the resting-state datasets. Among the spatial patterns of the 12 components, the one with the highest spatial correlation with a predefined cardiac source map was considered the major source of cardiac response. The time course for each cardiac-correlated map was averaged to generate a cardiac estimator. The same procedure was done to generate a respiratory estimator. These cardiac and respiratory estimators were also used to regress out potential physiological influence in the index calculation.
Group and ROI analyses
To combine results across subjects, the CC were converted to normal distributed z-scores using Fischer's z-transformation and effective DOF. Group-level activation maps were calculated via one-sample t-test based on beta values. Group-level connectivity maps were generated using two-way repeated-measures ANOVA to assess group differences between TR and slice-timing effect in the temporal preprocess whereas to assess differences between smooth kernel and normalization strategy in the spatial preprocess. Statistical threshold was set as uncorrected p<0.005 for both motor-task and rs-fMRI datasets. Corrections for multiple comparisons were executed by estimating the family-wise error based on spatial correlation and cluster size, yielding an overall false positive p<0.05 as determined by Monte Carlo simulations, with a maximum cluster volume threshold of 1552 mm3 for the task dataset, a cluster threshold of 1656 mm3 in the fixed time duration scenario of the temporal preprocess group, a cluster threshold of 1504 mm3 in the fixed scan number scenario of the temporal group, and cluster thresholds of 2176 and 4152 mm3 for Prenorm and Postnorm, respectively. For quantitative evaluations of the preprocessing effect, a reference ROI in motor-associated brain areas was generated from masking the group-based activation maps over the statistical threshold. Individual ROIs in motor cortices were also generated by thresholding individual activation maps with an uncorrected p<10−4 and a cluster threshold of 1410 mm3, then applied to unnormalized rs-fMRI datasets individually.
Results
Temporal preprocess
Group-level connectivity maps of the motor cortex, including the bilateral primary motor cortices and the supplementary motor area, are shown in Figure 2, demonstrating the effects of the temporal preprocess group. To quantify these effects, a mask generated from a group-based, task-activation map was used as a reference ROI to retrieve connectivity indices. Indices (CC, ALFF, and fALFF) are shown in Figure 3, while average cluster volumes and DOFs are listed in Table 1. In all scenarios, applying the slice-timing correction had insignificant effects on all indices [F(1,9)=1.29, p>0.29] and no interactions with TR [F(3,18)=1.58, p>0.23]. TR was the main effect in terms of ALFF [F(2,18)=8.25, p<0.003], but it showed no significant difference using CC and fALFF [F(2,18)=1.57, p=0.24]. Regarding TR effects in the scenario of fixed time duration, both CC and fALFF were not affected by three TRs (p>0.15, 0.4, and 0.5, respectively), whereas ALFF of TR-2 sec was significantly more elevated than TR-3 sec and TR-4 sec (p<0.007) (Fig. 3a–c). DOF was significantly reduced with increasing TR (p<0.00003, 0.005, and 10−9, respectively), but cluster volumes remained at the same level (p>0.2, 0.37, and 0.62, respectively) (Table 1). On the contrary, regarding TR effects in the scenario of fixed scan number, CC remained unaffected using different TRs (Fig. 3d–f). However, not only did ALFF and DOF significantly increase with longer TRs in each paired comparison (p<2×10⁻⁴, 6×10⁻⁴, and 3×10⁻⁴, respectively), but fALFF also significantly increased when comparing TR-2 sec with other long TRs (p<0.03 and 0.003, respectively). With the same scan number, TR-2 sec possessed broader spatial extents in connected regions compared with results with TR-4 sec (p<0.03).

Group-based connectivity maps (corrected p<0.05) using different TRs and acquisition durations with- and without-slice-timing correction (w/ST and w/o ST, respectively) overlaid on an anatomical image. TR, repetition time.

Correlations
Significance between paired comparison of TRs (2 sec vs. 3 sec, 3 sec vs. 4 sec, and 4 sec vs. 2 sec from top to bottom rows, respectively).
DOF, degree of freedom; TR, repetition time.
Spatial preprocess
Smoothing
Smoothing was the main effect on both CC [F(5,45)=12.75, p<10−7] and ALFF [F(5,45)=14.8, p=1.3×10⁻⁸], but it showed insignificant difference in fALFF [F(5,45)=0.92, p=0.48]. No interaction effects were found using CC and fALFF as functional indices, but significant interactions between smoothing and normalization exhibited using ALFF [F(6,45)=12.7, p=2.5×10⁻⁸]. Without applying the normalization process (w/o Norm), Figure 4 demonstrates the smoothing effect on three representative subjects in individual spaces, compared with individual task activation maps, respectively. Large smooth kernels could substantially enhance the connected areas located in the motor network. Similar group results are shown in Figure 5a using both Prenorm and Postnorm. Figure 5b, c and Table 2 summarize functional indices in the spatial process group, in which all comparisons are insignificant in fALFF (p>0.7, Fig. 5d). For other indices, every other paired comparison in a smooth kernel (i.e., the difference of kernel size >4 mm) had significant results. However, here we only focused on every adjacent paired comparison (difference of kernel size exactly equal to 2 mm) for simplicity. In Figure 5b and Table 2, CC, cluster volume, and FWHM rise monotonically with a large smooth kernel, especially significant when the smooth kernel size exceeds the original voxel size (p<0.05, 0.02, and 0.02, respectively). In contrast, ALFF (Fig. 5c) generally decreased with a large smooth kernel, indicating a reduction of fluctuation intensity. A significant reduction in ALFF was found with a smooth kernel >4 mm.
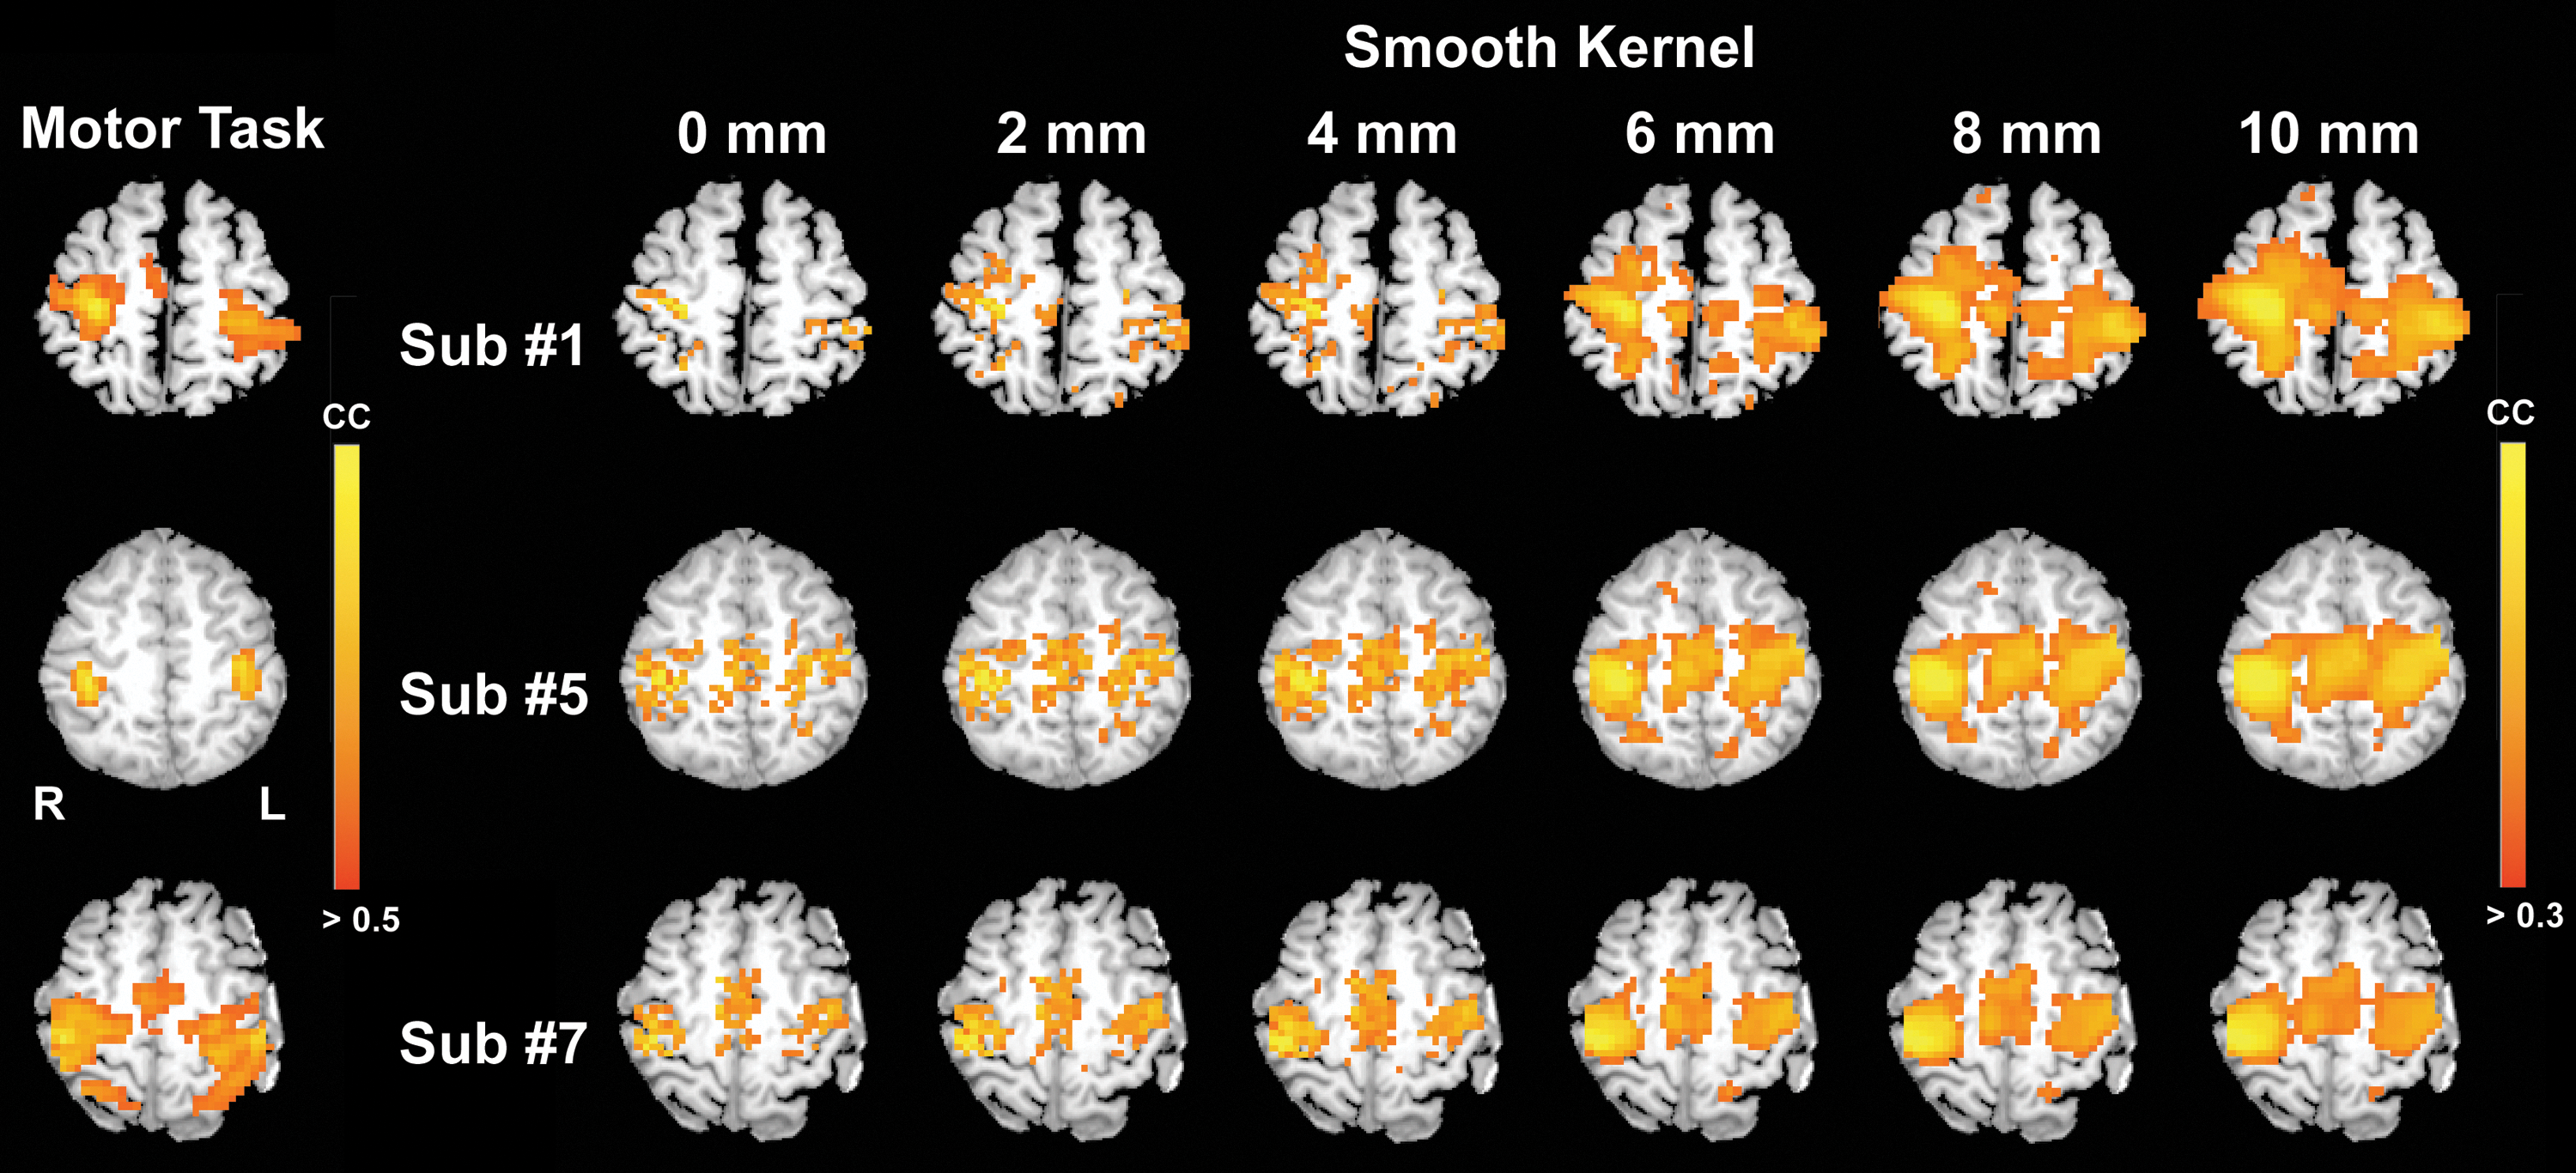
Un-normalized activation maps and connectivity maps in the motor network with multiple smooth kernel sizes, selected from three representative subjects, and overlaid on individual anatomical images. For simplicity, only one axial slice with the seed location is shown for each subject.

FWHM represents sum of square roots for each dimension:
No voxel survives the statistical threshold: t>3.7 with cluster threshold=1552 mm3.
Significance between paired comparisons of smooth kernels (N and N+2 mm).
FWHM, full-width half-maximum.
Normalization
In the group-level comparison, normalization strategies were not significantly different in CC and fALFF [F(1,9)=0.82, p>0.39], but strongly affected ALFF results [F(1,9)=24.89, p=0.001]. When comparing normalization strategies, indices of w/o Norm were used as references for less transformation error. In the task results (Fig. 5a), activation areas of Prenorm resemble those of Postnorm. Correlation values from individuals w/o Norm (0.68±0.02) were significantly higher than those of Prenorm (0.53±0.14) and Postnorm (0.51±0.13) (p<0.007), but no correlation differences were found between normalization methods (p>0.7). Similarly, in rs-fMRI results, both CC and cluster volumes were not affected by different strategies (p>0.03) (Fig. 5b and Table 2). Similarly, no significant differences were found (p>0.2) among normalization methods. When applying a small, smooth kernel (≤4 mm), ALFF of Prenorm showed large between-subject variations and were significantly lower than ALFF of w/o Norm (p<0.001), whereas ALFF of Postnorm followed the trend of w/o Norm but with lower amplitudes (p>0.2). However, the two curves converged when applying a large smooth kernel (>4 mm). In Table 2, the most significant increase in cluster volume is found in Prenorm with a smooth kernel of 6 mm compared with that of 4 mm (p<0.02), and FWHM is significantly elevated in all normalization strategies with the same smooth kernel (p<0.01).
Discussion
Until now, functional connectivity analysis based on rs-fMRI has been regarded as a well-accepted methodology to define the intermittent interactions maintaining communication between brain regions. Corresponding postprocessing techniques such as seed-based connectivity analysis, pattern classification, and graph theory were developed for meta-analysis throughout the brain (Margulies et al., 2010). However, the corresponding adaptability of preprocessing methods, including the slice-timing correction, smoothing, and spatial normalization, on the rs-fMRI signal was ignored, while many recent studies are concerned with the regressors to be used in the GLM model for the rs-fMRI signal (Jo et al., 2010; Murphy et al., 2009). Weissenbacher and associates (2009) demonstrated a fine technique that addresses the effect of different regressors using both simulated data and rs-fMRI datasets, suggesting that the corrections increase connection sensitivity and specificity. Gavrilescu and associates (2008) compared different extraction strategies of resting time courses based on task-based fMRI datasets. Nevertheless, the effects of conventional “preprocessing” workflow on functional connectivity remain untouched. In the current study, the effects of conventional preprocessing methods (slice-timing correction, smoothing, and normalization) were empirically evaluated in both spatial and temporal domains using seed-correlation analysis on the motor cortex. Results showed that the temporal preprocess group (slice-timing correction and TR selections) had negligible effects on CC, ALFF, and fALFF, whereas the spatial preprocess group (smoothing and normalization) had significant influences on CC and ALFF.
Slice-timing correction
Conventionally, the timing delay between imaging different slices introduces a transient temporal delay in task-based fMRI time courses, and, thus, the slice-timing correction is mandatorily included in the fMRI preprocess pipeline, especially for event-related studies. Nevertheless, we found that all indices were statistically unaffected by the typical correction method (Figs. 2 and 3 and Table 1) in the current study, even through different TRs and acquisition durations. Despite that only one interleaved acquisition manner from the most bottom slice was adopted for slice-timing correction in this study, it was tested that insignificant results remained the same when applying any other acquisition manner in the slice-timing correction (interleaved from middle slice or sequential acquisition) (p>0.3). This finding indicates that slow (low-frequency) fluctuations are insensitive to swift timing mismatches between slices. In addition, it implies that spontaneous fMRI fluctuations may reside in an intrinsic limitation to reflect subtle causal propagations of the neuronal signal, within the scale of ms, across the brain. In short, the slice-timing correction minimally affects the CC and ALFFs for the rs-fMRI fluctuations based on the practical TRs used in this study.
TR selections
Three different TRs (2 to 4 sec), used in most connectivity studies, were adopted to estimate the influence of sampling rate on CC and ALFFs. In line with previous investigation comparing two TRs (Van Dijk et al., 2010), no significant CC was found among TRs, either in the fixed time duration or fixed scan number scenario, suggesting that resulting correlation is, relatively, not affected by sampling rates and total acquisition durations given sufficient DOF (>40). In contrast, ALFF, the summation of spectrum amplitudes within 0.01 and 0.1 Hz, was significantly reduced in fixed time duration but significantly raised in fixed scan number with longer TR. This phenomenon showed that the index of ALFF is directly proportional to the total scan number within the observed frequency range and the effective DOF as well. In the fixed scan number scenario, ALFF had a significant positive trend with TR, because the recruited spectral points within the observed frequency range (0.01–0.1 Hz) increased as well (while cut-off frequency decreases with long TR). To prevent the bias comparison, we used fALFF to estimate the percentage weighting of the summed amplitude through the observed frequency range over that through the entire sampling frequency. The slight but significant increase in fALFF (90%, 93%, and 95% corresponding to TR-2 sec, TR-3 sec, and TR-4 sec, respectively) was because the numerator of fALFF was fixed to 0.01–0.1 Hz, while the sampling frequency, the denominator of fALFF (0.25 Hz, 0.167 Hz, and 0.125 Hz corresponding to TR-2 sec, TR-3 sec, and TR-4 sec, respectively), reduces with longer TR. Therefore, providing the connectivity-related signal located within the frequency range of 0.01–0.1 Hz, the fALFF ratio would be affected using different TR values. On the contrary, in the fixed time duration scenario, the insignificance in fALFF demonstrated a fair comparison between different TRs with the same acquisition time, resulting in the same spectral points for each TR in the calculation of ALFF. In comparison with the case of TR-4 sec, the amplitude enhancements in TR-2 sec were found to be evenly distributed throughout the observing frequency range (data not shown). Since the SNR of TR-4 sec was higher than that of TR-2 sec, the reason for inverse association between ALFF and TR remains unclear. Previous studies revealed that ALFF may be an indication of altered physiological conditions (Hoptman et al., 2010; Li et al., 2000), but the biophysical mechanism between ALFF, imaging parameters, and corresponding frequency distributions are yet to be determined. Further investigations are warranted to solve the underlying biophysical issue.
The usage of different flip angles was to fit the maximum SNR at a steady state based on the Ernst angle
Smoothing
Smoothing and normalization (volume-based spatial reformation processes) are generally thought to have little effect on the temporal analysis in functional connectivity calculations. However, according to Worsley's theory, the DOF can be manifested by spatial smoothing, indicating that spatial and temporal features couple and co-vary in the fMRI signal (Worsley, 2005). Such coupling phenomena can also be found in the CC and ALFF observed in this study. With increasing smoother kernel size, the CC was significantly enhanced, whereas ALFF reduced. This indicates that smoothing enhances the similarity of adjacent-voxel time courses (CC) but suppresses fluctuation amplitudes (ALFF), which might be a crucial trade-off when considering attaining consistent connectivity areas or retrieving intrinsic synchrony reflected by time courses. Rigorous considerations should be made for a suitable smooth kernel, as the outcome is highly dependent on it. In our studies through different normalization procedures, the observable significant change across indices was found to be with a smooth kernel of 6 mm (∼1.5 times our image resolution). Though it provides a general observation to calculate an appropriate kernel size, the optimal smooth kernel should depend on the spatial extents of observing brain areas and the applied imaging resolutions. In addition, in the current study, the ROI mask generated from the task-based activation maps, which underwent the smooth kernel of 6 mm, was used for estimating functional indices within the voxels potentially residing in the motor cortex only. To prevent the bias of the smooth kernel, it was not used as a cluster reference to determine ratios of connected/activation areas in the motor cortex.
Normalization
Normalization is a necessary mean to perform group-level analysis but imposes further resampling error and additional spatial correlation on the functional data. Therefore, in the ROI analysis, we used “w/o Norm” (individual space) as the standard reference for the comparison between two other normalization strategies. Generally speaking, though no significance was found between normalization strategies, it should be noted that CCs reduced slightly after performing any normalization (Fig. 5a). This may be caused by additional spatiotemporal noise introduced by resampling analysis (from original 3.4×3.4×4 mm3 imaging resolution resampled to an artificial resolution of 2×2×2 mm3), damping the correlation coefficients across voxels, for both Pre-Norm and Post-Norm in the current study, which can also be applied to the observations of ALFFs. When applying the smoothing process with a small smooth kernel (≤4 mm), ALFF of Prenorm showed substantial between-subject variation, whereas ALFF of Postnorm was close to that of w/o Norm. However, the contrast between Prenorm and Postnorm disappeared if applying a large smooth kernel (>4 mm). Concerning both smoothing and normalization, spatial preprocesses did not change spectral distribution in the low-frequency range, revealed by insignificant fALFF differences in each paired comparison (Fig. 5d). However, they did superimpose additional spatial correlation in the fMRI dataset (Table 2). Across normalization strategies, significant raises of FWHM (p<0.003) were found when applying small smooth kernels. With a large smooth kernel, FWHM of Postnorm was significantly larger than Prenorm and Postnorm (p<0.05). Henceforth, in conducting group-level analysis, we suggest applying Postnorm with a small smooth kernel when targeting subtle small brain areas, such as the thalamolimbic system, for maintaining the intrinsic fidelity of spontaneous fluctuations. Otherwise, if observing cortical networks such as the sensorimotor system, we suggest applying Prenorm with a smooth kernel slightly larger than the original imaging resolution for its finer FWHM and robustness.
Indices for rs-fMRI
Correlation has long been adopted as the key index for functional connectivity studies, as it allows cross-region observations through the choice of different seed points (De Luca et al., 2006; Fair et al., 2007). However, this statistical index implies indirect physiological interactions without direct physiological indications. To this purpose, ALFF was introduced to measure directly within-voxel variations reflecting signal strength in the frequency domain (Zang et al., 2007), whereas fALFF demonstrates the percentile of signal within a certain frequency band versus the whole (Zou et al., 2008). The literature also supports that ALFF/fALFF presumably show physiological conditions in the temporal dynamics, such as schizophrenia, mild cognitive impairment, and neuromyelitis optica (Han et al., 2011; Hoptman et al., 2010; Liu et al., 2011). Since the underlying mechanism of functional connectivity currently remains a mystery, it is believed that ALFF and fALFF provide alternative perspectives and merits on functional connectivity beyond correlation and allow us to evaluate the effects of preprocessing methods in the current study.
At last, since the preprocessing methods in fMRI analysis are universal for the entire brain, similar preprocessing effects on spatiotemporal domains are supposed to globally affect all networks underwent the same analysis. Here, we chose only the motor network as the target of interest in the current study for simplicity of presentation. Similar preprocessing effects can be found in other networks such as auditory and default-mode networks. Furthermore, any nonlinear transformation in normalization might introduce additional spatial effects and result in the diversity of spatial correlations across voxels. Under such circumstances, a preferred strategy is to evaluate and adjust the spatial correlation to a fixed FWHM level using the smoothing method after normalization, for example, 3dBlurToFWHM function in AFNI.
Conclusion
Typical preprocessing methods in rs-fMRI signal were estimated based on three functional indices CC, ALFF, and fALFF. Our results suggested that the slice-timing correction has a minimal effect on functional connectivity among the preprocessing procedures. Choosing different TR would significantly affect the results of ALFFs, but not on CC. Caution should be exercised while performing smoothing and normalization on the rs-fMRI signal, because they significantly influence both CC and ALFF results. When targeting large and robust functional networks, the normalization method before connectivity analysis and using a smooth kernel encompasses at least one imaging voxel would provide consistent spatial extent. For observing functional connectivity residing in subtle brain areas, performing normalization after calculating CC or ALFFs combined with a small smooth kernel may be preferred to preserve the connectivity indices. Though the motor-network observations were based on seed-correlation analysis, the evaluation results can be applicable to other brain networks and other rs-fMRI analyses, for example, independent component analysis or small-world analysis, on rs-fMRI fluctuations.
Footnotes
Acknowledgment
This study was supported in part by National Science Council of Taiwan (NSC98-2917-I-564-158, NSC98-2923-B-010-001-MY3, NSC100-2628-E-010-002-MY3, NSC100-2517-S-004-001-MY3), National Health Research Institute (NHRI-EX100-9813EC), Academia Sinica (AS-100-TP-AC1) and a grant from Ministry of Education, Aim for the Top University Plan. The authors also acknowledge MR support from the MRI Core Laboratory of National Yang-Ming University, Taiwan.
Author Disclosure Statement
No competing financial interests exist.