
Abstract
The pressing need to better understand human brain organization is appreciated by all who have labored to explain the uniqueness of human behavior in health and disease. Early work on the cytoarchitectonics of the human brain by Brodmann and others accompanied by several centuries of lesion behavior work, although valuable, has left us far short of what we need. Fortunately, modern brain imaging techniques have, over the past 40 years, substantially changed the situation by permitting the safe appraisal of both anatomical and functional relationships within the living human brain. An unexpected feature of this work is the critical importance of ongoing, intrinsic activity, which accounts for the majority of brain's energy consumption and exhibits a surprising level of organization that emerges with dimensions of both space and time. In this essay, some of the unique features of intrinsic activity are reviewed, as it relates to our understanding of brain organization.
Introduction
U
It is arguably the case that the introduction of human imaging in the 1970s, first with X-ray computed tomography (Hounsfield, 1973) followed by positron emission tomography and magnetic resonance imaging (MRI), created a critical bridge between neuroscience more generally and the human brain (for a recent historical review, see Raichle, 2009). Since the introduction of functional MRI (fMRI) in 1992 (Bandettini et al., 1992; Frahm et al., 1992; Kwong et al., 1992; Ogawa et al., 1992), close to 15,000 papers have been published using fMRI to study functional brain organization largely in humans. Functional fMRI has been complimented more recently by the use of diffusion tensor MRI to map, with increasing sophistication, the large fiber pathways in the brain (Johansen-Berg and Rushworth, 2009; Wedeen et al., 2005), resulting in more than 2000 published papers on the subject.
Beginning with the clarion call of Crick and Jones (1993) and stimulated by the subsequent prospect of obtaining adequate functional and anatomical data through imaging, the call for a “Human Connectome” was made by Sporns and colleagues (Sporns, 2011; Sporns et al., 2005). The response has been a recently funded National Institutes of Health project to create a human connectome (
A Brief History of Intrinsic Activity
The existence of ongoing or intrinsic activity in the brain was quite possibly first noted by Hans Berger when he introduced electroencephalography in humans in 1929 (Berger, 1929; for an English translation of this work, see Gloor, 1969). In referring to the spontaneous activity in the electroencephalogram (EEG), Berger (1929) asked “Is it possible to demonstrate the influence of intellectual work upon the human electroencephalogram, insofar as it has been reported here?” He then concluded that “Of course, one should not at first entertain too high hopes with regard to this, because mental work, as I explained elsewhere, adds only a small increment to the cortical work which is going on continuously and not only in the waking state.” As has been demonstrated in subsequent research, extensive averaging of the EEG has been used to significantly attenuate if not eliminate this seemingly random, ongoing activity, leaving only predictably occurring and obviously less-dominant, task-induced changes or event-related potentials as they are known generally.
The potential physiological significance of the brain's ongoing intrinsic activity was noted by Bishop (1933) during experiments in which he observed cyclic changes in visual cortex excitability of the rabbit during stimulation of the optic nerve. In commenting about this phenomenon, he presciently observed that “In general, it is not necessary to infer that each individual impulse traveling up a fiber from the retina arrives as a unit impulse in the cortex, and registers there as such. Rather, we would look upon the cortex as being in constant activity, the physiological activity of the whole network of neurons bearing some direct relationship to the ‘present state’ of the animal's complex behavior which is sometimes referred to as his ‘mental state.’” This echoes an idea put forth several decades earlier by the physiologist Brown (1914) that the brain's operations are mainly intrinsic, involving the acquisition and maintenance of information for interpreting, responding to, and even predicting environmental demands (for a recent review, see Raichle, 2010b).
From a functional imaging perspective, the remarkable properties of the brain's intrinsic activity were first noted by Biswal and colleagues (1995) at the Medical College of Wisconsin. In their 1995 paper, they observed that the “noise” in the spontaneous fMRI blood oxygen level dependent (BOLD) signal exhibited striking patterns of spatial coherence corresponding, in their case, to the sensorimotor regions of the cerebral cortex (Fig. 1). Remarkably, these organized patterns of activity occurred in the absence of any overt motor activity. Although some worried that this finding might be of cardiac or respiratory origin (Birn et al., 2006; Chang et al., 2009; Wise et al., 2004), it has become clear that this activity, now uniquely seen with fMRI BOLD imaging, is indeed of fundamental importance for brain function as neurophysiologists have been suggesting for some time (e.g., see Bishop, 1933; Buzsaki, 2006; Lashley et al., 1951; Llinas, 1988; Vern et al., 1997; Yuste et al., 2005).
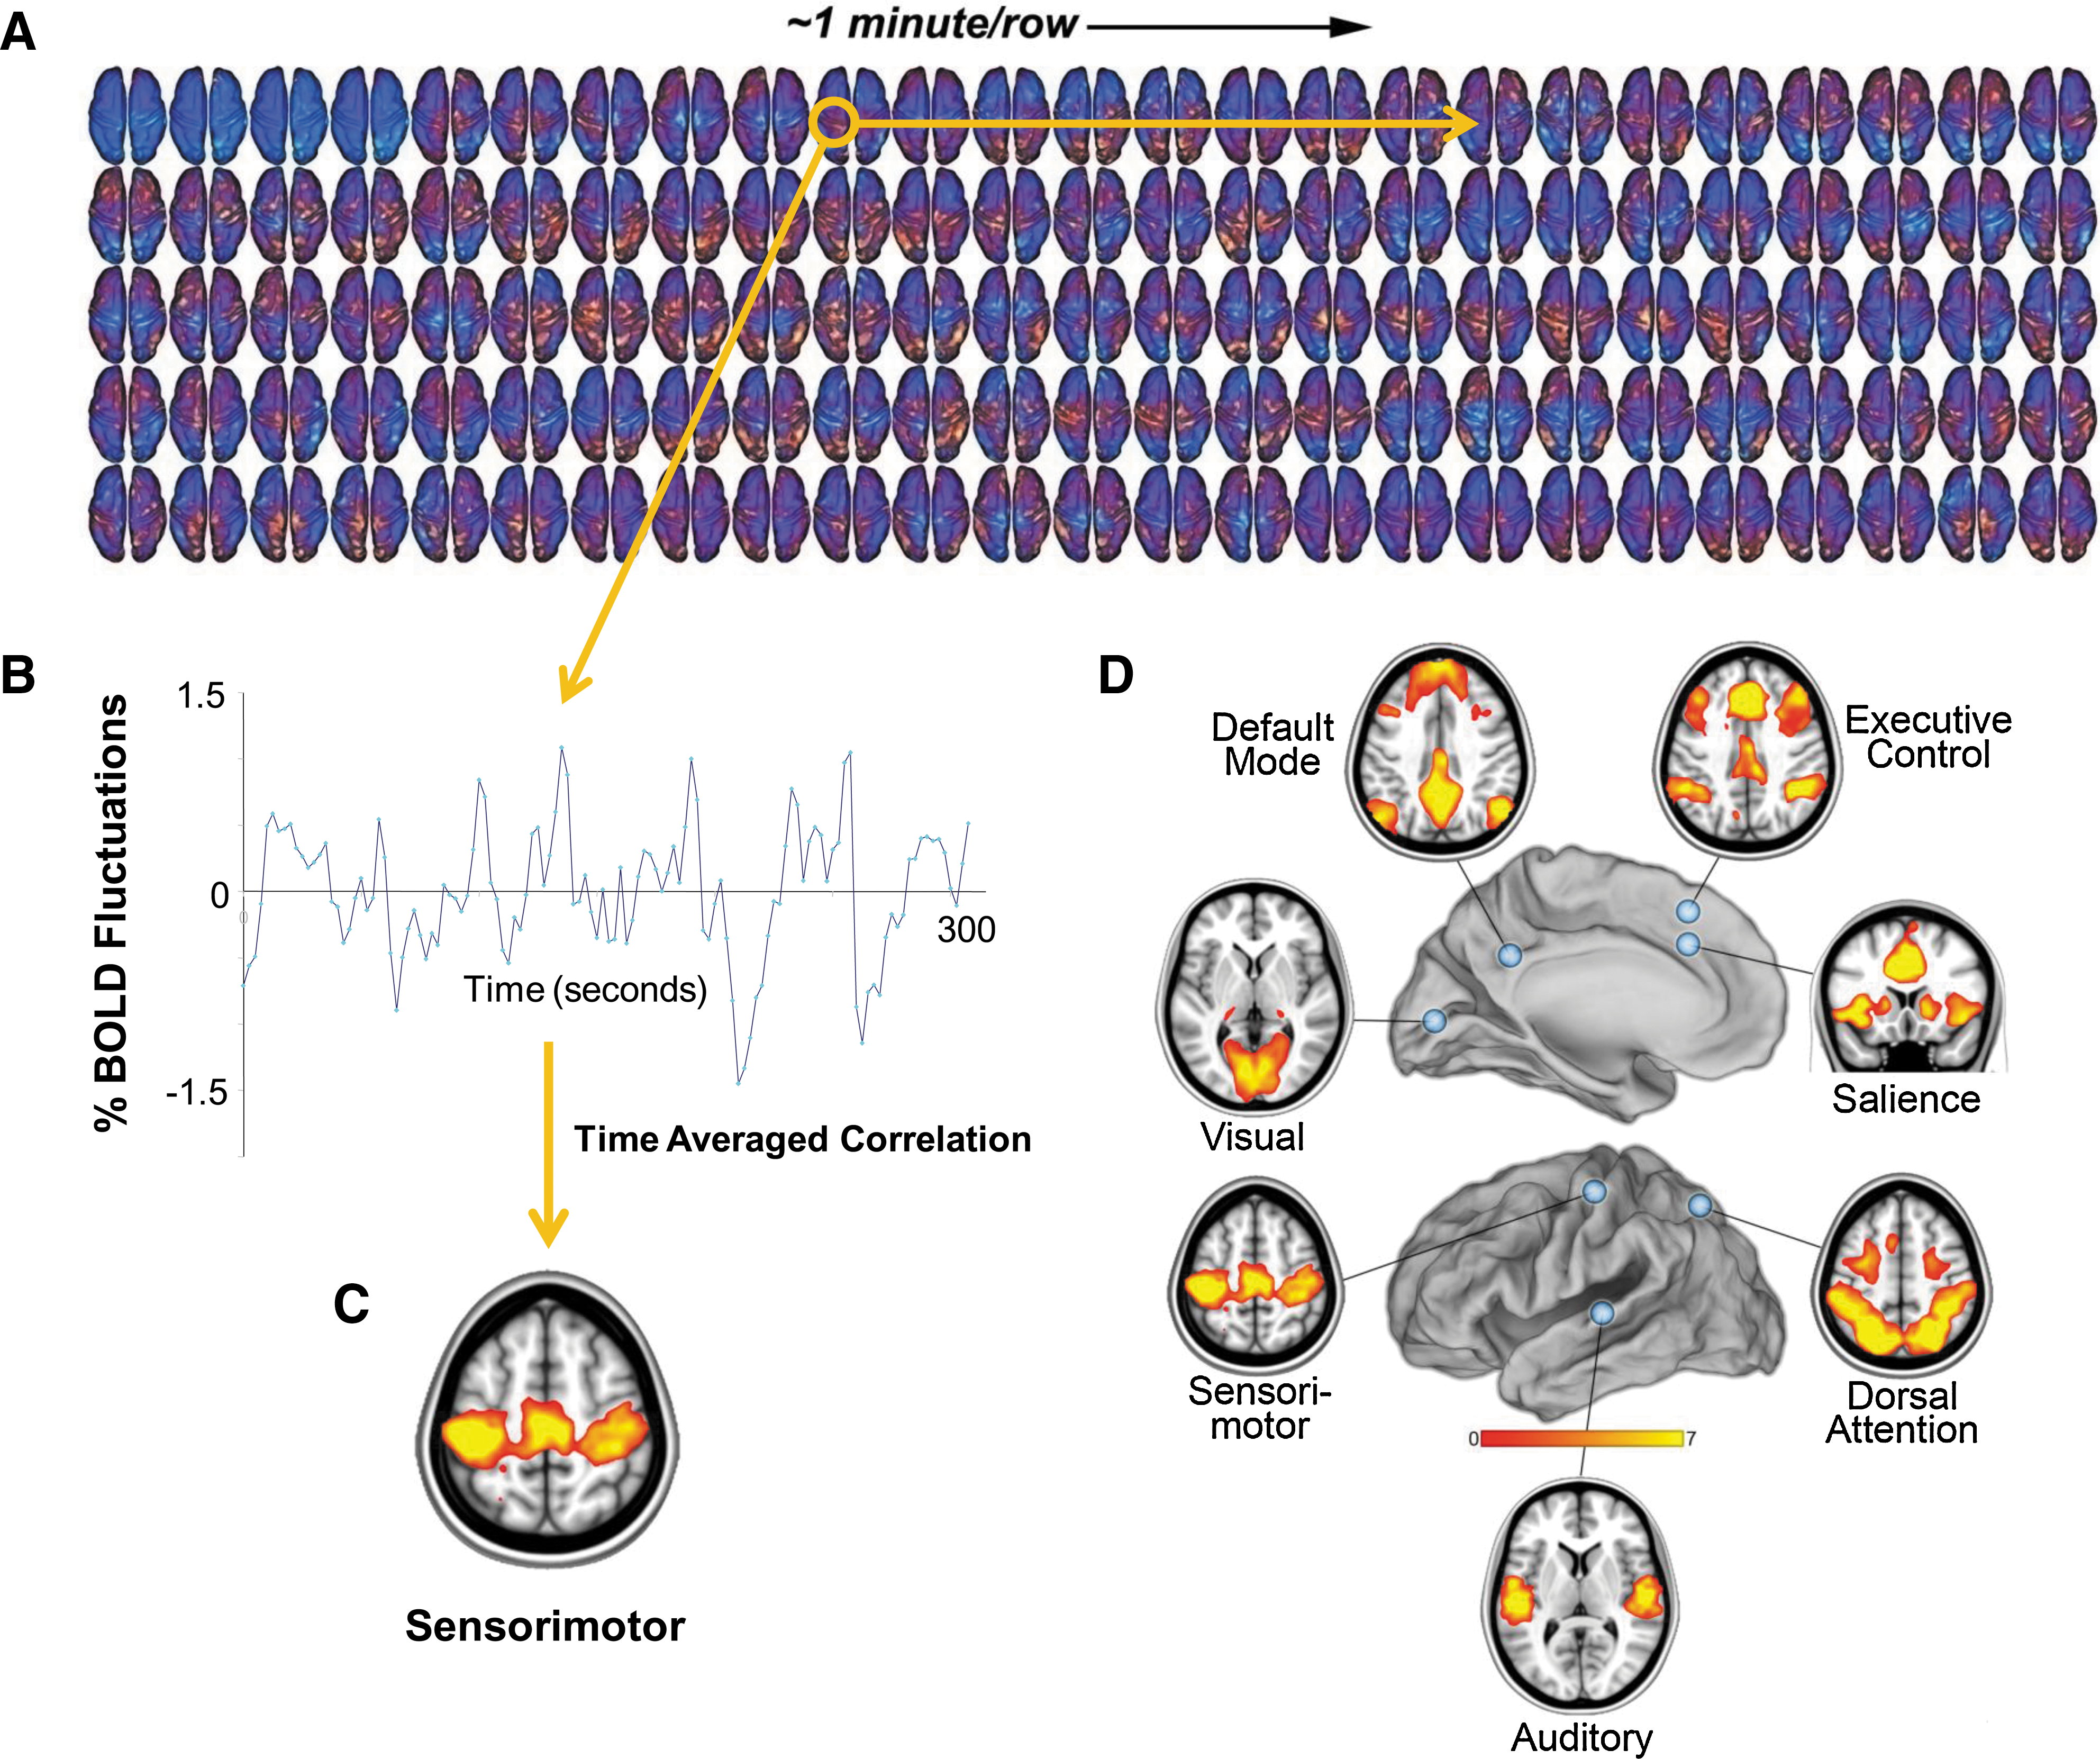
From the fluctuating patterns of intrinsic activity seen in the human brain with fMRI BOLD imaging, striking patterns of spatial coherence within known brain systems can be extracted. A single-subject example of data from which these patterns are derived is shown
Some General Observations
Although our understanding of the brain's intrinsic activity is still very much a work in progress, a number of observations made about these surprising patterns of spatial coherence appear reasonably well established.
First, functionally related, intrinsic activity likely accounts for the major cost, in terms of energy, of running the brain. Surprisingly little cost is added by task-evoked activity (Raichle, 2010b; Raichle and Mintun, 2006; Sokoloff et al., 1955). A full accounting of the components of the cost of intrinsic activity awaits further research [a circumstance that has prompted me to refer to it as the brain's “dark energy” (Raichle, 2010a)]. But the discovery of these remarkable spatial and temporal patterns in the spontaneous activity of the brain have been definitely an important catalyst for new research at many levels trying to account for this high cost (for a more detailed discussion, see Raichle, 2010b).
Second, the spatial organization of intrinsic activity appears to transcend levels of consciousness, being present under anesthesia in humans (Greicius et al., 2008), monkeys (Vincent et al., 2007), and rats (Lu et al., 2007) and also during the early stages of sleep in humans (Fukunaga et al., 2006; Larson-Prior et al., 2009). These observations make it unlikely that the patterns of coherence and the intrinsic activity they represent are solely the result of unconstrained, conscious cognition [i.e., mind wandering or day dreaming (Christoff et al., 2009)].
Third, although resting state patterns of coherence do respect patterns of anatomical connectivity in both the monkey (Vincent et al., 2007) and human brain (Zhang et al., 2008), it is clear that they are not constrained by these anatomical connections. Thus, the absence of monosynaptic connections between brain areas [e.g., right and left primary visual cortex (Vincent et al., 2007)] does not preclude the existence of functional connectivity as expressed in the maps of resting state coherence. The actual details of how these multisynaptic relationships operate remains to be established.
Fourth, the strength of coherence between nodes within systems varies with age (Fair et al., 2007, 2008), experience (Bartels and Zeki, 2005; Jiang et al., 2004; Lewis et al., 2009; Sun et al., 2007), and disease (Zhang and Raichle, 2010). Developmental changes have been particularly well demonstrated in the default mode network (Fair et al., 2008) and the brain's control systems (Fair et al., 2008). Such observations are consistent with the role of experience (Lewis et al., 2009) and, possibly, spontaneous activity itself in sculpting and maintaining these functional relationships in the human brain (Huberman et al., 2008; Yuste, 1997). At the other end of the life spectrum, data suggest that the young adult pattern, for example, in the default mode network (Buckner et al., 2008; Raichle et al., 2001), may recede as one passes into the sixth decade of life and beyond (Andrews-Hanna et al., 2007) even in healthy older persons. Even more interesting are three recent studies demonstrating disruption in default mode network coherence in cognitively normal older persons harboring default mode network amyloid plaques (Hedden et al., 2009; Sheline et al., 2009; Sperling et al., 2009). In this regard, it should be recalled that the default mode network appears to be a major target of Alzheimer's disease (Buckner et al., 2005). Disruption in the resting state coherence between nodes of a system may well prove to be a sensitive early biomarker of incipient disease (Zhang and Raichle, 2010).
Fifth, spontaneous fluctuations in the BOLD signal contribute significantly to both variability in evoked signals (Fox et al., 2006) and variability in the associated behavior (Fox et al., 2007). These observations become important as we consider the neurophysiologic correlates of the spontaneous BOLD fluctuations later.
Finally, observing that major brain systems can be identified by their unique patterns of spatial coherence (Fig. 1) tends to obscure the fact that these systems must operate in an integrated manner. It seems reasonable to ask whether this integration only occurs during a task, as has been demonstrated countless times, or whether it is present in the resting state as well. Figure 2 addresses this question by arranging system-specific regions of interest is a cross-correlogram with unique regions of interest representing each system occupying a position along the diagonal. What should be noted from this is that relationships exist not only within systems, as expected, but also among the systems even in the resting state. Some of these relationships are expressed as positive correlations and others as negative correlations, an interesting feature first reported elsewhere (Fox et al., 2005, 2009).
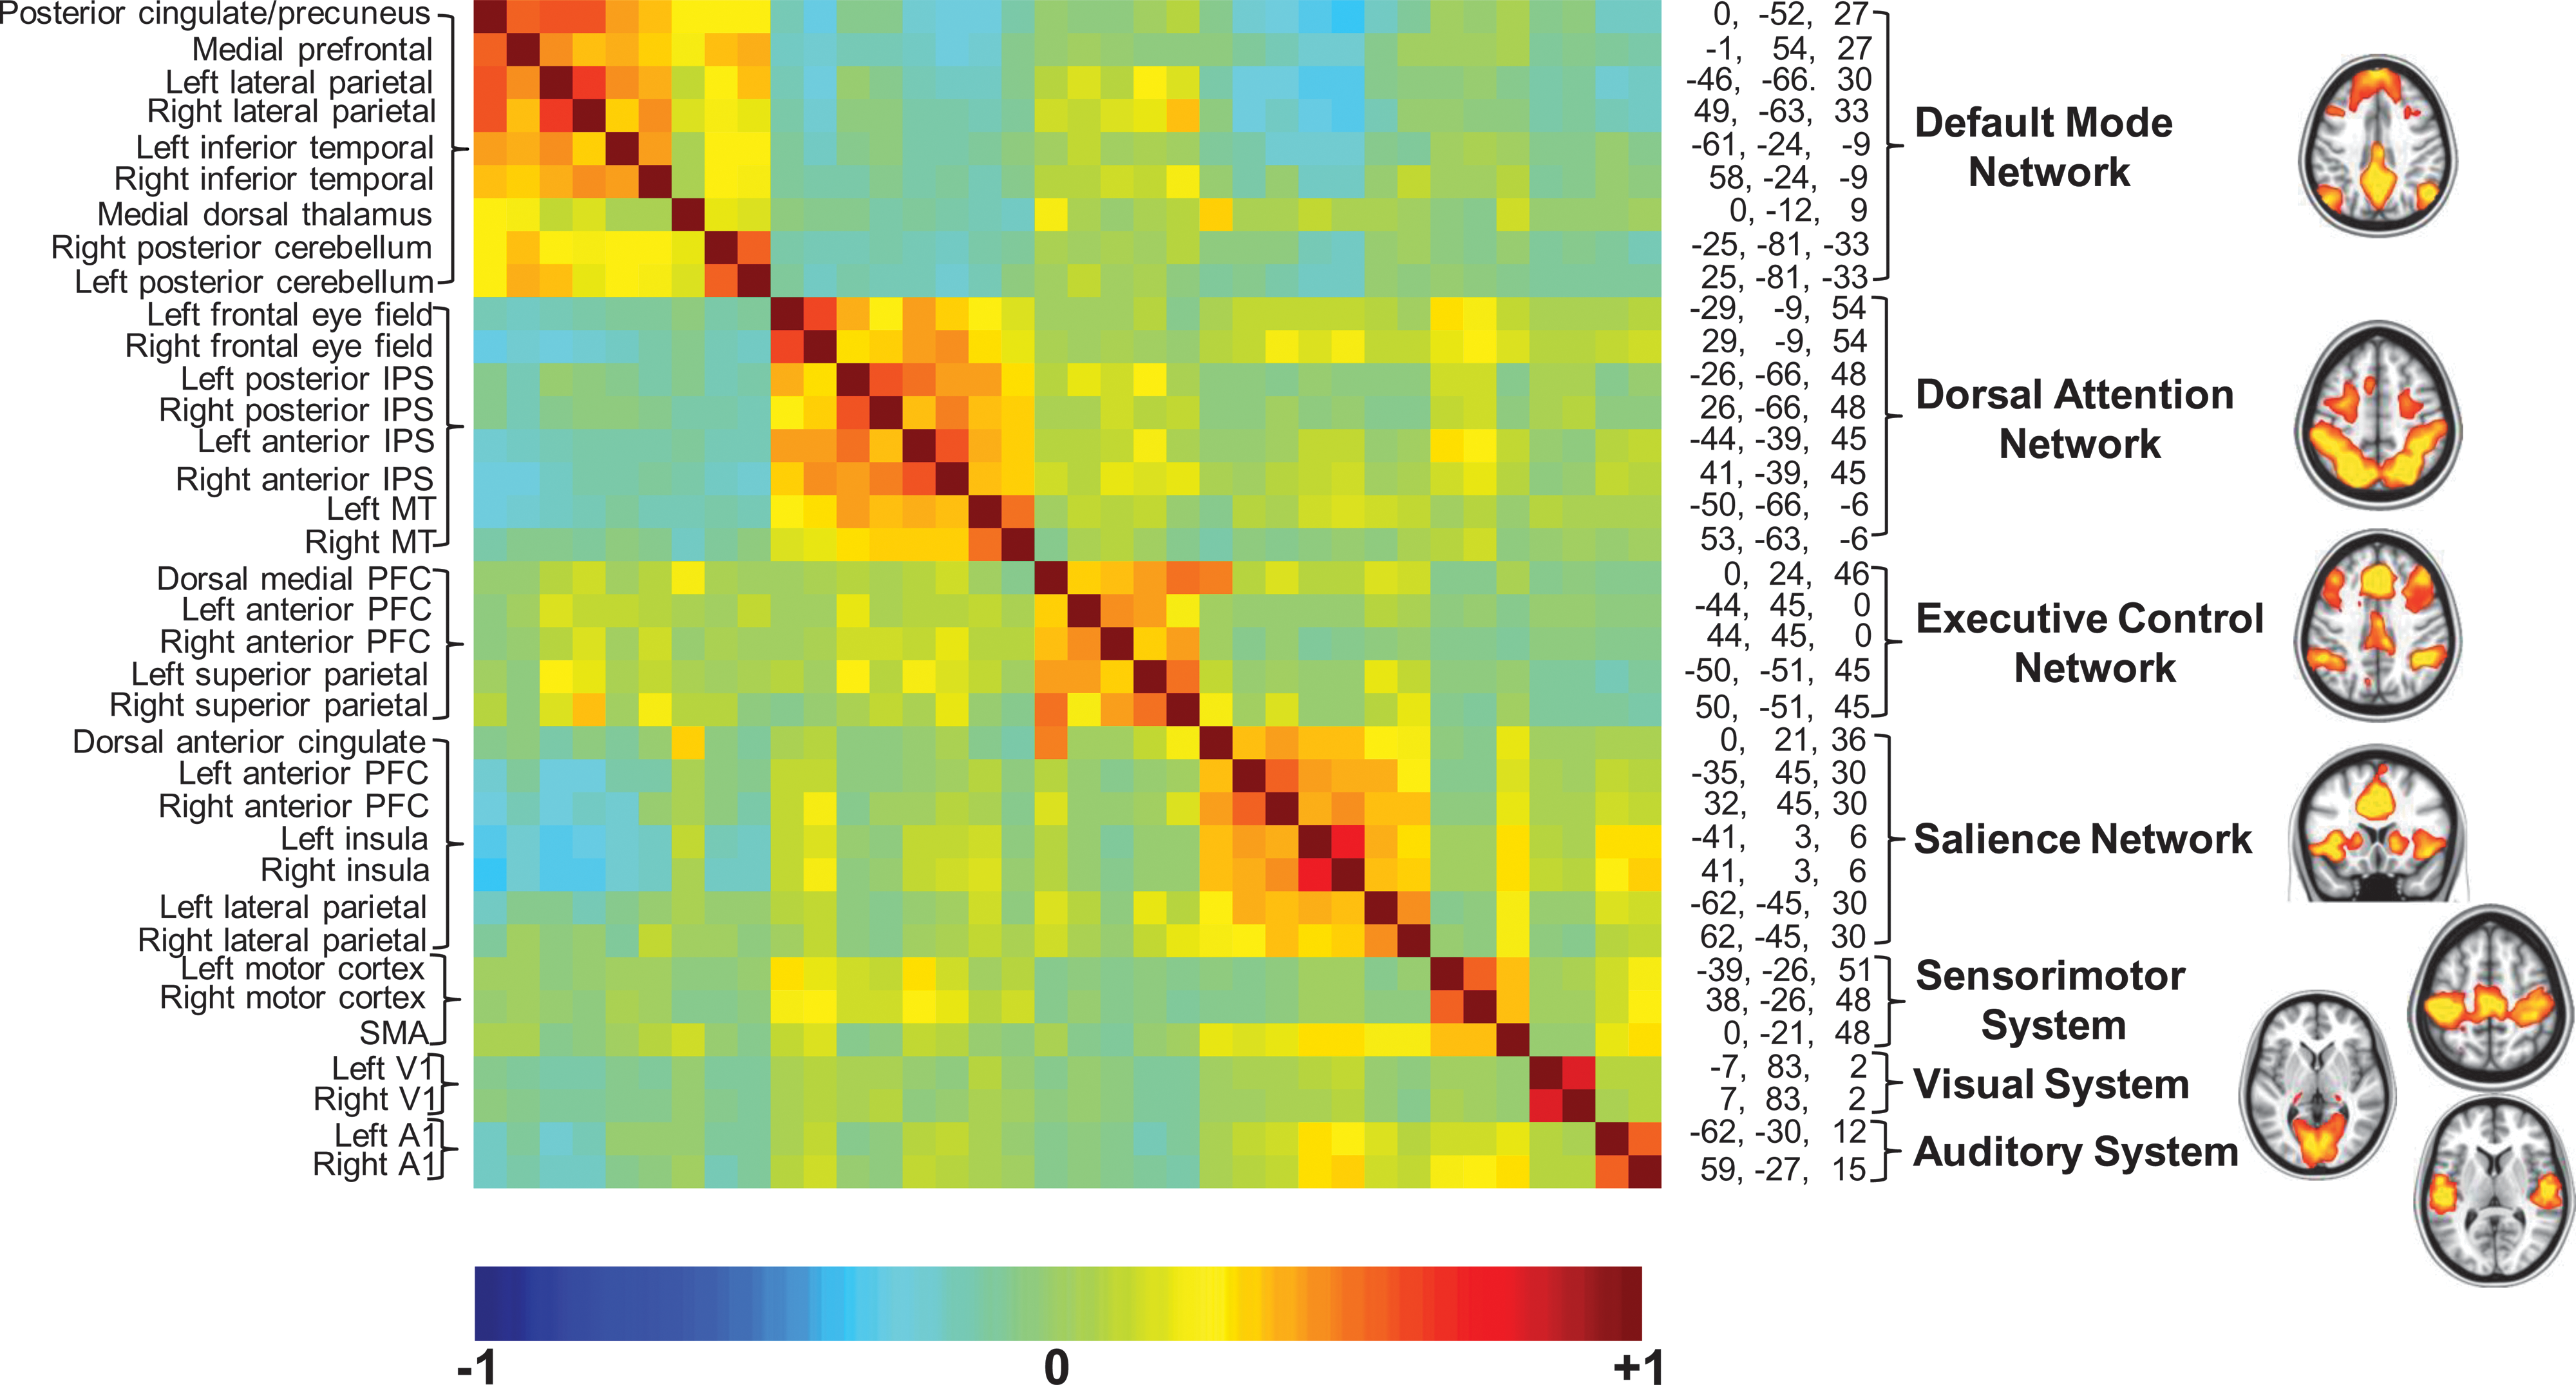
A cross-correlogram constructed from regions of interest within the seven brain networks shown in Figure 1. The data represent a 30 min average from a normal adult male volunteer resting quietly in 3T scanner (Siemens Trio) but awake. The names of the regions are shown along the left and their spatial coordinates are shown along the right margin of the correlogram. The diagonal of the correlogram represents the correlation of each region with itself. It should be noted that while correlations within networks appear distinctive in this presentation, relationships among networks (both positive and negative) are also prominent, emphasizing the integrated nature of the brain's functional organization, which is sometimes overlooked when viewing images of the type shown in Figure 1 and on the right. An additional important feature of the data presented in this cross-correlogram is its temporal dynamics. Although not feasible to present in the form of static images, these temporal dynamics in movie format may be downloaded from
Remarkable as is the functional organization emerging from resting state studies of the fMRI BOLD, the story can be developed more fully by relating it to the underlying neurophysiology.
Neurophysiology
There has been an active effort to ascertain the electrical correlates of the fMRI BOLD signal (for summaries of this work from different perspectives, see Khader et al., 2008; Logothetis, 2008; Raichle and Mintun, 2006). The conclusion from this work is that the fMRI BOLD signal is best correlated with local field potentials (LFPs). LFPs are complex signals arising from the integrated electrical activity in pre- and postsynaptic terminals of the brain and are recorded with microelectrodes placed within brain tissue. Brain electrical activity recorded from the scalp with EEG or from surface of the brain with electrocorticography constitutes a summation of a population of LFPs. LFPs are conventionally described in terms of their band-limited frequency components (delta, 1–4 Hz; theta, 4–8 Hz; alpha, 8–12 Hz; beta, 12–24 Hz; and, gamma, >24 Hz).
Given the relationship between LFPs and BOLD, it is important to focus on those LFP phenomena that exhibit frequencies similar to that of spontaneous BOLD fluctuations (i.e., 0.01–4.0 Hz). Two LFP phenomena fall into this category: fluctuations in the power of higher frequencies (i.e., their power spectral density) where particular attention has been paid to the gamma frequency band (Leopold et al., 2003) because of its association with cognition (Fries, 2009; Uhlhaas et al., 2009); and raw frequencies that approximate that of the spontaneous BOLD signal. These include the delta band (1–4 Hz), up-an-down states [∼0.8 Hz; (Hahn et al., 2006; Petersen et al., 2003; Steriade et al., 1993; Watson et al., 2008)], and infraslow fluctuations (ISFs) [0.01 and 0.1 Hz (Monto et al., 2008; Vanhatalo et al., 2004)]. ISFs are sometimes called direct current potentials. ISFs are much less often recorded because of the amplifier requirements and concerns about artifacts (Khader et al., 2008). Often all three (delta, up-and-down states, and ISFs) are subsumed under the designation slow cortical potentials (SCPs) (He et al., 2008; Rockstroh et al., 1989). The term SCPs will be used in this article, recognizing that it likely includes all three phenomena to an as-yet unspecified extent.
The research shows that the spontaneous fluctuations in the BOLD signal are best correlated with LFP activity in the range of the SCPs (He and Raichle, 2009; He et al., 2008; Lu et al., 2007). As is the case with the spontaneous fluctuations in the fMRI BOLD signal, the spatial patterns of coherence exhibited by SCPs are maintained across levels of consciousness ranging from wakefulness to rapid eye movement (REM) and slow wave sleep (He et al., 2008) and during anesthesia (Breshears et al., 2010; Lu et al., 2007). In contrast, power in the gamma frequency band is only correlated spatially with the BOLD signal during wake and REM sleep (He et al., 2008; see also Nir et al., 2008). This finding is consistent with the role of gamma-band coherence in the mental activities associated with conscious awareness (Fries, 2009; Uhlhaas et al., 2009).
Knowing that SCPs and spontaneous fluctuations in the BOLD signal are related provides an important bridge to additional important neurophysiology (e.g., see Buzsaki and Draguhn, 2004; Monto et al., 2008; Rockstroh et al., 1989; Schroeder and Lakatos, 2008; Varela et al., 2001). Emerging from this literature are several ideas relevant to the interpretation of the fMRI BOLD signal in the resting state.
SCPs and their BOLD counterpart likely represent fluctuations in cortical excitability (for reviews, see Birbaumer et al., 1990; Buzsaki, 2006; Rockstroh et al., 1989; Schroeder and Lakatos, 2008; Vanhatalo et al., 2004). Fluctuations in cortical excitability have remarkable effects on the elements of the LFP frequency spectrum, including the spiking activity of neurons (Lakatos et al., 2005; Montemurro et al., 2008; Petermann et al., 2009). This is known as “cross-frequency, phase-amplitude coupling” that denotes a relationship between two distinct frequency bands in which the amplitude of the higher frequency is dependent on the phase of the lower frequency. For example, the amplitude of theta activity (4–7 Hz) is influenced by the phase of delta activity (1–4 Hz). In turn, the amplitude of alpha activity (8–12 Hz) is influenced by the phase of theta activity and so on up the frequency spectrum of brain electrical activity all the way to spikes. A very good example of this comes from the work of Monto and colleagues (2008) from Helsinki and is shown in Figure 3.

This figure demonstrates that cross-frequency, phase-amplitude coupling of EEG oscillations (1–40 Hz) are nested in the ISFs of the EEG (0.01–0.1 Hz). The correlation of the 1–40 Hz oscillation amplitudes (colored lines) with the ISFs is similar to that of the behavior (black line). The ISF phase ranges from −π to π in bins of 10 percentiles. The thick gray line denotes a descriptive cycle of the ISFs. Reproduced with permission from Monto et al. (2008). EEG, electroencephalogram; ISFs, infraslow fluctuations.
In the resting state and during sleep as well, brain electrical activity can appear largely arrhythmic (sometimes referred to as “scale free” because of the absence of specific oscillations in, for example, the alpha and theta bands); this frequency spectrum can be best described using a power law [i.e., 1/f a (He et al., 2010)]. Despite the apparent absence of distinctive oscillations, the cross-frequency, phase-amplitude coupling can be found in brain scale-free activity as well (He et al., 2010), reinforcing the idea of its fundamental importance in brain functional organization.
Spatially coherent, rhythmic variations in cortical excitability and associated cross-frequency, phase-amplitude coupling provides a logical means of coordinating ongoing functional activity and also provides a convenient explanation for the variability in evoked responses (Arieli et al., 1996; Bishop, 1933; Fiser et al., 2004; Fox et al., 2006) and behavioral performance (Birbaumer et al., 1990; Fox et al., 2007; Gilden et al., 1995; Lakatos et al., 2008; Monto et al., 2008), which are both influenced by changes in cortical excitability. Of interest is how and why the brain uses these dynamic features of its functional organization. For many the answer is “prediction” (Bar, 2011).
Prediction
In the opening of his book on Rhythms in the Brain (Buzsaki, 2006), Gyuri Buzsaki said it well: “Brains are foretelling devices and their predictive powers emerge from the various rhythms they perpetually generate.” Operating largely nonconsciously, brains seek predictable regularities from impoverished information and implement organized, learned responses while retaining the ability to pause, adapt, and learn anew. Examination of the temporal dynamics of the brain's ongoing rhythmic activities provides an important window for us to explore the question of how prediction might be implemented. If the brain is effectively a predictive device then anticipation must be a component of its operation. And, indeed, SCPs and their BOLD counterpart provide evidence in support of just such a hypothesis.
An important early observation in this regard was that of Walter and colleagues (1964) at the Burden Neurological Institute in the United Kingdom. Their work on event-related potentials focused on the relationship between two temporally related stimuli: a warning stimulus that alerted their subject to the impending appearance of a second (imperative) stimulus to which the subject was expected to respond, usually with a button press. They noted following the presentation of the warning stimulus a slow negative potential, presumably related to increased cortical excitability, which appeared and lasted until the subject's response to the second stimulus (often many seconds). They called this negative SCP a contingent negative variation (CNV), which predictably reoccurred as long as there was a high probability that the warning stimulus predicted the imperative stimulus.
After its discovery, much work was done on the CNV and its relation to behavior (nicely summarized in Birbaumer et al., 1990; Rockstroh et al., 1989). More recently, there has been a concordance of findings on the functional anatomy of the CNV explored with task-based fMRI (e.g., see Gomez et al., 2007; Lutcke et al., 2009; Scheibe et al., 2010)], but rarely (see Nagai et al., 2004) a connection has been sought between anticipatory signals such as the CNV and spontaneously occurring SCPs, which are known to influence information processing (e.g., see Birbaumer et al., 1990; Lakatos et al., 2008; Monto et al., 2008; Vanhatalo et al., 2004).
A productive way to bridge this gap in our understanding is to begin with a very interesting series of imaging studies on attention that have focused on changes in brain activity preceding the appearance of a to-be-attended sensory stimulus. Two papers (Kastner et al., 1999; Ress et al., 2000) are illustrative. In both studies cued, covert attention produced significant increases in fMRI-measured activity in visual cortex independent of the presence or absence of a visual stimulus. A particularly dramatic example of this from the work by Ress et al. (2000) is shown in Figure 4, where cue-evoked BOLD signals in the presence and absence of a cue-predicted visual stimulus are indistinguishable.
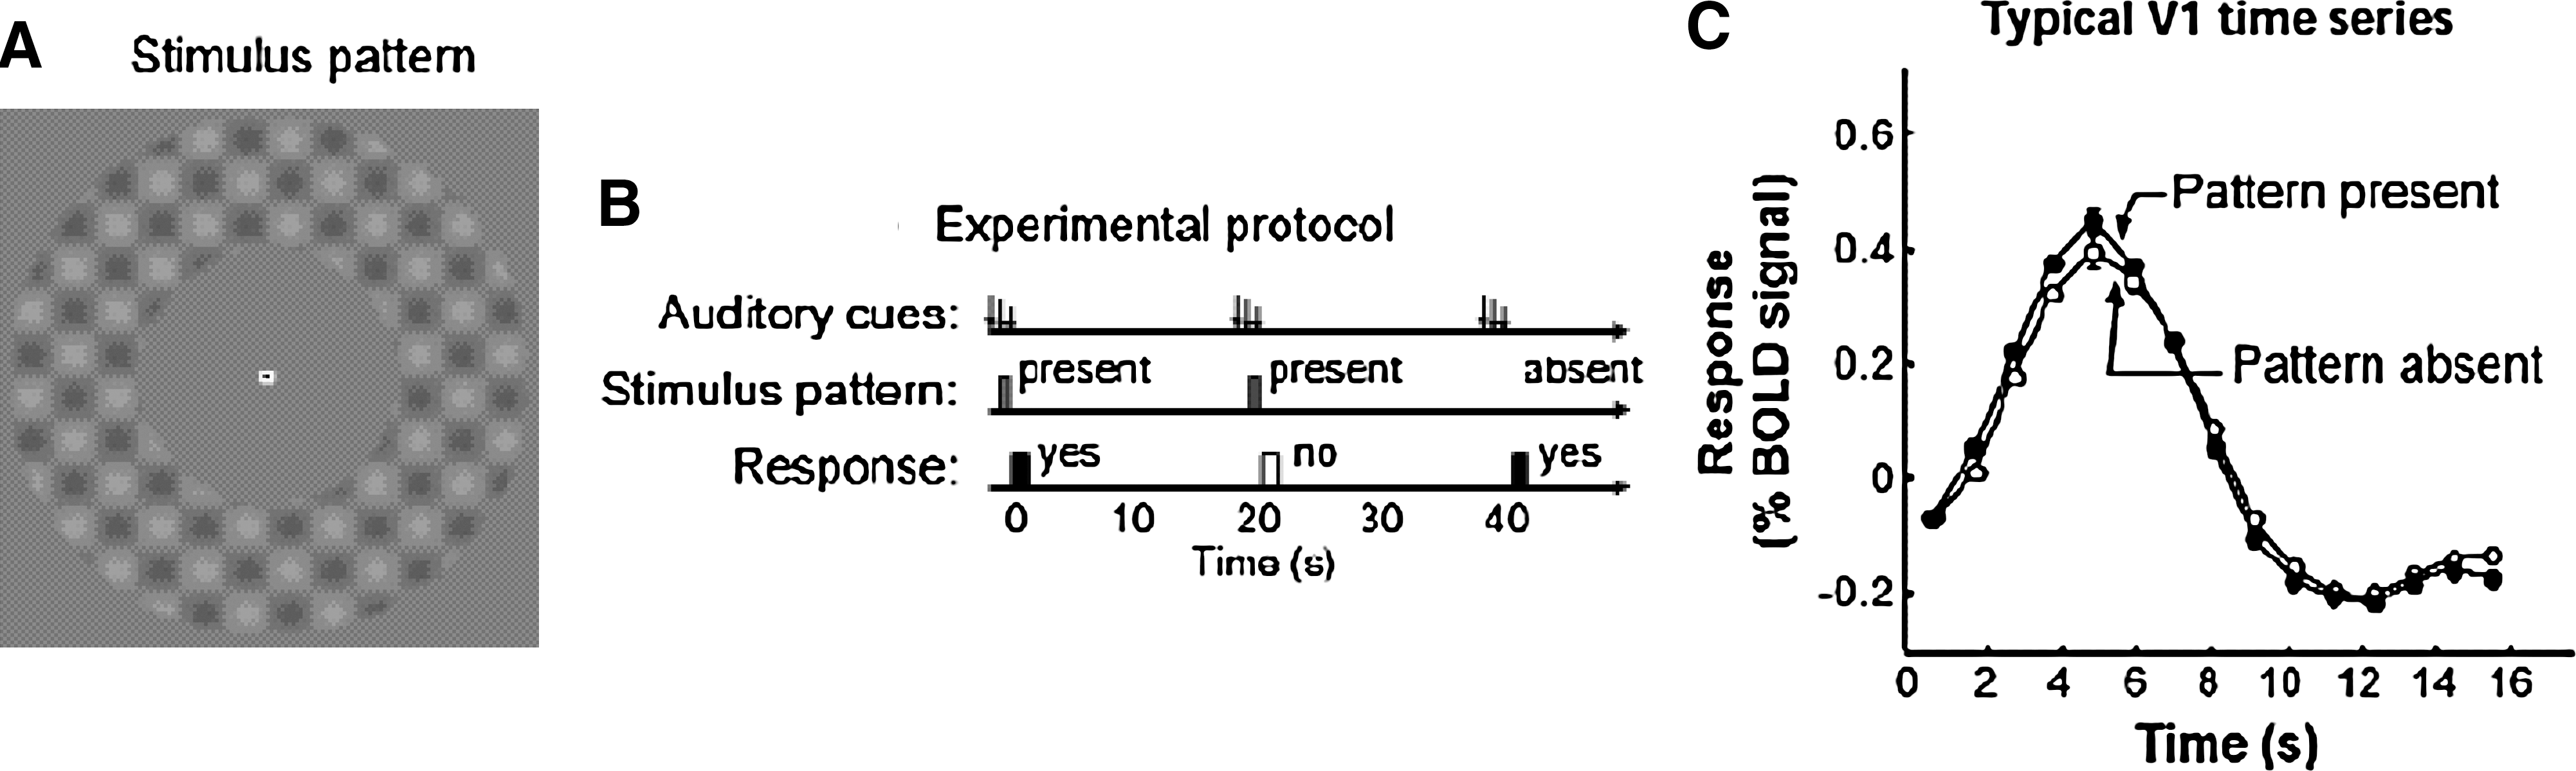
This figure depicts an fMRI experiment in which normal subjects heard a short auditory tone every 20 sec. In half the trials (randomly interleaved), a low-contrast pattern
Consistent with an earlier work on the CNV (Rockstroh et al., 1989), these anticipatory changes in brain activity are malleable in terms of changing temporal parameters in the experiment (Sirotin and Das, 2009), predicting the subject's performance (Giesbrecht et al., 2006; Li et al., 2008; Ress et al., 2000; Sapir et al., 2005), involving activity increases as well as decreases (Sylvester et al., 2008), and not confined to early sensory cortices (Kastner and Ungerleider, 2001). Does a similar mechanism underlie preparatory and evoked BOLD signals as suggested by Sylvester and colleagues (2009) and how might this relate to ongoing, spontaneous activity? The answer may lie in a further examination of the underlying physiology.
The neurophysiological work of Charles Schroeder and colleagues in humans and nonhuman primates (reviewed in Schroeder and Lakatos, 2008; Schroeder et al., 2008, 2010; illustrated in Fig. 5) is particularly illuminating in how to conceptualize a link between spontaneous, cued-attentive, and stimulus-evoked activity. In detail, they posit that “attentional bias in the phase of neocortical excitability fluctuations represents a fundamental mechanism for tuning the brain to the temporal dynamics of task-relevant event patterns” (Besle et al., 2011). On this hypothesis, the dynamic organization of the brain into large-scale, yet flexible networks based on SCP-mediated fluctuations of neuronal excitability allows the tuning of these network structures to the changing temporal dynamics of behaviorally relevant event streams (Figs. 1 and 2). Through cross-frequency, phase-amplitude coupling, the full range of brain electrical activity is represented in this dynamic organization scheme. As a result, responses are enhanced and performance is improved (see also Bressler et al., 2008; Monto et al., 2008; Sapir et al., 2005; Sylvester et al., 2009). The fMRI BOLD signal represents a unique but highly focused (i.e., frequency limited) view of these events.

This figure schematically illustrates three phenomena of interest in understanding the brain's functional organization from a neurophysiological perspective.
Much if not all work on entrainment (phase-locking) of ongoing electrical activity and the attendant cross-frequency, phase-amplitude coupling has involved active, goal-directed tasks involving predictable sensory stimuli. Yet, cross-frequency, phase-amplitude coupling occurs “spontaneously” in intracortical LFPs (He et al., 2010; Lakatos et al., 2005). This raises the question of what we mean by attention somewhat more broadly defined. Are we not always attending? Could most attending be nonconscious?
If these suppositions are correct, then capturing the relationship between cross-frequency, phase-amplitude coupling experimentally in a goal-directed task, while serving to demonstrate the dynamic and purposeful nature of the brain's intrinsic activities under experimentally controlled conditions, should not be used to define attention as solely confined to goal-directed tasks involving conscious awareness. Given the narrow window of conscious awareness (Anderson et al., 2005; Norretranders, 1998), it is hard to imagine otherwise.
Finally, we need to rethink our understanding of the fMRI BOLD signal in terms of its relationship to task-evoked activity. We have struggled in the past to relate the sluggish responsiveness of the BOLD signal to rapidly changing electrical events in the brain all the while ignoring the fact that the temporal characteristics of the fMRI BOLD signal match almost perfectly the SCPs and other functionally important cellular and biochemical processes (for views of the relevant cellular and biochemical processes, see Raichle, 2010b; Vaishnavi et al., 2010). We should ask not whether task-induced changes in the fMRI BOLD signal represent sluggish responses to rapidly changing, evoked electrical events but rather whether they represent ongoing, organized changes in excitability (i.e., SCPs) predicatively maintaining and adjusting the brain's functional organization. On this view, a strict distinction between intrinsic and evoked activity (as seen by BOLD) seems incongruous with the underlying neurophysiology where SCPs represent a window on the dynamic interplay between the brain's ongoing rhythms and its ever-changing environment.
Footnotes
Author Disclosure Statement
No competing financial interests exist.