
Abstract
We present constrained source-based morphometry (SBM), a multivariate semiblind data-driven approach, to explore a possible brain-wide structural network in both gray matter (GM) and white matter (WM) associated with the functional default mode network (DMN). With this approach, we utilize seed regions associated with the DMN as constraints on GM maps and derive a joint GM and WM structural network automatically through a multivariate data-driven approach. In this article, we first provide a simulation to validate the constrained SBM approach. The approach was then applied to structural magnetic resonance imaging and diffusion tensor imaging data obtained from 102 healthy controls. Regions that have consistently reported to be associated with the DMN were used to create an a priori mask that was integrated within an independent component analysis framework to derive the structural network associated with the DMN. We identified a set of GM and corresponding WM regions contributing to a structural network underlying the functional DMN. The GM regions consisted mainly of the precuneus, superior and medial frontal gyri, middle temporal gyrus, hippocampus, cuneus, and cerebellum. The WM regions included the cingulum, corpus callosum, corona radiata, association fibers, and middle cerebellar peduncle. Significant gender differences in the relationship between intelligence quotient (IQ) and the identified structural network were observed. Our findings suggest that the functional DMN is underpinned by a corresponding brain-wide structural network. The constrained SBM approach is additionally applicable to a wide variety of problems identifying structural networks from seed regions.
Introduction
R
Although, to date, there have been many functional studies of the DMN, much less is known about its underlying brain structural correlates. Since it is commonly assumed that the functional connectivity reflects structural connectivity (Greicius et al., 2009; Skudlarski et al., 2008; van den Heuvel et al., 2009a), the detection of the structural basis of the DMN would help to reveal the underlying anatomy on which the functional connectivity is based. The few studies evaluating the structural underpinnings of the DMN have used two main approaches, the region of interest (ROI) and data-driven analyses. In ROI-based studies, several regions involved in the functional DMN are selected. Then, diffusion tensor imaging (DTI) tractography or pairwise correlation is utilized to determine the structure connections among them (Greicius et al., 2009; Honey et al., 2009). Other recent studies used data-driven analyses in which all voxels, across the whole brain, are searched automatically without prior information or constraints. All the possible connections existing in the resting-state brain are investigated, and the structural network underlying the DMN is identified (Skudlarski et al., 2008; Teipel et al., 2010).
To combine the benefits of both ROI and data-driven analyses with a goal of studying the structural network underlying the DMN, we developed a novel method called constrained source-based morphometry (constrained SBM). The proposed constrained SBM method is a novel adaption of an existing, validated method (constrained-independent component analysis [ICA]) that has broad applicability (Lin et al., 2010). Our approach incorporates an ROI mask as the prior constraint and evaluates the possibility of a structural network in both gray matter (GM) and white matter (WM) associated with ROIs throughout the whole brain. It possesses the inherent advantages of the purely data-driven method SBM (Caprihan et al., 2011; Xu et al., 2009). The cross-voxel information within the MRI data is utilized, and the structural networks showing similar intersubject co-variance can be detected. In addition, the method integrates the prior information of ROI into classic SBM, as the constraint and extracts specified results.
Constrained SBM analyzes the data from structural MRI (sMRI) and DTI. Within the brain, sMRI measures voxel densities and provides morphometric information, while DTI measures the inhomogeneity of water diffusion. The fractional anisotropy (FA) measure derived from DTI is of particular interest, as this parameter quantifies the relative integrity of WM fibers (Burns et al., 2003) and is the most commonly used scalar index for DTI. FA values have been reported to quantify structural connectivity, especially as a measure of the WM integrity of the fiber tracts interconnecting brain regions (Hagmann et al., 2008; van den Heuvel et al., 2008). In the constrained SBM process (See Fig. 1), the raw sMRI and DTI images are first preprocessed to obtain the sMRI GM and FA WM images as the primary input. Then, the constrained ICA utilizes the ROI as the seed regions for the GM data only, and derives the structural network jointly from sMRI GM and DTI WM data associated with the seed regions. Finally, the extracted network is subjected to a statistical analysis, and its relationship with other factors, such as age, gender, and intelligence quotient (IQ) scores, is determined.
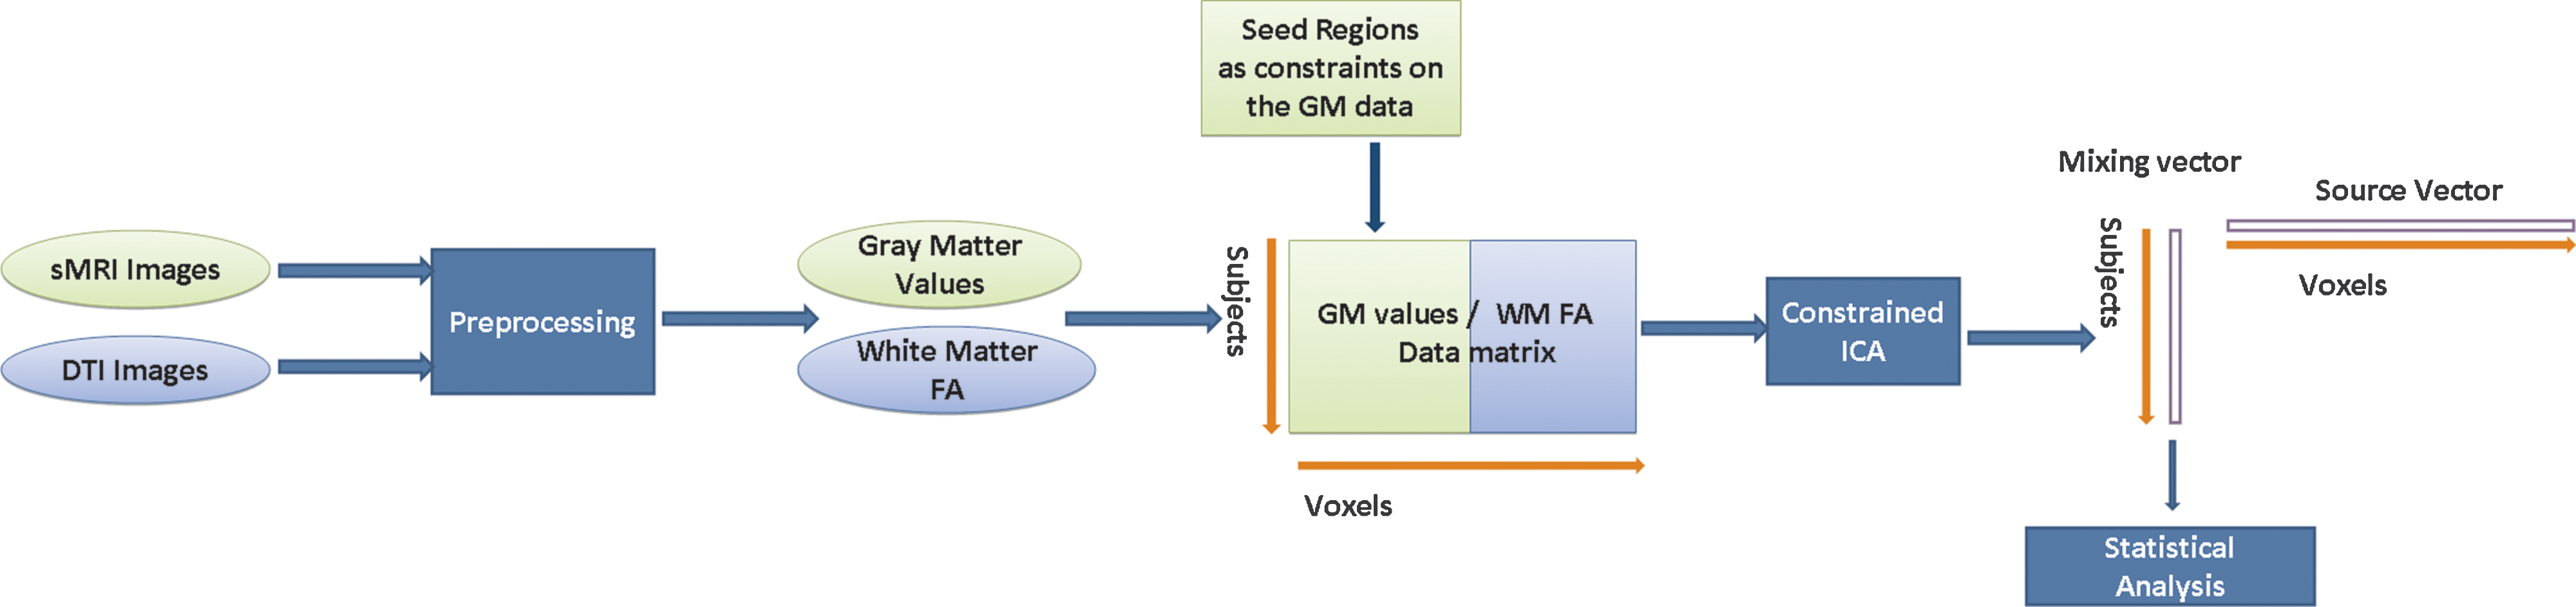
Constrained SBM. Structural MRI and DTI images are first preprocessed into the GM value/WM FA data matrix. Utilizing the DMN regions as seed regions and as constraints on the GM data, the constrained ICA is then applied to the GM/WM data matrix and results in a mixing vector and a source vector representing the correlated structural network, including both GM and WM regions. Statistical analysis is further performed on the mixing vector to detect the relationship between the identified networks and other variables of interest. DMN, default mode network; DTI, diffusion tensor imaging; FA, fractional anisotropy; GM, gray matter; ICA, independent component analysis; MRI, magnetic resonance imaging; SBM, source-based morphometry; WM, white matter.
In this article, we first provide a simulation to introduce the concept and evaluate the performance of constrained SBM under several specific cases. Next, we detail the constrained SBM approach and demonstrate its application to a real data set of sMRI GM and DTI WM (fractional anisotropy) data from 102 healthy human subjects. We selected as seed regions those areas repeatedly identified elsewhere as members of the DMN and evaluated the possibility of a structural network associated with the DMN. We also determined effects of age, gender, IQ, and their interactive effects on the identified structural network.
Simulation
To describe the concept of the constrained SBM and evaluate its performance, we conducted a simulation (see Fig. 2) designed to contain a variety of networks in GM and WM, such that one of them is related to the seed regions. Constrained SBM aims to detect a network that is associated with the seed regions among all the networks. The detailed design and results are as follows.
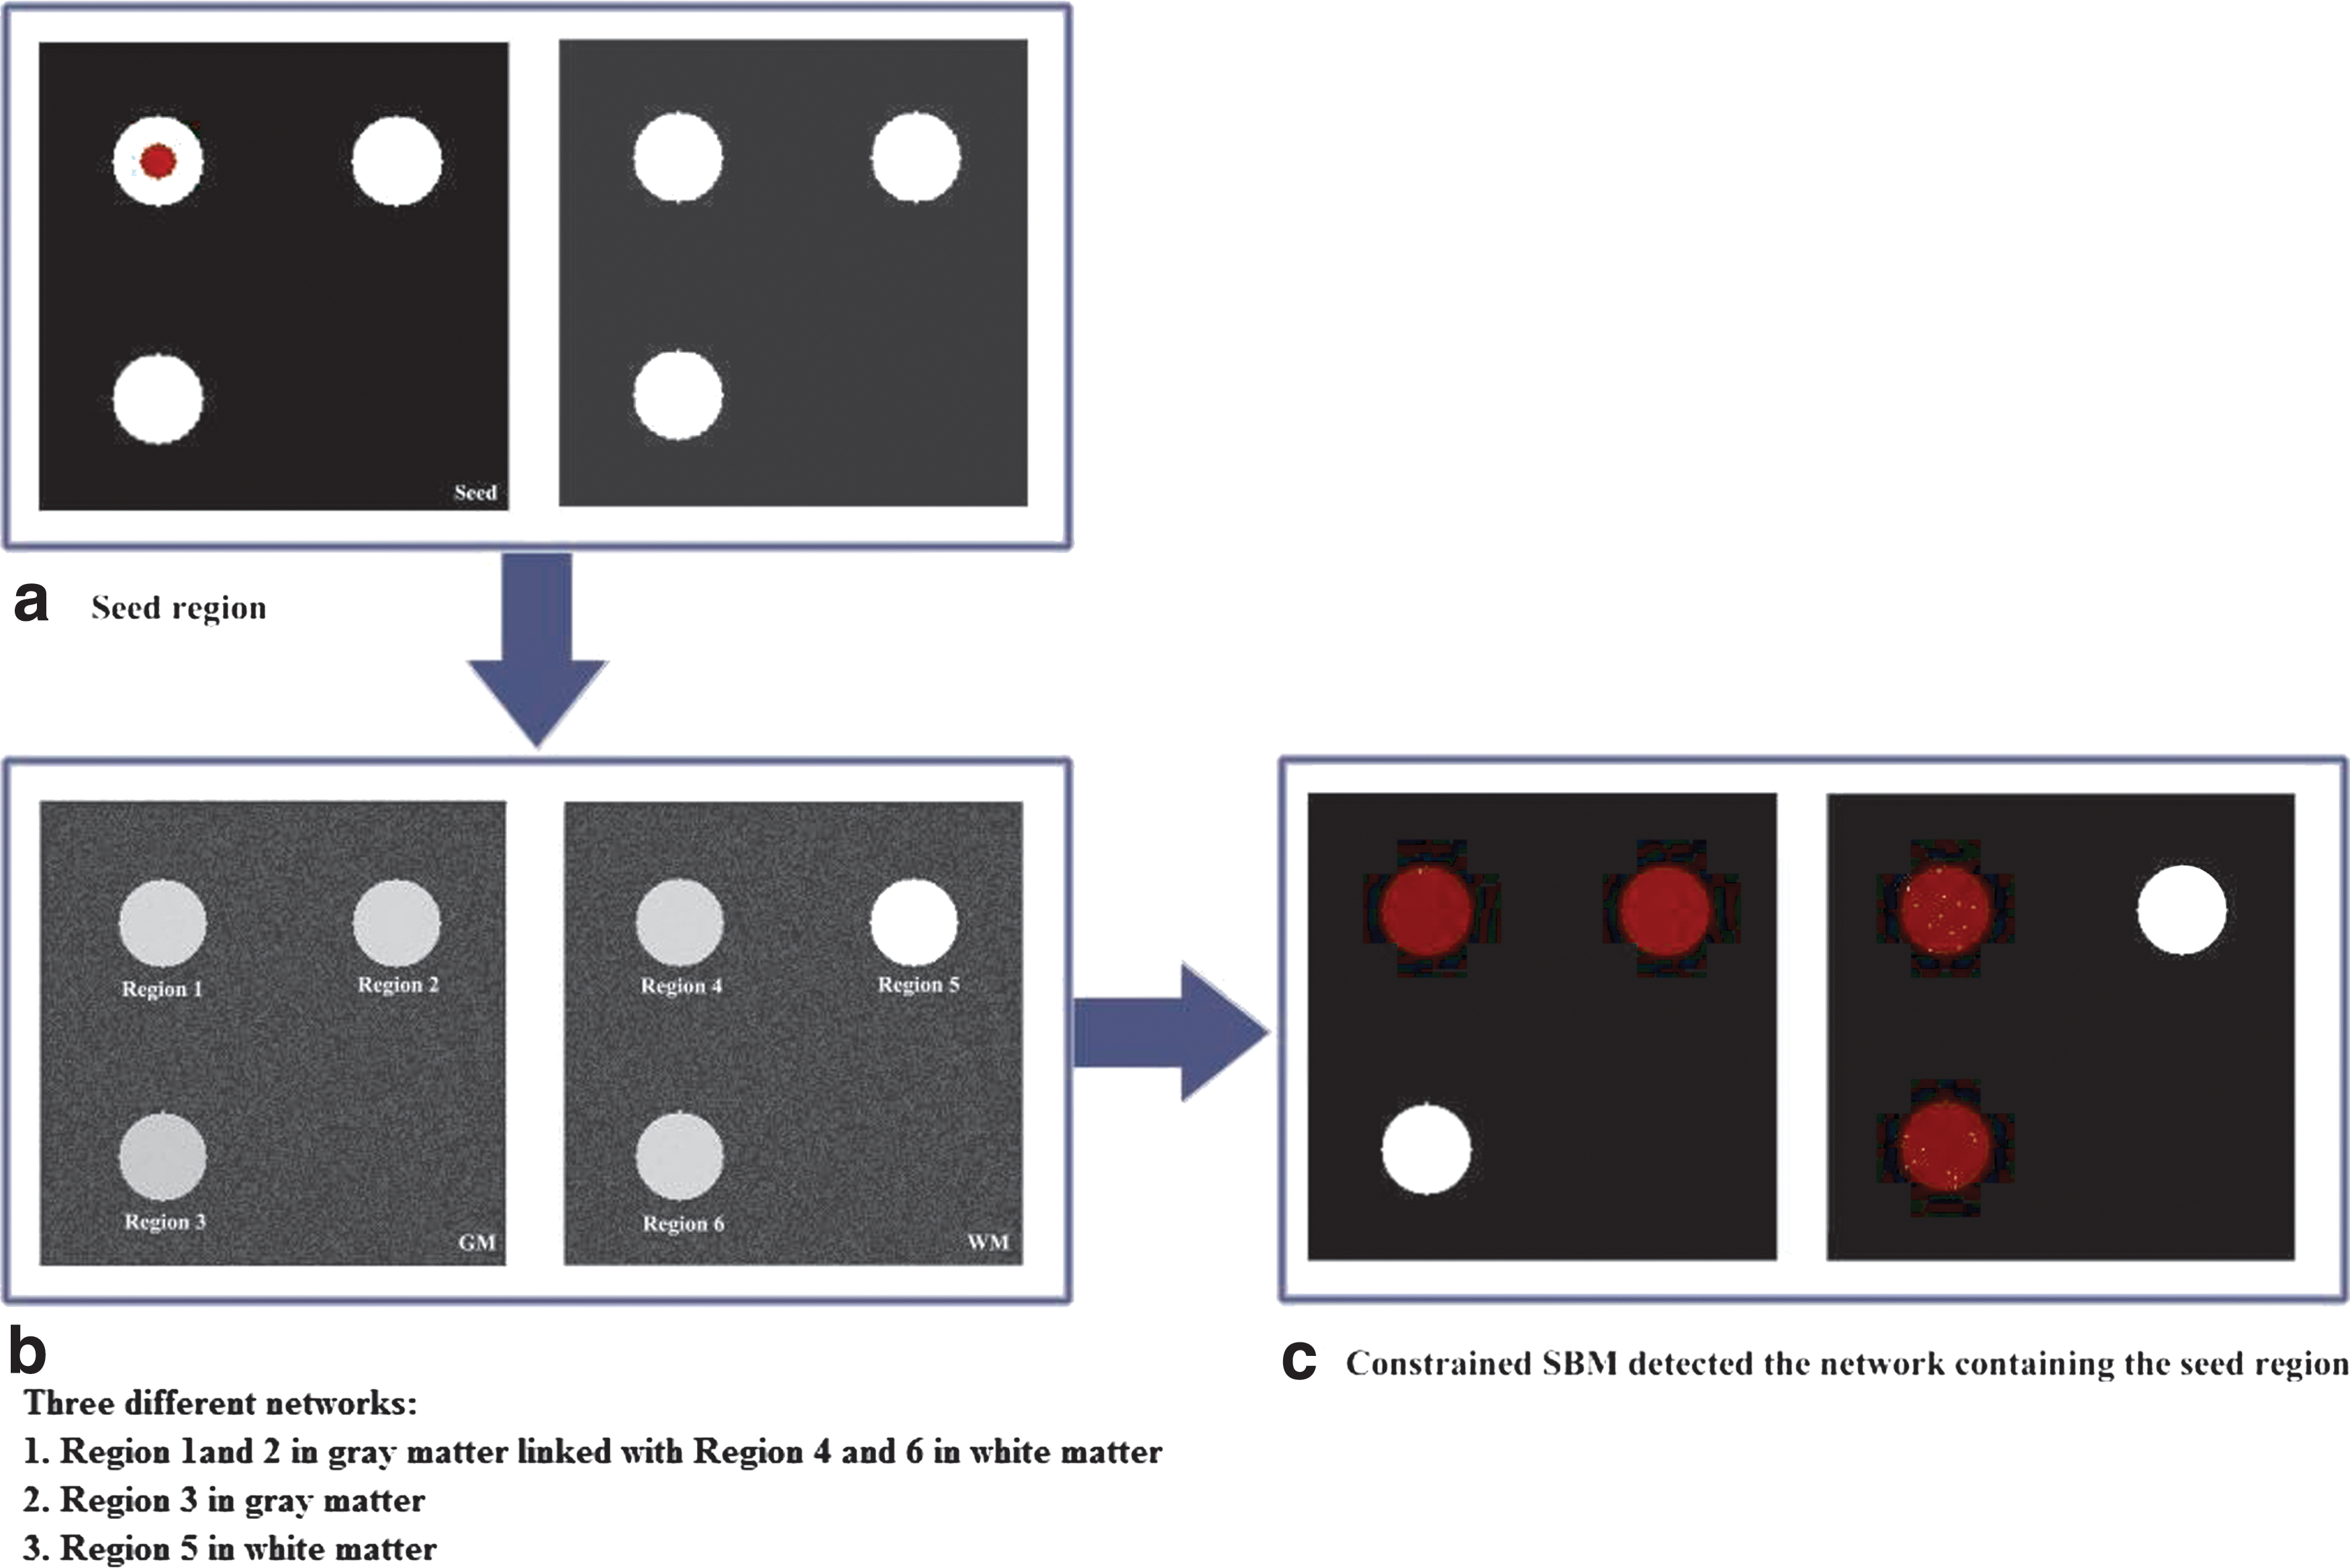
Simulation for constrained SBM.
First, we generated two 256-by-256 images to simulate GM and WM, separately (see Fig. 2a). Then, six circular regions were generated, each with a radius of 25 voxels. Regions 1–3 were within the GM image, and regions 4–6 were within the WM image. We created 100 GM and 100 WM images separately to represent the GM and WM of 100 subjects. The intensities of regions 1, 2, 4, and 6 were uniformly distributed between 40% and 50% of the original circular region intensity; the intensities of the region 3 were uniformly distributed between 20% and 30% of the original circular region intensity; the intensities of the region 5 were uniformly distributed between 70% and 80% of the original circular region intensity. Hence, there were three different networks in GM and WM. Network 1 was formed by the regions 1 and 2 in GM and the regions 4 and 6 in WM; network 2 was region 3 in GM; and network 3 was region 5 in WM. Assume that the original circular intensity is 1. The distributions from which networks 1, 2, and 3 had been sampled were Uniform (0.4 and 0.6) (mean 0.45, SD 0.029), Uniform (0.2 and 0.3) (mean 0.25, SD 0.029), and Uniform (0.7 and 0.8) (mean 0.75, SD 0.029), respectively. Gaussian noise was then added to the 200 images to represent variation across the simulated subjects. Next, we generated a seed region (see Fig. 2b) having a value of 1 within the red dot and 0 elsewhere, which belonged to network 1.
A constrained SBM analysis was carried out on these 200 images using the seed region as the constraint. Figure 2c shows the result thresholded at |Z|>2.0. Most of the Gaussian noise was separated into its own component, and network 1 containing the seed region was detected. This demonstrates that constrained SBM can successfully extract a network that is only roughly specified by a mask/seed region. It also illustrates a key point of our work: we are using prior knowledge of the functional regions to (1) inform an analysis of the underlying associated GM regions and (2) identify related WM regions from jointly analyzed DTI data and for which we do not have available prior knowledge.
Methods
Subjects and imaging parameters
One hundred two participants (43 women; mean age 21.9, SD 3.0, range 18–29; mean Full Scale Intelligence Quotient [FSIQ] score 118.9, SD 13.5, range 86–144) obtained from the Wechsler Intelligence Scales Third Edition (Wechsler, 1997) underwent MRI scans at the Mind Research Network. Subjects were recruited by postings in various departments and classrooms at the University of New Mexico. All participants signed a consent form approved by the Institutional Review Board of the University of New Mexico before participation. Before study entry, the patients were interviewed by a licensed clinical neuropsychologist (REJ) to screen for any neurological or psychological disorders that might affect the brain structure and functioning (e.g., traumatic brain injury, schizophrenia, epilepsy, and attention-deficit disorder). Subjects were also screened for conditions that would prohibit undergoing an MRI scan (e.g., metal implant, orthodontic braces, and severe claustrophobia).
sMRI images were obtained on a 3-Tesla Siemens Tim Trio scanner using a sagittal 3D MPRAGE sequence (TE1=1.64 ms; TE2=3.5 ms; TE3=5.36 ms; TE4=7.22 ms; TE5=9.08 ms; TR=2530 ms; voxel size=1.0×1.0×1.0 mm3; acquisition time=6:03). For all scans, each T1 was reviewed for image quality. DTI images were obtained on the same scanner using an echo planar sequence (TE=84 ms; TR=9000 ms; voxel size=2.0×2.0×2.0 mm3; 72 slices; Field of View=256 mm; 35 diffusion directions with b=800 sec/mm2, and 5 measurements with b=0; acquisition time=5:42). The DTI acquisition was repeated twice. We first checked the DTI data quality (Supplementary Materials; Supplementary Data are available online at
Constrained ICA
Constraint generation
A DMN template was generated using WFU Pickatlas software (Wake Forest University;
Generation of the sMRI GM/DTI FA data matrix
We converted each GM map to empirical z-scores and converted to a one-dimensional vector. The 102 image vectors were then arrayed into one 102 row subject-by-GM matrix. The same was done to the 102 FA WM images to get the subject-by-WM matrix. These two matrices were stacked horizontally to create a subject-volume matrix X. This GM/FA matrix X was the primary input for the following the constrained ICA.
Constrained ICA process
ICA is a commonly used method in the biomedical signal analysis (Calhoun et al., 2009). When used in the structural image analysis, the typical ICA model is to decompose the subject-volume matrix X to a mixing matrix A and a source matrix S, that is, X=AS. The source matrix S expresses the relationship between the sources and the voxels within the brain. The mixing matrix A expresses the relationship between subjects and the sources. The rows are scores that indicate the relative degree each source contributes to a given subject; the columns indicate how one source contributes to each of the subjects. The ICA decomposition provides a spatial filtering of the noise and identifies interesting maximally spatially independent sources (networks) that exhibit similar intersubject co-variation (Xu et al., 2009).
Constrained ICA is an enhanced ICA model that incorporates prior information into the decomposition process and extracts one or several desired independent sources S. A reference R that carries prior information of the desired sources is chosen. By utilizing an augmented Lagrange multiplier, identification of the desired independent component, that is, the closest to the reference was enabled (Lu and Rajapakse, 2005), and a more accurate estimation of S is possible. Recent research has demonstrated the usefulness of the constrained ICA in improving the potential of the ICA for an fMRI analysis (Lin et al., 2010; Lu and Rajapakse, 2005). Since determining structural correlates of the DMN is of great interest, in this study, we applied the constrained ICA to a GM/FA analysis using the DMN as the reference.
A closeness measure
where J (S) denotes the contrast function of a standard ICA algorithm,
Constrained ICA was performed on the subject-volume matrix X using a fast fixed-point algorithm (Lin et al., 2010) integrated in the group ICA toolbox GIFT (
The objective of this study was to capture the WM regions that are associated with the DMN through investigation of the co-variation of the FA and GM values employing the constrained ICA approach. The proposed ICA approach is not designed to investigate traditional end-to-end structural connectivity as in WM tractography, and it does not perform a direct comparison of structural connectivity and functional connectivity as well. Constrained ICA indirectly compared the structural DMN and functional DMN through the FA variation in the WM and GM variation. Constrained ICA does take into account the functional DMN information by setting ROI as the constraints without the requiring all of the functional MRI data into the analyses. In future work, we plan to extend our approach to handle more than two modalities (e.g., fMRI, sMRI, and DTI data).
Statistical analysis
We performed a statistical analysis on the mixing vector a to test the significant relationship between the networks and the variables of interest. The effects of gender, age, and IQ scores on the networks were determined by correlating and regressing the mixing vector against gender, age, and IQ scores. In addition, an analysis of co-variance (ANCOVA) was performed to evaluate the main effects of gender, age, and IQ scores together with their interactive effects on the structural network associated with the DMN.
Results
The constrained SBM approach utilized the DMN regions as a priori seed regions in the sMRI GM and DTI FA data to identify the possibility of a DMN-associated structural network. The network detected includes both GM and WM regions related to the DMN. The GM and WM regions were displayed with an empirical threshold of |Z|>2, such that we could identify details of the identified GM or WM regions. We also determined the relationship between this structural network and several variables of interest.
GM regions related to the DMN
We identified a set of GM regions related to the DMN consisting of the precuneus, superior and medial frontal gyri, middle temporal gyrus, hippocampus, cuneus, and cerebellum (see Fig. 3, Table 1).

GM regions related to the DMN detected by constrained SBM thresholded at |Z|>2.0.
Voxels above a threshold of |Z|>2.0 were converted from MNI coordinates to Talairach coordinates and entered into a database to assign anatomic labels for the L and R hemispheres. The concentration of voxels in each area is provided in cc. Within each area, the maximum Z value and its coordinate are provided.
MNI, Montreal Neurological Institute; L, left; R, right; cc, cubic centimeters; na, not applicable.
WM regions underlying the DMN
We also identified the WM regions of which the FA values showed similar inter-subject co-variation with the GM regions relating to the functional DMN. WM regions were labeled using a standardized brain WM atlas (Mori et al., 2005) included as part of the FSL software package. WM regions underlying the DMN mainly included the cingulum, corpus callosum, corona radiata, superior longitudinal fasciculus, inferior fronto-occipital fasciculus, uncinate, and middle cerebellar peduncle (see Fig. 4, Table 2). Table 2 showed the intersection of the FA-independent components with known WM tracts and, in addition, demonstrated that known tracts go through the FA changes and touch the functional basis of the DMN. However, our approach is not a direct measure of structural connectivity and does not require an entire tract to be affected. While examining WM tracts connecting functional DMN regions, using current tractography methods is challenging and difficult; a strength of our approach is that we can identify smaller regions within known tracts through an analysis of FA co-variation with the GM data.

WM fibers underlying the DMN detected by constrained SBM thresholded at |Z|>2.0.
Voxels above a threshold of |Z|>2.0 were converted from MNI coordinates to the ICBM DTI-81 coordinates and entered into a database to assign anatomic labels. The volume of significant white matter voxels within each fiber tract area is provided in cc. The percentage of the fiber tract containing significant white matter voxels is also provided. Within each fiber tract, the maximum Z value and its coordinate are provided.
DTI, diffusion tensor imaging.
The relationship between the structural network and the variables of interest
The contribution of individual brain variation to the structural network is represented by the loading parameters contained in the mixing vector. The variables of interest that we chose for the statistical analysis were age, gender, and IQ scores. The correlation coefficients between the variables of interest and the loading parameter were all<0.1 for age, sex, and IQ scores. The scatter plots of loading parameter versus the variables of interest are shown in Figure 5.
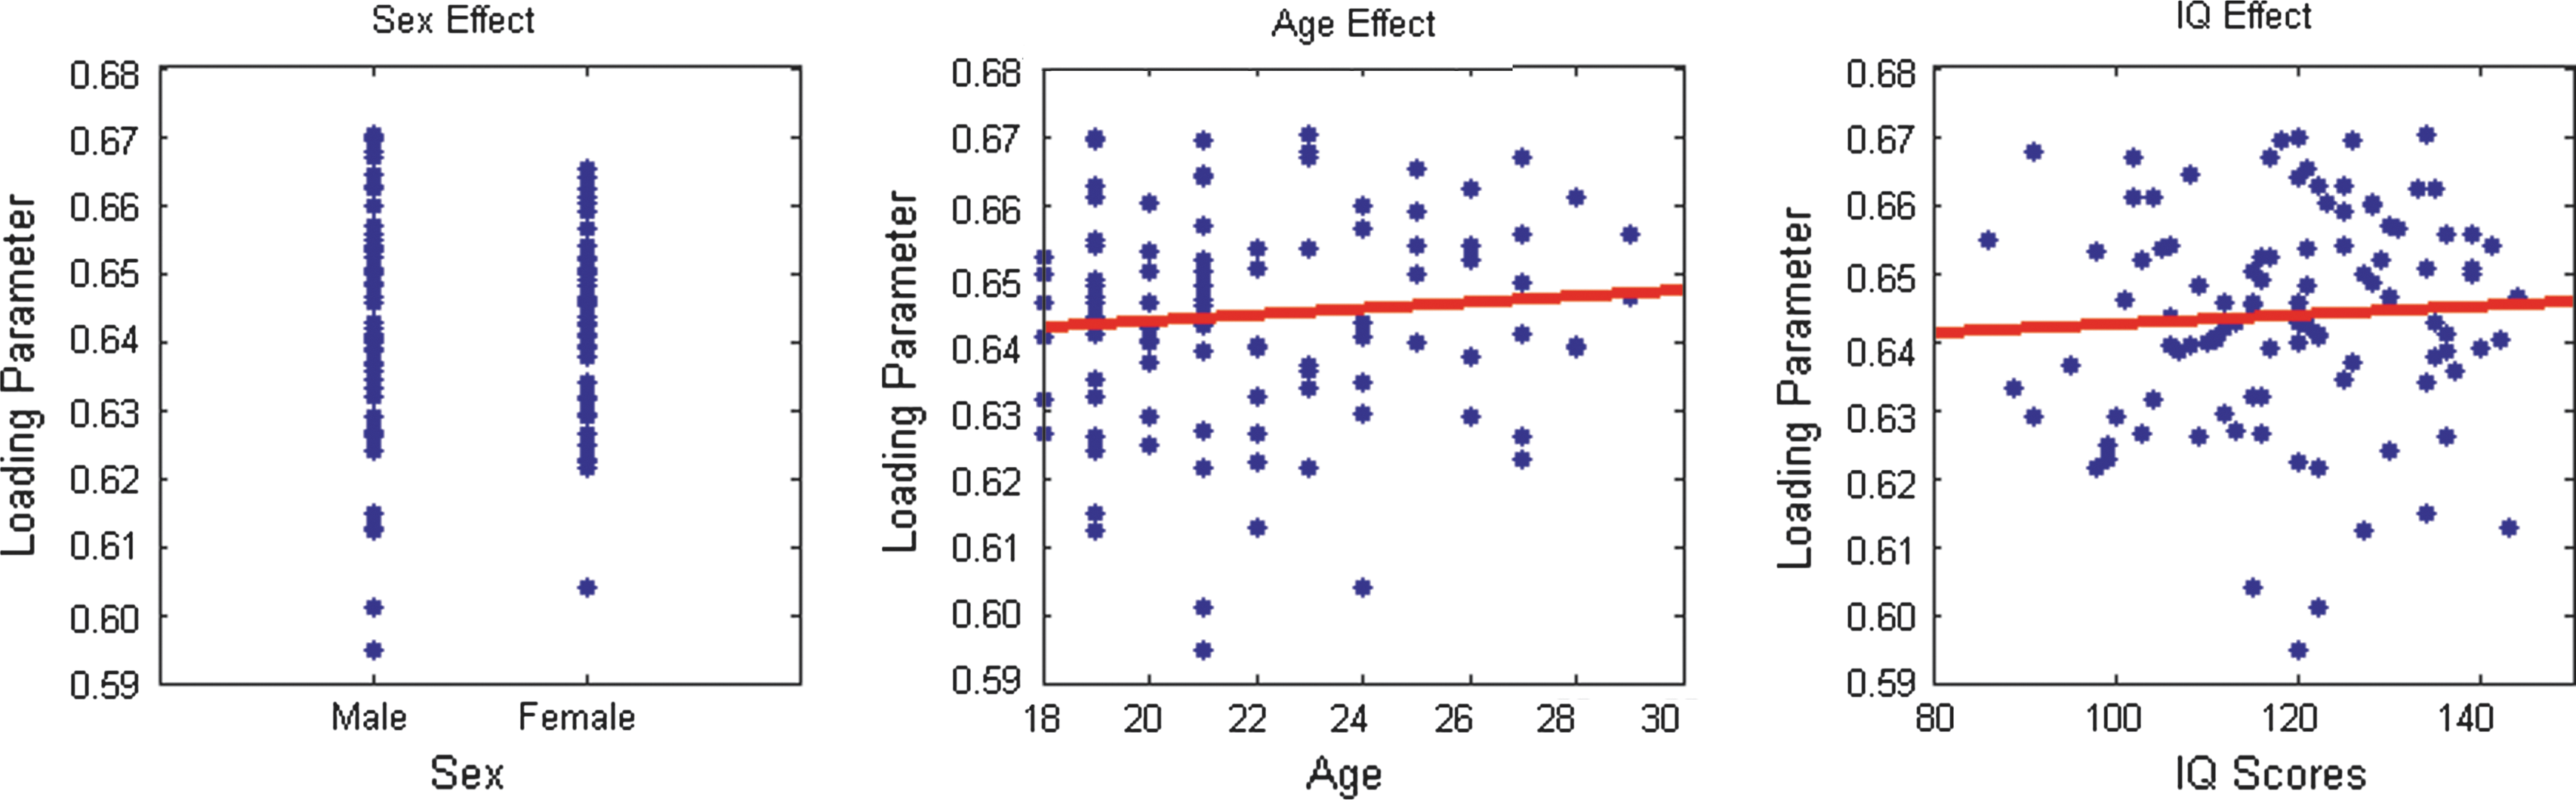
The scatter plots between the variables of interest (gender, age, and IQ scores) and the mixing vector of the constrained ICA. IQ, intelligence quotient.
An ANCOVA testing the main effects of gender, age, and IQ scores, together with their interactive effects, showed a significant interactive effect of IQ scores and gender on the structural network (p=0.0325). The scatter plot together with the linear fits between IQ scores and the mixing vector, for men and women, respectively, are shown in Figure 6.
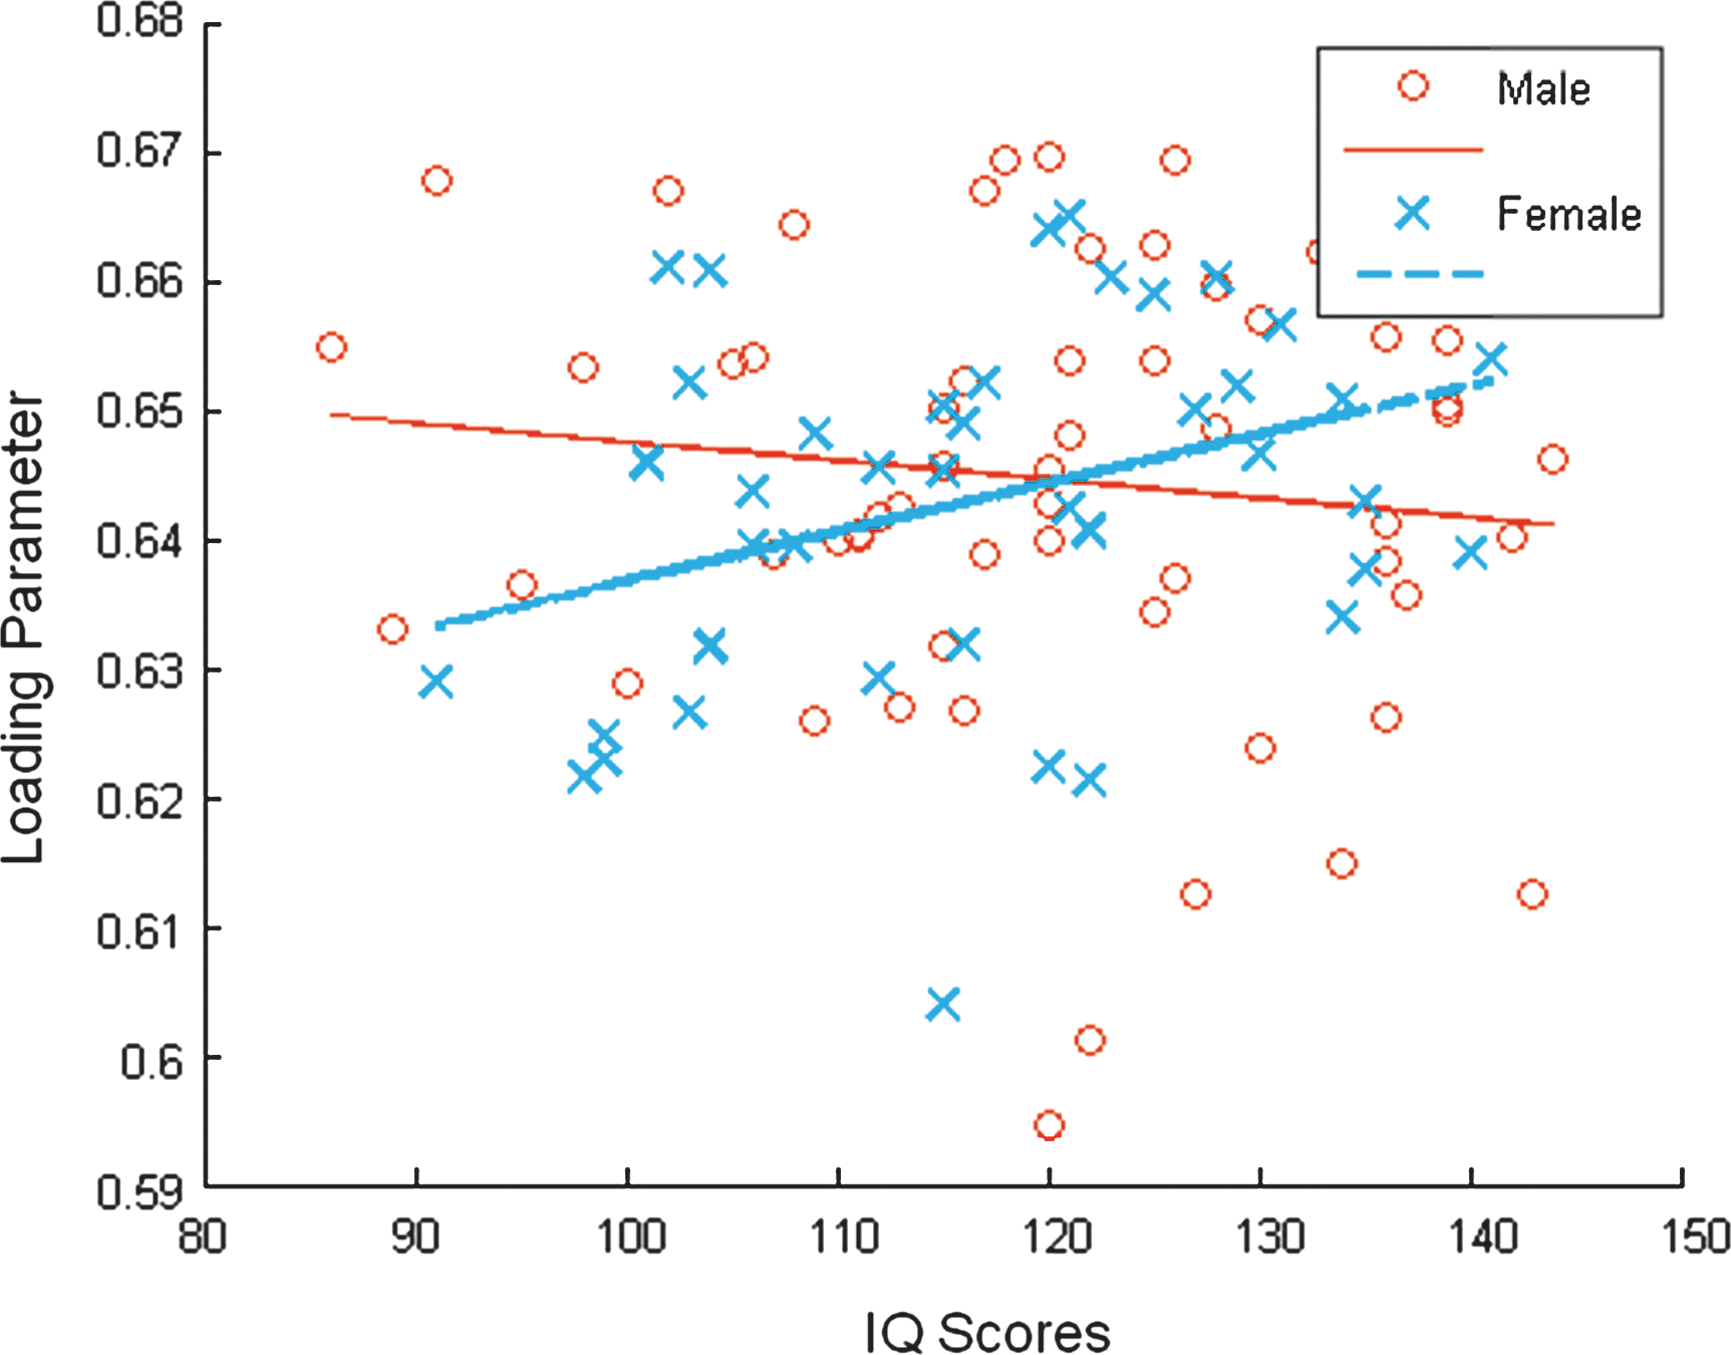
The scatter plot together with the linear fits between IQ scores and the mixing vector of the constrained ICA, for men and women, respectively. An analysis of co-variance showed a significant interactive effect of IQ scores and the gender on the structural network (p=0.0325).
Discussion
We present a constrained SBM approach to detect the underlying structural network showing similar inter-subject co-variation with functional DMN GM regions. We have chosen FA values in the analysis because FA quantifies the integrity of WM fibers and is the most commonly used scalar index for DTI. Studies using DTI tractography have shown remarkable consistency between the FA changes and WM volumes in fiber bundles connecting brain regions (Teipel et al., 2010). We could also have used other parameters for DTI, such as mean diffusivity and radial diffusivity. While FA values have the potential to demonstrate structural connectivity (Burns et al., 2003), it is so far unclear that the reduction of FA values would directly imply two poorly structurally connected regions (Jones et al., 2005). To avoid this claim, we refer to our approach as identifying co-variation of the WM FA values with the GM intensity values rather than structural connectivity. Regions that were consistently identified in DMN studies were used as a prior spatial mask to jointly analyze sMRI GM and DTI FA images from 102 healthy human subjects. Results revealed a structural network containing both GM and WM regions, which share common intersubject co-variation. We also evaluated the relationship between the structural network and several variables of interest (gender, age, and IQ scores). Results support the existence of a DMN-associated structural network showing similar inter-subject co-variation with the functional DMN and also demonstrate the utility of the semiblind multivariate method, constrained SBM.
GM regions related to the DMN
Several GM regions were identified associated with the DMN, suggesting an underlying structural support network. The identified GM regions included precuneus, medial prefrontal cortex (MPFC), superior and middle temporal gyri, hippocampus, cuneus, and cerebellum.
Our findings were consistent with previous studies in identifying some of the regions that have also been shown as key areas of the DMN. The strong interactivity of precuneus/posterior cingulated cortex (pC/PCC) with the rest regions of the DMN has suggested a pivotal role of the pC/PCC in the DMN (Fransson and Marrelec, 2008). The MPFC, superior, and middle temporal gyri are other DMN regions frequently identified by functional MRI, which is typically deactivated and negatively correlated with task-active networks, during a broad range of cognitive tasks, such as working memory, language, and vision (Greicius et al., 2003, 2009). Significant co-activation of the hippocampus in the DMN has been reported (Greicius et al., 2004), and our identification of the neighboring parahippocampal gyrus supports the involvement of the hippocampus in the DMN.
Our results also suggested the prominent structural support to the DMN of several regions that have been implicated, but have not received considerable attention from previous reports. These regions, including the cerebellum and cuneus, might also be key areas of the DMN according to our results. The cerebellum has been found to contribute distinctly to several intrinsic connectivity networks previously identified to be involved in executive control, self-reflection, and sensorimotor function (Habas et al., 2009). The cuneus has been implicated in several DMN studies (Broyd et al., 2009; Garrity et al., 2007). Based on the relatively large volume and high maximum values of the cuneus shown in our results, we suggest that cuneus might offer an important structural support to the DMN.
WM regions underlying the DMN
WM regions associated with the DMN through co-variation analyses of FA and GM values were also identified. Specifically, we identified important roles of a part of the WM tracts of cingulum, the middle cerebellar peduncle, the corpus callosum, association fibers, and the corona radiata associated with the functional DMN. As demonstrated in Figure 4 and Table 2, instead of identification of the entire fiber bundles interconnecting cortical regions in tract tracing, it is possible that the constrained ICA might identify only a part of the WM tracts within which the FA values showed similar inter-subject co-variation with the GM intensity. In the cases where when only a part of the WM tracts was identified through the co-variation analyses, our approach as well as any other voxel-wise approaches would be limited in demonstration of the end-to-end connectivity.
Our proposed constrained ICA approach through a co-variation analysis of FA and GM values has identified WM regions intersected with known fibre tracts, which are consistent with recent-study findings based on either DTI tractography or an ROI approach. One subset of the involved cingulum was adjunct to the cingulate gyrus, consistent with the previous report that the cingulum interconnects the PCC and the MPFC (Greicius et al., 2009). Greicius et al. (2009) demonstrated the direct connection between PCC and MPFC through combining the DTI tractography with resting-state functional connectivity. Another subset of the cingulum bundle extended to the hippocampus, which agrees with the findings that an interrelationship exists between the posterior cingulate and hippocampal gyri (Teipel et al., 2010). By regressing the functional connectivity between PCC and the hippocampus on the WM FA maps, distinct WM areas matching the DMN components were identified (Teipel et al., 2010).
As a WM tract linking the pons and cerebellum, the middle cerebellar peduncle relays signals from cerebrum to cerebellum. The detection of this WM tract again suggests that the cerebellum may be an important part of the DMN. The genu, body, and splenium of the corpus callosum were all identified from the total collection of WM tracts underlying the DMN. The fact that the callosal radiation conducts the communication between two hemispheres suggests that its involvement likely facilitates the interhemisphere connectivity of the DMN. Application of a purely data-driven method (joint ICA [jICA]) to combine information from both the functional connectivity and WM connectivity has demonstrated that the functional connectivity in the DMN is highly dependent on the WM integrity of the corpus callosum connecting the two hemispheres. (Franco et al., 2008). The genu of the corpus callosum was reported to play an important role interconnecting different regions of the DMN in a recent study reconstructing the WM pathways between functionally connected brain regions forming resting-state networks (van den Heuvel et al., 2009a). This report also provided strong evidence of the structural support of the functional DMN by demonstrating that eight of the nine functional resting-state networks are interconnected by anatomical WM tracts (van den Heuvel et al., 2009a). Furthermore, we identified association fibers that were a part of the WM network related to the DMN, including the superior longitudinal fasciculus, inferior fronto-occipital fasciculus, and uncinate. These long association fibers link the frontal, occipital, and temporal lobes, and connect the distant GM regions that make up the DMN, suggesting their important role in forming the skeleton of the structural network underlying the DMN. In addition, the anterior corona radiata as well as the anterior limb of internal capsule were significantly associated with the DMN. This bundle of pyramidal tracts carries motor-sensory information between cerebral cortex and subcortical regions, particularly the thalamus. Because the thalamus was not explicitly shown in our result, the fronto-pontine fibers might be the major contributor.
The relationship between the identified GM and WM regions is also of interest. Using a constrained ICA approach on the co-variation analysis of the GM values and WM FA values, we identified a structural network underlying the functional DMN that consists of a series of closely related GM regions and WM regions. The relationship among a subset of the identified GM and WM regions was supported by literature findings. Important roles interconnecting different regions of the resting-state networks have been broadly demonstrated for the cingulum tract (Greicius et al., 2009; van den Heuvel et al., 2008), the left and right superior longitudinal fasciculus (van den Heuvel et al., 2008; Wakana et al., 2004), as well as the corpus callosum tracts (van den Heuvel et al., 2008; Wakana et al., 2004). It has been demonstrated that the cingulum bundle directly connects the PCC to the MPFC (Greicius et al., 2009). In addition, it has been reported that there was a direct association between the microstructure of the interconnecting cingulum tract and the level of functional connectivity between the PCC and medial frontal cortex (van den Heuvel et al., 2008). A significant association of the functional connectivity between the posterior cingulate and the hippocampus with the WM microstructure in the cingulate bundle interconnecting them was also reported. (Teipel et al., 2010).
The relationship between the structural network and the variables of interest
The correlation values between the variables of interest and the ICA loading parameter were all low. This was also demonstrated by Figure 5 showing no significant trends between the loading parameter and the variables of interest. With regard to gender effects, although the previous study observed significant gender differences in functional activation (Keller and Menon, 2009), our study supports the notion that the overall associations of gender with the structural DMN are quite small (Bluhm et al., 2008). With regard to age effects, earlier studies have shown prominent differences of DMN between 7–9 years old and 19–22 years old, which indicated an age-related developmental trajectory (Supekar et al., 2010). Our study involves a rather restricted age range between 18 and 29, suggesting that the structural development of the DMN might be largely completed by late adolescence (Bluhm et al., 2008) and that this structural network remains stable in early adulthood. While previous studies have shown significant relationships between the brain structure and IQ scores in normal healthy cohorts (Jung and Haier, 2007), the current results show no significant relationship between the structural DMN and IQ. Since our result is based upon the predominant regions underlying the DMN, it does not preclude the hypothesis that a short path length, or a discrete structural network, might be crucial for efficient information processing across the functional brain network and consequently IQ-related (van den Heuvel et al., 2009b).
Although the main effects of gender, age, and IQ scores on the structural DMN are mild, a significant meditative effect of gender on the relationship between IQ and the brain structural network has been identified. While the loading parameter represents the linked pattern between the structural network and the functional DMN for specific subjects, Figure 6 demonstrated that for men, this linked pattern gets weaker as the IQ scores increase, but for women, the linked pattern becomes stronger as the IQ scores increase. This finding is consistent with previous reports, and will add to knowledge in studying the functional and structural DMN. Substantial sex differences in the structural brain organization underlying intellectual functioning have been reported (Haier et al., 2005). A regression of intelligence on the total brain WM suggested greater WM associations with cognition in women than in men (Gur et al., 1999). It has also been observed that the biochemical substrate of normal intellectual performance is mediated by sex, and that women exhibited much stronger associations between WM biochemistry measures and cognitive measures compared to men (Jung et al., 2005). Furthermore, our findings of the significant IQ by gender interaction in the DMN are supported by the significant FSIQ by sex interaction that was demonstrated in the inferior frontal gyrus and in the middle temporal gyrus (Schmithorst and Holland, 2006). Significant negative correlation of BOLD activation with FSIQ in both the inferior frontal gyrus and the middle temporal gyrus was reported in boys, while girls exhibit positive correlation in the inferior frontal gyrus and no significant correlation in the middle temporal gyrus, respectively (Schmithorst and Holland, 2006).
Resting-state functional MRI studies detect multiple functionally connected brain regions forming the DMN. Although it is commonly hypothesized that highly functionally connectivity reflects structural connectivity, the underlying structural connectivity architecture remains underexplored. An integrated analysis of the sMRI GM data and DTI WM data will enrich our understanding of the brain structural networks. It has been increasingly reported in several studies that combining multimodal imaging provides a richer representation of the brain connectivity (Franco et al., 2008; Greicius et al., 2009; Skudlarski et al., 2008; Teipel et al., 2010). With the aid of the newly introduced concept of the DTI connectivity, a significant overall agreement was achieved by comparing the quantified anatomical connectivity with resting-state functional connectivity (Skudlarski et al., 2008), which provides a powerful validation for the representation of neuronal connectivity by resting-state correlations. A jICA approach has been used to combine fMRI resting-state data with DTI, which demonstrated that resting-state functional connectivity is highly dependent on the integrity of WM connections both between (corpus callosum) and within (cingulate bundles) the two hemispheres (Franco et al., 2008). The shared variance between the DMN and the FA values has also been discovered using the jICA approach, which would have been missed in the standard analysis of each individual modality separately (Franco et al., 2008).
The two most common methods for studying the structural underpinnings of the DMN include an ROI approach and data-driven analyses; however, there is some disagreement about which one is superior (Bluhm et al., 2008). Our proposed constrained-SBM approach maximally utilized our prior knowledge of the functional regions to inform the underlying associated GM regions, while searching the whole brain at the same time for the associated WM regions where we had less prior knowledge. To our knowledge, the proposed strategy is the first method to combine the advantages of both ROI and data-driven approaches in multimodal imaging. Our results not only identified GM regions that were previously reported to be an important part of the DMN, but also detected the GM regions that were implicated in previous studies but not received considerable attention, which might also potentially play an important role in the DMN. We were also able to simultaneously identify the underlying WM regions associated with the DMN from the DTI data. The identified WM regions through the co-variation analysis of FA and GM values agreed with and extended the previous study findings in investigation of the structural connectivity architecture of the human brain. The possibility that higher order morphometric changes are driving some of the findings would be another potential limitation of our approach as well as any voxel-wise approach.
There are a growing number of methods designed to jointly analyze GM and FA data (Xu et al., 2009; Groves et al., 2011); however, these methods do not incorporate spatial constraints. We have presented a novel approach employing prior information in the form of the functional DMN to investigate the GM and FA variability underlying the DMN through a co-variation approach. Our approach is an adaptation of an existing, validated method that has broad applicability. The novel adaptations consist of two main aspects; first, we use a functional network to constrain a structural network (whereas the original application was a functional network constraining a functional network), and secondly, we use it in a joint context with WM, using an assumption that FA regions that co-vary with GM regions are informative (which is the aspect that our included simulation is designed to address).
Our primary purpose was to study the structural underpinning of the DMN. The proposed constrained SBM approach identified a structural network containing both GM regions and WM regions associated with the DMN. We identified GM regions that were frequently reported by functional DMN studies, such as precuneus, MPFC, superior, and middle temporal gyri. In addition, we identified closely related WM regions, including the cingulum, corpus callosum, and superior longitudinal fasciculus, which were demonstrated to play important roles interconnecting different regions of the resting-state networks. This new approach provides at least four distinct advantages. First, as a multivariate strategy, it takes into account the interrelationship between voxels and identifies the naturally existing structural networks. Second, as a semiblind method, it both incorporates the prior information as a constraint and also incorporates data mining to identify nonpredicted associations throughout the entire brain. In addition, our strategy provides spatial filtering that reduces noise, which can possibly contaminate the connectivity maps. And finally, our approach enables examination of the associations of other variables of interest (e.g., gender, age, and IQ scores) with the identified structural networks. The application of constrained SBM to structural brain images thus creates new opportunities to extract structural networks based on prior information.
Conclusion
We present a semiblind multivariate method, constrained SBM, to incorporate prior information and to enhance the performance of SBM. The application of constrained SBM utilized a DMN mask as a constraint and sought a structural network associated with the DMN throughout the whole brain. Our findings support the existence of such underlying structural network associated with the DMN, including both GM regions and corresponding WM regions. Our approach is also generally applicable to a wide variety of studies to extract structural networks incorporating prior information.
Footnotes
Acknowledgments
This study was funded by the National Institutes of Health grants: 1 R01 EB 000840 and 1 R01 EB 005846 (to VDC) and the John Templeton Foundation grant: The Neuroscience of Creativity (to REJ).
Author Disclosure Statement
No competing financial interests exist.
References
Supplementary Material
Please find the following supplemental material available below.
For Open Access articles published under a Creative Commons License, all supplemental material carries the same license as the article it is associated with.
For non-Open Access articles published, all supplemental material carries a non-exclusive license, and permission requests for re-use of supplemental material or any part of supplemental material shall be sent directly to the copyright owner as specified in the copyright notice associated with the article.