
Abstract
Multivariate analysis of functional magnetic resonance imaging (fMRI) data allows investigations into network behavior beyond simple activations of individual regions. We apply group independent component analysis to fMRI data collected in a previous study looking at the sustained neuromodulatory effects of electrical tongue stimulation in balance-impaired individuals. Twelve subjects with balance disorders viewed optic flow in an fMRI scanner before and after 5 days of electrical tongue stimulation. Nine healthy controls also viewed the visual stimuli but did not receive any stimulation. Multiple regression of the 47 estimated components found two that were modulated by the visual stimuli. Component 7, comprised primarily of the primary visual cortex (V1), responded to all visual stimuli and showed no difference in task-related activity between the healthy controls and the balance-impaired subjects before or after stimulation. Component 11 responded only to motion in the visual field and contained multiple cortical and subcortical regions involved in processing information pertinent to balance. Two-sample t-tests of the calculated signal change revealed that the task-related activity of this network is greater in balance-impaired subjects compared with controls before stimulation (p=0.02), but that this network hypersensitivity decreases after electrical tongue stimulation (p=0.001).
Introduction
A
Understanding the neural substrates and interconnections belonging to a network is important when trying to explain signs and symptoms caused by focal neurological damage. However, mapping a given network can be a complex process. First, neuronal structures involved in processing a task must be identified. Although lesion studies have helped to identify many associations between brain regions and their function, they are not precisely controlled (by their nature) and therefore have limited methodology. Technological advances in functional magnetic resonance imaging (fMRI), electroencephalogram, magnetoencephalography, and electrophysiological recordings have allowed investigators to selectively study these associations under controlled conditions (de Marco et al., 2009a). Recent advancements in transcranial electrical stimulation technology have permitted this technique to be used to create temporary “lesions” or in combination with imaging modalities to stimulate one brain region and look for evoked responses in connected regions (Mandonnet et al., 2010; McKeefry et al., 2009).
The next step in understanding a neuronal network is mapping the physical connections (white matter) that connect regions together. Tracer studies are the preferred method of directly measuring white matter tracts; however, these can only be performed in animals. Structural imaging, such as diffusion tensor imaging, has allowed direct visualization of these white matter tracts in humans (Hagmann et al., 2007). However, these physical connections are known to be selectively utilized depending on the task (functional connectivity) and may be uni- or bidirectional (effective connectivity) (Cordes et al., 2000; Friston, 2002). Therefore, simple knowledge of an existing white matter tract is not equivalent to understanding how the network functions when processing a given task.
Connectivity analyses of functional imaging such as correlation/coherence analysis, independent component analysis (ICA), granger causality, structural equation modeling, and dynamic causal modeling can fill this gap by allowing researchers to understand how connections between regions are utilized during particular tasks and how they may be affected by disease or damage to the network (Calhoun et al., 2009; de Marco et al., 2009b; Friston et al., 2003; Roebroeck et al., 2005). These multivariate techniques extend univariate analyses (e.g., general linear model) by looking at several brain regions simultaneously. Depending on the algorithm used, these approaches can detect fluctuations common to multiple brain regions or identify directed influences of one brain region over another.
ICA has been applied successfully to fMRI data to extract signals without the need of the hemodynamic response function (HRF). The benefits of this approach become clear when investigating subjects with processes that may modify the local HRF or when analyzing data from rest scans (Brown et al., 2001; Moritz et al., 2005; Quigley et al., 2002). It is known that many factors such as age, respiration, disease states, and medications can all affect the shape of the HRF (Bonakdarpour et al., 2007; Luchtmann et al., 2010). ICA can identify temporal signals and spatial networks without utilizing any preformed assumptions about neural responses. Additionally, this type of analysis removes the requirement that neural activity scales linearly with task duration, instead finding any strong signal. Finally, ICA algorithms consider both spatial and temporal dimensions of the data equally. This produces both a temporal time series and a spatial map for each component. The z-scores of this spatial map can be considered a measure of the connectivity between active regions within the component (Calhoun et al., 2009).
The network of brain regions that responds to dynamic visual stimuli has been mapped extensively (Lanyon et al., 2009). Multiple brain regions, including the primary and association visual cortices, are thought to play a role in processing this visual information (Cardin and Smith, 2010; Dieterich and Brandt, 2000; Indovina et al., 2005; Kikuchi et al., 2009; Ohlendorf et al., 2008). This network is also the visual component of a larger multi-sensory network that processes information pertinent to maintaining balance (Angelaki and Cullen, 2008; Dieterich and Brandt, 2008; Slobounov et al., 2006). This larger network includes the parieto-insular vestibular cortex (PIVC) and associated regions and subcortical structures such as the vestibular nuclei and multiple regions within the cerebellum (Brandt and Dieterich, 1999; Eickhoff et al., 2006; Indovina et al., 2005). Damage to any of these structures can result in behavioral impairment. Owing to the overlap of these networks, damage can also result in upregulated sensitivity to motion within the visual field that mimics or implies ego-motion (Dieterich, 2007; Mergner et al., 2005; Redfern and Furman, 1994). Previous work has suggested that individuals with central and/or peripheral balance disorders have increased neural activity within V5/hMT+, an association cortex involved in motion perception, compared with healthy controls when viewing optic flow (Dieterich et al., 2007; Wildenberg et al., 2010). If understood as a network, it is likely that this neural upregulation is not limited to V5/hMT+. The abnormal activity within V5/hMT+ should propagate to or derive from other structures within the network.
Our recent work investigated the effects of information-free stimulation of the tongue, termed Cranial Nerve Non-Invasive Neuromodulation (CN-NINM), on the processing of optic flow by individuals with balance disorders (Wildenberg et al., 2010). This study demonstrated that CN-NINM can produce sustained improvements in postural responses and modulate activity within some structures of the balance-processing network. Specifically, activity within V5/hMT+ was no longer upregulated after the stimulation sessions.
Standard fMRI processing considers each brain region (more precisely, each voxel) independently and cannot be used to identify more complex relationships between regions. Multivariate techniques, such as principal component analysis (PCA), ICA, and machine learning algorithms can analyze fMRI data much more generally and allow investigations into how multiple regions behave as a group (Formisano et al., 2008). Unlike general linear model-based approaches, these techniques can find relationships without the need for a priori estimations of neuronal responses.
The voxelwise analysis used in our previous study did not permit investigations into how brain regions that responded to optic flow can be grouped into separate networks or how CN-NINM may affect some or all of these networks. We believe that the brainstem is the initial target for incoming stimulation applied to the tongue. It is reasonable to expect that for stimulation of the brainstem to produce sustained changes in cortical processing of optic flow, activity of the entire network must be modulated. To characterize the upregulation and downregulation of brain networks due to CN-NINM, we used group ICA to reanalyze the fMRI data collected in that previous study (Wildenberg et al., 2010). This report presents the results of this analysis technique and its potential for studying the entire balance-processing network and how it functions as a unit.
Materials and Methods
Subjects
Twelve subjects identified by symptoms of chronic balance dysfunction (M/F: 6/6; mean age: 52.2±10.3 years) and 9 normal controls (M/F: 5/4; mean age: 50.4±12.8 years) participated in the study. Subjects completed consent, screening, and informational forms during their first visit. Inclusion criteria for the balance-impaired subjects were very broad and included anyone with a chronic, stable balance dysfunction that encompassed deficits of balance, posture, and gait. For additional demographic details please see the work of Wildenberg et al. (2010). Balance-impaired subjects were recruited primarily through referral from clinicians aware of ongoing studies within our research group. These balance-impaired subjects were located throughout the United States and traveled to our facility for participation in the study. Controls were recruited from the general population around Madison, Wisconsin. The University of Wisconsin-Madison Health Sciences Institutional Review Board approved all aspects of this study and all subjects signed the approved consent form before participating in the study.
Visual stimuli and display
Two visual stimuli were used to activate structures involved in balance processing while subjects remained stationary within the MRI scanner. The control stimulus (static) was a static checkerboard of alternating white and black squares with an edge length of 230 pixels. Two-dimensional optic flow (dynamic) was presented using a video derived from the static checkerboard image. An apparent in/out motion arose from varying the size of the squares using a sinusoidal oscillation with a frequency of 0.2 Hz. Additionally, rotation about the center of the viewfield was produced using the superposition of two sinusoids (0.2 and 0.35 Hz) to prevent prediction of the motion. These stimuli were identical to those described in our previous study (Wildenberg et al., 2010). Both stimuli had a total image size of 800×600 pixels (equal to the resolution of the display goggles) and the dynamic video was displayed at 60 frames-per-second.
During the functional MRI scans, all subjects were shown the two visual stimuli in a pseudo-randomized block-design paradigm. Each stimulus was displayed for 12 sec in blocks of three to six repetitions (Fig. 1A). Within a block, the stimulus presentations were separated by 6 sec of fixation to reduce the contamination of neural responses from one stimulus presentation into the next (O'Connor et al., 2008). The order of stimulus presentation was the same for all subjects.

Subjects viewed the visual stimuli on head-mounted display goggles (Resonance Technology, Northridge, CA). These goggles produce a display with a 30° horizontal and 22° vertical field-of-view in each eye. Although this is not a full-field optic flow, subject reports and preliminary data indicate that it is sufficient to cause mild discomfort and to activate neural structures involved in processing visual-motion information. A mask of black fabric was placed over the subject's head and goggles to block all remaining ambient light.
Behavioral data
Subjects' gait was analyzed using the Dynamic Gait Index (DGI) (Whitney et al., 2003). Additionally, subjects completed two subjective batteries to describe their self-perception of any impairment, the Activities-specific Balance Composite scale (ABC) and the Dizziness Handicap Index (DHI) (Powell and Myers, 1995). Subjects completed these measures at the same time as the postural sway tests on day 0 and again on day 5 to identify any improvements due to CN-NINM (Fig. 1B).
These three metrics are not completely independent; therefore, Hotelling's T-squared test was used to look for significance across the multivariate data. Post-hoc paired t-tests were performed separately on each metric to identify significant changes in these measures due to the CN-NINM.
MRI data collection
MRI data were acquired on a 3T clinical MRI scanner (GE Healthcare, Waukesha, WI). T1-weighted anatomical images were collected using a spoiled gradient recalled (3D-SPGR) pulse sequence (TR=10 ms, echo time=3 ms) over a 256×256 matrix and 94 axial slices (0.94×0.94×1.5 mm resolution). Two functional scans were acquired with a T2*-weighted gradient-echo echo-planar imaging sequence (TR=2000 ms, echo time=30 ms, flip angle=75 degrees) to acquire BOLD signal over a 64×64 matrix and 28 axial slices (3.75×3.75×5 mm resolution). The first three volumes of each functional scan (252 total volumes) were discarded to allow T1 saturation. Balance-impaired subjects underwent two scanning sessions, one before and one after the stimulation regimen. Normal controls underwent one scanning session. The second functional run of one balance-impaired subject and one healthy control were cut off prematurely because of scanner malfunction. The group ICA algorithm requires scans of equal length; therefore, only the first functional runs for all subjects were used for analysis.
Tongue stimulation
Stimulation to the tongue was delivered via a small electrode array placed on the anterior portion of the tongue and held in place by pressure of the tongue to the roof of the mouth (Kaczmarek, 2011; Tyler et al., 2003). The sensation produced by the array is similar to the feeling of drinking a carbonated beverage. To prevent possible disease transmission, the electrode array was sterilized using gluteraldehyde between subjects.
CN-NINM stimulation consists of three-square-pulse bursts with an intraburst frequency of 200 Hz and an interburst frequency of 50 Hz that did not vary throughout the duration of the stimulation session. The signal was not coupled to any sensor and therefore did not provide any useful exogenous information to the subject (Danilov et al., 2006, 2007).
Procedure
On the day of the first visit (day 0, Pre-CN-NINM and Normal), all subjects underwent an MRI scan to collect neural responses to the visual stimuli (Fig. 1B). CN-NINM stimulation was delivered to the balance-impaired subjects over nine stimulation sessions (two on days 1–4 and one on day 5). During a stimulation session, subjects received continuous stimulation for 20 min while standing as still as possible with their eyes closed. A physical therapist was always present to prevent any falls.
After completion of the ninth stimulation session, balance-impaired subjects repeated the fMRI scan. The procedures for the scan on day 5 (Post-CN-NINM) were identical to those completed on day 0. The post-CN-NINM scan was completed between 3 and 6 hours after the final stimulation session.
MRI data analysis
MRI data were preprocessed using AFNI (Cox, 1996). This processing included corrections for slice-time acquisition errors and subject motion and also spatial smoothing with a 5 mm FWHM isotropic Gaussian filter. Data from all subjects was then normalized to MNI space using SPM8 and resampled using 7th-degree b-splines to a resolution of 3×3×3 mm3.
ICA was performed using temporal concatenation as implemented in the GIFT 1.3 h package (Calhoun et al., 2009). The GIFT package also incorporates a back-reconstruction step that allows the production of subject-specific spatial maps for each component. This step allows the spatial extent of each network to vary across each subject and for a postanalysis comparison of the network topology.
Prior to any ICA procedures, the entire dataset was masked to include only grey matter structures. To determine the approximate number of components to include, dimension estimation of all datasets (33 runs) was performed using the minimum description length criterion (Jafri et al., 2008). This analysis calculated an average dimensionality of 47±6.7 across all datasets. All data were temporally concatenated and the dimension of the data was reduced using two rounds of PCA prior to ICA. Forty-seven independent components (ICs) were estimated using the Infomax algorithm applied to the masked data (Obradovic and Deco, 1998). The Infomax algorithm was chosen to maximize spatial independence of the components (Hansen, 2000). Temporal independence is inherent in the group ICA algorithm.
Fifty iterations of the ICA were performed to verify consistency of the components. The resulting IC time-courses and spatial maps were back-reconstructed and the time courses were scaled to percent signal change to facilitate comparisons across subjects. For each component, the spatial map shows the intensity of the component throughout the brain while the time course corresponds to the waveform of the coherent brain activity (Mantini et al., 2007).
Unlike other methods of blind source separation such as principle component analysis (PCA), the estimated components from ICA are not sorted and some method must be used to identify components of interest. After ICA estimation, a multiple regression of the 47 component time-courses was performed sequentially across the 33 scans using the experimental block design convolved with the SPM8 canonical HRF (Fig. 2 top). This procedure is similar to a standard GLM analysis except that the dependent variables are the component waveforms and not the voxel waveforms. This sorting step allows identification of components that are modulated by the visual tasks.
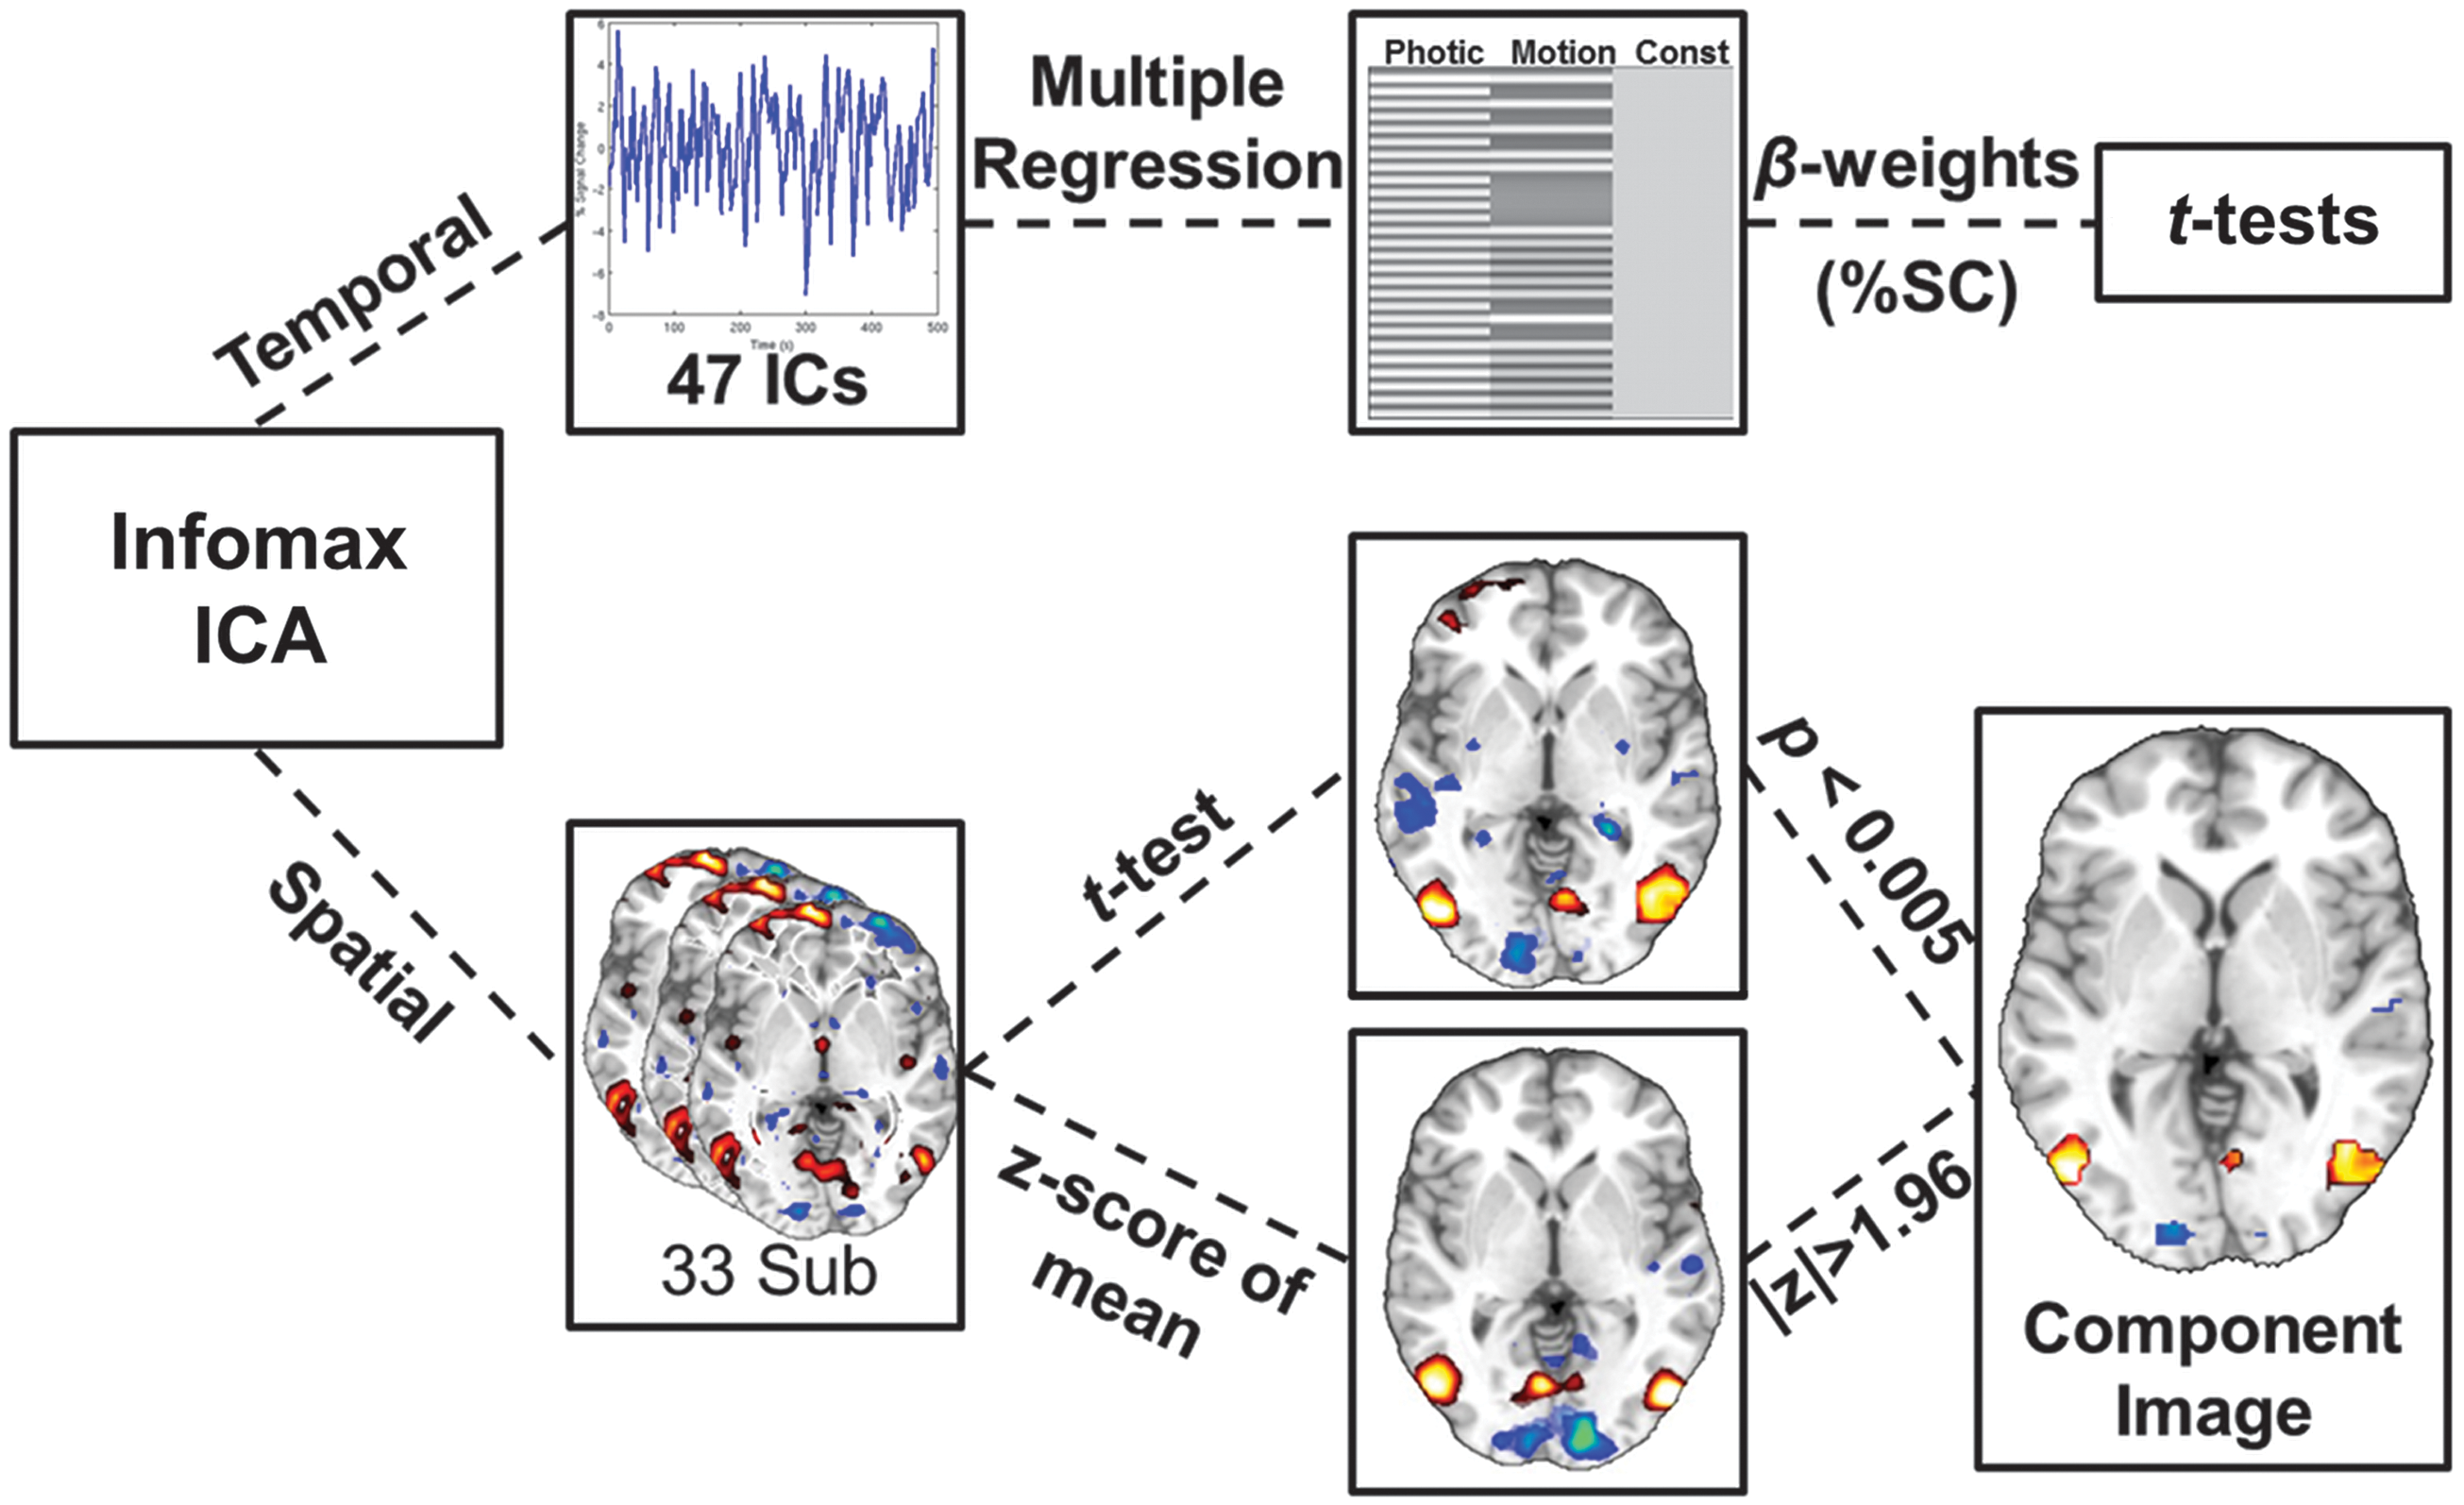
ICA processing stream of the fMRI data. The Infomax algorithm applied to the temporally concatenated dataset produced 47 components. The algorithm calculated 47 individual time-courses and back-propagated a spatial map for each subject. The time courses were analyzed with multiple regression and t-tests to look for components modulated by the two visual tasks (Photic and Motion). The spatial maps were entered into a one-sample t-test and masked by z-scoring the mean image. The resulting spatial image shows only brain regions that are consistent across subjects and also contribute strongly to the component. ICA, independent component analysis.
To construct the task waveforms, both the static and dynamic stimuli were combined to form Photic (static + dynamic), whereas only the dynamic stimulus was used to form Motion (dynamic only). This grouping will separate components that are modulated by all visual stimuli from those that selectively respond to motion. This analysis produces 47×2×33 beta-weights. The beta-weights for each run from the multiple regression, reflecting percent signal change, were input into one-sample t-tests to look for components that were modulated by one or both of the tasks across all subjects. To correct for the 94 t-tests performed at this step, a Bonferroni corrected significance level of p≤0.005≈0.05/94 was used. Only beta values from components showing modulation by task were used to test for group differences. Two-sample t-tests were used to compare pre- and post-CN-NINM with controls. A paired t-test was used to compare pre- with post-CN-NINM.
The spatial distributions of the components identified in the multiple regression analysis were investigated by performing one-sample t-tests of the individual back-reconstructed component spatial maps across all subjects (Fig. 2 bottom). In addition, the mean of the spatial maps was z-scored to form a mask with |z|>1.96. The results from the t-tests were then masked to reveal only voxels that were highly consistent across subjects (t-test) and strongly contributing to the component (mask). Unmasked two-sample t-tests were also performed to look for any group differences in the spatial distributions of the components.
Multiple comparison correction for the spatial t-tests was performed using AFNI's AlphaSim Monte-Carlo simulations (Forman et al., 1995). This method allows for a combination of thresholding and spatial clustering to produce a corrected p-value. Results from these simulations indicated that only clusters thresholded at α≤0.005 with a volume greater than 270 μL would have global significance at p≤0.05. Only clusters with volumes greater than this cutoff are displayed in the figure and table.
Results
All but two components identified by the Infomax algorithm showed high consistency (intracluster similarity: >0.9) across the 50 iterations. The components modulated by the visual tasks had a similarity of >0.97.
Behavioral results
Subjects who received stimulation with CN-NINM improved on all three behavioral measures (Table 1). Subjects before CN-NINM had an average DGI score of 19.0±4.3, a DHI score of 58.8±23.8, and an ABC score of 57.9±24.4 (note that for the DHI, lower scores indicate less impairment). The same subjects after CN-NINM had an average DGI score of 22.9±1.4, a DHI score of 35.7±24.0, and an ABC score of 75.3±21.2. Hotelling's T-squared test found a global improvement due to CN-NINM (T=37.2, p<0.005). The improvements on the DGI, DHI, and ABC were all significant with p-values of <0.005, <0.0005, and <0.005, respectively.
Balance-impaired subjects showed almost universal improvement on the three measures. Hotelling's T-squared test showed this improvement to be significant (p<0.005).
DGI, Dynamic Gait Index; ABC, Activities-specific Balance Composite; DHI, Dizziness Handicap Index.
Multiple regression and group differences
One-sample t-tests of the beta-values obtained from the multiple regression revealed two components with statistically significant modulation by the tasks. Component 7 showed modulation by both Photic and Motion (p<10E−7 and p<0.005, respectively) across all individuals. Component 11 showed modulation only by Motion (p<5E−6).
The modulation of component 7 by the two tasks showed no differences between groups (Fig. 3). The modulation of component 11 by Motion was stronger in balance-impaired individuals pre-CN-NINM compared with controls (T 20=2.52, p=0.02; Fig. 4). Additionally, this modulation was greater in balance-impaired individuals pre-CN-NINM compared with post-CN-NINM (T 23=3.65, p=0.001). There was no difference between balance-impaired individuals post-CN-NINM and controls.
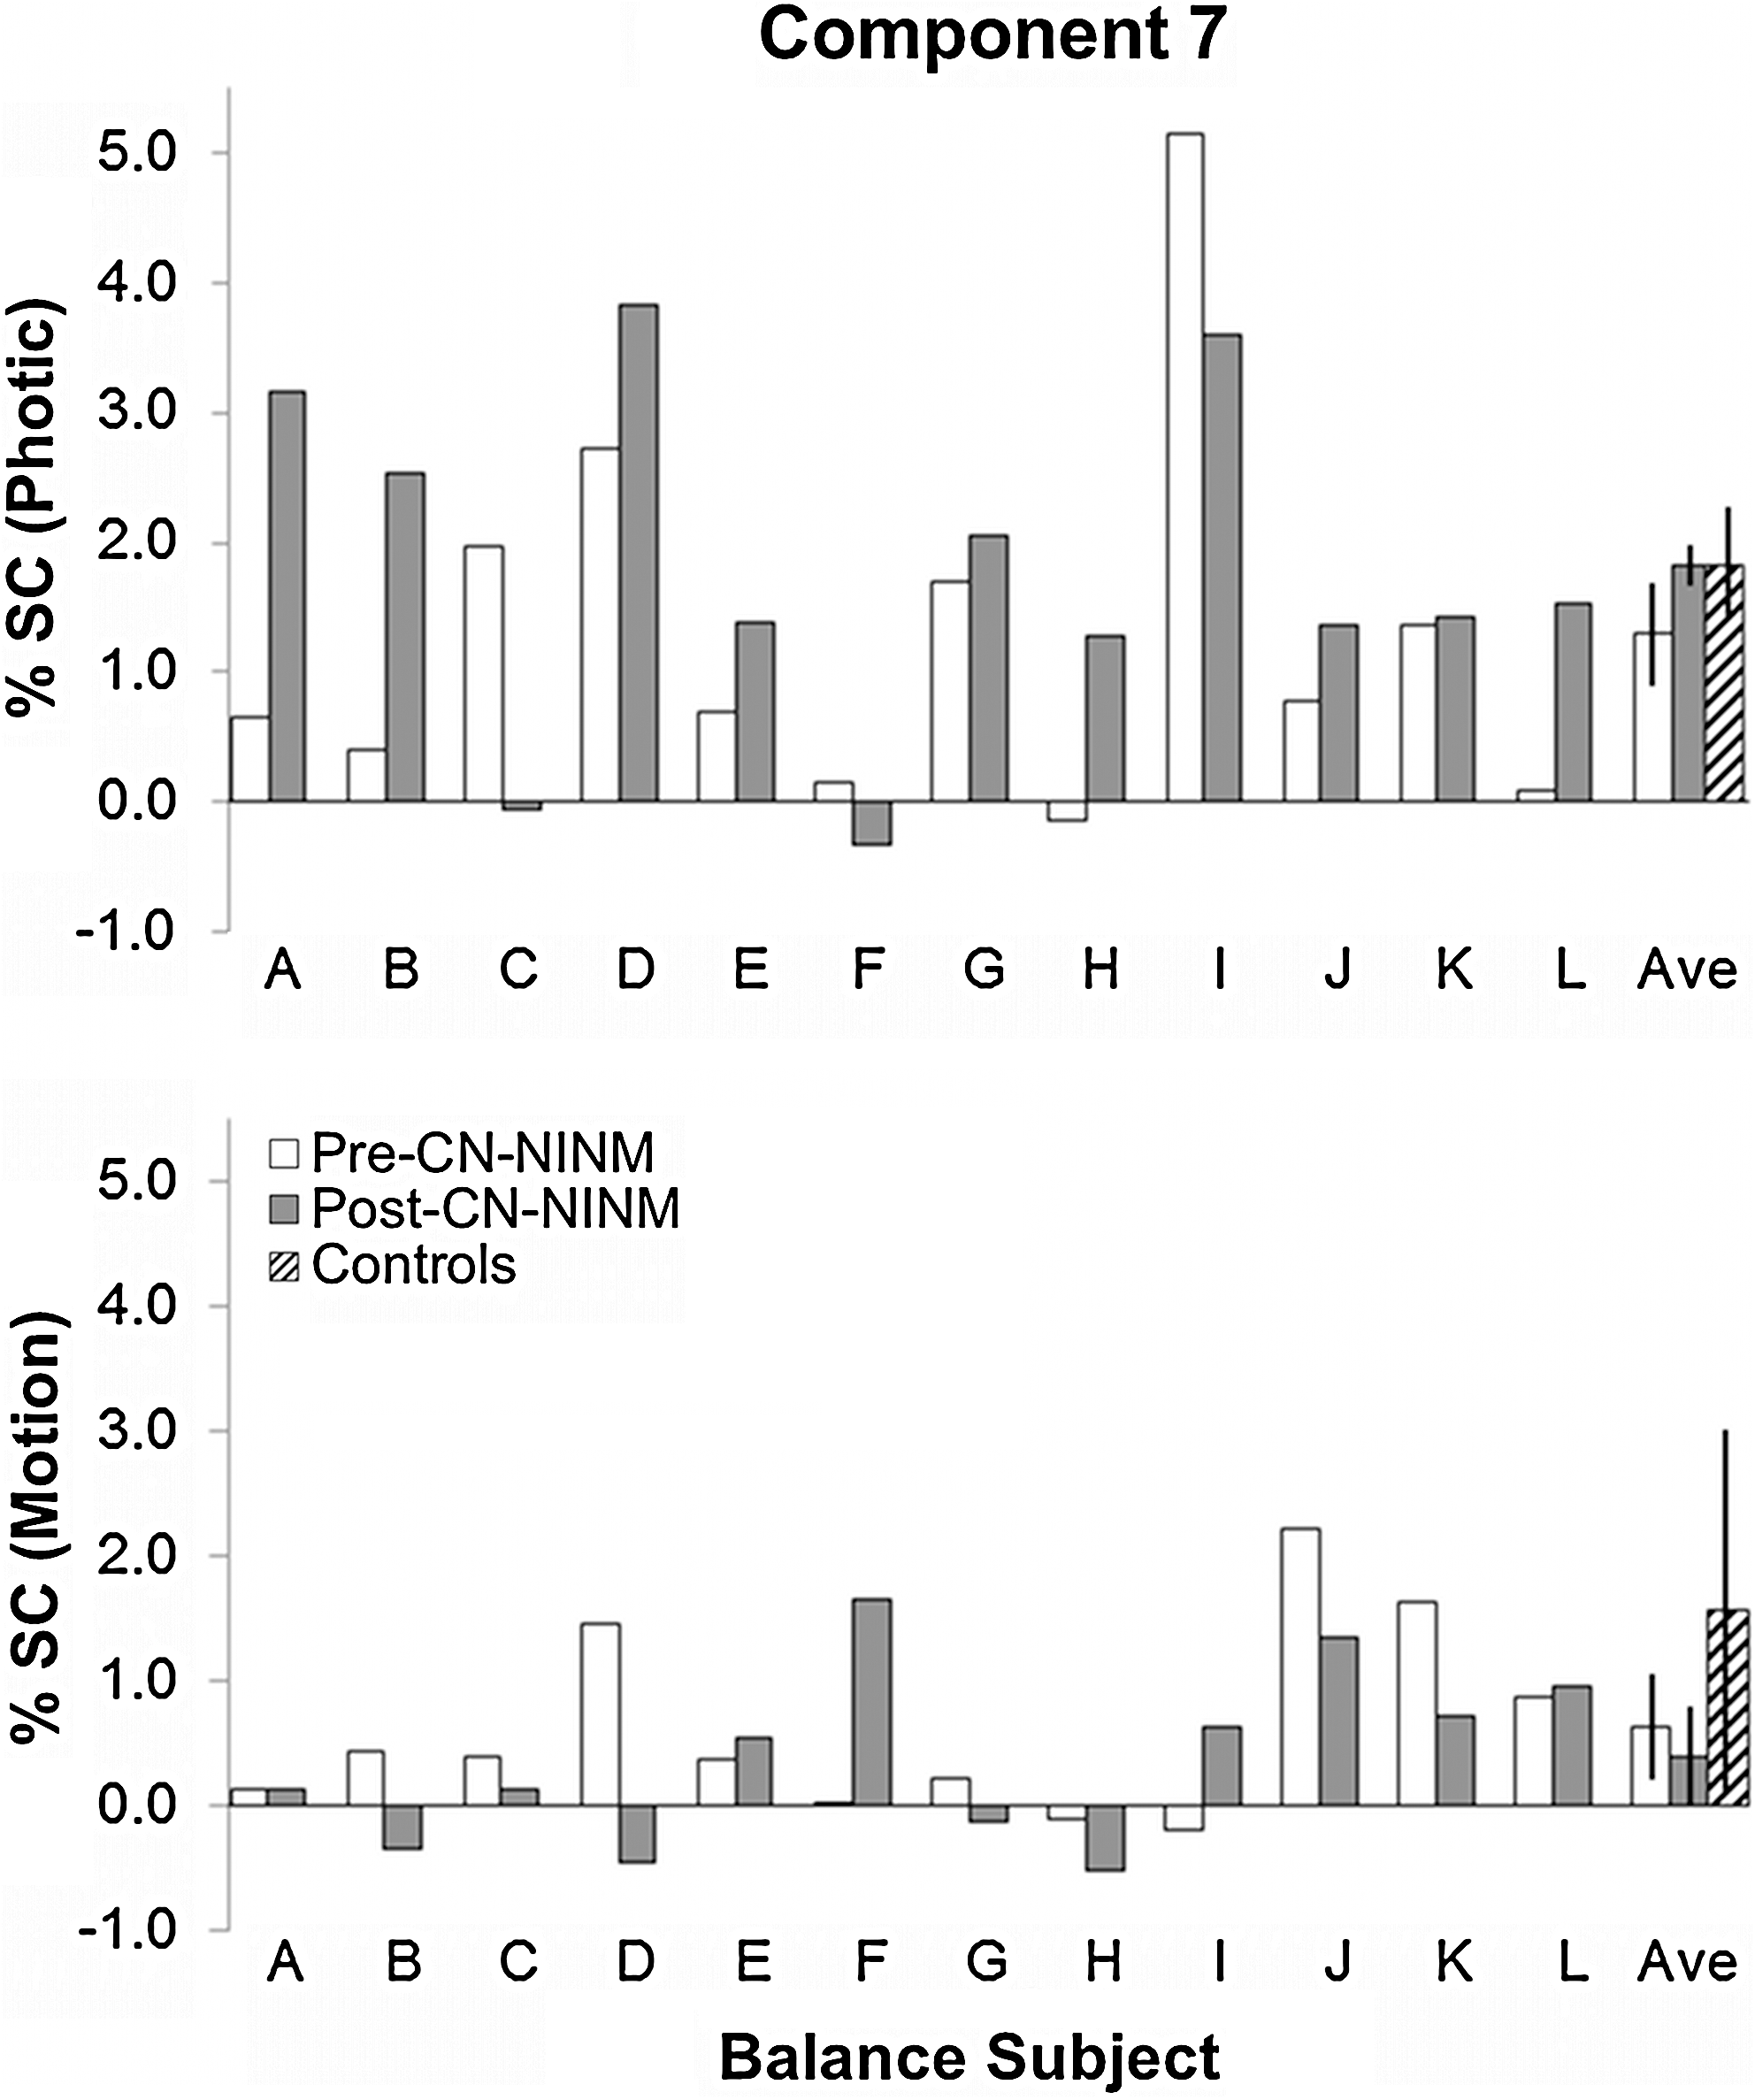
Multiple regression beta values in percent signal change for the balance-impaired subjects showing modulation of component 7 by the Photic (top) and Motion (bottom) visual stimuli. All three groups showed significant modulation of these components; however, the effect was much stronger for Photic (p<1E-7) than Motion (p<0.005). There were no significant differences between the groups for either stimulus. Error bars are 95% confidence intervals of the mean.
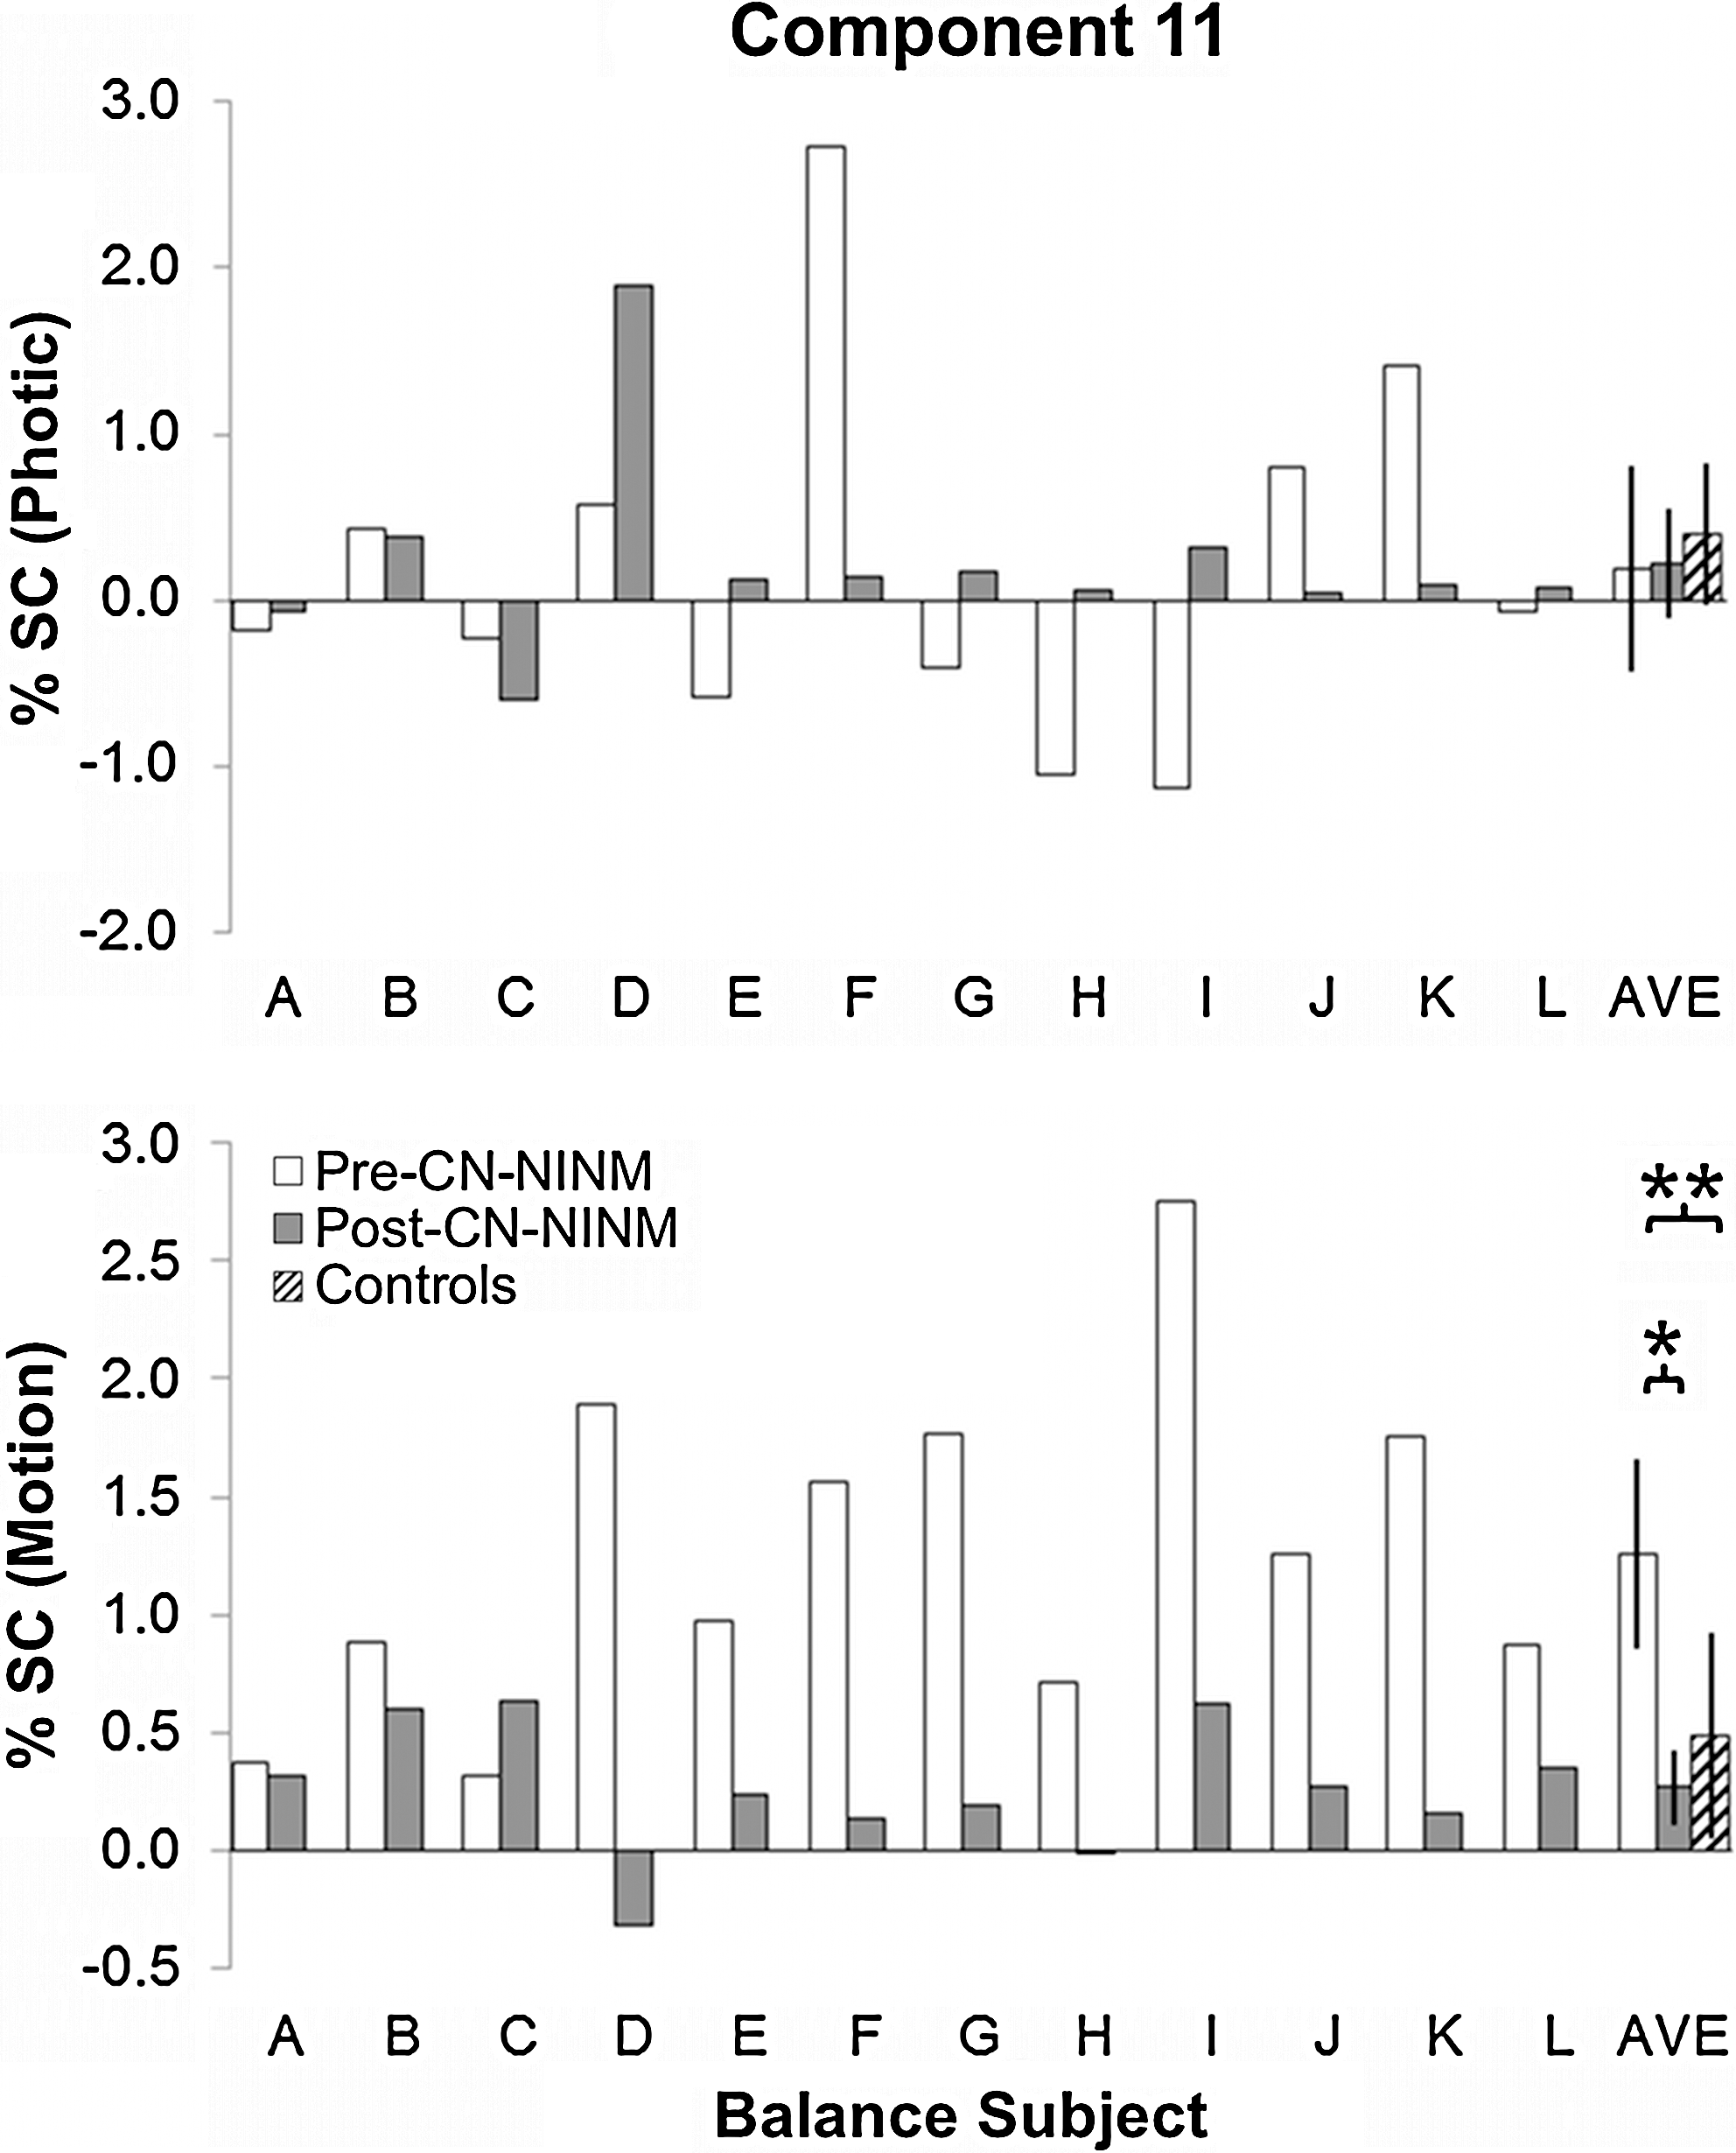
Multiple regression beta values in percent signal change for the balance-impaired subjects showing modulation of component 11 by the Photic (top) and Motion (bottom) visual stimuli. There was no significant modulation of this component by the Photic task in any group or any group difference. Balance-impaired subjects had greater modulation by Motion Pre-CN-NINM compared with healthy controls (**p=0.02, two-sample t-test). This modulation was decreased after the week of stimulation (*p=0.001, paired t-test). Error bars are 95% confidence intervals of the mean. CN-NINM, cranial nerve non-invasive neuromodulation.
Spatial distribution of the task-related components
Component 7 was primarily composed of one large area of activation in the center of the occipital lobe along the cuneus (Fig. 5 and Table 2). There were also several regions of deactivation including the left angular gyrus, the right retrosplenial area, and bilateral deactivations of the lateral occipital gyrus and superior marginal gyrus.
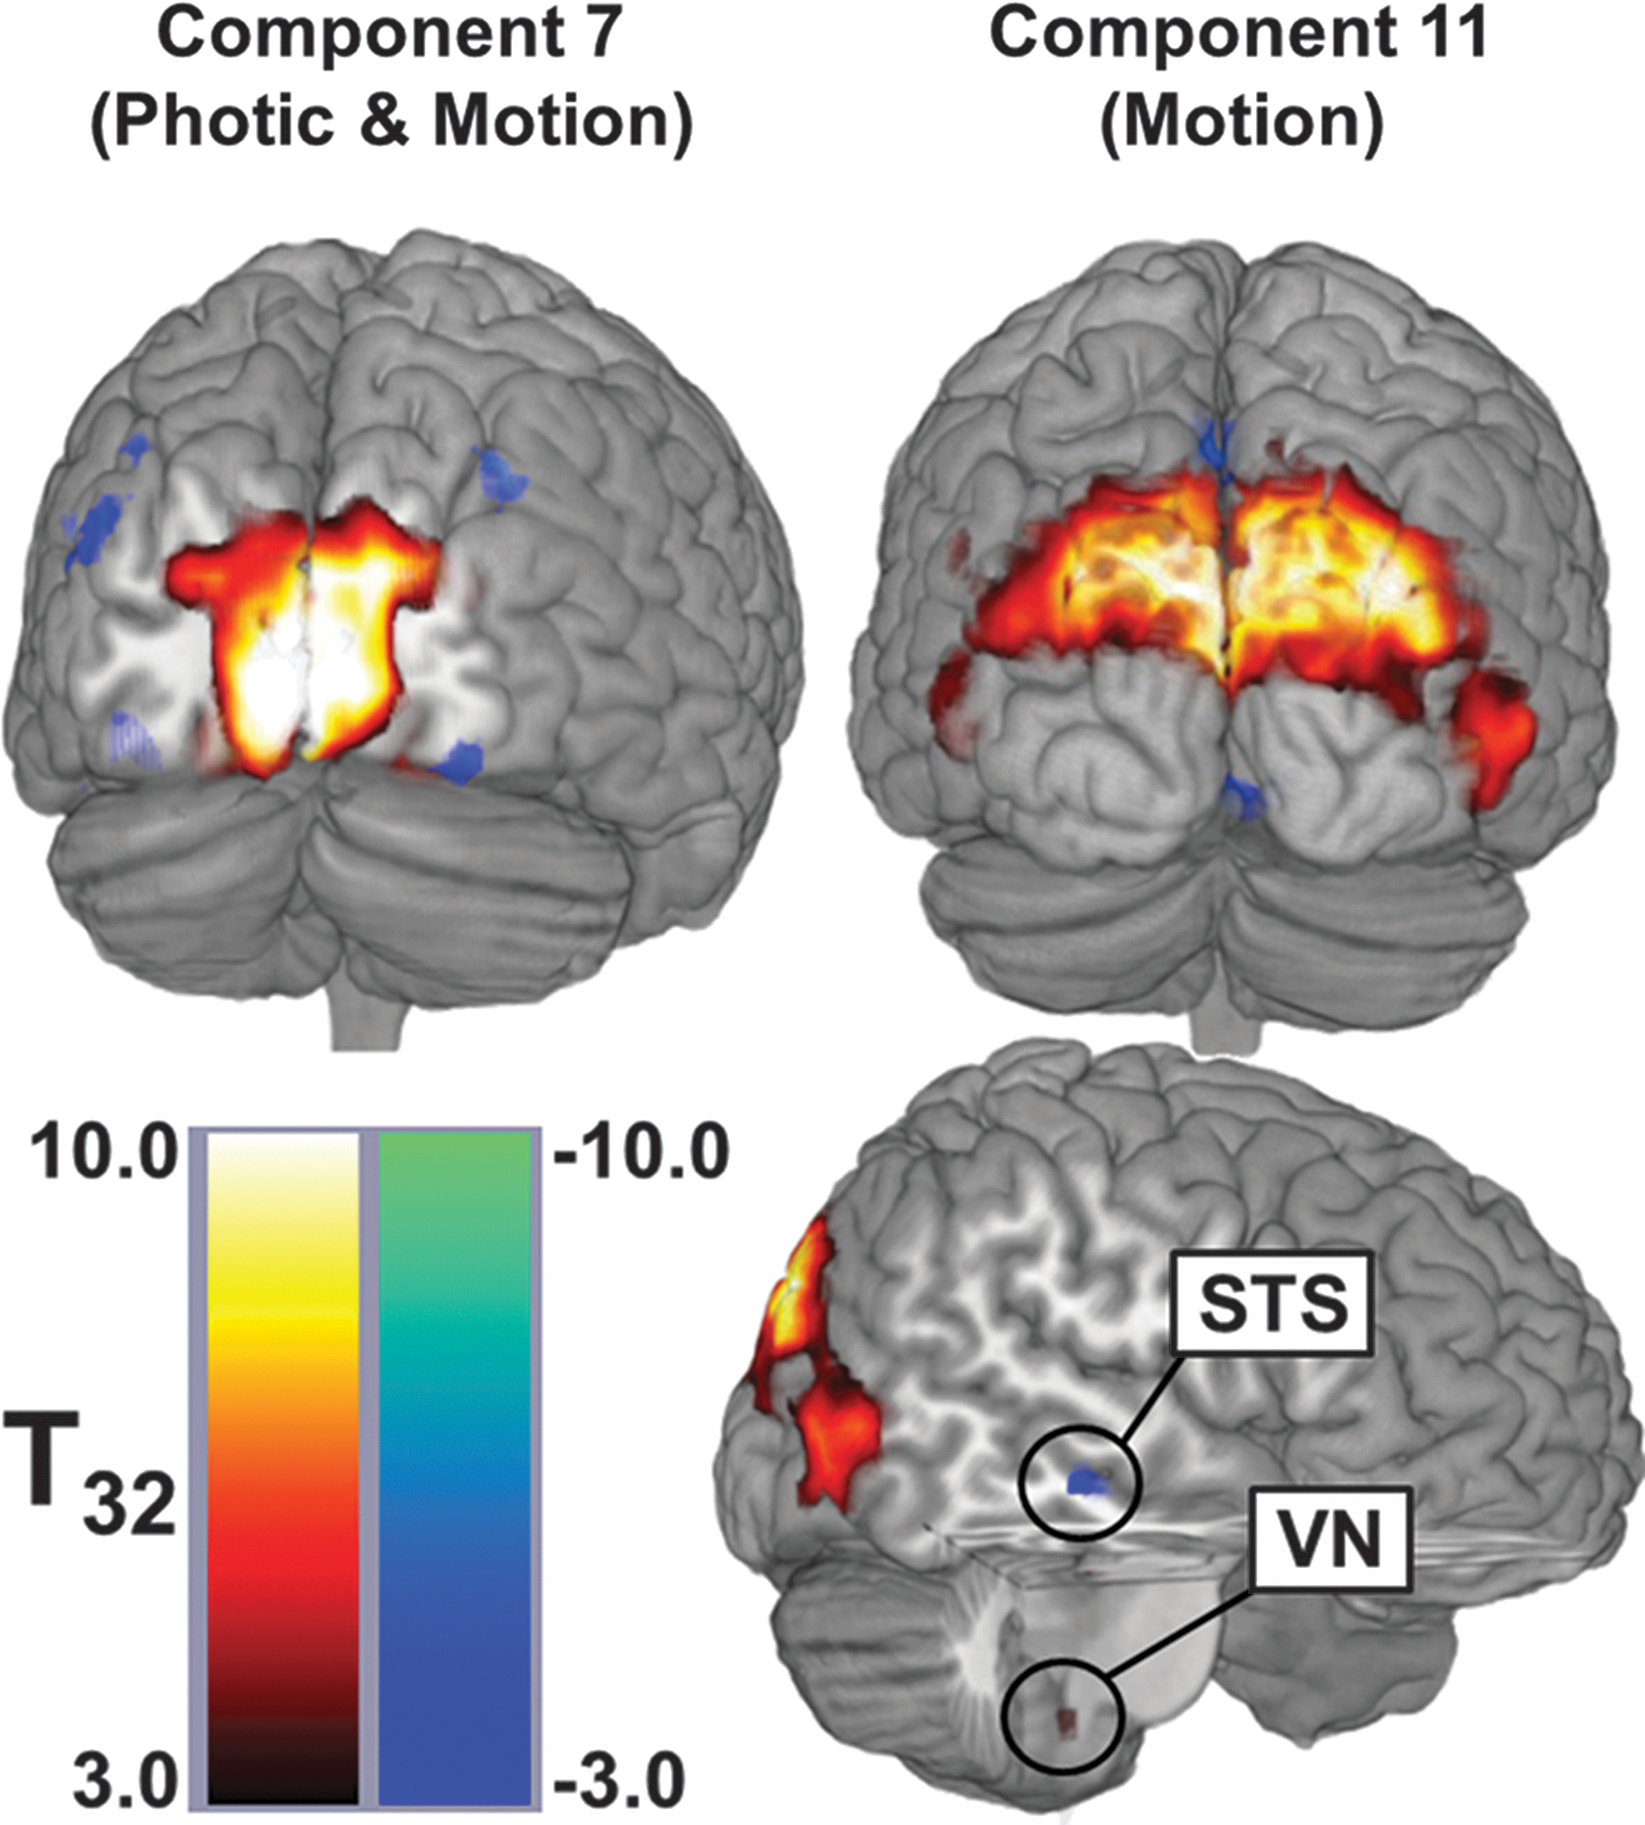
Spatial distributions of the two networks identified by multiple regression analysis. These maps were produced by masking the spatial t-tests with the z-scored image. Component 7 (left) was modulated by both visual tasks and localizes to the posterior occipital lobe. Component 11 (right) was modulated only by Motion and includes multiple visual association cortices, the superior temporal sulcus (STS), which is part of the multisensory processing network, and a region within the brainstem that appears to be the vestibular nucleus (VN). This view does not present all active regions for each network but does show the largest areas and those consistent with previous studies using optic flow.
Only clusters with a significance of p<0.005 and volume greater than 270 μL are reported. The center of mass for each cluster in x, y, and z coordinates is reported in MNI space (the ICBM152 atlas).
Decreased activation.
LOG, lateral occipital gyrus; SMG, superior marginal gyrus; AG, angular gyrus; RSA, retrosplenial area; SPL, superior parietal lobule; LG, lingual gyrus; IFG, inferior frontal gyrus; FG, facial gyrus; ParaHG, parahippocampal gyrus; STS, superior temporal sulcus; T. Pole, temporal pole; A, anterior; R/L/B, right/left/bilateral; D, dorsal.
Component 11 was composed of bilateral activations of the superior parietal lobule and the lateral occipital gyrus. It also contained unilateral activations of the left inferior frontal gyrus, the left parahippocampal gyrus, the left anterior insular, and the left dorsal medulla. Finally, there were deactivations of the left facial gyrus, regions surrounding the right superior temporal sulcus, and bilateral deactivations of the ligual gyrus and precuneus.
Two-sample t-tests revealed no significant spatial differences between groups for either component identified by the multiple regression.
Discussion
Subjects who received CN-NINM tongue stimulation showed behavioral improvements on all three physical therapy measures. These improvements are consistent with the decreased postural sway due to optic reported in our previous study (Wildenberg et al., 2010). The DGI can be reliably used to measure dynamic gait instability and risk of fall and in evaluating gait improvements resulting from interventions (Marchetti et al., 2008). The improvements on the ABC indicate an increased perception of functional mobility (Myers et al., 1998). In general, the DHI is good at predicting functional impairment in individuals with dizziness; however, there is much overlap with the measured impairment from the DGI (Vereeck et al., 2007; Whitney et al., 2004). Regardless, better scores on all of these measures indicate that CN-NINM stimulation can produce sustained improvements in individuals who have chronic balance impairment.
The spatial distribution of component 7 is largely comprised of V1, with slight deactivations of some of the association visual cortices. The multiple regression analysis found that this component was modulated by both the Photic and Motion tasks. This response is expected given our current understanding of the role of V1 in processing visual stimuli. All visual stimuli activate V1, where low-level processing occurs prior to transmission of this information to association cortices for more complex processing (McKeefry et al., 2009). It is not surprising that there were no group differences in the way the visual tasks modulated this component. V1 is not normally associated with extraction of information pertinent to balance from visual input; therefore, we would not expect damage to other regions of the balance-processing network to affect processing in V1.
Component 11 was, in contrast, only modulated by the Motion visual stimulus. The spatial distribution of this component included multiple brain regions. Activations of the visual association cortices (V5/hMT+ and V3A) are expected for regions known to respond to motion in the visual field (Caplovitz and Tse, 2007; Kikuchi et al., 2009; McKeefry et al., 2009). Although we did not see any deactivation of the PIVC, we did find a cluster of deactivation along the superior temporal sulcus. This region is also a multisensory cortical area implicated in processing of visual motion, audiovisual integration, and the theory of mind (Hein and Knight, 2008). This region is similar to deactivations seen in other studies using optic flow and have been associated with the “multisensory corticovestibular system” (Bense et al., 2005; Dieterich et al., 2003; Guldin and Grusser, 1998). Additionally, the anticorrelated response of the multisensory network compared with V5/hMT+ supports the reciprocal-inhibitory interaction theory proposed by Brandt and colleagues to explain the activations/deactivations of these regions during visual and vestibular stimuli (Bense et al., 2005; Brandt et al., 1998). Finally, the vestibular nuclei, intimately related to the cerebellum and a direct input to the vestibular cortices, also showed modulation by Motion (Bense et al., 2006). This region was found to respond to optic flow using high-resolution imaging of the brainstem (Wildenberg et al., 2011). The grouping of these regions into a single component that responds to optic flow suggests these regions function as a network that works together to process optic flow. The entire network is activated and suppressed together, though individual regions can still work independently (as represented by the other nontask-related components). The application of a multivariate analysis technique to this fMRI data extracts interactions between brain regions that could not be found using univariate techniques.
The largest contributions to component 11 are composed primarily of regions from the visual cortices. It is possible that activity reported in the other regions, including the region within the brainstem, are dominated by the effects from the visual cortices. Although similar in location, the brainstem cluster found in this analysis is not identical to the cluster found in the previous GLM analysis (Wildenberg et al., 2010). We believe that the increased activation of this region in the GLM analysis was driven by the trigeminal nuclei. We also believe that the inclusion of this region into component 11 suggests a vestibular origin for the signal. Unfortunately, the resolution of standard fMRI images prevents explicit identification of these small structures or measurement of separate waveforms for each.
Consistent with previous studies investigating the effects of optic flow in individuals with balance disorders, the balance-impaired subjects pre-CN-NINM showed increased modulation of the balance-processing network by visual motion compared with healthy controls (Dieterich et al., 2007; Dieterich and Brandt, 2008; Wildenberg et al., 2010). These previous studies used voxelwise analyses and only found significant group differences in V5/hMT+ and V3. If these regions behave as a network when processing motion in the visual field, the entire network is expected to be affected and not just individual regions. The ICA results in this study supplement those previous studies by suggesting that balance-impaired individuals have upregulation of the entire network, not just V5/hMT+. Further, this upregulation decreases after a week of CN-NINM stimulation, suggesting that the stimulation normalizes activity within the network.
Evidence from both behavioral and imaging studies investigating deficits in individuals with balance dysfunction point to network-wide changes even when the anatomical lesion is localized (Bronstein, 2004; Dieterich, 2007; Dieterich et al., 2007; Horak, 2009; Uneri and Polat, 2009). These findings suggest that it is necessary to understand how insults affect not only local neural tissue, but also how it changes network behavior. Behavioral improvements indicate that CN-NINM interacts with the balance-processing network to reduce deficits in balance-impaired subjects regardless of the underlying etiology. This study found reduction of the upregulation of network activity in response to motion in the visual field after CN-NINM. Although we only measured neural activity due to optic flow, it is likely that the stimulation also influences how this network processes other types of balance-pertinent information. These findings begin to explain how this stimulation can result in improvements in posture control and gait and subjective symptoms of dizziness, nausea, and ability to concentrate. They also begin to elucidate how this type of electrical stimulation interfaces with the balance-processing network, a requirement for understanding how the stimulation induces network compensation (Mandonnet et al., 2010).
The results presented here do not yet allow an understanding of exactly how stimulation to the tongue interfaces with the neural structures involved in processing balance-pertinent information. A region within the dorsal medulla is included in the network sensitive to visual motion. We believe this region is the vestibular nuclei that sit adjacent to the trigeminal and solitary nuclei (cranial nerves 5 and 7, respectively). It is possible that stimulation to the tongue travels along one or both of these cranial nerves and interfaces with the balance-processing network at this point. Interconnections between these nuclei have been found in anatomical tracer studies (Buisseret-Delmas et al., 1999). Modulation of these connections may alter the processing of balance-pertinent stimuli within the brainstem. Ascending projections to the PIVC from the vestibular nuclei or hMT/V5 from the trigeminal nuclei are possible pathways for this subcortical modulation to affect cortical processing (Matteau et al., 2010). Further studies are necessary to understand how this modulation propagates throughout the cortex.
Our original study also collected postural sway data for the balance-impaired subjects before and after stimulation and for the healthy controls. These data indicated that CN-NINM likely reduces sway in response to optic flow. Using a correlation analysis, we attempted to determine whether the change in sway was related to the network modulations found here. No significant correlation was found. The visual stimuli shown to subjects were used to activate structures involved in processing stimuli pertinent to balance within the confines of the MRI scanner. The brain network that responded to these stimuli was significant for its lack of motor cortex or cerebellar contributions. Performing the behavioral tasks likely requires multiple additional structures within the CNS. Although there is no question that correlation between network activity and any of the behavioral measures would have bolstered our arguments, there are many additional contributions to balance that we have not modeled (e.g., vestibular and proprioceptive input). Therefore, the global functioning of the entire balance-processing network may not be sufficiently captured by the network that responds to visual motion.
The data from the original study, and thus the analysis presented here, were limited by a lack of control subjects who did not receive CN-NINM stimulation. The time-intensive stimulation procedures prevented recruitment of subjects willing to be assigned to a placebo while the noticeable sensation of the stimulation on the tongue further reduced the ability to create a true placebo effect. We believe that the chronic nature of the impairments in the included subjects makes spontaneous recovery unlikely. It is possible that some of the observed changes between the first and second scan for the balance-impaired subjects could have been due to increased comfort in the scanner, or other variables such as sleep or caffeine use. We believe that these effects are minimal as all balance-impaired subjects had undergone one (or multiple) clinical MRIs in the course of the workup for their disorder and it is unlikely that individual factors (sleep, caffeine, etc.) would present at the group level. We also believe the 5-day separation between the pre- and post-fMRI scans eliminated the possibility of habituation to the visual stimuli as exposure to optic flow is common in everyday life. Future studies are needed to verify that the changes seen in the pattern of neural activity in response to optic flow are indeed due to the stimulation alone.
Further, the patient population used in this study was composed of various underlying etiologies. Although previous studies have found differential responses between central and peripheral vestibular activation patterns when using direct vestibular stimulation, the activity due to optic flow appears consistent with a study using only peripheral vestibular patients (Dieterich et al., 2007; Dieterich and Brandt, 2008). The ability for CN-NINM to modulate activity within the entire network may explain why this therapy seems to be effective regardless of etiology.
Conclusion
Although standard fMRI analysis techniques can provide useful information about responses of individual brain regions, multivariate analyses provide a deeper understanding of how regions work together when performing specific tasks. We have shown that multiple regions, including the visual association cortices, the vestibular cortices, and the vestibular nuclei, are involved in processing optic flow. The entire network is upregulated in individuals with balance dysfunction, possibly explaining the increased sensitivity to visual motion described by these individuals (Mergner et al., 2005; Redfern and Furman, 1994). Electrical stimulation to the tongue, already shown to affect processing in some of these areas, may normalize activity within the entire network, supporting the sustained subjective and behavioral improvements seen in these subjects after the stimulation (Danilov et al., 2006, 2007; Wildenberg et al., 2010). The ability to simultaneously treat the behavioral and subjective deficits in individuals with balance disorders would be a significant improvement over current therapies, which primarily focus on desensitization of the subjective deficits but are less effective at improving the behavioral deficits (Brandt et al., 2009, 2010; Hall and Cox, 2009).
Footnotes
Acknowledgments
The authors gratefully acknowledge Kelsey Hawkins, for clinical coordination, and Sterling Johnson, for use of the goggle display system. This study was supported by grants (no. T90DK070079 and R90DK071515) from the National Institute of Diabetes and Digestive and Kidney Diseases, the Clinical and Translational Science Award (CTSA; 1UL1RR025011) program of the National Center for Research Resources, National Institutes of Health, and UW-I&EDR funding.
Disclaimer
The content is solely the responsibility of the authors and does not necessarily represent the official views of the National Institute of Diabetes and Digestive and Kidney Diseases or the National Institutes of Health.
Author Contribution
J.C.W. designed, collected, and analyzed all data and prepared the manuscript. M.E.T. and Y.P.D. performed CN-NINM stimulation of all subjects and edited the manuscript. K.A.K. and M.E.M. provided technical and analysis expertise and edited the manuscript.
Author Disclosure Statement
Joseph Wildenberg was supported by grant number T90DK070079 and R90DK071515 from the National Institute of Diabetes and Digestive and Kidney Diseases. Authors Danilov, Kaczmarek, and Tyler have an ownership interest in Advanced Neurorehabilitation, LLC, which has intellectual property rights in the field of research reported in this publication. Mary Meyerand reported no financial or potential conflicts of interest.