
Abstract
The aim of this study was to determine functional connectivity among patients with pediatric bipolar disorder (PBD) who are responders to pharmacotherapy and those who are nonresponders, and learn how they differ from healthy controls (HC) while performing a task that engages affective and cognitive neural systems. PBD participants (n=34; 13.4±2.3 years) were defined as responders if there was ≥50% improvement in Young Mania Rating Scale (YMRS) scores (n=22) versus nonresponders with <50% improvement (n=12) with one of three mood stabilizing medications (divalproex, risperidone, or lamotrigine). HC (n=14; 14.2±3.1 years) participants also were scanned at baseline and follow-up. During functional magnetic resonance imaging, participants performed a color-matching task in which they had to match the color of positive, negative, or neutral words with colored dots. Independent component analysis was used to identify functionally connected networks across the whole brain, which were subsequently interrogated using region-of-interest analyses to test for group differences. A frontolimbic network was identified that showed impaired functional integration in PBD relative to HC when participants viewed negatively valenced words. PBD medication responders showed greater connectivity of the amygdala into the network before and after treatment compared with nonresponders, with responders showing a pattern more similar to HC than to nonresponders. Regardless of medication type, the degree of amygdala functional connectivity predicted medication response as well as the improvement in YMRS scores across responders and nonresponders. These findings suggest that increased functional integration of the amygdala within the frontolimbic network might be a biomarker of general mood stabilizer medication responsivity in bipolar disorder.
Introduction
P
Previous functional magnetic resonance imaging (fMRI) studies have documented both the functional deficits found in PBD and potential pharmacotherapeutic remediation of these deficits. Children with PBD show overactivity in a ventral affective system, consisting of the amygdala, striatum, paralimbic cortex, and subgenual anterior cingulate cortex (ACC) while processing emotional stimuli, such as faces (Dickstein et al., 2007; Pavuluri et al., 2007; Rich et al., 2006), scenes (Chang et al., 2004), or words (Passarotti et al., 2010a; Pavuluri et al., 2008). Patients with PBD also show variable activity in ventrolateral prefrontal cortex (VLPFC) areas linked to emotional regulation while completing a variety of affective tasks (Blumberg et al., 2003; Passarotti et al., 2009, 2010a; Pavuluri et al., 2007, 2009b). In a recent pharmacological fMRI study, patients asked to remember emotional faces showed normalized VLPFC activity and reduced, but still elevated, amygdala overactivity after 14 weeks of lamotrigine monotherapy, suggesting partial prefrontal functional recovery with persistent limbic dysfunction (Passarotti et al., 2011). Patients also show over-activation in areas involved in higher cognition and behavioral inhibition, such as the dorsolateral prefrontal cortex (DLPFC), dorsal ACC, VLPFC, orbitofrontal cortex, and striatum (Chang et al., 2004; Nelson et al., 2007; Passarotti et al., 2010b; Singh et al., 2010). Patients' deficits in these areas while trying and failing to withhold a prepotent response, and overactivity when performance levels are matched with healthy controls (HC) (Leibenluft et al., 2007) suggest that patients need to expend extra effort in these areas to perform equally well in cognitive tasks as in HC.
Existing evidence localizes affective and cognitive processing abnormalities to several discrete brain regions and suggests that mood-stabilizing medications partially or fully resolve hyper- or hypo-functional brain activation. Given that affective and cognitive domains are intricately interconnected, examining dysfunction at the level of interactions between functionally specialized brain regions would provide key insights into distributed neural functioning in PBD (Pavuluri and Sweeney, 2008). Functional connectivity fMRI techniques (Friston, 2002) have emerged as useful and informative methods to test hypotheses about the integration of brain regions implicated as dysfunctional in psychiatric disorders. Despite promising functional connectivity results in adult bipolar disorder (e.g., Anand et al., 2009; Arribas et al., 2010; Calhoun et al., 2008b; Chepenik et al., 2010; Foland et al., 2008; Pompei et al., 2011; Wang et al., 2009), to the authors' knowledge, only two studies of functional connectivity in children with PBD have been published, and both utilized a seed voxel technique. In one study, amygdala connectivity with emotional face processing regions was attenuated during a facial emotion-rating task (Rich et al., 2008). In another, connectivity between DLPFC and frontal, temporal, and limbic regions was impaired in PBD, relative to HC, during the resting state (Dickstein et al., 2010). Given that the functional connectivity found in these regions is specifically sensitive to acute mood disturbance, connectivity indices of specific brain regions might serve well to differentiate treatment responders from nonresponders.
Our previous studies illustrated that the pediatric affective color-matching task described next can effectively probe the interaction between affective and cognitive systems in PBD. While completing this task, patients showed limbic over-activity (Pavuluri et al., 2008) and decreased VLPFC activity in manic or euthymic states (Passarotti et al., 2010c; Pavuluri et al., 2008, 2010). Treatment studies using lamotrigine (Pavuluri et al., 2010), or risperidone or divalproex (Pavuluri et al., 2011) have found that drug treatment normalizes the frontal activation dysfunction seen on this task in PBD, but that the amygdala and paralimbic over-activity remain a persistent problem for patients. The level of amygdala over-activity at baseline can also predict treatment outcome, as baseline amygdala overactivation predicted a poorer treatment outcome (higher mania scores) in patients (Pavuluri et al., 2011). However, no studies, either from our lab or others, have investigated the effects of medications on functional connectivity in either adults or children with bipolar disorder.
Thus, the goal of this study was to determine whether there are changes in the functional integration of neural circuits associated with PBD treatment response that are common across these medications. To achieve this goal, we implemented functional connectivity analyses using Independent Components Analysis (ICA; Calhoun et al., 2001) that could identify integrated networks across the whole brain, link these networks to task performance, and provide regions-of-interest (ROI) that could differentiate responders from nonresponders. Based on previous findings (Pavuluri et al., 2011) showing that increased amygdala activation predicted poorer treatment outcome, we hypothesized that the amygdala and VLPFC would show decreased connectivity in treatment nonresponders, relative to responders. This is because both hyper- or hypo-activity in a given brain region could plausibly lead to a disruption in the proper neural tuning of a functional system including that region, resulting in decreased connectivity (Greicius, 2008).
Thus, based on previous findings that the VLPFC down-regulates the amygdala response during mania (Foland et al., 2008), we postulated that responders would show increases in amygdala-VLPFC functional connectivity relative to nonresponders, indicating an increased ability to down-regulate the overactive amygdala.
Methods
Participants
We included all participants receiving risperidone, divalproex, or lamotrigine as a part of the clinical research within our laboratory. Patients were scanned before and after 6 weeks of medication treatment, and HC were tested twice at a similar interval. Inclusion criteria were a Diagnostic and Statistical Manual IV (DSM-IV) diagnosis of mixed or manic bipolar disorder; 12–18 years old; and medication free or currently clinically unstable on medication, justifying termination of the ineffective regimen (with consent, participants were washed out and free of any medication for a week before baseline scanning, and 4 weeks in case of fluoxetine or aripiprazole). Previous exposure to second-generation antipsychotic and anti-epileptic medications was acceptable. Exclusion criteria included active substance abuse within 3 months before scanning; serious medical problems; autism; and nonaffective psychotic disorders. After excluding participants whose data were unusable due to motion artifacts (HC: n=3; risperidone group: n=3; divalproex group: n=2, lamotrigine group: n=3), the final sample consisted of 14 HC, and 34 patients treated with either risperidone (n=10), divalproex (n=10), or lamotrigine (n=14). Detailed study dosage information is in the Supplementary Materials and Methods (Supplementary Data are available online at
Clinical studies on the larger sample were published elsewhere (Pavuluri et al. 2005b, 2009a), and there is no overlap in the data presented in this study. While the sample platform was derived from published fMRI studies using individual medications, we have neither published the connectivity data, nor had the sample power to examine group differences between HC, responders, and nonresponders as we could in this study. The Institutional Review Board at the University of Illinois at Chicago (UIC) approved this study. No differences across groups for age, intelligence quotient (IQ), handedness, race, or gender were found. Sample characteristics are summarized in Table 1.
Estimated with Wechsler Abbreviated Scale of Intelligence (WASI; Matrix Reasoning and Vocabulary Subtests).
SD, standard deviation; YMRS, Young Mania Rating Scale; CDRS-R, Child Depression Rating Scale-Revised; SES, socioeconomic status; PBD, pediatric bipolar disorder; R, responder; NR, nonresponder; HC, healthy control.
Assessment and efficacy measures
Each child and their parent or legal guardian were interviewed by doctoral-level clinicians with established inter-rater reliability using the Washington University in St. Louis Kiddie Schedule for Affective Disorders and Schizophrenia (WASH-U KSADS; Geller et al., 1998) supplemented by the episode characterization of bipolar disorder from the KSADS—Present and Lifetime versions (Kaufman et al., 2000). The primary clinical efficacy measure was the Young Mania Rating Scale (YMRS) (Young et al., 1978). The Child Depression Rating Scale-Revised (CDRS-R) was also administered (Poznanski et al., 1984). Three independent masters-level clinical raters with established reliability administered these clinical outcome measures on a weekly basis. Patients were responders if they showed a ≥50% decrease in their YMRS scores post-treatment and were nonresponders otherwise.
Clinical effects of treatment and behavioral analyses
Participants' YMRS and CDRS-R values were analyzed with 2×3 time (pre- vs. post-trial) by group (responders, nonresponders, HC) mixed model analyses of variance (ANOVAs). Participants' median reaction times (RTs) for correct trials and accuracy were examined using a series of 2×3×3 ANOVAs with time (pre- vs. post-trial), valence (positive, negative, and neutral words), and responder group (responders, nonresponders, HC) as factors.
fMRI session: pediatric affective color-matching task
After training in a mock scanner, participants completed the pediatric affective color-matching task for approximately ten minutes in the fMRI scanner (Passarotti et al. 2010a; Pavuluri et al., 2008, 2010, 2011). On each trial, participants matched the color (red, green, yellow, or blue) of an emotional word, presented centrally for 200 msec, to either of two colored circles, presented to the left or right of the word for 3000 msec, with no inter-stimulus interval. The words in this task came from the Affective Norms for English Words (Bradley and Lang, 1999), were at an 8-year-old reading level, and were equivalent in usage frequency across affect conditions (Gilhooly and Logie, 1980; Klein, 1964). The words had either a negative (e.g., poor), positive (e.g., victory), or neutral (e.g., table) emotional valence (Fig. 1). Two sets of word stimuli of equal difficulty were constructed, and each participant received a different set at the first and second scanning sessions, so that no word was repeated either within or between sessions. Set order was counterbalanced across participants and groups, and it did not interact with any factor in our analyses.
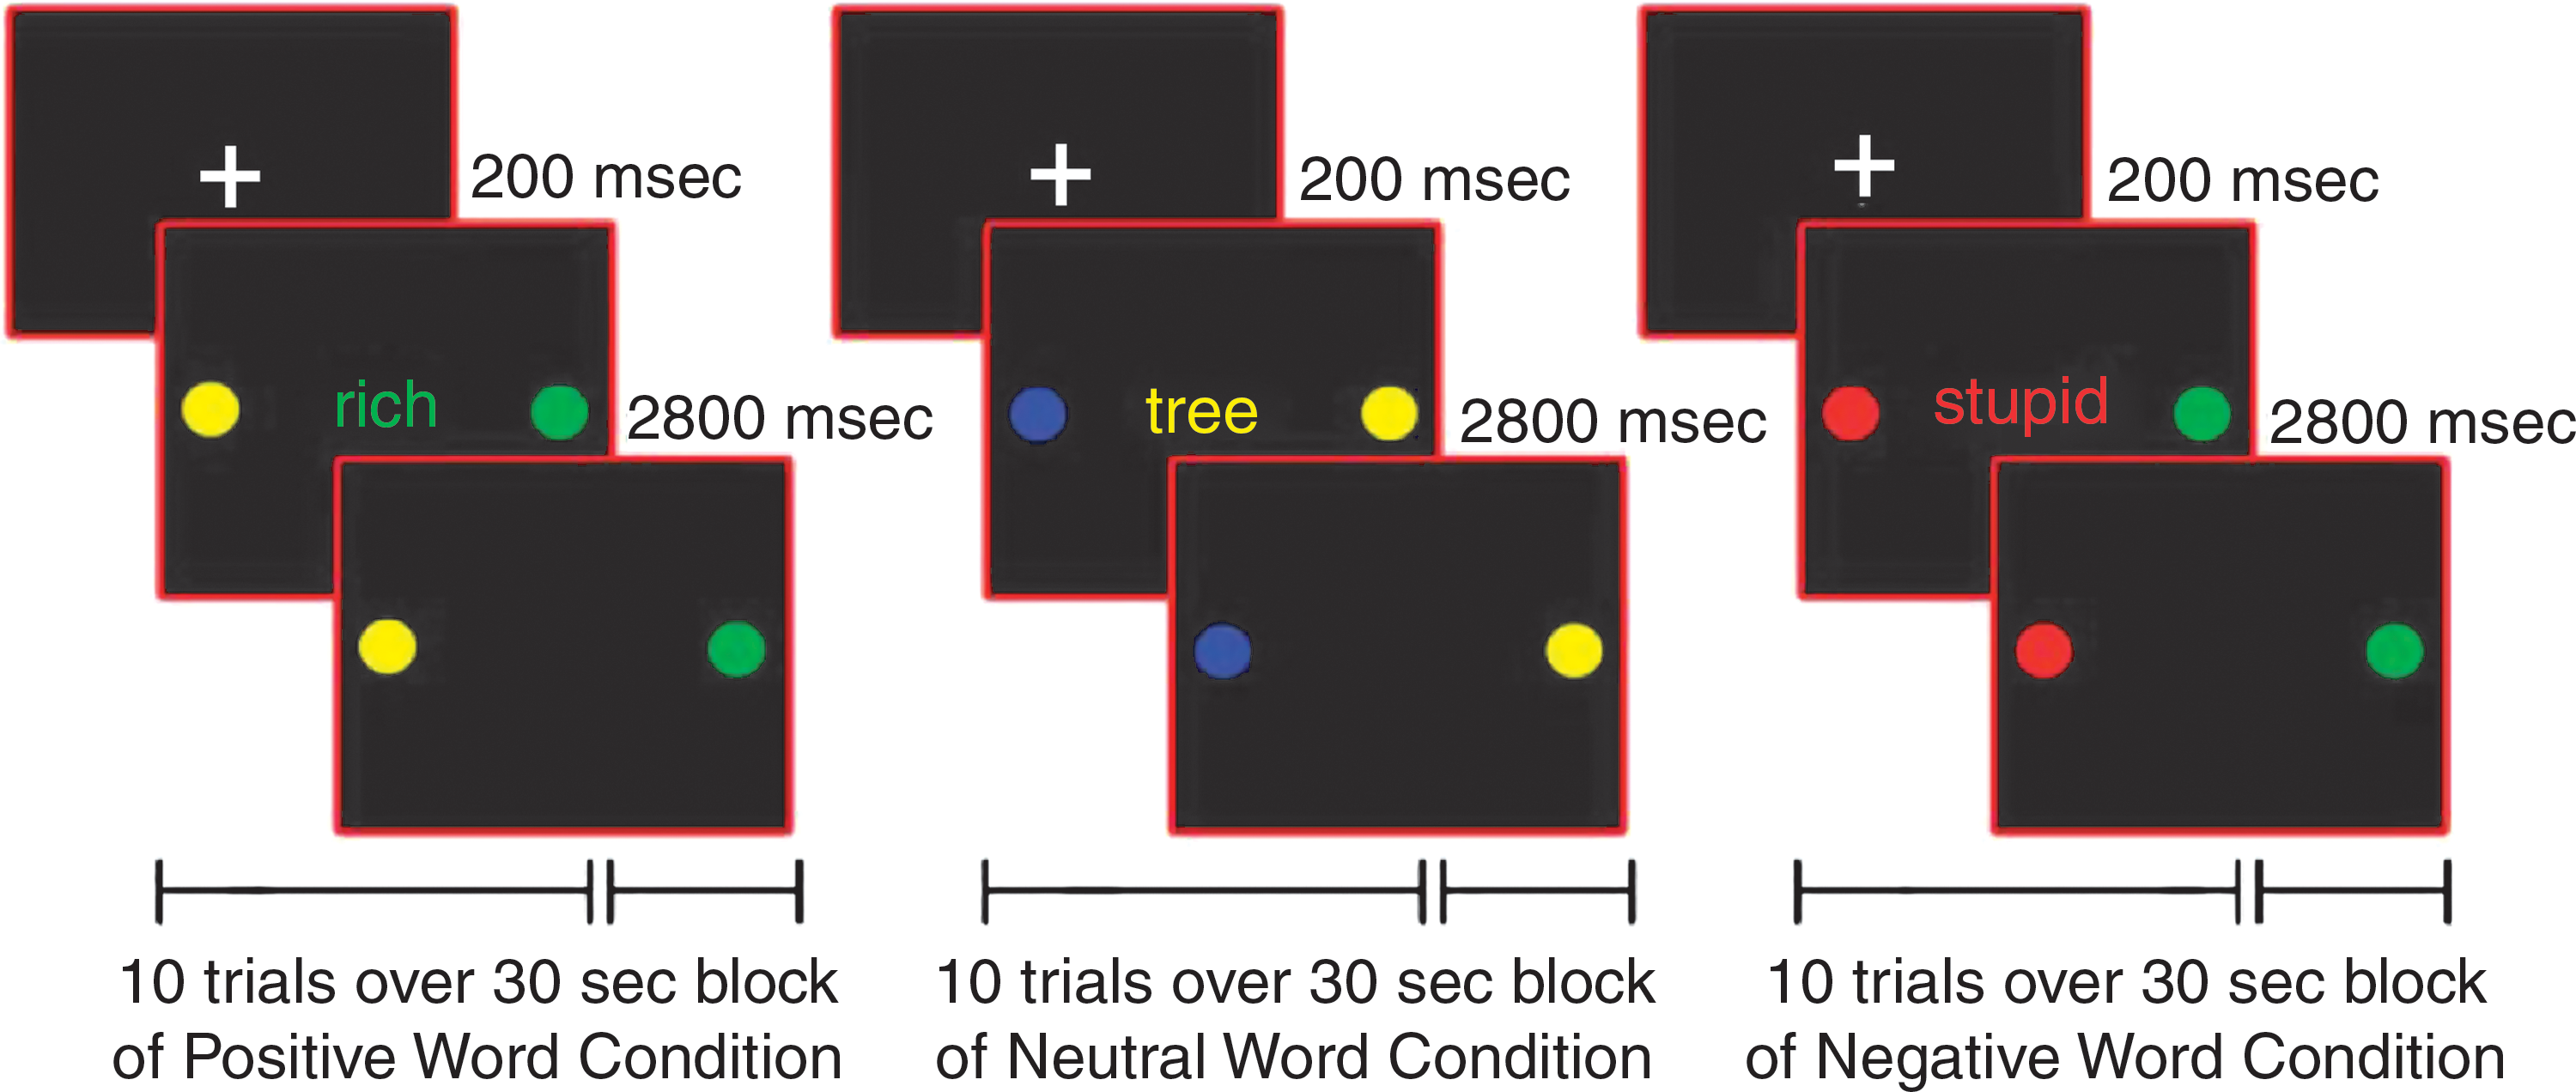
Illustration of positive, neutral, and negative word valence conditions for the color-matching task.
Within each session, trials were counterbalanced for color and response key. A block design was used to increase statistical power and signal stability relative to an event-related design, especially with clinical populations exhibiting more variable neural activation. Moreover, by summating neural activation across consecutive trials, the block design could reveal sustained activation in prefrontal and limbic cortices better than an event-related design. During each session, fifteen 30-sec blocks of positive, negative, and neutral words (5 blocks per valence) were pseudo-randomly interspersed with fifteen 10-sec fixation blocks. Each word block contained 10 trials of 3 sec each.
MRI protocols
A 3.0 Tesla whole-body scanner (Signa, General Electric Medical System, Milwaukee, WI) at the MR Center within the UIC Hospital acquired the functional and structural imaging data. T2*-weighted functional images were acquired with a gradient-echo echo-planar sequence (repetition time=2500 msec, echo time=25 msec, flip angle=90°, field of view 20×20 cm2, 64×64 matrix, 3.125×3.125 mm in-plane resolution, 25 slices, 5-mm slice thickness, 1-mm gap). Anatomical images were also acquired in the axial plane (three-dimensional [3D] spoiled gradient recalled, 1.5 mm thick contiguous axial slices) and were co-registered with the functional data. The experiment run consisted of 240 time points.
fMRI image processing and motion correction
Functional Imaging Analysis Software—Computational Olio (FIASCO) (Eddy et al., 1996) was used for 3D motion estimation and correction. Individual volumes from the time series were excluded if head displacement from the median head position was greater than 1.5 mm, or if head rotation from the median head position was greater than 0.5°. There were no significant group differences in the number of volumes retained after discarding those with motion artifact. After motion correction and de-trending using FIASCO, the functional images were preprocessed with Statistical Parametric Mapping 5 (SPM5;
Independent component analyses
Participants' fMRI time series were analyzed using a group ICA algorithm (GIFT v1.3h;
Identification of task-engaged networks affected by treatment
To identify components showing differential task engagement, multiple regression analyses were performed between component time courses and fMRI models of the block design of the negative, neutral, and positive blocks. Akin to a conventional fMRI analysis, this produced a set of association coefficients (beta weights) for each component at each time point representing the BOLD signal change occurring during each block. In this analysis, positive values suggest task engagement of the time course, negative values suggest significant task-related disengagement, and values approaching zero represent the network as acting task independently (i.e., uncorrelated with the task). These beta weights were subjected to mixed-factor ANOVAs including time (pre- vs. post-treatment) and block valence (negative, neutral, and positive) as within-subjects factors and participant group (responders, nonresponders, and HC) as the between-subjects factor. Our analyses focused on a primarily frontolimbic neural circuit exhibiting a significant group by time by valence interaction in its temporal beta weights. This component also had the highest positive correlation between the functional connectivity voxelwise spatial map and an amygdala mask, and, thus, was the best candidate to detect amygdala differences. Throughout this article, this component will be termed the “Frontolimbic Affective Circuit.” The network depicted in this component closely comported with such circuits that we and others describe in previous studies (see also Pavuluri and Sweeney, 2008).
Characterization of the Frontolimbic Affective Circuit
The structure of the frontolimbic affect regulation circuit was characterized in SPM5 using a voxelwise one-sample t-test across participants and sessions (p<0.01 family-wise error rate [FWE]) (Worsley et al., 1996) and visualized by overlaying these results on axial slices of representative brain anatomy. Subsequent between-group ROI-based comparisons were masked by a component image constructed from this thresholded one sample t-map to ensure that we would only detect group differences in functional connectivity in brain regions highly likely to participate in the circuit.
ROI analysis of amygdala and VLPFC connectivity
Given our specific a priori hypotheses about the amygdala and VLPFC, ROI analyses were conducted to provide enough statistical power to detect differences in functional connectivity. The left and right amygdalae were defined using anatomical ROIs from Wake Forest University's PickAtlas toolbox (
Regression analyses between ROI values and clinical outcome measures
To examine whether specific amygdala ROI values were better at predicting response group, a logistic regression was conducted in Predictive Analytics Software (PASW) Statistics 18 (forward conditional entry, entrance criterion of .05, exit criterion of .10) using the ROI-derived amygdala connectivity values. Furthermore, amygdala-frontolimbic connectivity values were examined using linear regression analyses to determine whether they predict the change in YMRS scores regardless of medication response.
Results
Treatment outcome results
Before treatment, there were no significant differences between the YMRS scores of responders and nonresponders, t(32)=.21; p=0.83. After treatment, there was a large, statistically significant difference between YMRS scores for the two groups, t(32)=6.04; p<0.001. However, both groups showed a statistically significant decrease in YMRS scores from pre- to post-treatment, nonresponders: t(11)=2.38, p=0.036; responders: t(21)=16.42, p<0.001, indicating that even the nonresponders' YMRS scores decreased somewhat. Finally, HC showed no change in YMRS scores between testing sessions, t(13)=0.0, p=1.0).
fMRI task behavioral results
At baseline, the PBD group responded significantly slower than HC on the pediatric affective color-matching task, F(1, 46)=5.34, p=0.025, but this difference was marginal after treatment, F(1, 46)=4.02, p=0.051) (see Fig. 2). The PBD group responded slower than HC for the positive and neutral words in the first session [positive: t(46)=2.5, p=0.016; neutral: t(46)=2.6, p=0.013], but for the negative and neutral words in the second session [negative: t(46)=2.3, p=0.028; neutral: t(46)=2.2, p=0.035], as revealed by a significant three-way interaction, F(2, 92)=3.41, p=0.037. Thus, the patients' impairments may be specific to their emotional state, as they were manic pre-treatment and remained somewhat depressed after treatment. The PBD group was also less accurate overall, F(1, 46)=7.99, p=0.007, but this did not differ across word valences or sessions. Despite the differences between patients and HC, medication responders and nonresponders showed no significant differences in RTs or accuracy rates. Therefore, although the PBD group showed some performance impairments on this task, these differences did not predict whether a participant would respond to medication.
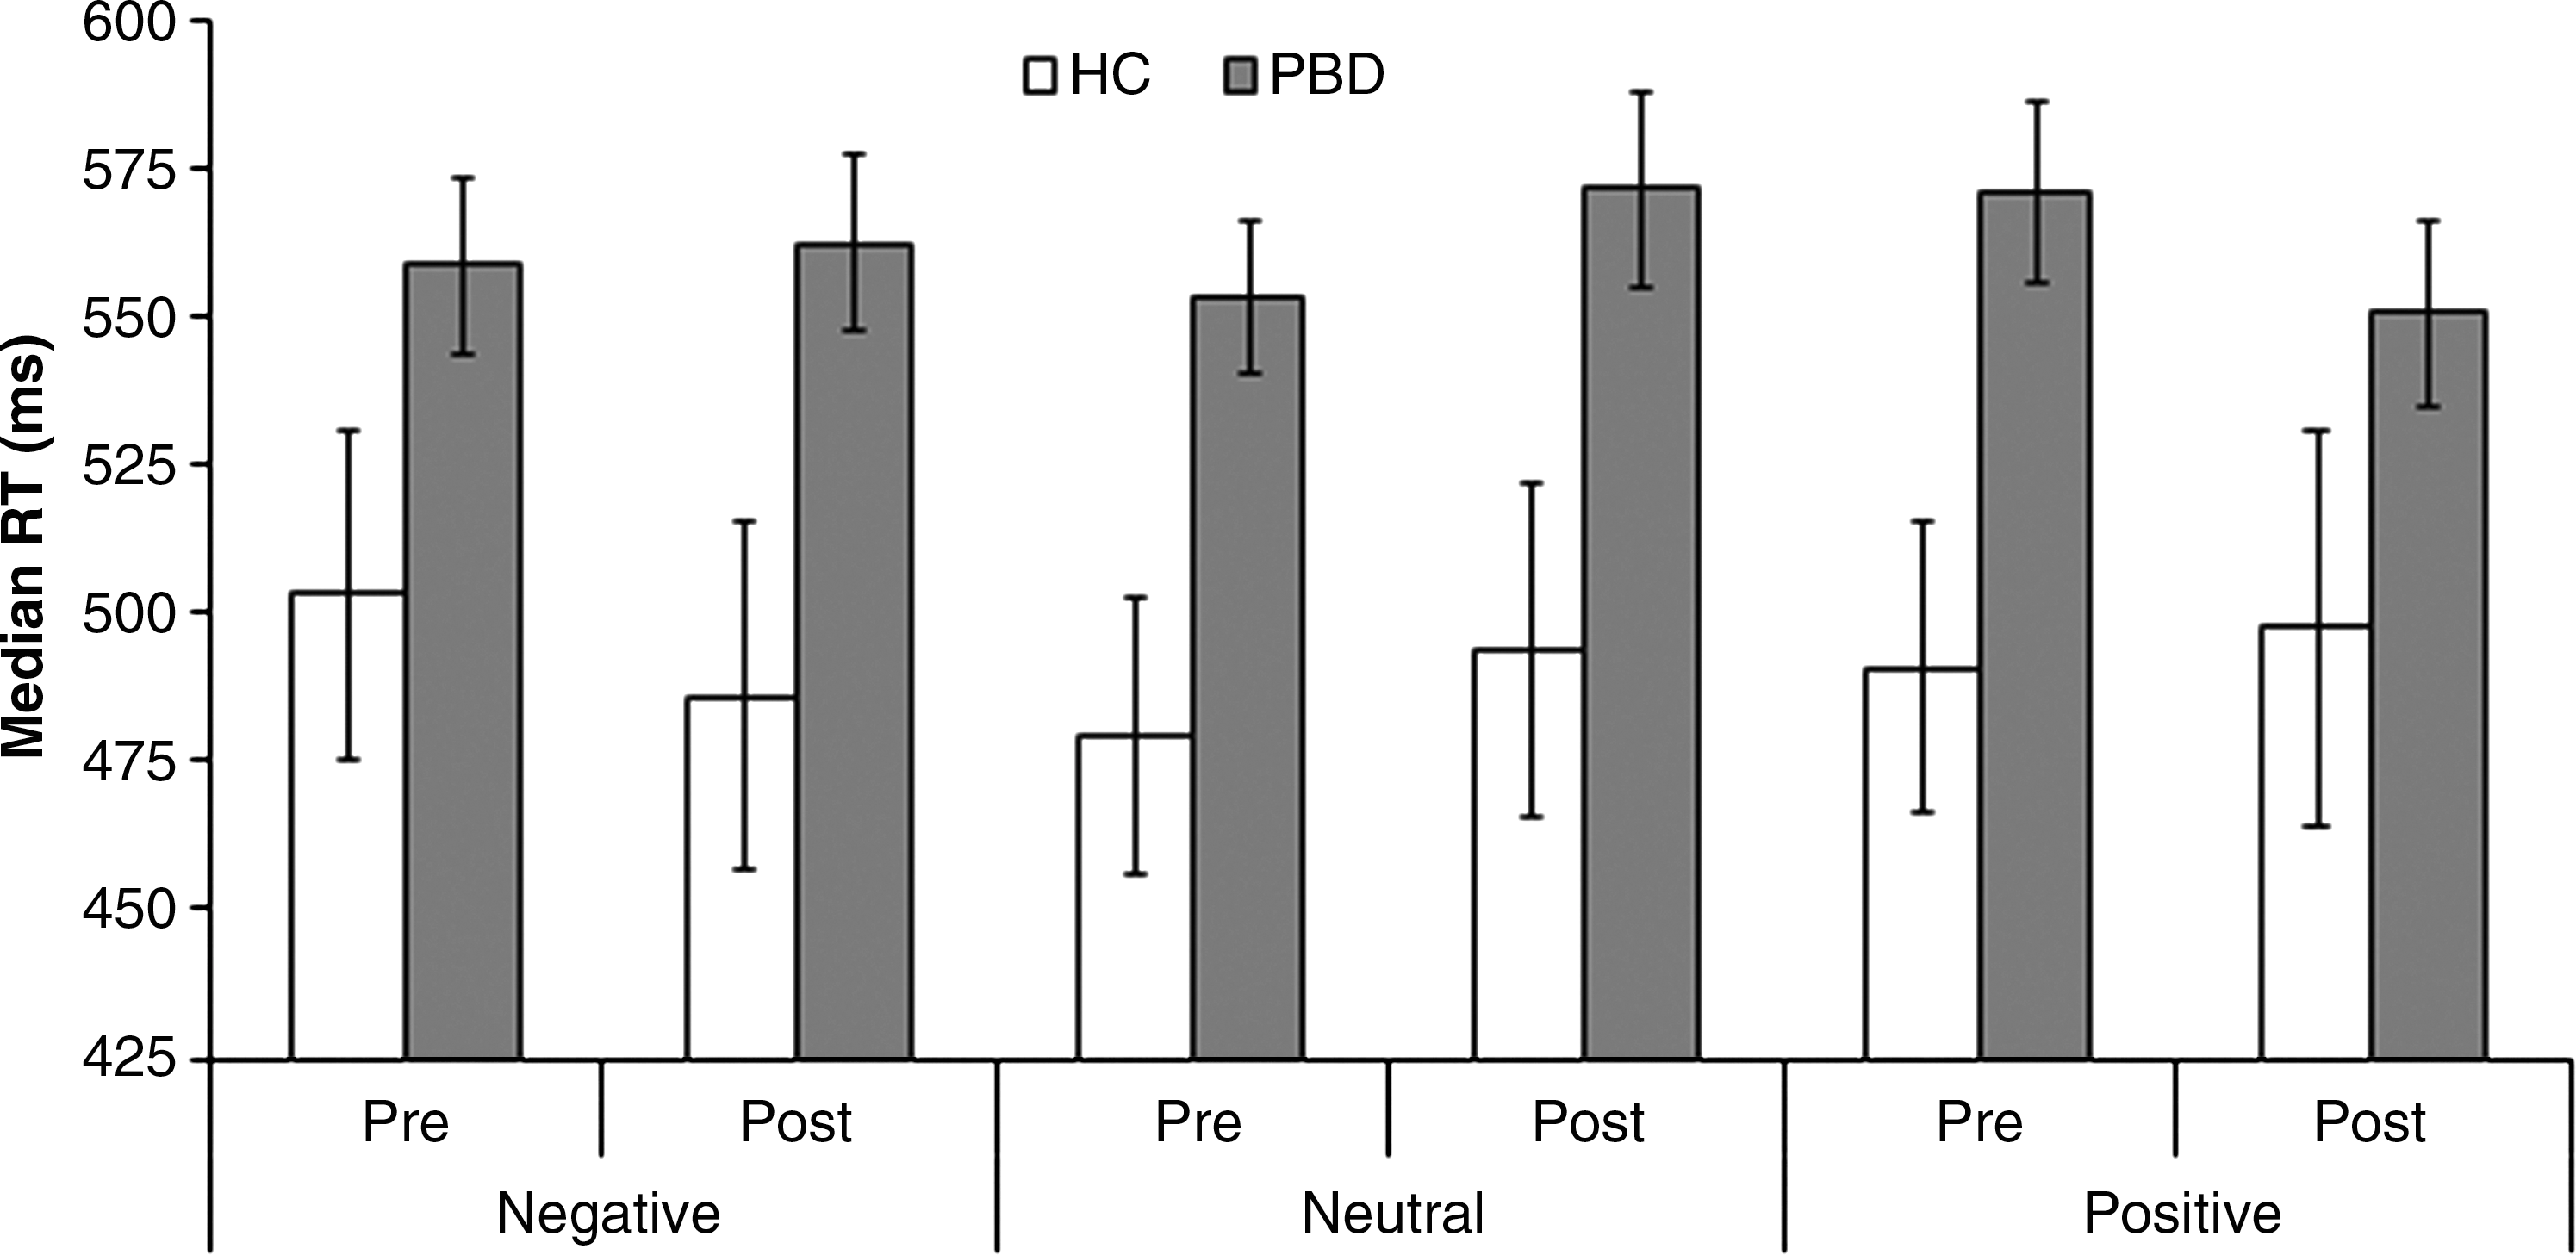
Behavioral reaction times for PBD versus HC across valence and testing session for the color-matching task.
Task engagement results
Responders, nonresponders, and HC engaged the Frontolimbic Affective Circuit differently depending on the valence of the stimuli both before and after treatment, as revealed by a significant three-way interaction, F(4,90)=2.91, p=0.026, (Fig. 3). Separate three-way ANOVAs separating the groups for each valence at each time point revealed that responders, nonresponders, and HC showed different network engagement in response to negative words before treatment, F(2,45)=3.57, p=0.037, and in response to positive words after treatment, F(2,47)=3.49, p=0.039. Post hoc t-tests showed that before treatment both responders and nonresponders showed decreased network engagement in response to negative words relative to HC, t(34)=2.56, p=0.015; and t(24)=2.27, p=0.032, respectively; but these two groups did not differ from one another, t(32)=0.45, p=0.657. After treatment, responders showed increased network engagement compared with HC in response to the positive word stimuli, t(34)=2.57, p=0.015, but nonresponders did not differ from either responders or HC.

Frontolimbic Affective Component task engagement (fit with model) for responders versus nonresponders versus HC for positive, negative, and neutral word blocks.
The Structure of the Frontolimbic Affective Regulation Circuit
A one sample t-test against a zero connectivity baseline revealed that the frontolimbic affect regulation circuit included increased functional connectivity in bilateral amygdala, parahippocampal gyrus, hippocampus, inferior VLPFC and orbitofrontal cortex, anterior insula, superior temporal pole, and the inferior cerebellar vermis (all regions significant at p<0.01 FWE; see Fig. 4). Areas that showed decreases in functional connectivity across participants during the task included the superior vermis and the bilateral thalamus. These regions represent the areas that are a part of the frontolimbic circuit and, by extension, are linked to the amygdala and VLPFC ROIs.

Brain regions that are a part of the Frontolimbic Affective Component across all participants and testing sessions. One sample t-test of the Frontolimbic Affective Circuit at p=0.01 family-wise error rate (FWE).
Predictors of treatment outcome (responders vs. nonresponders)
The 2×2×3 mixed model ANOVA on the participants' amygdala connectivity values showed a significant main effect of group, F(2, 43)=3.48, p=0.040, (Fig. 5). In contrast, a 2×2×3 mixed model ANOVA on the VLPFC connectivity values showed no significant effects. Post-hoc t-tests on the amygdala connectivity values revealed that responders showed significantly greater connectivity values overall than nonresponders, t(31)=2.98, p=0.006. HC did not differ from responders, t(32)=.628, p=0.54, or from nonresponders, t(23)=1.71, p=0.10. The responders showed increased functional integration between the amygdala and the rest of the limbic circuit, whereas the nonresponders showed relatively decreased functional integration between the amygdala and the limbic circuit. This preliminary evidence suggests that the integration between the amygdala and the frontolimbic circuit is a potential trait-like marker of medication responsivity.
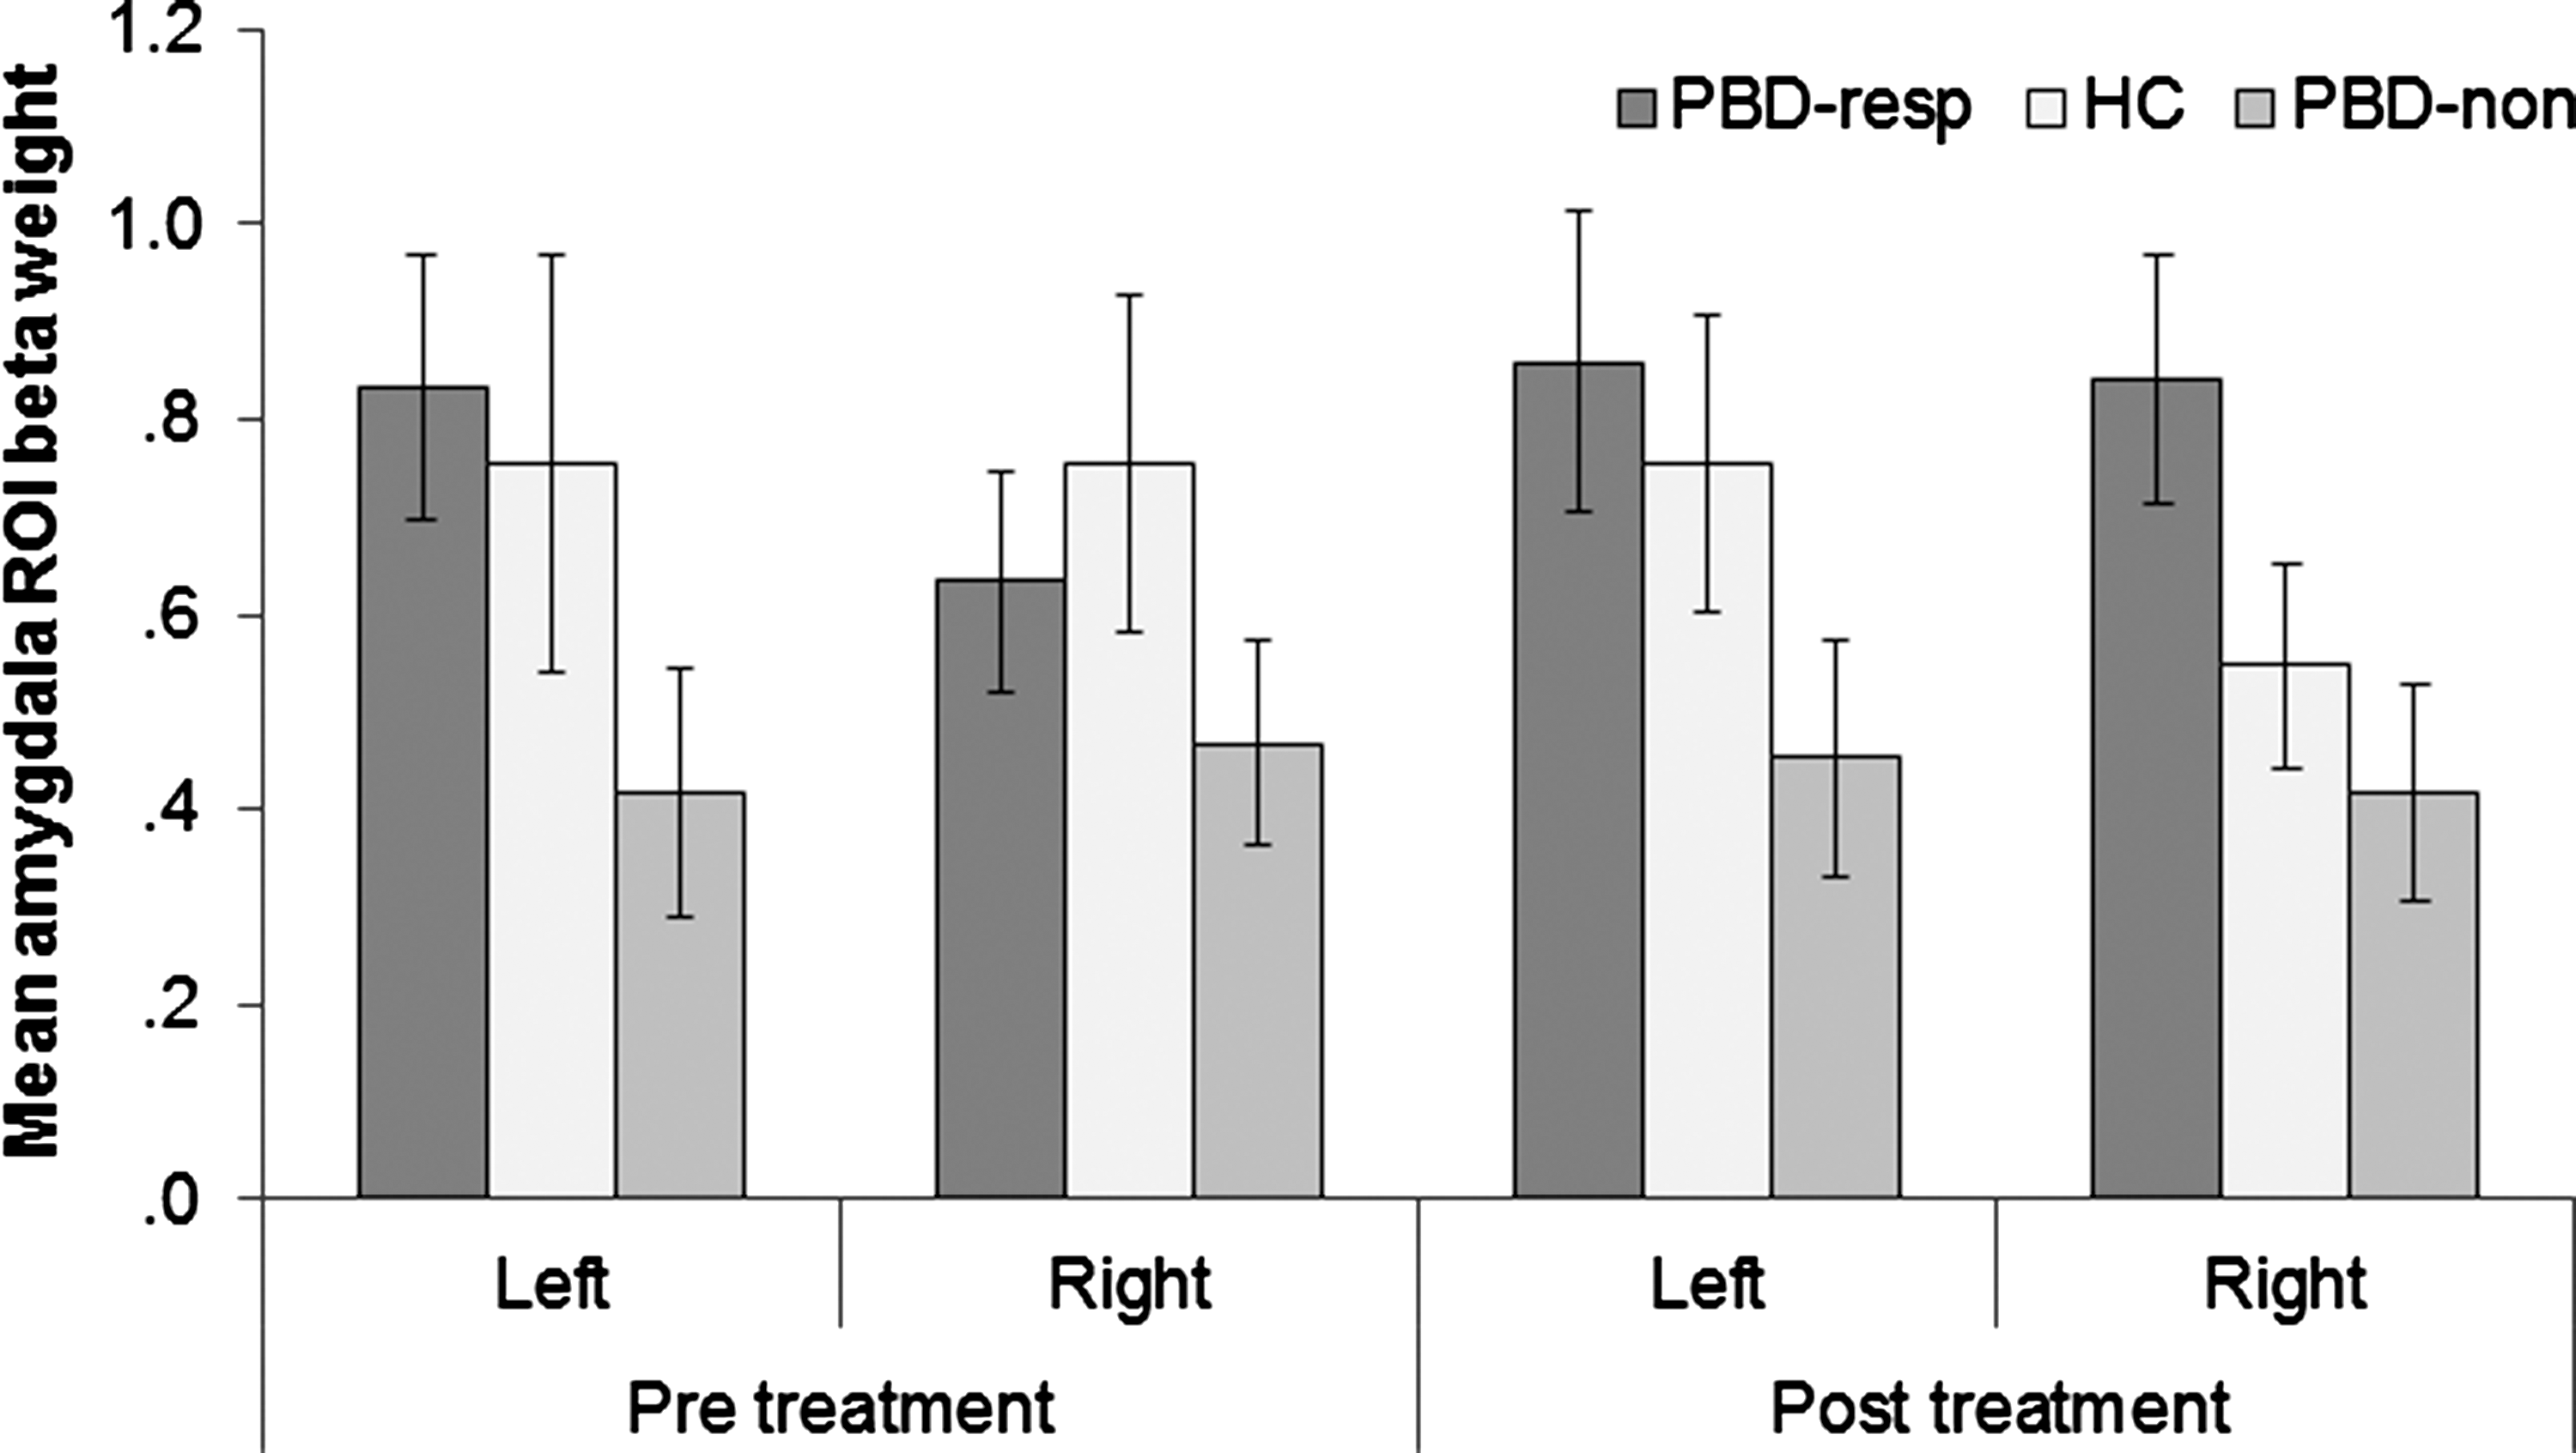
ROI-derived amygdala-frontolimbic connectivity values (beta-weights) from the Frontolimbic Affective Component across groups and sessions. resp, medication responder; non, medication nonresponder.
While not significantly different than either group, HC showed an intermediate level of connectivity in the amygdala, partway between the responders and nonresponders and not significantly different from either group. This finding suggests that there may be a combination of factors contributing to the changes between the patient groups (i.e., both that responders were compensating and that nonresponders were getting worse).
Further analyses indicated that responders showed significantly greater amygdala connectivity than nonresponders in the left amygdala at pre-treatment baseline, t(31)=2.05, p=0.049, but no significant difference in the right amygdala at pre-treatment, t(31)=.98, p=0.34. However, after treatment, only the right amygdala differed significantly between responders and nonresponders, t(31)=2.23, p=0.033 with a marginal effect in the left amygdala, t(31)=1.81, p=0.080. There were no significant differences between the HC group and the other two groups in the amygdala at either time point. Although the three-way interaction was not significant, F(2,43)=2.36, p=0.107, these results suggest that left amygdala connectivity better differentiated responders from nonresponders before they were treated, whereas right amygdala connectivity better distinguished responders from nonresponders after treatment.
Amygdala ROI values predict medication response and clinical outcome scores
The logistic regression model revealed that the left amygdala pre-treatment and right amygdala post-treatment ROI values successfully classified 76% of participants as responders or nonresponders (odds ratio [OR] for left amygdala at pre-treatment assessment=6.7, confidence interval [CI]=0.96–46.3, p=0.055; OR for right amygdala at post-treatment=11.0, CI=1.0–119.9, p=0.050). The model classified responders fairly well (18 as responders, 3 as nonresponders; 86% correct), but only classified 58% of the nonresponders correctly (7 as nonresponders and 5 as responders). Although the contribution of the left amygdala values before treatment to the model's predictive power were just below the level of statistical significance (p<0.055), if they were removed from the model, the overall fit of the model was significantly decreased (change in −2 Log Likelihood=5.65, p=0.017), and the model would classify only 61% of the participants correctly. Thus, left amygdala connectivity pre-treatment added some predictive power to the model beyond that provided solely by right amygdala connectivity after treatment.
The overall average amygdala ROI connectivity values for the patients also significantly predicted the improvement in YMRS scores, b=−11.1, t(32)=2.94, p=0.006, R 2=0.22, most likely due to post-treatment data. Average amygdala ROI connectivity after treatment predicted the improvement in YMRS scores, b=−6.7, t(32)=2.51, p=0.018, R 2=0.17, whereas amygdala connectivity pre-treatment did not, b=−5.2, t(32)=−1.56, p=0.129, R 2=0.07. Finally, right amygdala connectivity post-treatment predicted improvement on mania symptoms, b=−7.5, t(32)=3.1, p=0.005, R 2=0.23, whereas left amygdala connectivity post-treatment did not, b=−3.6, t(32)=1.54, p=0.133, R 2=0.07.
Discussion
This study has three key findings. First, ICA implicated a previously identified Frontolimbic Affective Circuit (Pavuluri and Sweeney, 2008) that was active during the color-matching task. Before treatment, patients, regardless of response status, showed deficient recruitment of the entire Frontolimbic Affective Circuit, relative to HC, to perform the task, whereas after treatment, the PBD group relied on this network more than the HC group did (see Fig. 3). This PBD group's increased network recruitment may have been due to compensatory neural changes due to the medication, whereas HC showed a decreased need to engage in this network, perhaps due to practice. Second, functional connectivity between the amygdalae and the rest of the Frontolimbic Affective Circuit differed between the responders and the nonresponders. Overall, the responders showed relatively greater connectivity, whereas nonresponders showed relatively less connectivity. However, the pattern of these differences differed across the amygdalae, with greater differences between responders and nonresponders in the left amygdala before treatment and in the right amygdala after treatment. Finally, the amygdala ROI values predicted the improvement in mania symptoms across patient groups. Thus, regardless of whether they responded to medication, participants with greater right amygdala functional connectivity after treatment showed more improvement in mania symptoms, suggesting that changes in right amygdala connectivity are critical in mania reduction.
Differential Frontolimbic Affective Circuit engagement between PBD and HC
The identification of the Frontolimbic Affective Circuit using ICA parallels our previous findings that the amygdala, parahippocampal gyrus, and VLPFC show hemodynamic abnormalities in PBD (Pavuluri and Passarotti, 2008). ICA detected differences in the amygdala that may have been missed in traditional fMRI studies due to low signal strength in subcortical regions and low statistical power (Costafreda et al., 2008). Furthermore, ICA adds new information about the interconnectedness of these regions, because rather than measuring over- or under-activity of separate areas, ICA is capable of measuring the relative engagement of spatially distributed neural networks (Friston, 2002) impacted in PBD. Our results indicate that patients were less able to engage this entire frontolimbic network at baseline, particularly when viewing negative words, complementing the findings of previous studies using this task in PBD (Passarotti et al. 2010a; Pavuluri et al., 2008, 2010, 2011).
Of note, the pregenual ACC (Fig. 6) was also significantly correlated with the frontolimbic affective component at a less stringent significance testing threshold (p<0.0001, uncorrected), suggesting a role for the pregenual ACC in this frontolimbic circuit, consistent with previous findings with conventional fMRI (Pavuluri and Sweeney, 2008) and functional connectivity measures (e.g., Anand et al., 2009; Wang et al., 2009). However, given the reduced statistical confidence in this finding, we did not perform ROI analyses on this area. Nevertheless, the Frontolimbic Affective Circuit identified as active in the task and dysfunctional in PBD may be linked to dorsal ACC and DLPFC, via the pregenual ACC (Bush et al., 2000) and VLPFC (Pavuluri and Sweeney, 2008). As evidence, adult patients with bipolar disorder and their close relatives performing a Stroop task showed decreased connectivity between the ventral ACC and VLPFC, suggesting that decreased connectivity between these regions is a trait marker for both the predisposition for bipolar disorder and its progression (Pompei et al., 2011). Future studies could directly test the connectivity between the pregenual ACC and the frontolimbic component, including the amygdala, to gauge whether this interaction helps predict medication response.
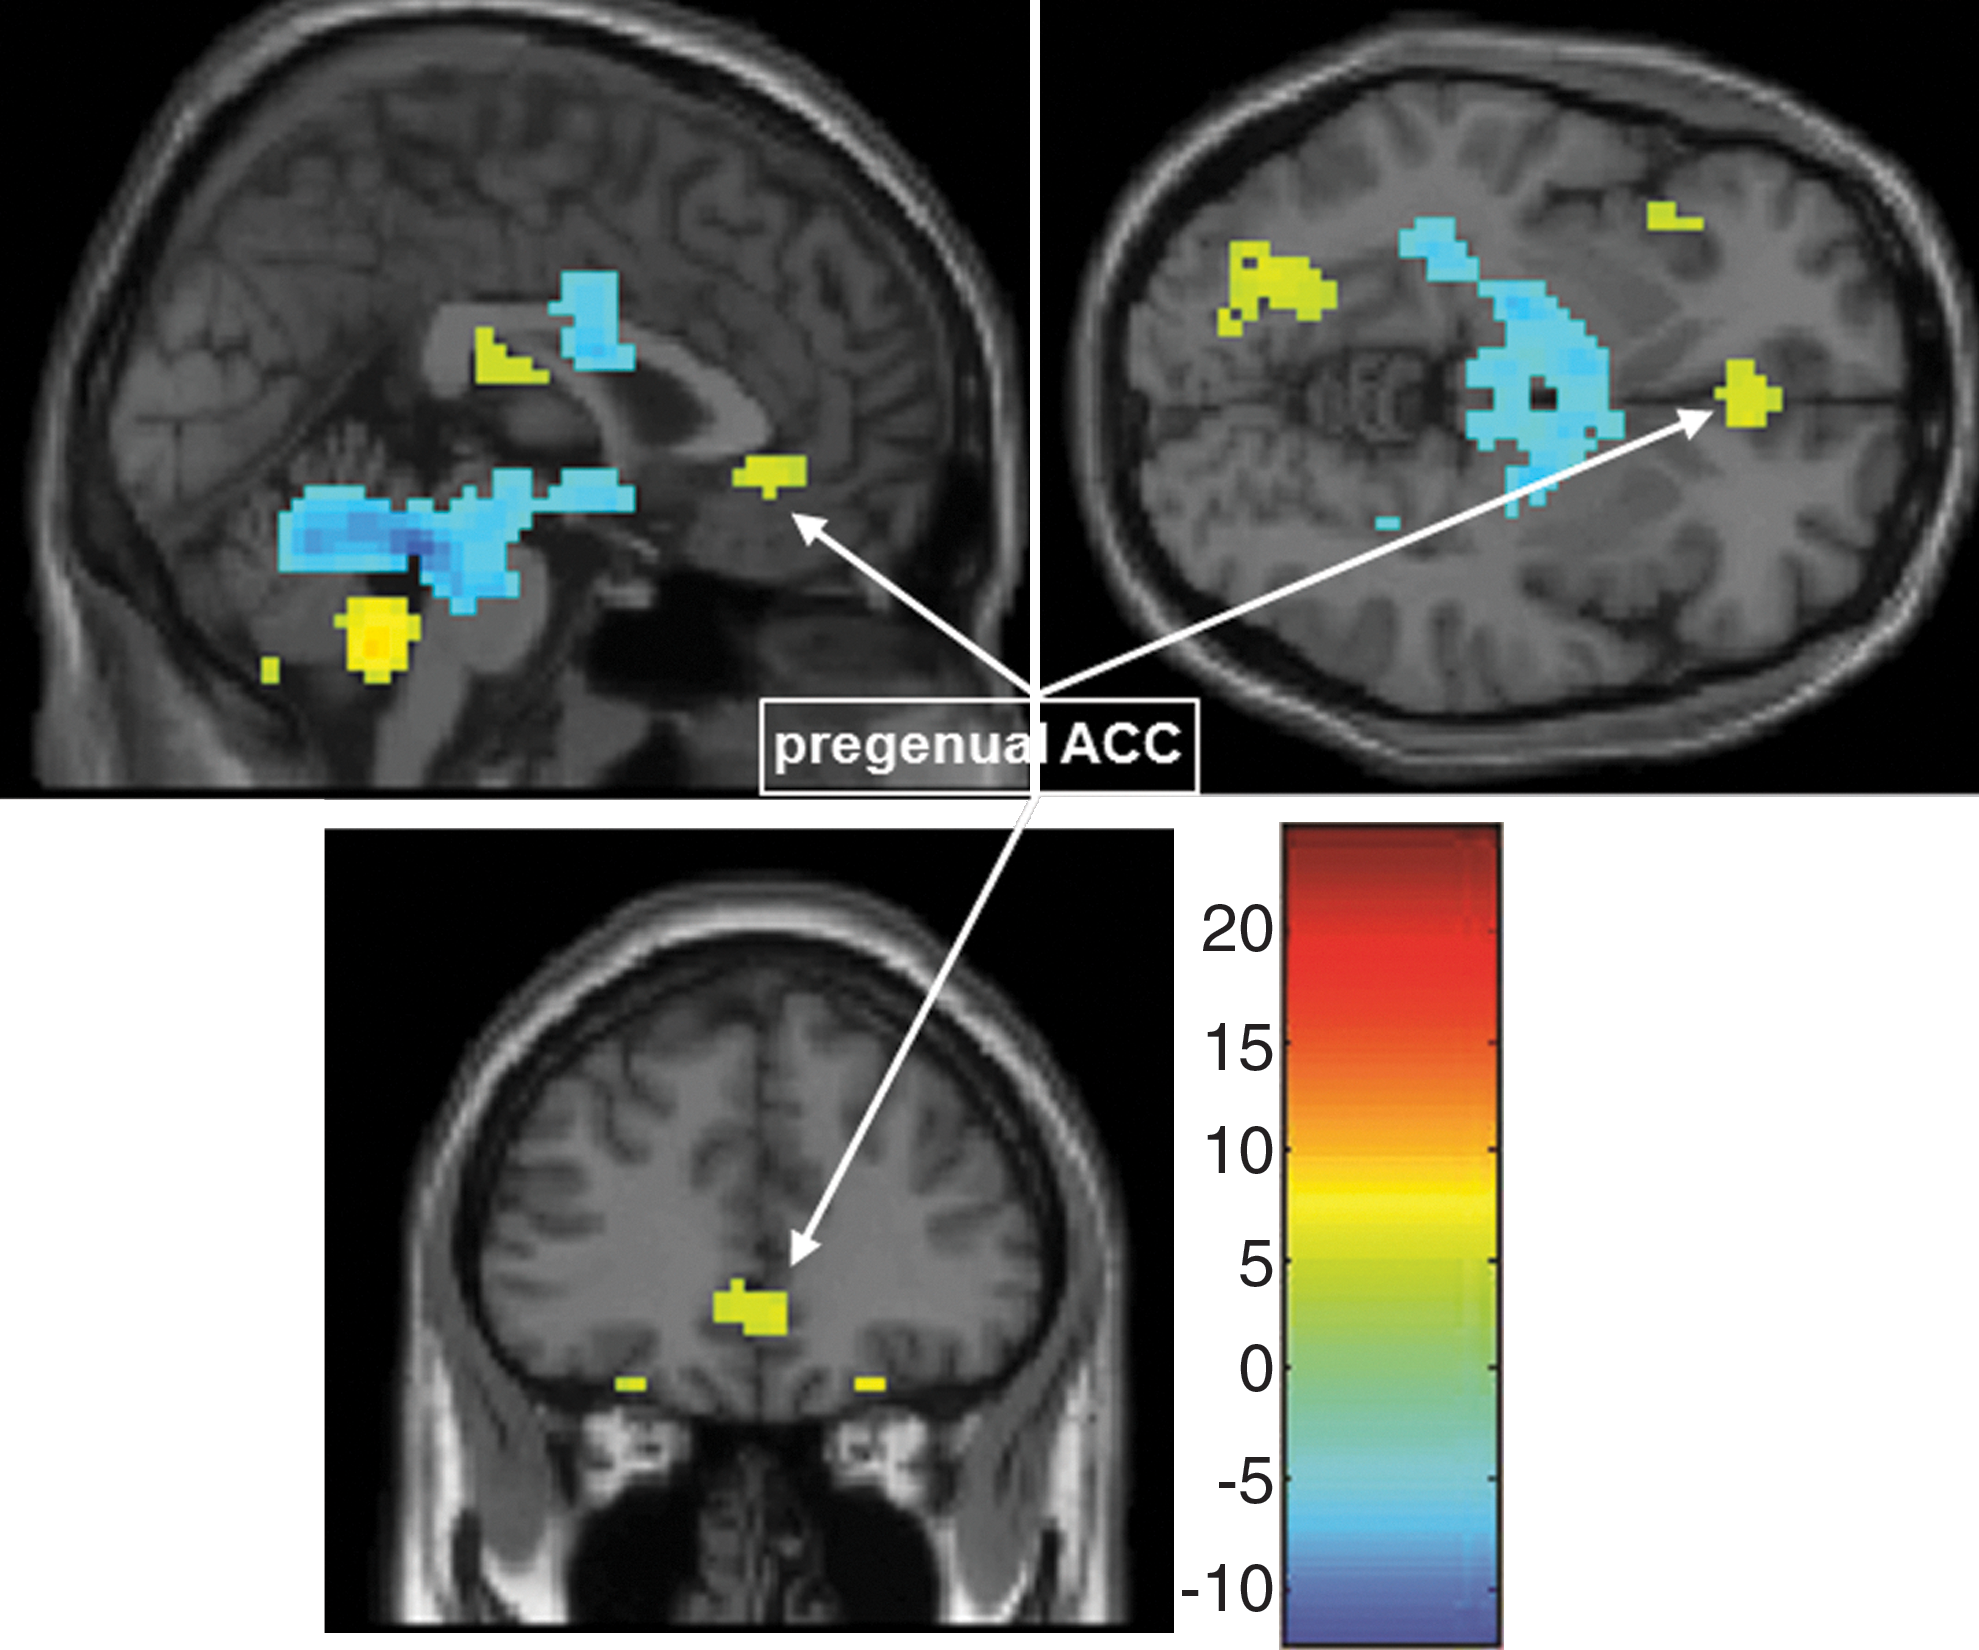
Additional Pregenual ACC regions participating in the Frontolimbic Affective Component. One sample t-test of the Frontolimbic Affective Circuit at p=0.0001, un-corrected showing the pregenual ACC. ACC, anterior cingulate cortex.
The relationship of amygdala functional connectivity to treatment outcome
Within the PBD group, responders did not differ from nonresponders on any demographic variables (e.g., IQ), clinical indicators (YMRS or CDRS-R scores), or behavioral measures (RT or accuracy). Nevertheless, medication responders and nonresponders did differ, even before taking medication, in amygdala connectivity within the frontolimbic affective network, as the responders showed more functional coupling between the PFC and amygdala than the nonresponders did. In contrast, in a recent conventional fMRI study, increased amygdala activation on the color-matching task at baseline predicted poor treatment response to divalproex and risperidone (Pavuluri et al., 2011). Thus, increased amygdala activation at baseline may predict nonresponse, whereas increased amygdala connectivity at baseline may serve as a protective factor in PBD, allowing the medication to improve PFC-amygdala connectivity impairments in bipolar disorder (Anand et al., 2009; Chepenik et al., 2010; Dickstein et al., 2010).
Even before treatment, left amygdala connectivity distinguished responders from nonresponders, as there was already a significant difference between the groups. Furthermore, the logistic regression analyses indicated that the addition of left amygdala connectivity values before treatment helped predict final group membership. The fact that left, but not right, amygdala baseline functional connectivity helped predict medication response might be due to the left amygdala's greater engagement in conscious, language-dependent emotional processing than right amygdala, which is more linked with the automatic detection of emotional stimuli (Costafreda et al., 2008). In children with PBD, left amygdala activates in response to neutral faces (Rich et al., 2006), which are ambiguous and require more conscious processing, whereas right amygdala activates in response to angry faces (Pavuluri et al., 2007), which are unambiguous and activate the amygdala in a bottom-up manner (Hariri et al., 2002).
Alterations in connectivity patterns in response to medication
The amygdala-frontolimbic connectivity values observed after treatment were similar to those observed before treatment. The nonresponders continued to show decreased connectivity in both amygdalae, relative to responders. However, the HC group showed relatively reduced right amygdala connectivity values, approaching the levels found in nonresponders. This slight, albeit not statistically significant, decrease could represent a reduced need to regulate the automatic responsivity of the right amygdala, as over time HC should become more comfortable in the scanning environment, and should habituate to seeing emotional words (Hart et al., 2010), even if they are not the same ones as they saw in the first session. In addition, the right amygdala connectivity values best differentiated between responders and nonresponders, although left amygdala showed a marginally significant difference as well. However, only right amygdala connectivity post-treatment predicted the YMRS scores regardless of group membership. The responders' increase in right amygdala connectivity apparently caused this laterality difference, as their left amygdala connectivity values did not change. Thus, the responders' increased right amygdala connectivity may represent an increased ability to suppress the overactive right amygdala when confronted with emotional material.
Studies of amygdala activation in healthy participants also support this laterality distinction. A recent meta-analysis of 365 fMRI studies revealed that left amygdala activation was more likely with linguistic stimuli and right amygdala activation was more likely when stimuli were masked (Costafreda et al., 2008). Our stimuli were linguistic and briefly presented, so both amygdale may have been engaged to some extent. However, the responders' heightened left amygdala connectivity may indicate their ability to consciously process and cognitively down-regulate negative emotions. To test this intriguing possibility in further studies, patients could explicitly attempt to regulate their emotional responses, as has been done in healthy adults (Ochsner et al., 2004).
Strengths, limitations, and future directions
Major strengths of this study include the relatively large sample size of 34 patients, treated with monotherapy using various medications (with generalizable results to response status) and tested both before and after treatment, as well as the inclusion of an HC group to serve as a comparison baseline for test-retest factors, such as familiarity with the task and scanning environment. In addition, ICA allowed us to measure network connectivity directly, rather than infer it from areas that activate in response to the same task in a conventional fMRI analysis (Friston, 2002). Furthermore, ICA is data driven, rather than relying on hypothesis-driven assumptions about the time course of neural activity in response to a task, and can, thus, reveal connectivity patterns that differ from an a priori model of the task-related signal (Calhoun and Adali, 2006).
A limitation of the study was that three groups of patients taking different medications were pooled, so the number of responders and nonresponders to each medication was small, making it difficult to determine the patients' response to specific medications. Although the current study was not designed to separate out the effects of response to distinct medications, future studies could include more participants in each medication group to begin to differentiate response versus nonresponse to these disparate medications. In addition, it is not currently possible to separate participants' spatial functional connectivity results by any repeated-measures factor (e.g., valence), so it was not possible to evaluate the spatial connectivity of the network for each word valence. Furthermore, because a block task design, rather than an event-related task design, was used for power considerations, it was not possible to separate the time courses of participants' responses to individual trials or the link these to participants' behavioral results. However, we are currently conducting follow-up studies using event-related designs in order to achieve these goals. Finally, we were unable to assess the directionality of influence between the amygdala and other regions, because ICA and other connectivity techniques inherently rely on correlations between the time courses across regions of the brain. Nevertheless, finding any profile of disrupted connectivity is a necessary step toward employing techniques that can more aptly assess the directionality of region-to-region influences (e.g., effective connectivity techniques such structural equation modeling, dynamic causal modeling, lagged correlation, Granger causality/Partial directed coherence, and the newly developed Kalman cubature filtering). Such techniques are likely better suited to unravel the complex relationships between regional amplitude and “connectivity.”
Despite the limitations of this study, we have demonstrated that amygdala-frontolimbic functional connectivity pre- and post-treatment can predict and identify patients with PBD who responded to medication. Although preliminary, the results point to amygdala-frontolimbic functional connectivity observed while participants perform emotional and cognitive tasks as a potential marker of treatment response. To build on these results, further studies are in progress using various tasks in event-related designs, in larger samples, and with additional types of medications to treat PBD.
Conclusion
We used ICA to probe the interface of affective and cognitive functional operations in children with PBD and HC before and after medication treatment. ICA identified a frontolimbic component that was dysfunctional in PBD, and subsequent ROI analyses revealed that deficits in amygdala connectivity within this frontolimbic component distinguished medication responders from nonresponders. Preliminary findings suggest that increased left amygdala functional integration is critical in predicting medication responsivity, whereas increased right amygdala functional integration served as an outcome measure. Further connectivity studies should be conducted to investigate amygdala-frontolimbic connectivity as a biosignature of treatment responsivity and outcome.
Footnotes
Acknowledgments
This research was funded by NIH 1 K23 RR018638-01 and NIH-MO1-RR-13987.
Author Disclosure Statement
This research was funded by NIH 1 K23 RR018638-01 and NIH-MO1-RR-13987. M.P.'s work is currently supported by NIH funding 5R01MH081019-01, 5R01MH05639-01, and 5RC1MH088462-01. She is the current recipient of the Berger-Colbeth Endowed Chair in Child Psychiatry and is currently on the speaker's bureau for Bristol-Myers Squibb. A Passarotti's work is currently supported by a NARSAD Young Investigator's Award #17592. No competing financial interests exist for E.W., J.A.E., A.N., J.F., or M.S.
References
Supplementary Material
Please find the following supplemental material available below.
For Open Access articles published under a Creative Commons License, all supplemental material carries the same license as the article it is associated with.
For non-Open Access articles published, all supplemental material carries a non-exclusive license, and permission requests for re-use of supplemental material or any part of supplemental material shall be sent directly to the copyright owner as specified in the copyright notice associated with the article.