
Abstract
Several useful tractography-derived maps have recently been introduced, such as track density imaging (TDI) and the average pathlength map (APM). Here, an extension to these techniques is introduced by sampling diffusion indices along streamline trajectories (DIST). With this approach, voxels contain summary information of diffusivity measures within streamlines. The diffusion metrics can also be used as weighting factors for streamline number or length, generating DIST-weighted TDI and DIST-weighted APM, respectively. Furthermore, when higher-order models of diffusion are used to estimate the fiber orientation distribution within each voxel, it is possible to obtain directional TDI, APM, DIST, and DIST-weighted TDI and APM. The reproducibility of this approach using two b-values (1000 and 3000 s/mm2) and the effect of pathologic abnormalities are demonstrated.
Introduction
I
With use of diffusion tractography, it is possible not only to delineate white matter tracks in vivo but also subsequently use the identified tracks to extract quantitative measures of white matter integrity. For example, the volume of the delineated track can be compared between patient groups, or the tractography-derived white matter track can be used as a volume of interest to investigate diffusion metrics (e.g., FA) within a track. Correia and colleagues (2008) have described several quantitative tractography metrics that can provide useful information about white matter integrity, including the number of streamlines within a track, the length of the streamlines of a track, or FA within a track, as well as diffusion-weighted length and streamline number. Recently, two useful anatomic and quantitative tractography-based maps have been introduced (Calamante et al., 2010; Pannek et al., 2011): track density imaging (TDI) (Calamante et al., 2010), which generates maps showing the number of streamlines passing through every voxel, and the average pathlength map (APM) (Pannek et al., 2011), which shows the average length of streamlines within every voxel.
This article introduces a map that collects information about diffusion indices along the streamline trajectory (DIST), shows how scalar DIST maps are obtained, and demonstrates how it is possible to obtain more detailed information with directional DIST maps when a higher-order model of diffusion is used. Furthermore, this study extends the directional mapping methods to TDI and APM and assesses both the reproducibility of these scalar and directional maps using data obtained during two separate sessions, as well as the influence of b-value on reproducibility. Finally, the study shows how pathologic abnormalities can influence the appearance of these maps by using data from one participant who sustained a severe traumatic brain injury.
Materials and Methods
Data
Exemplary data from one healthy adult (a woman age 57 years), one adult who had sustained traumatic brain injury (a man age 20 years; Glasgow coma scale score, 7), and an age- and sex-matched healthy adult (a man age 19 years) were examined. Imaging data were acquired by using a 3T Siemens Tim Trio (Siemens, Erlangen, Germany) using a 12-element Tim head array. Diffusion images were acquired by using a single-shot echo planar multidirection diffusion-weighted sequence with dual bipolar diffusion gradient and a double spin echo. Parallel imaging was used with an acceleration factor of 2 to reduce susceptibility distortions, and partial Fourier factor 6/8th was used to reduce acquisition time.
Sixty-five diffusion-weighted images were acquired at each location, consisting of one low and 64 high diffusion-weighted images, in which the encoding gradients were uniformly distributed in space. Two diffusion data sets were acquired for the healthy adult participant. The first diffusion data set was acquired by using the recommended b-value for constrained spherical harmonic deconvolution (b=3000 s/mm2; Tournier et al., 2007). Additionally, a second diffusion data set was acquired at a b-value of 1000 s/mm2, which is frequently used in diffusion imaging. Other imaging parameters for the two sets were as follows: field of view, 250×250 mm; matrix, 100×100; resolution, 2.5 mm isotropic; bandwidth, 1390 Hz; repetition time/echo time, 8500/95 ms (b=1000s/mm2) and 9400/116 ms (b=3000s/mm2), respectively. To gauge reproducibility, this same participant was scanned on two occasions 2 months apart. The participant with traumatic brain injury and matched control were scanned by using just the diffusion sequence at the high b-value. The signal-to-noise ratio of images without diffusion weighting (b=0) was approximately 28.
The local ethics committee approved the study, and informed consent was obtained from each participant.
Preprocessing
Diffusion data were corrected for field inhomogeneities, followed by correction for participant movement using the fit-model-to-all-measurements method described by Bai and Alexander (2008). Briefly, target images for registration were generated by fitting the diffusion tensor to the data, followed by the calculation of synthetic data using the diffusion tensor information. This method provides target images with contrast similar to that of the diffusion-weighted images and showed, for our data, improved registration accuracy compared with the commonly performed registration to the image acquired without diffusion weighting, particularly for high b-value data. After motion correction, the b-matrix was adjusted to account for head rotation (Leemans and Jones, 2009; Rohde et al., 2004). Motion artifacts were identified by using detection and replacement of outliers prior to resampling (Morris et al., 2011). After these corrections, the diffusion tensor was calculated and FA maps were obtained by using MRtrix (NITRC;
Every brain voxel was seeded with 50 probabilistic streamlines (MRtrix) to obtain a whole-brain tractogram. Default tracking parameters were used (step size, 0.2 mm; minimum streamline length, 10 mm; minimum radius of curvature, 1 mm; FOD amplitude cutoff, 0.1; FOD amplitude cutoff at seed point, 0.2).
Generating scalar DIST maps
DIST maps were generated as follows. For simplicity, only the calculation of a DIST map of mean FA is described, but the same process can be used to calculate DIST maps of mean diffusivity, axial diffusivity, radial diffusivity, and other diffusion (and nondiffusion) indices, as well as other summary metrics apart from the mean. Generation of all maps was implemented in c++.
For every streamline, the interpolated FA value was sampled at each streamline integration step and the mean FA along the streamline was calculated and then stored in every voxel that was visited by the streamline. This process was repeated for all streamlines, building a voxel-wise profile of streamline mean FA. For every voxel, the average of the streamline mean FA values was then calculated, resulting in an FA-DIST map. Figure 1 illustrates the process of obtaining the DIST value of one voxel.

Similarly, FA-DIST–weighted TDI maps were calculated by adding all mean streamline FA values rather than calculating the average. FA-DIST–weighted APMs were calculated by multiplying mean streamline FA by streamline length before calculating the average. The process for obtaining FA-DIST–weighted TDI and FA-DIST–weighted APM is shown in Figure 1. TDI and APM were calculated as described elsewhere (Calamante et al., 2010; Pannek et al., 2011): by counting the number of streamlines (TDI) and calculating the average length of streamlines (APM) traversing each voxel, respectively. These maps rely on information stemming from the streamlines alone, without using FA as a weighting factor.
Generating directional DIST maps, TDI, and APM
When a higher-order model of diffusion is used in the diffusion processing, more than one fiber orientation can be resolved. It is then possible to obtain directional DIST maps by calculating the average of the streamline mean FA for every direction separately. Directional DIST maps allow the detailed assessment of diffusion metrics in areas where tracks cross. Without the directional information, injury to, for example, corpus callosum tracks can be obscured in the region of the corona radiata, where callosal tracks cross with corticospinal tracks and the superior longitudinal fasciculus. Figure 1 illustrates the procedure for obtaining a directional FA-DIST and the advantage of using directional DIST maps over scalar DIST maps in crossing fiber regions.
First, the mean FA of every streamline was calculated, as for the scalar FA-DIST map. However, instead of taking the overall average of all streamline mean FA values, every streamline was first assigned to the local FOD direction that it was best aligned with. Then, the average of streamline mean FA values was calculated for each of the streamline populations separately. The resulting values can be visualized, for example, by color-coding the FOD dumbbells with the respective directional FA-DIST value (Fig. 1) or as a set of maps (i.e., one map for every fiber direction) after appropriate intra-subject and inter-subject reassignment, as outlined by Jbabdi and colleagues (2010). In practice, however, displaying directional DIST maps in a comprehensible way is difficult because of the large amount of information contained within the map. We therefore recommend that directional DIST maps be used for statistical purposes rather than for visualization.
DIST-weighted TDI and DIST-weighted APM can be obtained in a similar fashion. Furthermore, this method can be used to obtain more detailed directional information of TDI and APM themselves. In areas of crossing fibers, TDI tends to be hyperintense compared with the surrounding white matter because of the additive effect of including multiple fiber populations in the streamline count. This problem can be avoided by using directional TDI by counting streamlines for the directions separately (see Fig. 1). Similarly, when the APM is calculated in crossing fiber areas, populations of different streamline lengths can contribute to the average, making the resulting value difficult to interpret. Directional APM splits the fiber populations, facilitating interpretation.
Reproducibility
Reproducibility was gauged by using the data that were acquired on two occasions for the healthy participant. The transformation between images of both sessions was obtained by using rigid-body registration of the b=0 image of the second scan to that of the first scan. Forward and backward half-transformations were calculated and the forward half-transformation applied to the FA map of the second scan, while the backward half-transformation was applied to the FA map of the first scan. This process ensured that FA maps of both scans were smoothed equally during the registration process before reproducibility was calculated. Quantitative tractography maps were calculated in this common space, thereby avoiding re-sampling.
For FA maps and scalar DIST maps, voxel-wise reproducibility was defined as the difference in voxel value between the two scans, divided by the average voxel value:
where v1 and v2 are the voxel values of scans 1 and 2, respectively.
For directional DIST maps, the orientation of FOD was taken into account. Corresponding directions between images were identified by calculating the angle between orientations and matching those with the smallest angle. Reproducibility was calculated for each orientation separately.
Traumatic brain injury example
To demonstrate the effect of pathologic abnormality on quantitative tractography maps, we compared the data of the participant with traumatic brain injury with those of the matched healthy adult participant. FA maps (b=3000 s/mm2) of both participants were aligned with the FMRIB FA template (supplied with FMRIB's Software Library FSL;
Results
Representative FA and scalar FA-DIST, TDI, FA-DIST–weighted TDI, APM, and FA-DIST–weighted APM acquired by using two b-values (b=1000 s/mm2 and 3000 s/mm2) are shown in Figure 2. The corresponding reproducibility maps of the various contrasts are given in Figure 3. All maps are displayed using the same color map and color scaling from 0% to ±50%. Histogram plots of reproducibility also are shown in Figure 3. The median reproducibility of all images (considering all brain voxels) is given in Table 1 and indicated by vertical lines in Figure 3. Notably, the reproducibility of FA, FA-DIST, APM, and FA-DIST-weighted APM was high at both b-values, whereas the reproducibility of TDI and FA-DIST-weighted TDI was poor. In all scalar image contrasts, we found that reproducibility was improved when the higher b-value data were used. For directional maps, reproducibility was improved only for the FA-DIST map for higher b-value data. Reproducibility was decreased for higher b-values for TDI and FA-DIST-weighted TDI, and reproducibility was (approximately) stable for APM and FA-DIST-weighted APM.
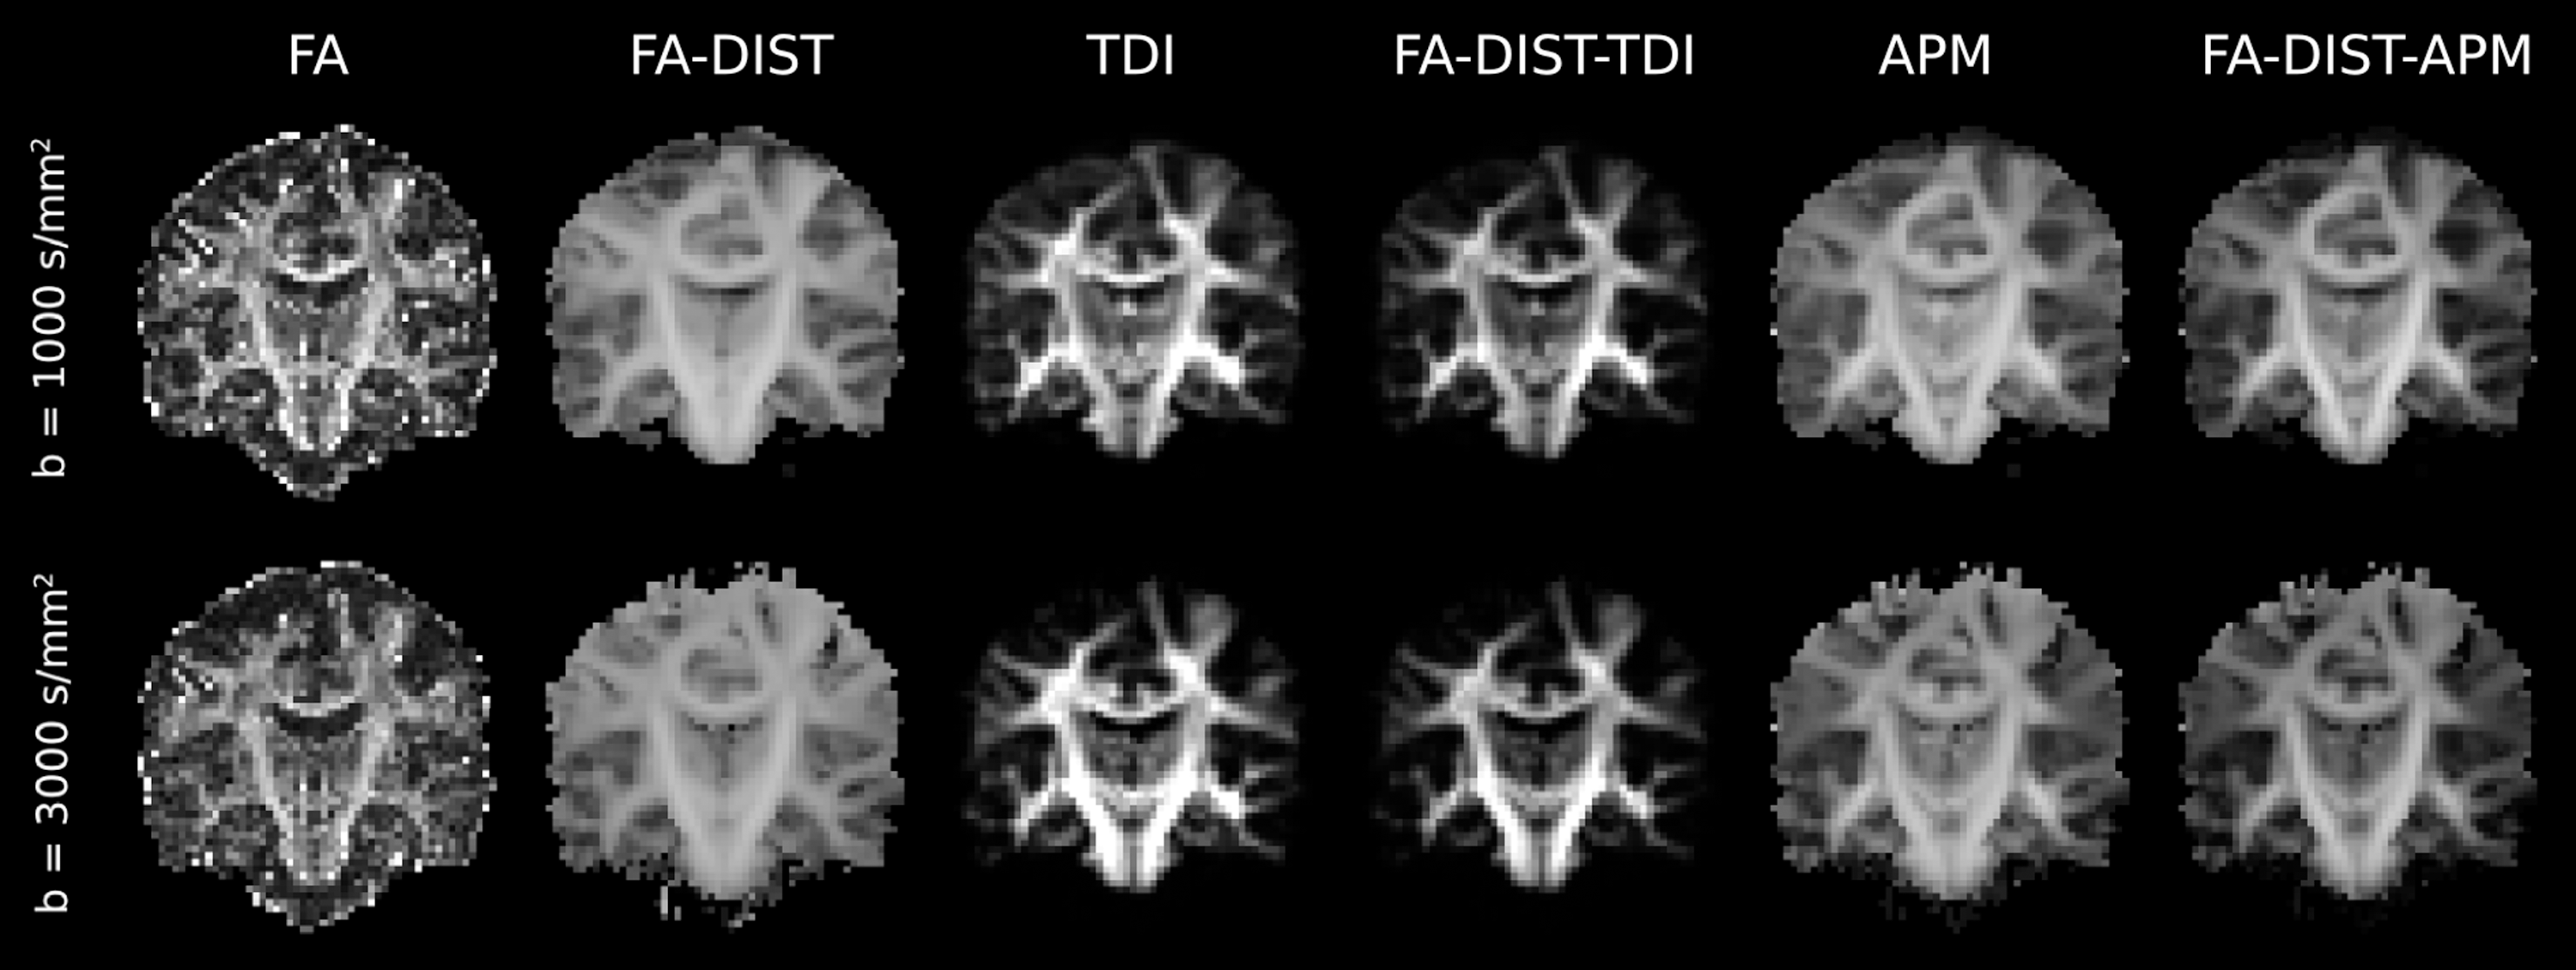
Fractional anisotropy (FA) and quantitative tractography maps for a healthy control participant, obtained by using diffusion data of one adult acquired at b=1000 s/mm2 and b=3000 s/mm2. APM, average pathlength map; DIST, diffusion indices along streamline trajectories; TDI, track density imaging.

Reproducibility of fractional anisotropy (FA) and quantitative tractography maps using data obtained from one healthy participant scanned on two occasions with b=1000 s/mm2 and b=3000 s/mm2. Shown are voxel-wise reproducibility maps and frequency distribution of voxel reproducibility values for FA and FA diffusion indices along streamline trajectories (DIST), track density imaging (TDI) and FA-DIST–weighted TDI, and average pathlength map (APM) and FA-DIST–weighted APM. Distributions are shown for scalar (solid lines) and directional (dashed lines) for b=1000 s/mm2 (red) and b=3000 s/mm2 (blue). Vertical lines indicate the median reproducibility value.
APM, average pathlength map; DIST, diffusion indices along streamline trajectory; FA, fractional anisotropy; TDI, track density imaging.
Figure 4 shows the effect of traumatic brain injury on the FA and tractography maps. The participant with traumatic brain injury shows a reduction of FA in the genu of the corpus callosum (FA map) compared to an age- and sex-matched healthy control. All quantitative tractography maps show a reduction in voxel values in the genu of the corpus callosum extending into the frontal lobes of both hemispheres. This white matter pathway is known to be vulnerable to diffuse axonal injury in traumatic brain injury (Maller et al., 2010).

Comparison between a healthy control (left of each panel) and participant with traumatic brain injury (TBI; right of each panel). Shown are fractional anisotropy (FA), FA diffusion indices along streamline trajectories (DIST), track density imaging (TDI), FA-DIST–weighted TDI, average pathlength map (APM), and FA-DIST–weighted APM. All maps show reduced values in the genu of the corpus callosum in the participant with traumatic brain injury compared with control.
Discussion
This article introduced several new quantitative tractography maps by sampling diffusion indices along streamline trajectories (DISTs). The feasibility of this method was demonstrated by generating DIST maps of FA using data acquired at two different b-values. In addition, the study assessed the reproducibility of DIST maps compared with FA, TDI, and APM. The results showed that DIST, TDI, DIST-weighted TDI, APM, and DIST-weighted APM produced maps of high contrast at low (1000 s/mm2) and high (3000 s/mm2) b-values.
By using data obtained on two occasions, the study found that reproducibility between sessions of FA-DIST, APM, and FA-DIST-weighted APM was better than or similar to that of FA. Reproducibility of FA-DIST, APM, and FA-DIST-weighted APM was high, even in peripheral white matter. In contrast, TDI and FA-DIST-weighted TDI performed worse in terms of reproducibility at both b-values. In addition to scalar DIST, TDI, DIST-weighted TDI, APM, and DIST-weighted APM, we proposed a new method for obtaining directional maps of these contrasts by taking into account the local orientation of the streamline within each voxel. These directional maps can provide more detailed information than scalar maps because they allow the discrimination of contributions from different fiber populations. Of note, the reproducibility of the directional maps was similar to that of the scalar maps. However, this finding needs to be confirmed by using a larger cohort of participants who are scanned on multiple occasions, which will also allow an assessment of variability across the population and indicate the required sample size. It is expected that variability will depend on brain region, with large easy-to-track structures showing lower variability compared with smaller and difficult-to-track structures.
DIST maps that are obtained from quantitative diffusion metrics such as FA or MD can easily be compared across participants. However, when a quantitative diffusion metric is weighted by semi-quantitative metrics, such as streamline length (which can vary substantially depending on brain size and shape), appropriate normalization procedures need to be applied (Pannek et al., 2011). Normalization of streamline number remains an unsolved problem to date. This study also demonstrated that maps based on streamline number (TDI and DIST-weighted TDI) show poor reproducibility, even within the same subject. Although these maps reveal useful anatomic information, they should not be used for quantitative comparison between participants at this stage.
When directional DIST (and related) maps are used, it is essential that corresponding directions are compared between subjects. This can be achieved, for example, by using a procedure similar to that described by Jbabdi and colleagues (2010), which uses spatial intra-subject reassignment (i.e., considering the relationships of orientations across voxels within the same subject), followed by modal inter-subject reassignment to obtain consistent assignment across subjects. The problem of reassignment could be avoided entirely by generating a population-based FOD template, using the method described by Raffelt and coworkers (2011). All streamlines of individual participants could be transformed to this template and directional maps obtained using the template orientations.
To illustrate the effect of pathologic abnormalities on the quantitative tractography maps, this study compared one patient who had sustained a severe traumatic brain injury (Glasgow coma scale score, 7) with a matched healthy control (Fig. 4). In all image contrasts, a clear involvement of the genu of the corpus callosum can be seen. In the case of severe traumatic brain injury, diffuse axonal injury affects FA values, as well as streamline number and streamline length; therefore, all image contrasts would be suitable for analysis. This may, however, not be the case for other pathologic abnormalities. For focal lesions, for example, abnormality may influence diffusion locally in such a way that streamlines are terminated at the lesion site; FA values of the lesion site would therefore not be included in the FA-DIST map, and little difference would be observed between control and patient FA-DIST maps. Differences would then appear only on APM and TDI. In contrast, if subtle differences in diffusion exist along an entire track in such a way that the course of the streamlines is not affected, APM and TDI may show no difference between control and patient, whereas FA-DIST maps are suitable.
Although the analysis in this article is restricted to FA, TDI, and APM, the same procedure can be applied to numerous other standard scalar diffusion metrics, such as mean, axial, or radial diffusivity. DIST maps could also be obtained by using directional diffusion metrics; i.e. metrics with different values along different directions within the same voxel, such as the weights of anisotropic compartments suggested by Jbabdi and associates (2010), or the amplitude of the FOD itself (Rose et al., 2011). After co-registration, non–diffusion-based metrics could also be incorporated in the DIST map. Moreover, the method is not restricted to using the mean value of the diffusion metric along the streamline; median, modal, percentile, and other summary values could also be used. When the distribution of the diffusion metric within a streamline is not symmetric, the median may be a more appropriate summary measure than the mean. Similarly, if only one tail of the distribution is of interest, percentiles may be used.
This study assessed DIST and DIST-weighted maps only in the native resolution of the diffusion scan. However, their resolution is not restricted to native resolution because they possess the same “super-resolution” property as TDI (Calamante et al., 2010), which allows the calculation of tractography-based maps at a resolution higher than the native resolution.
Although this study was designed to introduce the concept of DIST mapping and begin to examine reproducibility, a much larger cohort is needed to assess between-subject variability and true between-session reproducibility. Furthermore, the utility and sensitivity of these maps must be assessed in patient-control studies.
Conclusion
In conclusion, this study introduces a new quantitative tractography map that takes into account underlying diffusion parameters. It showed that these maps produce suitable contrast with acceptable reproducibility. This method could be used for voxel-based analysis of quantitative tractography.
Footnotes
Acknowledgments
The authors gratefully acknowledge David Raffelt and Christopher Bell, who supplied tools for the rotation of the b-matrix and outlier rejection, respectively.
Author Disclosure Statement
No competing financial interests exist.