
Abstract
Increasing evidence suggests that abnormal white matter is central to the pathophysiology and, potentially, the pathogenesis of schizophrenia (SCZ). The spatial distribution of observed abnormalities and the type of white matter involved remain to be elucidated. Seventeen chronically ill individuals with SCZ and 17 age- and gender-matched controls were studied using a 3T magnetic resonance imaging diffusion tensor imaging protocol designed to examine the abnormalities of white matter by region and by level of architectural infrastructure as assessed by fractional anisotropy (FA) in native space. After assessing whole-brain FA, FA was divided into quartiles, capturing all brain regions with FA values from 0 to 0.25, 0.25 to 0.5, 0.5 to 0.75, and 0.75 to 1.0. Mean whole-brain FA was 4.6% smaller in the SCZ group than in healthy controls. This difference was largely accounted for by FA values from the second quartile (between 0.25 and 0.5). Second quartile FA was decreased in all 130 brain regions of the template in the SCZ group, with the difference reaching statistical significance in 41 regions. Correspondingly, the amount of brain tissue with an FA of ∼0.4 was significantly reduced in the SCZ group, while the amount of brain tissue falling in the lowest quartile of FA was increased. These findings strongly imply a diffuse loss of white matter integrity in SCZ. Our finding that the loss of integrity disproportionately involves white matter of low to moderate organization suggests an approach to the specificity of white matter abnormalities in SCZ based on microstructure rather than spatial distribution.
Introduction
T
Volumetric imaging has consistently demonstrated lower white matter volumes in multiple tracts (Kubicki et al., 2005). More recently, diffusion tensor imaging (DTI), which can assess the integrity of white matter tracts by measuring the properties of water diffusivity, has been used to show white matter disruption in SCZ. Region of interest (ROI) methods, extensively used for precise measurements of prespecified regions or tracts, have demonstrated abnormal diffusivity in frontal (Buchsbaum et al., 2006b; Minami et al., 2003; Schlosser et al., 2007), temporal (Lim et al., 1999; Minami et al., 2003; Schlosser et al., 2007), and parietal and occipital lobes (Lim et al., 1999; Minami et al., 2003). Abnormalities have been found in cortical connecting tracts, including the superior longitudinal fasciculus (Mitelman et al., 2007; Shergill et al., 2007), fronto-occipital longitudinal fascicule (Mitelman et al., 2007), uncinate fascicule (Mori et al., 2007), frontal longitudinal fasciculus (Buchsbaum et al., 2006a; Mitelman et al., 2007), and the arcuate fasciculus (de Weijer et al., 2011). Less consistently, abnormalities have been detected in other regions of the brain, including the cerebellar peduncles (Okugawa et al., 2005), the fornix (Abdul-Rahman et al., 2011; Okugawa et al., 2005), the hippocampus and parahippocampal gyrus (Ardekani et al., 2003), and the thalamic (Ardekani et al., 2003) and optic radiations (Mitelman et al., 2007). Taken together, ROI investigations suggest that white matter abnormalities exist in multiple regions, but results have not been entirely consistent, and ROI approaches do not sample the entire brain.
Alternatively, a voxel-based method (VBM) has been applied to DTI. Each scan can be normalized to a standard space, spatially filtered (Jones et al., 2005), and statistically adjusted for multiple comparisons; this permits comparisons across the entire brain. The use of this approach in a relatively large sample suggests that reductions in fractional anisotropy (FA) are widespread in SCZ (Kanaan et al., 2009). However, VBMs depend on accurate registration between brain scans. Misregistration due to either the registration algorithm or, more likely, anatomical differences among study participants can generate artifactual differences in diffusivity. Consistent both with recent findings that white matter changes in SCZ are widespread and with methodological limitations, VBM has not yielded consistent findings based on which brain regions are most affected (Melonakos et al., 2011).
Here, we use a methodological approach that takes advantage of the strengths of both ROI and VBM to test the hypothesis that disruption of specific types of white matter is widespread in the brain of individuals with SCZ. First, we determined the overall difference in brain anisotropy in patients compared with controls while simultaneously examining the regional contributions to that difference, minimizing error from misregistration by employing a novel method of extracting FA from each subject's “native” space, and using a subject-specific segmentation template that covers the entire cerebrum. Second, we determined the difference in the distribution of brain volume with specific FA scores in patients compared with controls, providing insight into the nature of the white matter affected in SCZ.
Materials and Methods
Participants
The study was approved by the Johns Hopkins Medicine Institutional Review Board, and all participants provided written informed consent. Inclusion criteria for the affected individuals were a diagnosis of SCZ as confirmed by interview and medical records, and a stable psychotropic medicine regimen for at least 6 weeks (see Supplementary Table S1; Supplementary Data are available online at
Data acquisition
Participants underwent less than 1 h of magnetic resonance imaging (MRI) scanning. Diffusion-weighted images (DWI) were acquired on a 3.0-Tesla Philips Intera scanner (Philips Medical Systems, Best, The Netherlands) equipped with Dual Quasar gradients (80 mT/m at 110 mT/m/s or 40 mT/m at 220 mT/m/s). A parallel imaging technique using sensitivity encoding (Pruessmann et al., 1999) with a reduction factor of 2.5 was used for signal reception using an eight-element arrayed radio frequency (RF) head coil with a six-channel receiver. A diffusion-weighted spin-echo sequence with single-shot echo-planar imaging in contiguous axial planes covering the whole brain was used: time of repetition (TR)=6500 ms, time of echo delay (TE)=71 ms, flip angle=90°, matrix=96×96 (reconstructed 256×256), field of view (FOV)=212×212 mm2, slice thickness=2.2 mm without inter-slice gaps, and 60 slices covered the whole brain. The axial plane was adjusted to be parallel to the AC-PC line. Diffusion weighting was applied at each slice position with b=700 sec/mm2 along 32 independent, noncollinear orientations. One additional image without diffusion weighting (b=0 sec/mm2) was also acquired at each slice position. The reconstructed voxel size=2.2×2.2×2.2 mm. Two DWI sequences were acquired for each participant to enhance the signal-to-noise ratio (SNR).
Data processing
All data was processed using the MRI Studio© suite of software tools (
Statistical analysis
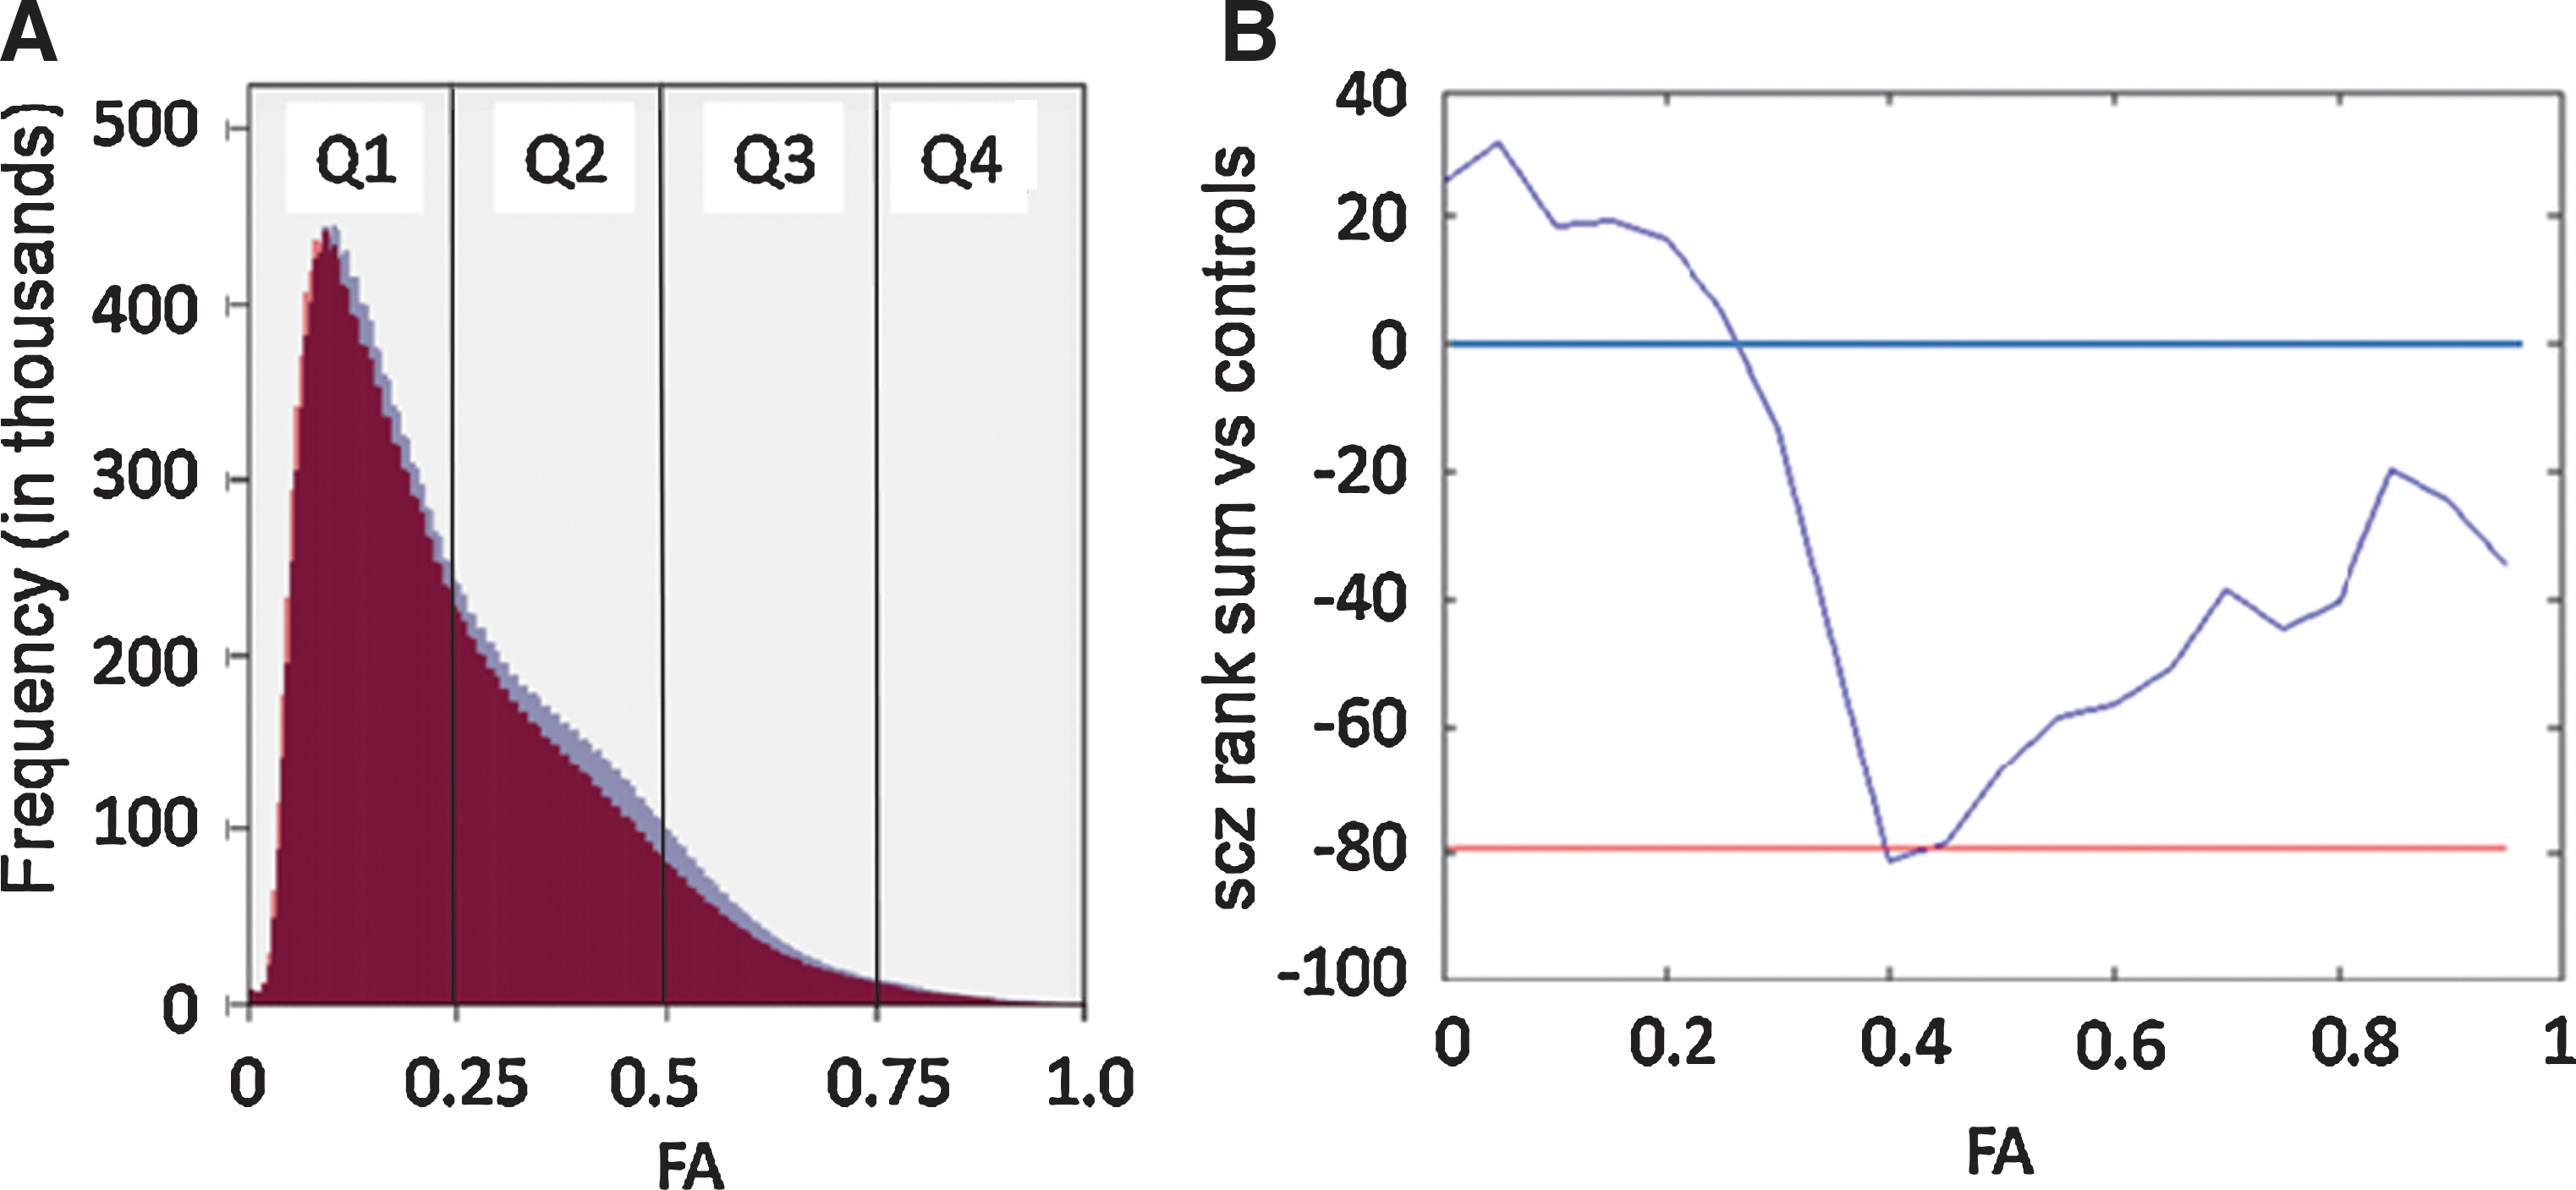
The resampled and skull-stripped data were used to acquire mean whole-brain FA and volume using ROIEditor©. Whole-brain mean FA (i.e., FA between 0 and 1.0) and volume (excluding ventricles) were compared using SPSS version 16 (SPSS, Inc., Chicago, IL) with group difference assessed by the two-sample independent t-test (Fig. 1a). Due to the significant group difference in years of education, all data were covaried for years of education. Next, with the same statistical method, we determined the volume of each quartile of FA, such that quartile 1 captured all pixels with FA between 0 and 0.25, quartile 2 captured all pixels with FA between 0.25 and 0.50, quartile 3 captured all pixels with FA between 0.5 and 0.75, and quartile 4 captured all pixels with FA values between 0.75 and 1.0 (Fig. 1b–e, respectively). For each quartile, we determined the total number of pixels, the mean FA, and, as each isotropic pixel is 1 mm3, total brain volume encompassed by each quartile. A univariate analysis of variance was used to assess the contribution of volume differences to mean FA across quartiles. This analysis was further refined by dividing FA into 20 smaller bins, extending .05 rather than .25 U. Voxels were counted for each individual within each bin, normalizing by the total number of voxels for each subject. For each bin, the centered rank sum statistic was computed, with p values estimated using random permutations of the rank sums, thus accounting for multiple comparisons.

Distribution of FA quartiles in a representative control brain. Note that this figure superimposes FA distribution onto a single brain for illustrative purposes. See Table 4 for FA analysis.
Large deformation diffeomorphic metric mapping transformation
For generation of the nonlinear warping transformation matrix, we utilized the large deformation diffeomorphic metric mapping (LDDMM) (Miller et al., 2005) tool within Landmarker©. The skull-stripped mean b=0 and FA maps from each participant were individually registered to the available and software-specific single-subject mean b=0 and FA atlas images in MNI space (for atlas details, see Oishi et al., 2009) using a linear transformation followed by the 12-parameter affine transformation option with AIR. Next, these “MNI registered” data (mean b=0 and FA maps) were further transformed to match the MNI target atlas images via the available dual channel LDDMM tool. For this study, the resultant transformation matrix was not applied to the DTI data. Instead, a “reverse” transformation matrix (Hmap) was applied to a whole-brain segmentation template ensuring that the transformation-sensitive DTI data remained unaltered and in “native” space. The details of the development of the segmentation template and the methods of transformation have been previously described (Oishi et al., 2009). The segmentation template defines 130 brain regions (65 unique regions of left and right hemisphere). Regional differences of FA and volume were evaluated with SPSS via the independent sample t-test.
Tract tracing
Once regional abnormalities were defined, a revised segmentation template was generated by incorporating only those regions with statistically different FA. Next, the revised templates were imported as binary maps into DTI-Studio© for use as regional seed points for tract tracing (Hua et al., 2008). Within the DTI-Studio©, fiber tracking is based on fiber assignment by the continuous tracking algorithm (Mori at al., 1999; Xue et al., 1999) with an FA in this case of 0.25 and a principle eigenvector turning-angle threshold of 40° between two connected pixels. In this study, tracking was performed from all pixels inside the ROIs shown to have a significant difference in FA between groups. The resultant image is a visual display of the connections to and from the affected regions showing all fibers potentially influenced by measured reductions in FA.
Results
Seventeen individuals with SCZ and 17 healthy controls matched for age and gender participated in this study (Table 1). The population was predominantly male and middle aged. As expected, the affected participants scored lower significantly lower on the HART and had significantly less education than controls. In addition, as expected for individuals with chronic SCZ on stable doses of medicine, positive symptoms as measured by the SAPS were relatively well controlled, while negative symptoms, measured by the SANS, were more prominent.
Mean±SD.
p<0.001, t=4.75.
p<0.032, t=2.23.
HART, Hopkins Adult Reading Test; SAPS, Scale for Assessment of Positive Symptoms; SANS, Scale for the Assessment of Negative Symptoms; SCZ, schizophrenia; SD, standard deviation.
Whole-brain FA and volume
Mean whole-brain FA was 4.6% smaller in the group of individuals with SCZ than in the health control (HC) group (p=0.027) (Table 2). The 2.2% difference in whole-brain volume between SCZ and HC was not significant (p=0.774) (Table 2). The FA differences were still present after covarying for the differences in whole-brain volume. Diffusivity, reflected by FA values in this study, is distributed within the brain from 0 (no directionality of water diffusion) to 1 (perfect linearity of water diffusion). Our results demonstrated an overall lower FA in SCZ. However, an important question is whether this decrease reflects a shift in the volume of brain material with a specific FA value. To test this possibility, the FA values were initially divided into quartiles (Fig. 1). This division was chosen based on the previous determination that a threshold of 0.25 effectively and conservatively delineated white matter tracts (Oishi et al., 2009), and our effort to maintain equivalent divisions within the FA continuum. Most brain volume, including regions of predominant gray matter, falls into the lowest quartile, with decreasing volume encompassed by quartiles of greater FA value. Mean FA was significantly lower in the 2nd quartile of SCZ than in HC (Table 3). However, SCZ had a significantly greater percentage of overall brain volume dedicated to the lowest FA range, quartile 1, compared with HC after correction for overall brain volume (Table 4, Fig. 2A). In every other quartile, volume was higher, though not to the point of statistical significance, in HC. Binning into smaller FA units (0.05; see Materials and Methods) facilitated a more detailed examination of the shift in the FA values in SCZ compared with HC, focusing on the rank sum of each bin and using random permutations to account for multiple comparisons. Plotting the rank sums against FA indicates that the curve crosses the threshold of significance (−79.5, the upper 5% of values obtained in the random permutations) at an FA of ∼0.4, indicating that the proportion of pixels with FA around 0.4 is smaller in SCZ than in HC (p=0.041 after controlling for multiple comparisons) (Fig. 2B). The volume at a given FA is lower in SCZ than HC in all but the very lowest FA bins, consistent with the results in Table 4. This approach is quite conservative, and the depression of the value of the rank sum in the larger region around 0.4 (roughly 0.3 to 0.5) suggests a somewhat wider actual region of reduced FA in SCZ. The same analysis with 100 bins reached similar conclusions (data not shown). We also tested the difference in FA between SCZ and HC by computing the cumulative distribution functions (cdf) of both groups (the proportion of voxels with FA lower than a given value, pooled over all the subjects in the group), and calculating how many times the cdf for SCZ is larger than the cdf for HC. This analysis also revealed a shift toward lower FA in SCZ, significant at p=0.02 as determined by permutation tests.
Brain volume at different FA bins.
FA, fractional anisotropy; sd, standard deviation.
Group comparisons evaluated using independent t-tests.
Group comparisons evaluated using univariate analysis of difference controlling for whole-brain volume.
Regional analysis of FA
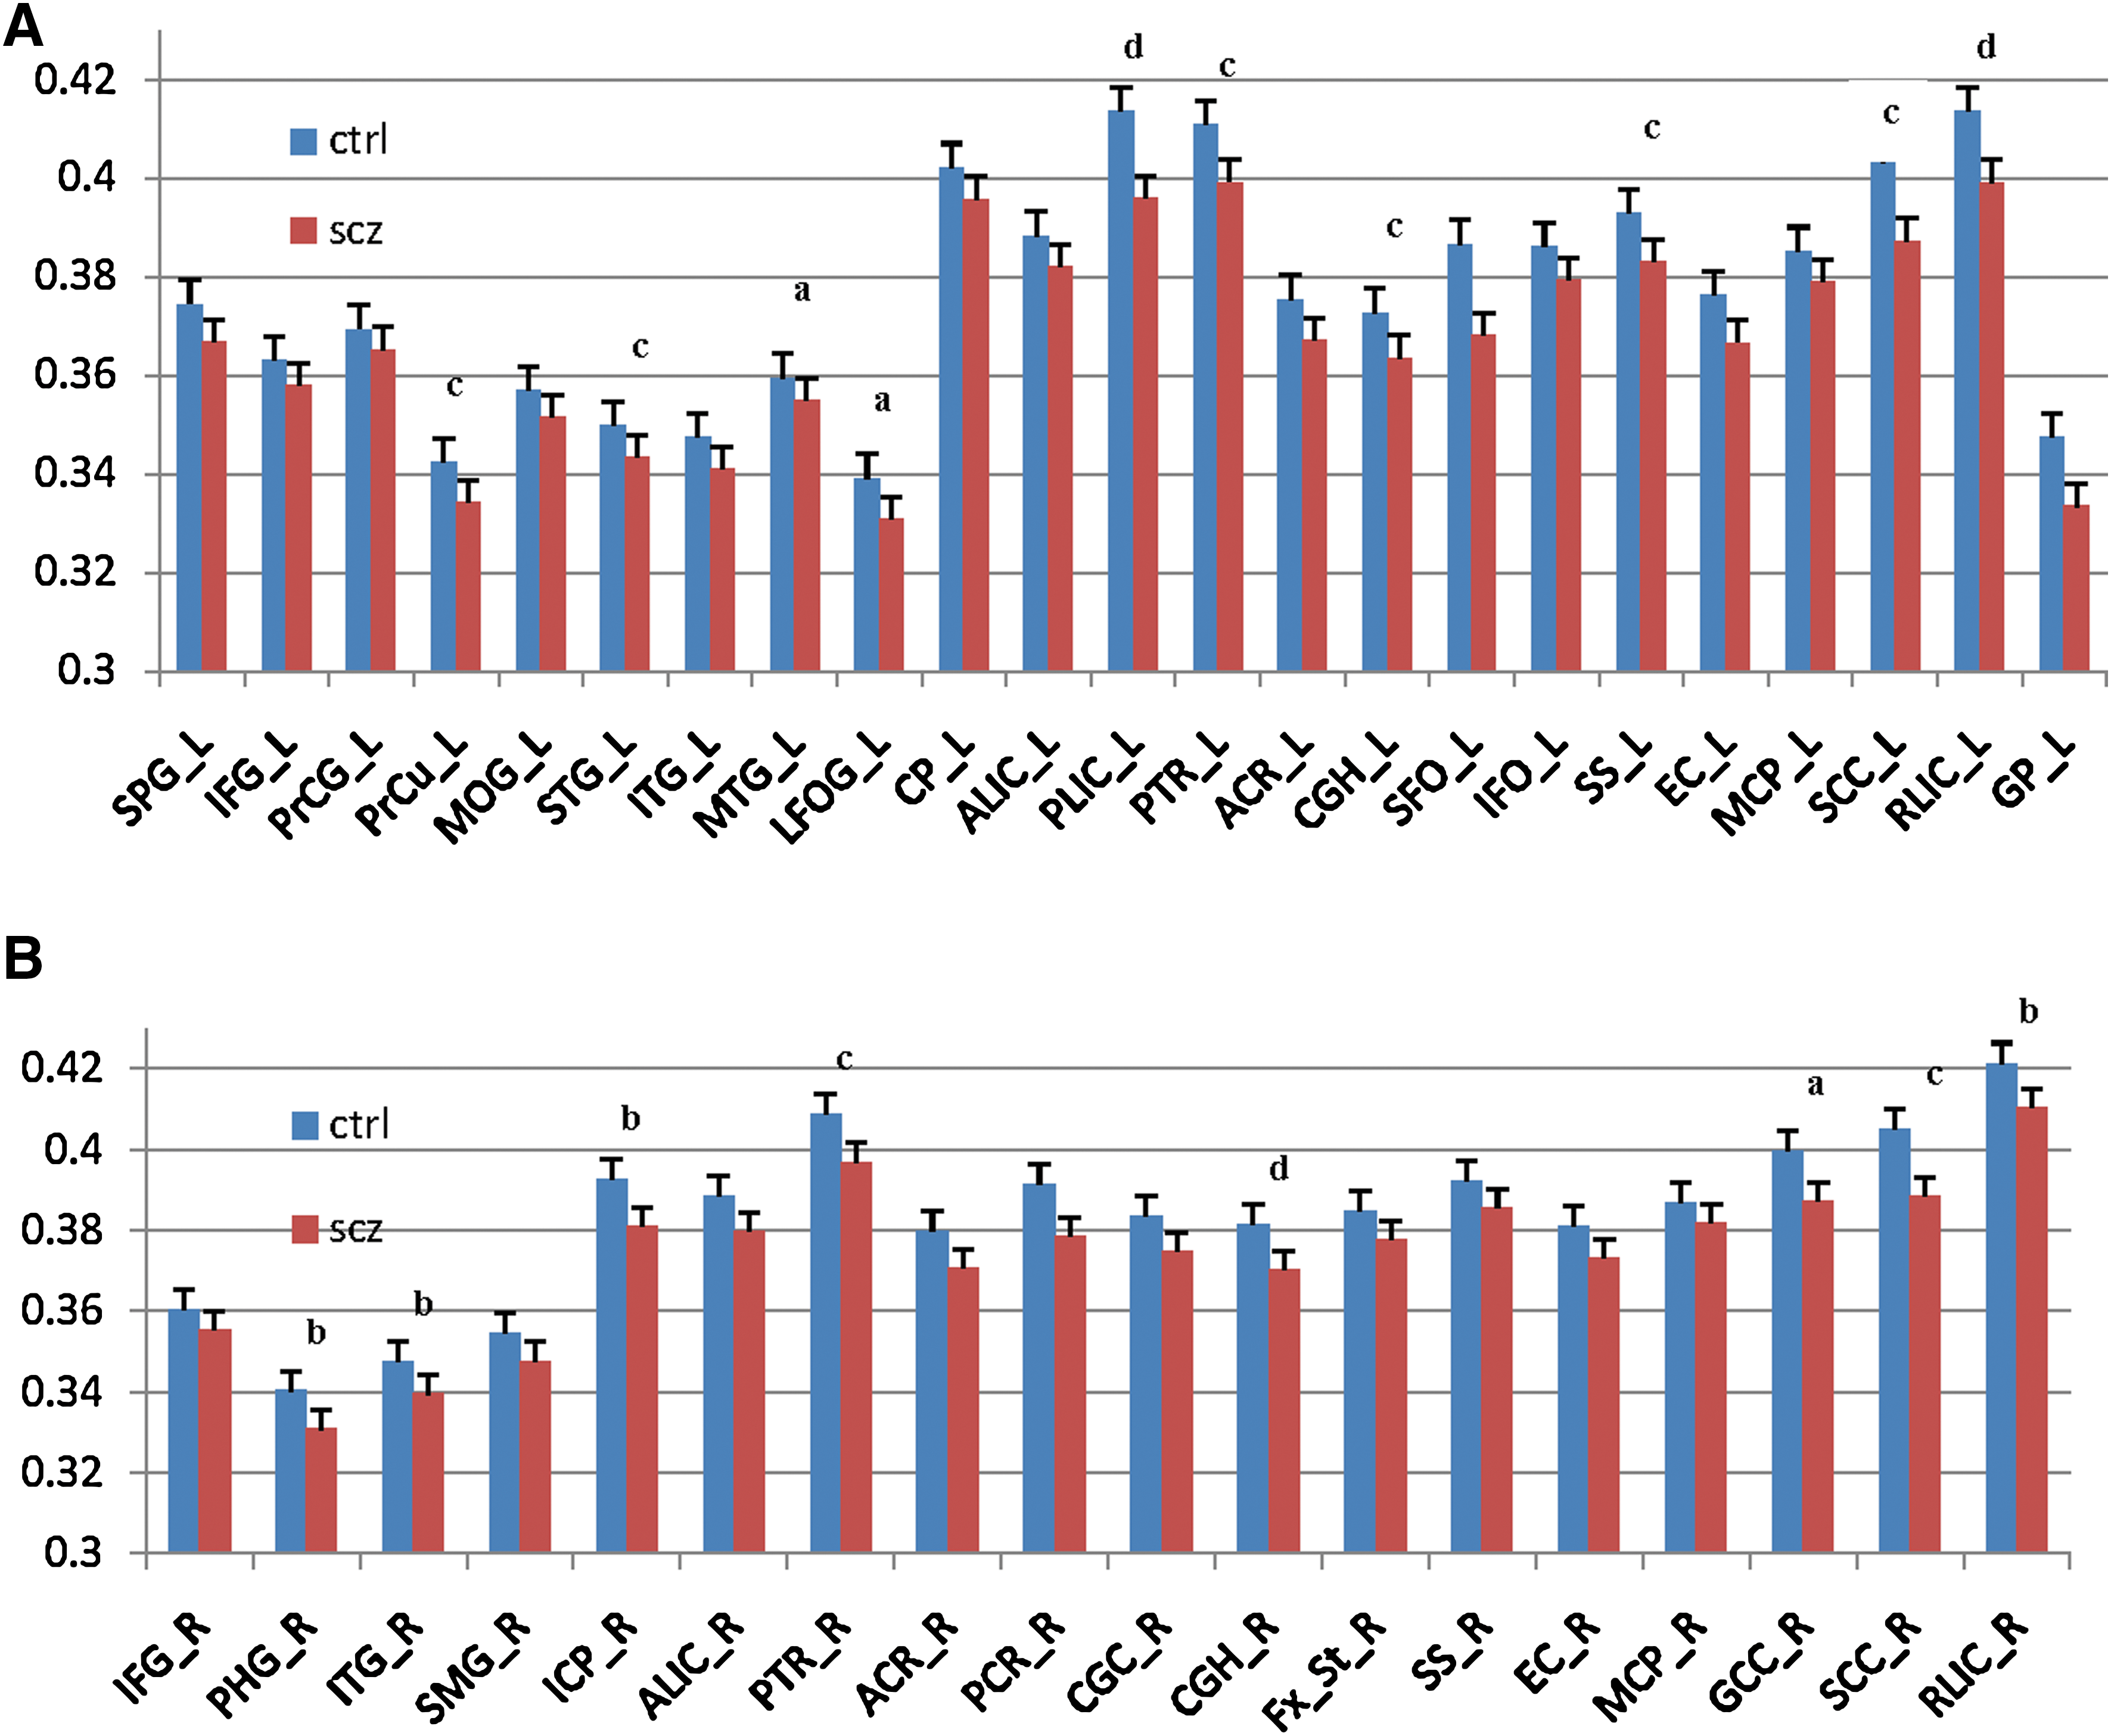
To determine whether the decrease in 2nd quartile mean FA was generalized or tract specific, we used reverse LDDMM transformation, fitting the 130 region segmentation template to the brain anatomy of individual subjects. Our results showed lower FA in SCZ in every brain region examined. The difference reached statistical significance in 23/65 left hemisphere regions and 18/65 right hemisphere regions (Fig. 3). This result is visually depicted in a mask image incorporating all 41 regions of the left and right hemispheres with significantly lower FA in SCZ (Fig. 4). To demonstrate the diffuse nature of the abnormality, a tract tracing was made in a sample individual with SCZ using the 41-region mask (Fig. 5
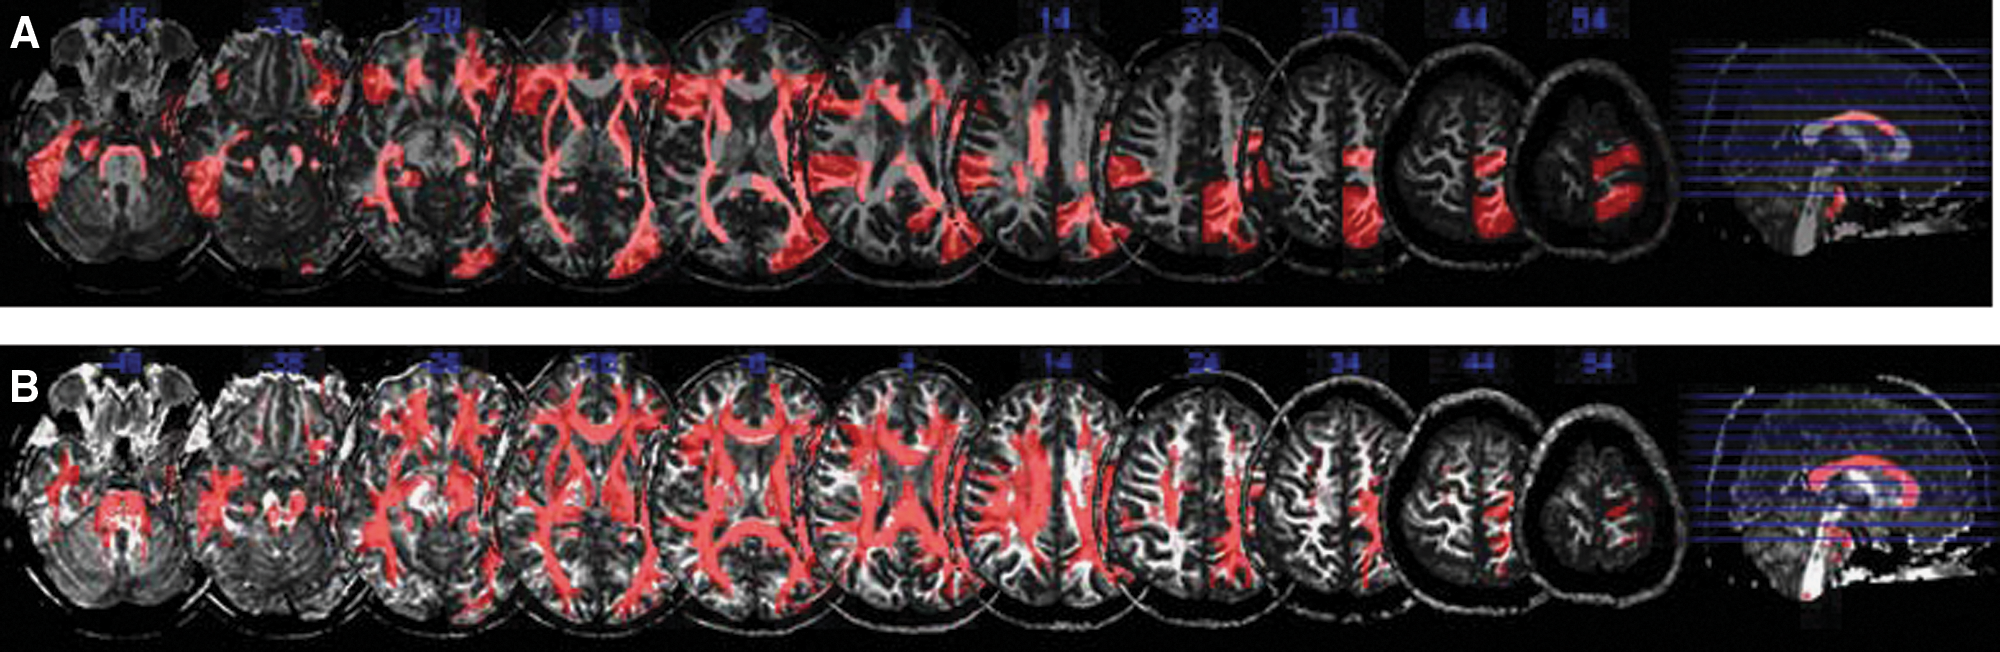
Multislice representation of regions of significantly lower FA in SCZ.

Tract tracing in an individual with SCZ based on 41 regions with significantly lower FA values than HC.
Discussion
In a sample of 17 individuals with chronic SCZ and 17 matched controls, we used an MRI at 3T to measure FA in “native” space without transformation or alteration of the “correction” sensitive data within each voxel. Further, we determined the range of FA values that are differentially abnormal in SCZ by using a new data-driven approach. Once this range was determined, we were able to employ methods involving LDDMM transformation of a common binary template to the data from each subject to identify those brain regions with deficits in the volume of tissue. Our results using these novel methods demonstrated a significant decrease in whole-brain FA. This loss encompasses a widely distributed subset of brain white matter with moderate levels of organization (FA values between 0.25 and 0.5). A similar shift was detected in a secondary analysis in a study focusing on the genu of the corpus collosum (Kanaan et al., 2006).
Our findings strongly imply a diffuse loss of white matter integrity in SCZ. This loss was detectable not just in the areas typically implicated in SCZ pathogenesis, such as the frontal lobe, but also in areas such as the middle and inferior cerebellar peduncles of the brainstem, demonstrating a widespread abnormality in brain white matter organization and, thus, presumably in brain connectivity. The gray matter/white matter junction is of particular interest, especially in the cortex. One possible interpretation of our data is that low FA in these regions arises, at least in part, from a loss of definition of the gray matter/white matter junction. Neuroanatomically, this would be consistent with the disorganization of small association fibers, with potentially profound effects on cortical function. We cannot exclude the possibility that some tracts may be more affected than others, or become damaged later in the course of disease, or are more plastic in response to internal or external factors.
The numbers of subjects in this study are relatively small, and, thus, the data should be cautiously interpreted, and replication will be in order. Lower HART scores in patients compared with controls suggests baseline cognitive differences among the groups, of uncertain significance, but perhaps reflecting subtle developmental abnormalities. Further, our data need to be interpreted in the context of our patient population, chronically ill individuals treated with many different antipsychotic agents. However, decreased FA has been detected in individuals with recent onset SCZ who are medicine naïve (Cheung et al., 2008; Perez-Iglesias et al., 2009), and FA did not differ between individuals treated chronically and those treated more acutely (Kanaan et al., 2009) or between individuals receiving larger doses and those receiving smaller doses (Buchsbaum et al., 1998; Fitzsimmons et al., 2009; Foong et al., 2000), though one small study found a positive correlation between left frontal FA and the antipsychotic dose (Minami et al., 2003). The potential changes in FA over time in SCZ relative to controls remains unresolved (Kanaan et al., 2009; Voineskos et al., 2010).
Anisotropy appears to be largely generated by axonal membranes and secondarily by myelination, with minimal contribution of internal structures such as microtubules and neurofilaments (Beaulieu 2002; Sexton et al., 2009). Reduced anisotropy, therefore, may reflect reductions in myelination, the number or density of axons in a fiber tract, or axonal adherence (Konrad and Winterer 2008). Loss of FA could reflect a loss of axons as a consequence of nonspecific neuronal damage or a specific insult to internal or external axonal integrity. Neuropathological or refined multimodal imaging methods (Prasad and Keshavan 2008), potentially including the use of higher-resolution imaging systems, may provide the tools to distinguish among these possibilities. Our results further suggest the possibility that pathways, structures, or processes essential for axonal or dendritic integrity may be differentially affected in white matter tracts with FA in the 0.25 to 0.5 range and, hence, valuable targets for neurobiological exploration. For instance, the loss of function of the enzyme calcium-independent phospholipase A(2)β results in the failure of normal remodeling of membrane phospholipids and the disease infantile neuroaxonal dystrophy (Beck et al., 2011). Similarly, normal axonal structure and function requires the synthesis of glycosphingolipids by glucosylceramide synthase (Watanabe et al., 2010). It is possible that subtle dysfunction of these or other enzymes involved in membrane stability could disproportionately affect specific types of white matter fibers, such as small association fibers. Other processes of interest include mitochondrial stability (Barrientos et al., 2011) and the Notch-1 signaling pathway (Ishikura et al., 2005).
The functional implications of decreased anisotropy in SCZ have not been fully elucidated. One possibility is that a loss of axonal organization would lead to a decrease in signal and a consequent decrease in local field potential at the target, whereas demyelination might lead to the desynchronization of postsynaptic signal transduction and, hence, more background activity (i.e., decreased SNR) (Konrad and Winterer 2008). Either effect would be consistent with growing evidence that SCZ can be considered, at least in part, a disease of disconnectivity (Camchong et al., 2011; Friston, 1998). Our results indicate that disconnectivity is likely widespread.
To date, it has been difficult to clinically synthesize the various regionally specific hypotheses tied to the pathology of SCZ. While prefrontal pathology may explain aspects of cognitive deficits (Volk and Lewis, 2010) and temporal pathology may explain aspects of disturbed auditory perception (e.g., Chance et al., 2008), damage to neither region can fully explain the profound abnormalities of thought, affect, or relatedness that help define SCZ. A parsimonious explanation of the varied and multiple presentations of SCZ should involve the whole brain. White matter abnormalities have been implicated in varied psychopathological processes such as positive symptoms (Hubl et al., 2004; Skelly et al., 2008), tardive dyskinesia (Bai et al., 2009), negative symptoms (Szeszko et al., 2008), deficit syndrome (Rowland et al., 2009), lack of insight (Antonius et al., 2011), and cognition (Szeszko et al., 2008). Our results, in agreement with results from other investigations (e.g., Kanaan et al., 2009; Skelly et al., 2008), suggest that white matter change is diffuse, consistent with multiple psychopathological abnormalities. Nonetheless, the relationship between FA and specific symptoms may be complex, as several studies have shown that while FA is diffusely lower in patients compared with controls, symptom severity correlates positively with FA (Camchong et al., 2011; Cheung et al., 2011), and FA abnormalities may reflect a dysregulated developmental trajectory with changes based on the age of disease onset and the duration of illness (Douaud et al., 2009).
White matter disruption may serve as a useful biomarker in studies of SCZ, as it can be readily measured during life, examined in postmortem cases, and modeled in culture and animal systems, and it has de facto validity as a factor in brain function. Of particular importance, FA appears to be heritable in SCZ, with high correlations in monozygotic-affected twins and heritability in unaffected relatives (Camchong et al., 2009). SNPs in ERBB4 (Konrad et al., 2009), NEUREGULIN1 (McIntosh et al., 2008; Winterer et al., 2008), and DISC1 (Hashimoto et al., 2006) have been associated with decreased FA in healthy controls. It is possible that a focus on FA values of 0.25 to 0.5 will improve the sensitivity and reproducibility of these types of analyses. Viral infections in the developing mouse change myelination-associated genes and FA (Fatemi et al., 2009) and gene-environment interactions may influence FA (Chiang et al., 2011), thus providing another avenue for approaching the neurobiology of white matter in SCZ.
Conclusion
Our results, using methods that take advantage of voxel-based atlas methods while minimizing the distortion of individual anatomy, demonstrate widespread changes in white matter integrity in SCZ. By compartmentalizing FA into discrete bins, reflecting different types of white matter structure, we demonstrate that the abnormality most prominently affects white matter tracts characterized by low-to-moderate FA (0.25 to 0.5). The neurobiological basis for this specificity remains an important question. Together with analyses using other approaches (Kanaan et al., 2009), our findings emphasize that future exploration of white matter abnormalities in SCZ should include a careful examination of specific classes of white matter and their underlying microstructure.
Footnotes
Acknowledgments
This publication was made possible by grant support from NIH-NCRR P41-RR15241, R21AG033774, P50AG005146, K23MH070554, and T32MH15330, and by the Hatten S. Yoder III Memorial Fellowship. The contents of this article are solely the responsibility of the authors and do not necessarily represent the official view of NCRR or NIH.
Author Disclosure Statement
The equipment used in the study is manufactured by Philips. Dr. van Zijl is a paid lecturer for Philips Healthcare and also the inventor of technology that is licensed to Philips. This arrangement has been approved by Johns Hopkins University in accordance with its conflict of interest policies.
References
Supplementary Material
Please find the following supplemental material available below.
For Open Access articles published under a Creative Commons License, all supplemental material carries the same license as the article it is associated with.
For non-Open Access articles published, all supplemental material carries a non-exclusive license, and permission requests for re-use of supplemental material or any part of supplemental material shall be sent directly to the copyright owner as specified in the copyright notice associated with the article.