
Abstract
In the present study, we characterized within- and cross-frequency power correlations from magnetoencephalography (MEG) data in order to understand how different brain regions cooperate as a network to maintain working memory representations with several features. The working memory items were composed of spatially arranged dots supposedly requiring both the dorsal and the ventral stream to be engaged during maintenance. Using a beamforming technique, we localized memory-dependent sources in the alpha, beta, and gamma bands. After the single-trial power values were extracted from these frequency bands with respect to each source, we calculated the correlations within- and cross-frequency bands. The following general picture emerged: gamma power in right superior temporal gyrus (STG) during working memory maintenance was correlated with numerous other sources in the alpha band in prefrontal, parietal, and posterior regions. In addition, the power correlations within the alpha band showed correlations across posterior-parietal-frontal regions. From these findings, we suggest that the STG dominated by gamma activity serves as a hub region for the network nodes responsible for the retention of the stimulus used in this study, which is likely to depend on both the “where-” and the “what-” visual system simultaneously. The present study demonstrates how oscillatory dynamics reflecting the interaction between cortical areas can be investigated by means of cross-frequency power correlations in source space. This methodological framework could be of general utility when studying functional network properties of the working brain.
Introduction
D
During the delay periods in working memory tasks, both the active maintenance of the representation of an immediately experienced event and the suppression of processing of interfering events may be required (Jensen and Mazaheri, 2010; Klimesch et al., 2010). This engagement and suppression of various regions has been suggested to be reflected in different frequency bands of oscillatory brain activity. This is supported by converging evidence from recent electroencephalography (EEG) and magnetoencephalography (MEG) studies on working memory, reporting that oscillatory power increases or decreases in a specific frequency band such as theta (4–7 Hz), alpha (8–13 Hz), beta (13–30 Hz), or gamma (>30 Hz) (Jensen et al., 2007; Jokisch and Jensen, 2007; Khader et al., 2010; Palva et al., 2010; Payne and Kounios, 2009; Snyder and Foxe, 2010).
More generally, considerable studies, including attention, memory, language, and motor paradigms, reported that activity in the alpha frequency seems to reflect active inhibition or disengagement of task-irrelevant brain regions (Jokisch and Jensen, 2007; Klimesch et al., 2007; Rihs et al., 2007; Snyder and Foxe, 2010; Weisz et al., 2011; Worden et al., 2000) whereas gamma frequency reflects active processing (Crone et al., 2006; Jerbi et al., 2009; Kaiser and Lutzenberger, 2005; Womelsdorf and Fries, 2007). To achieve optimal performance, these oscillatory activities might form neuronal groups that undergo coherent rhythmic fluctuations that produce neuronal communication within and between regions (Fries, 2005). Especially high-frequency activity such as gamma band oscillation has been suggested to be involved in fundamental computational mechanisms for fast and flexible information exchange among distributed neuronal assemblies (Fries et al., 2007).
Recent advances in source localization techniques of human electrophysiological data have provided sophisticated ways of mapping sources of event-related spectral power changes, particularly in MEG studies (Gross et al., 2001; Sekihara et al., 2002; Singh et al., 2003). These methods promise better insight into the functional neuroanatomy of oscillatory sources allowing for a more complete understanding of their functional meaning.
In addition, there is a growing body of evidence from electrophysiological studies demonstrating functional interactions, such as phase synchronization (Fries, 2005) and cross-frequency interactions—for example, phase to power (Canolty et al., 2006; Cohen et al., 2009) or phase to phase (Palva et al., 2010)—reflect the communication between regions. Another measure of cross-frequency interactions is power-to-power correlation calculated over trials as we have applied in this study. This approach has been proposed by Bruns et al. (2000) and has later been used to identify task-dependent modulations in power correlations over trials to assess functional connectivity in various paradigms (de Lange et al., 2008; de Pasquale et al., 2010; Mazaheri et al., 2009). When using this measure, the correlation in power between neuronal sources is assessed over trials and task-dependent changes are identified (Friston, 1994). This makes the measures quite related to the psychophysiological interaction index as applied to fMRI/BOLD data (Friston et al., 1997). The measure of power-to-power correlations has the strong advantage that it allows to identify functional connectivity between oscillatory activities in different frequency bands (e.g., alpha and gamma bands).
In this study, we were interested in elucidating the neural network underlying working memory maintenance during a delay period by investigating oscillatory power modulations. Since brain oscillations are modulated by certain cognitive processes, their dynamics will reflect functional modulations of neural networks underlying retention of task-relevant information. To characterize the neural network during the delay period, we used a measure of functional connectivity based on power-to-power correlations within- and cross-frequency bands especially in source space. Source-level connectivity analysis can reduce the concerns of field spread resulting in false cross-talk between sensors (Schoffelen and Gross, 2009). In addition, it allows us to investigate the interplay between anatomically defined cortical regions that will facilitate the interpretation of functional interaction between oscillatory activities.
Aiming to characterize the neural network involved in the delay period of visuospatial working memory, we focused on the alpha, beta, and gamma frequency bands since they have been shown in previous studies to be involved in working memory retention (Jokisch and Jensen, 2007; Pesonen et al., 2007).
Here, we used a very simple and well-known standard working memory paradigm. This made possible to have a relatively large number of trials and thus a high signal-to-noise ratio allowing us to identify the memory effects in relevant regions. Therefore, during the working memory maintenance of this paradigm, we assumed that complex mental processes such as working memory retention as well as the anticipation of upcoming stimuli, motor preparation, and suppression of task-irrelevant areas are integrated in a network.
Also, we deliberately used stimuli with several features supposedly requiring the dorsal and the ventral streams to be engaged simultaneously since the objects that we confront in our everyday lives do not have isolated feature-based characteristics. Rather, they are a mixture of several features, including color, shape, or motion. When we perceive and encode such objects, it will provoke the activation of several brain regions working as a network depending on the mixture of features. Specifically, previous articles reported the interaction between the dorsal and the ventral streams in object recognition based on the several studies (Farivar, 2009; James et al., 2002). Thus, we hypothesized that during the delay period that requires maintenance of information consisting of a mixture of several features, there would be interactions between cortical areas, and especially with hub regions responsible for feature integration.
Materials and Methods
Participants
Eighteen healthy, right-handed volunteers participated in this study. However, seven participants who showed accuracy in the working memory task lower than 80% (n=3), or datasets with excessive superconducting quantum interference device (SQUID) artifacts (n=4) were excluded. Thus, data from 11 adults (men: 6; women: 5; mean age: 24.1±2.3 years old) were included in the study. They had no previous history of neurological or developmental disorders. Written informed consent was obtained from all participants.
Experimental paradigm
The working memory task employed in this study was the same visuospatial DMS task used by Ciesielski et al. (2005). Each trial is composed of a fixation, encoding, delay, and recognition interval (Fig. 1). During the encoding interval, participants had to remember a sample stimulus consisting of a 3×3 white-line matrix presented on a black background for 200 ms. For each stimulus, two of the cells were pseudorandomly made white (see Fig. 1) (Ciesielski et al., 2005). After the offset of the sample stimulus, followed a delay period that was varied in duration (2500 to 3500 ms: mean 3000 ms) in order to prevent participants from anticipating the onset of the probe. After the delay period, a probe stimulus was presented for 200 ms and followed by a 1500 ms inter-trial interval. As probe stimulus, two matrices were simultaneously presented, side by side (separated by 0.4°). The participants had to choose the matrix that matched the sample by pressing either the left or the right button of a response box with the left or the right index finger, respectively. Trials for which the response occurred earlier than 100 ms after the probe stimulus onset were counted as incorrect responses for the behavioral analysis. The participants were instructed to respond as accurate and fast as possible. Before the experiment, they underwent training sessions in order to be familiar with the timing of the paradigm.

Visuospatial delayed-match-to-sample task. Participants performed 340 trials in two sessions. Each trial is composed of fixation, encoding, delay, and recognition stages. After the short stimulus presentation (200 ms), participants had to maintain the stimulus during the delay period (mean 3000 ms), and then followed the recognition test (200 ms). The trials were separated by a 1500-ms inter-trial interval (ITI).
Three hundred forty trials were presented in two separate sessions (170 trials per session). Subjects were seated in a comfortable chair in a dark, shielded room. The stimuli were presented on a back-projection screen positioned 1.5 m in front of the subject. Each matrix subtended only a 1.3°×1.3° visual angle in order to minimize horizontal eye movements.
MEG data acquisition
Data were sampled at 600 Hz (after low-pass filtering at 200 Hz) using a whole-head MEG Neuromag (VectorView™; Elekta Neuromag Oy, Helsinki, Finland) acquisition system, which consists of 306 sensors arranged in triplets of two planar gradiometers and one magnetometer. Eletrooculographic (EOG) electrodes were placed near the outer canthus and beneath the left eye for subsequent exclusion of eye movement and blink artifacts. Before entering the magnetically shielded room, head position indicator (HPI) coils were sparsely attached on the head of each participant. The coils and anatomical landmarks (the nasion and bilateral preauricular points) were spatially identified by 3D digitizer (FASTRAK™; Polhemus, Colchester, VT). The head position in the MEG device was registered by localizing HPI coils. This allowed for the MEG signals to be superimposed on individual T1-weighted magnetic resonance (MR) (1.5T Philips) images with high accuracy. After the data recording, a Maxwell filter, that is, signal space separation, which separates brain-related and external inference signals, was applied (Taulu and Simola, 2006). Also a powerline notch filter at 60 Hz was used to remove line noise before data analysis. The following analyses were performed using data from gradiometer sensors. After identifying MEG artifacts, trials contaminated with eye movements, eye blinks, and excessive jumps were rejected.
Spectral analysis
Time-frequency representations (TFRs) of power were calculated using the complex demodulation algorithm implemented in Brain Electrical Source Analysis (BESA) 5.2 (MEGIS Software GmbH, Gräfelfing, Germany) (Hoechstetter et al., 2004; Papp and Ktonas, 1977). This method uses a multiplication of the time-domain signal with a complex periodic exponential function with a given frequency and a low-pass filter that is a finite impulse response filter of Gaussian shape in the time domain. For more details, please see Hoechstetter et al. (2004).
To identify the spectral changes during the delay period of the visuospatial working memory task, the power increase or decrease relative to the baseline period (−1000 to 0 ms before the sample stimulus onset)—that is, event-related synchronization (ERS) or event-related desynchronization (ERD)—was calculated in each individual and then averaged across subjects. The power values were calculated for the gradiometers (2 to 60 Hz) with a 50 ms time resolution and 1 Hz frequency resolution. We used the same time and frequency resolution for all frequency bands in order to obtain reliable results when estimating the cross-frequency correlations between different frequency bands.
The statistical significance of the spectral power changes was assessed between the delay and the baseline periods using a nonparametric cluster-level randomization approach in order to control for Type-I error rate. This approach effectively controls for multiple comparisons over sensors (Maris and Oostenveld, 2007) and is implemented in the FieldTrip toolbox (Donders Institute for Brain, Cognition and Behaviour, Centre for Cognitive Neuroimaging, Nijmegen, The Netherlands,
Source analysis using beamformer
To identify the sources responsible for induced changes in cortical oscillatory power, we applied a beamforming algorithm also used in other studies of oscillatory brain activity (Gross et al., 2001). It was carried out using the multiple source beamformer (MSBF) function implemented in BESA. MSBF is a modified version of the linearly constrained, minimum-variance vector beamformer applied in the frequency domain just like the dynamic imaging of coherent sources technique (Gross et al., 2001). It allows for identifying the sources of the oscillatory activity in the frequency domain during the delay period (1500 to 2500 ms after the sample stimulus onset) relative to a baseline interval (−1000 to 0 ms). To obtain reliable source estimates, we used the same duration (1000 ms) for delay period and the baseline period (1000 ms). The analyses for each subject were performed on the Talairach and Tournoux (1988) coordinate-transformed individual MRIs using BESA and BrainVoyager QX 1.9 (Brain Innovation B.V., Maastricht, The Netherlands) interface. With these individual beamforming images, we performed nonparametric permutation testing using SnPM3 toolbox (
We then defined regions of interests (ROIs), that is, locations of the maxima in the beamformer images to be able to quantify within- and cross-frequency power correlations in source space. When we selected the ROIs, we applied a conservative criterion (p<0.005; corrected for multiple comparisons, >100 voxels) to ensure an accurate correlation measure. This yielded 17 ROIs when considering all three frequency bands.
Power correlations within- and cross-frequency bands in source space
We performed the power correlation analysis within- and cross-frequency bands in source space. Similar to a virtual electrode approach (Hoechstetter et al., 2004) using the beamformer filters, we used the coordinates of the local maxima for each ROI to derive the single-trial power values during the delay (1500 to 2500 ms after the sample stimulus onset) and baseline (−1000 to 0 ms before the sample stimulus onset) periods. Then, the power values were averaged over time within each period. This was performed for the single trials within each individual. Using these power values, the Pearson's correlation coefficients were calculated for every pair of sources for the delay and baseline periods. The correlation coefficients were transformed to z-values using Fisher's r-to-z transformation. Using the z-values, we performed a nonparametric permutation testing over subjects between delay and baseline periods for the group-level significance. The identified connections between the 17 sources were not directly corrected for multiple comparisons with respect to the possible pairings. This could in principle be done using a Bonferroni correction; however, this approach would be very conservative. As an alternative, we focused the interpretation on the “hub type” of sources, that is, sources with more than three connections to other regions. This approach will strongly reduce the chance of false positives in terms of connections. The analysis was performed using Matlab toolbox 7.0.4 (MathWorks, Natick, MA).
Results
Behavioral results
The total number of trials per subject was 340. The average number of correct, incorrect, and missed trials across subjects were 314, 11, and 15, respectively. The average accuracy was therefore 92.2%±6.5% (mean±SD) while the proportion of incorrect trials was just 3.2% and the proportion of missed trials was 4.5%. The mean reaction time was 593.1±73.0 ms. In the postexperiment interview, the participants reported that they missed some trials because of the fast speed of stimulus presentation even though they actually remembered the sample. Further, at the stage of EOG artifact rejection in the MEG analysis, incorrect trials were more likely excluded because these trials were especially susceptible to EOG components. For these reasons, correct, incorrect, and missed trials were included in the analysis and we do not expect incorrect trials to have contributed to the results. In short, most subjects performed the task close ceiling.
The sources of the dominant power changes during retention
In the grand average of the spectral analysis, we examined the dominant oscillatory power increases or decreases in the following frequency bands: alpha (8–13 Hz), beta (16–24 Hz), and gamma (40–50 Hz). Figure 2A shows the TFRs of power modulations from 2 to 30 Hz for five sensor groups relative to the baseline. Note the sustained increase in the alpha and beta bands 500 ms after the sample stimulus onset being dominant over posterior regions. Interestingly, the beta activity is decreased over central regions. The 0- to 1000-ms part of the TFR is dominated by event-related fields that are likely to explain the 2 to 5 Hz power increase and shorter suppression of alpha and beta band power. Thus, we chose to focus on the 1500- to 2500-ms window in order to isolate maintenance-related activity. The similar representation for the gamma band activity reveals an increase in posterior sensors and a central decrease (Fig. 2B).
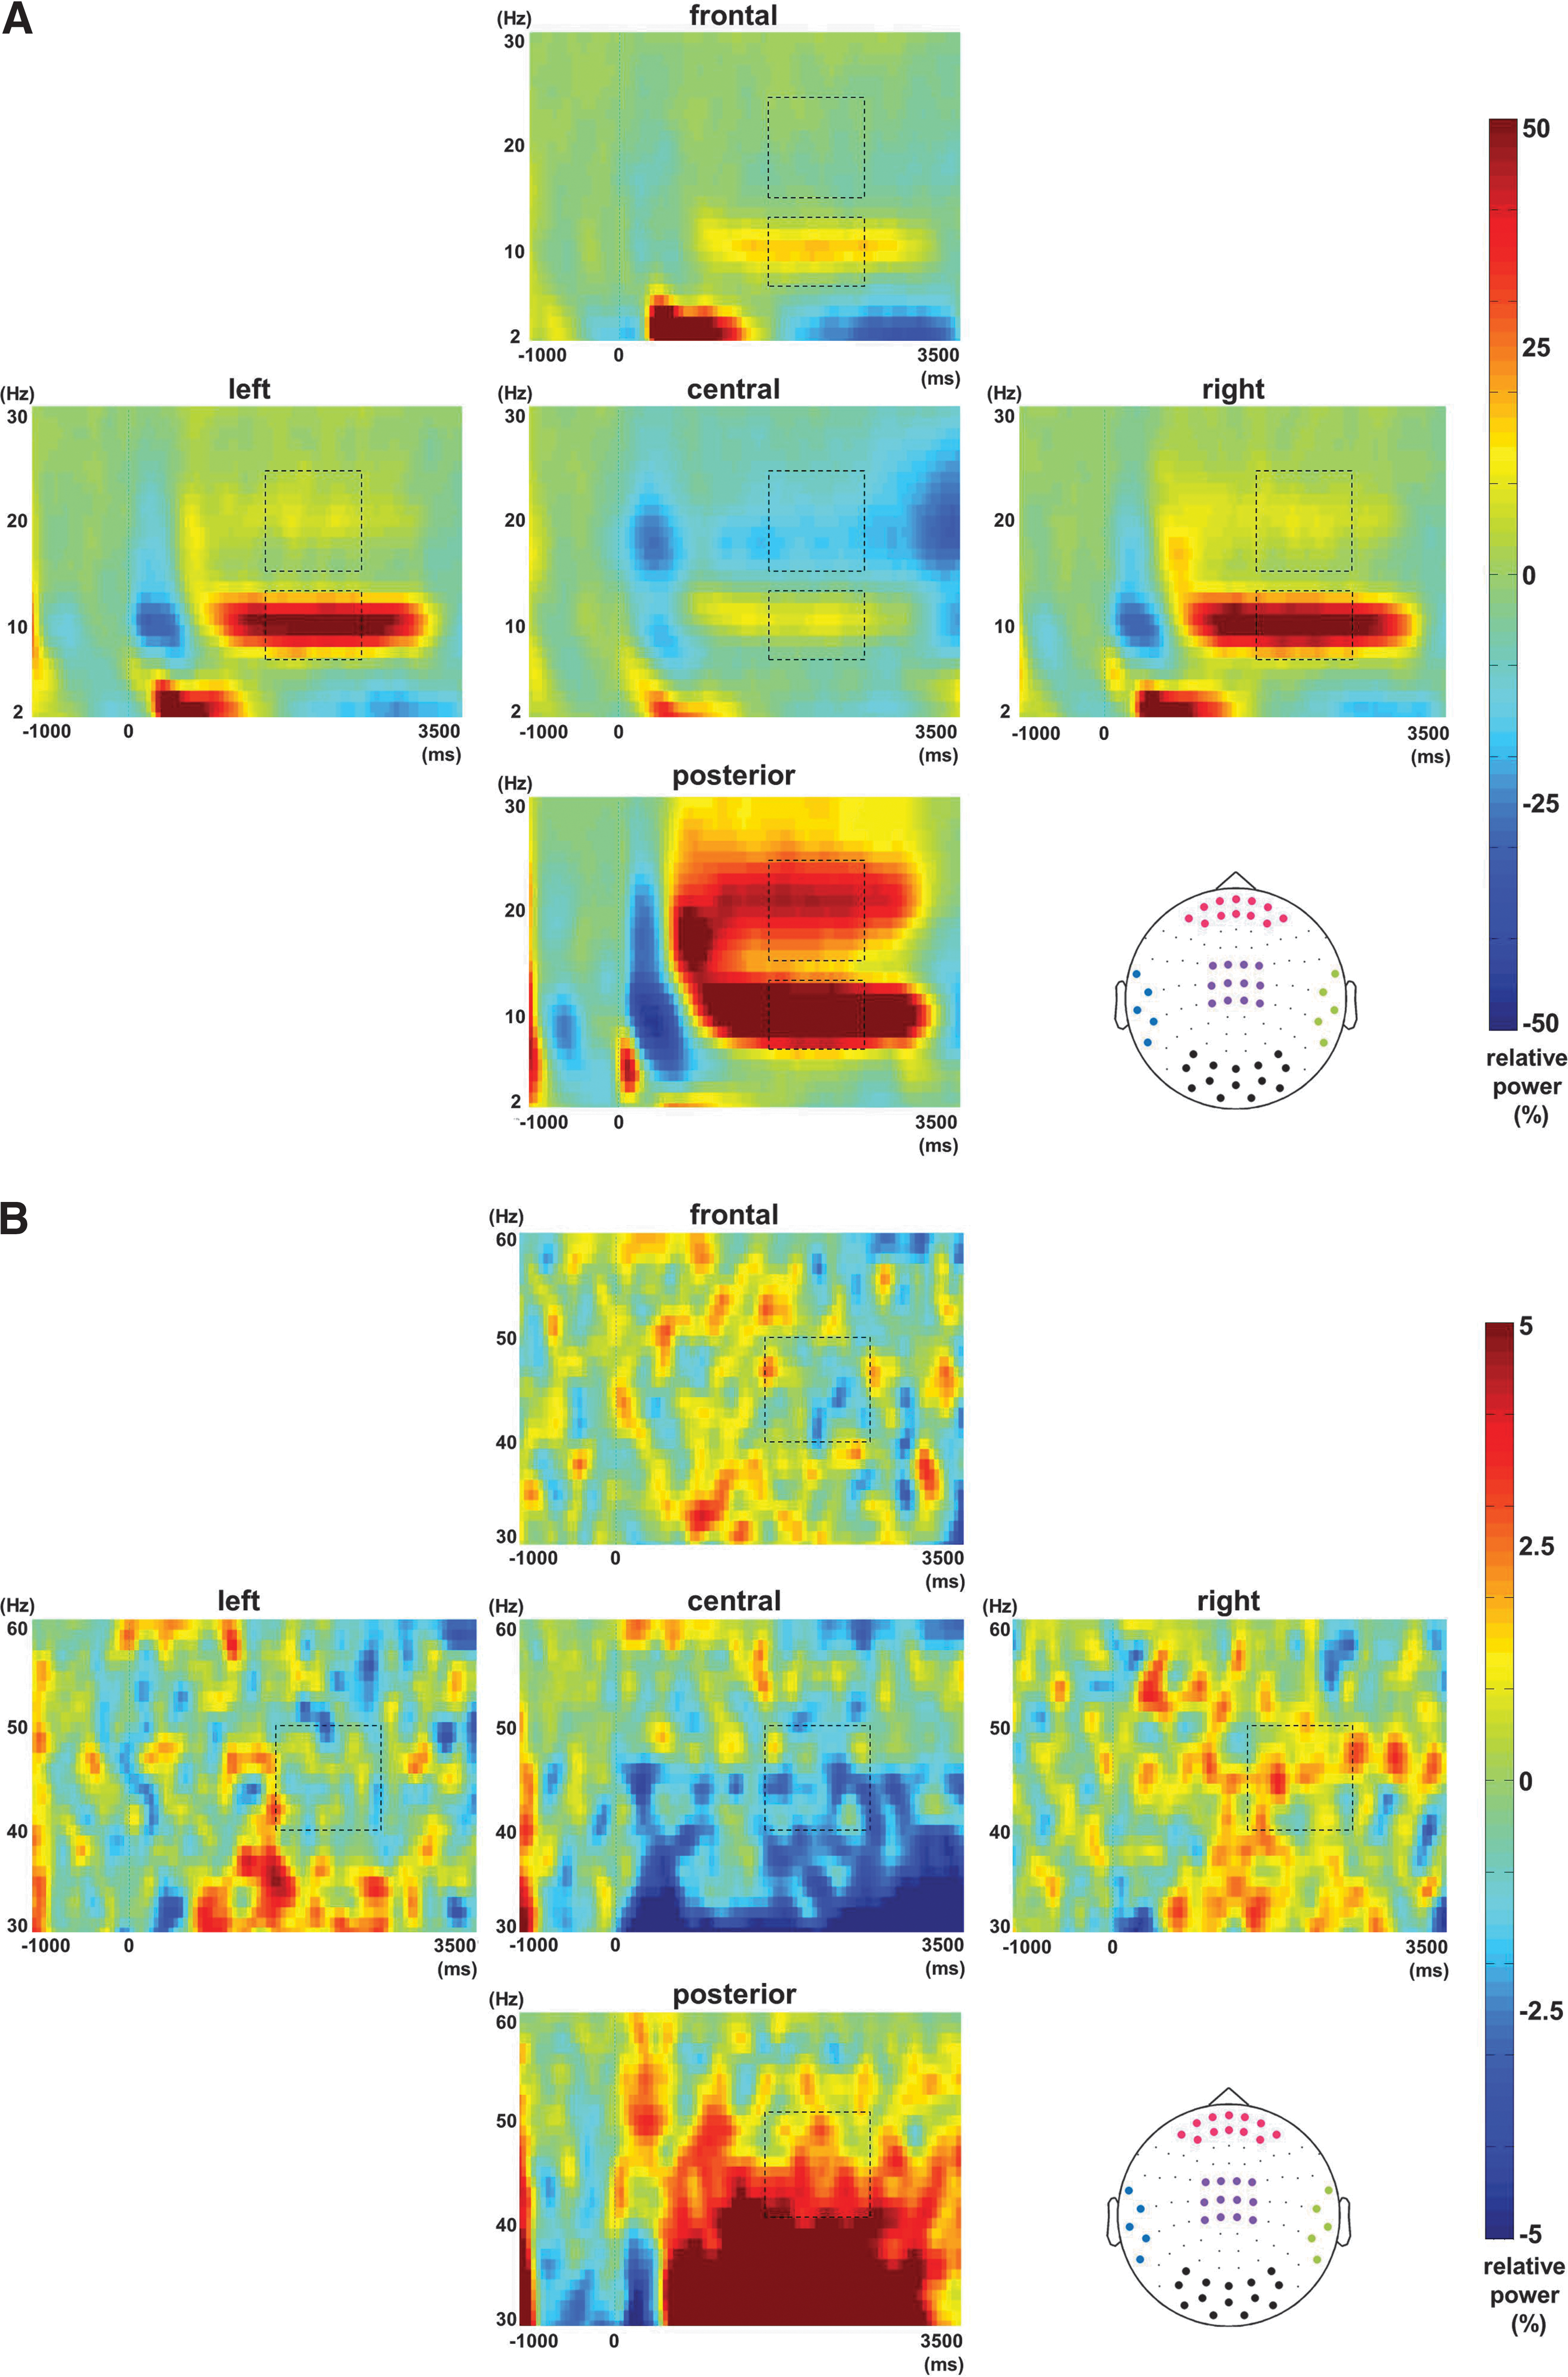
Grand average of time-frequency representations (TFRs). Relative power increases or decreases with respect to a baseline (−1000 to 0 ms before the sample stimulus onset) are displayed. x and y axes denote time (all experimental stages: fixation, encoding, delay, and recognition) and frequency, respectively.
Statistically significant power changes (1500 to 2500 ms after the sample stimulus onset) with respect to the baseline (−1000 to 0 ms before the sample stimulus onset) were assessed using a cluster-level randomization routine (see the Materials and Methods section) and the results are shown in Figure 3. During the delay period, alpha power increased over posterior regions, including parieto-occipital, temporal, and frontal areas. Over frontal and temporal areas, the power increase was right side dominated (Fig. 3A). Beta power increased over posterior regions, however, decreased over central areas (Fig. 3B). As for gamma power, there were increases over posterior and right temporal regions and decreases over left temporal and central areas (Fig. 3C).

Topographies of power in each frequency band during the delay period (1500 to 2500 ms after the sample stimulus onset) relative to the baseline interval (−1000 to 0 ms before the sample stimulus onset).
The beamforming technique allowed us to localize the sources responsible for these power modulations in each frequency band in individual subjects. These individual source reconstructions were morphed to a standard brain and tested using group-level statistics applying a nonparametric permutation approach (Chau et al., 2004; Nichols and Holmes, 2002; Singh et al., 2003) (see the Materials and Methods section for details; Fig. 4). Among the sources for each frequency band, we identified 17 sources as ROIs (p<0.005; corrected for multiple comparisons, >100 voxels). For the alpha band, nine sources were identified: bilateral cerebellum (Cb) extending into occipital cortex, right middle frontal gyrus (MFG), bilateral superior frontal gyri (SFG), right superior temporal gyrus (STG), right inferior parietal lobule (IPL), right middle temporal gyrus (MTG), and left precentral gyrus (PrCG). The alpha band sources all reflected increases of power (ERS). For the beta band, the bilateral fusiform gyri (FG) showed power increases whereas the right cingulate gyrus (CG), left IPL, and right precuneus (PCu) showed decreases. For the gamma band, three sources were identified: right STG, right lingual gyrus (LG), and left postcentral gyrus (PoCG). The left PoCG had a power decrease and the other sources showed increases. These 17 ROIs are also shown in Table 1. While the beta power in left and right FG increases were combined in one cluster for the left FG, they became two independent clusters for higher thresholds (p<0.001; corrected for multiple comparisons). Topographies of power (Fig. 3) and source reconstruction of oscillatory power activities (Fig. 4) were nicely matched for all frequency bands. Due to the caveats of source modeling, the exact location of the identified regions should be interpreted with caution; however, it is clear from the analysis that numerous brain regions dominated by oscillatory activity in different frequency ranges are robustly modulated by working memory maintenance of complex material.

Source reconstruction of power changes associated with working memory maintenance. A beamforming technique was applied to reconstruct the brain regions responsible for generating the power of each frequency band shown in Figure 3.
We defined 17 sources from alpha, beta, and gamma band activities (nonparametric permutation testing, p<0.005; corrected for multiple comparisons, >100 voxels). We confirmed that the right FG was an independent cluster at the higher threshold (p<0.001; corrected for multiple comparisons). These sources were used for the analysis of within- and cross-frequency power correlations in source space.
L, left; R, right; Cb, cerebellum; CG, cingulate gyrus; FG, fusiform gyrus; IPL, inferior parietal lobule; LG, lingual gyrus; MFG, middle frontal gyrus; MTG, middle temporal gyrus; PCu, precuneus; PoCG, postcentral gyrus; PrCG, precentral gyrus; SFG, superior frontal gyrus; STG, superior temporal gyrus; ERS, event-related synchronization; ERD, event-related desynchronization; BA, Brodmann area.
Within- and cross-frequency power correlation between sources
Subsequently, we calculated the power-to-power correlations between the ROIs and their respective frequency bands. The statistically significant within- and cross-frequency correlations when comparing the delay to the baseline intervals are shown in Figure 5 (also see Table 2). From Figure 4, it is clear that dominant sources were associated with power increases. Further, the functional meaning of the power increases, in particular, in the alpha and gamma bands can be interpreted in the light of the existing literature (see Discussion). Thus, we focused the connectivity analysis on the positive correlations between the identified sources. The color of marker denotes frequency bands that were responsible for the sources (green: alpha; cyan: beta; magenta: gamma). Within-frequency correlations are marked by green lines and cross-frequency correlations by red lines. While this analysis yielded a complex picture, some general findings stood out. Several regions had multiple connections to other sources (three or more). To reduce the chance of false positives, we focused the interpretation on these regions. In particular, we found that the gamma source in the right STG (BA42/22) had numerous connections with other frequency bands. It is correlated with alpha power in left Cb, right STG, left PrCG, and right SFG and beta power in left FG (Fig. 5). Alpha band sources showed the most prominent within-frequency correlation results (the green lines between green markers). For example, bilateral Cb was correlated with right MFG and right IPL. Also, left Cb had correlation with right STG (BA22) (Fig. 5). It should be noted that while the very posterior alpha sources did have a focus in Cb, they extended to occipital cortex. Indeed these within-frequency correlations were abundant although not as statistically significant as the cross-frequency correlations related with the right STG gamma source.

Within- and cross-frequency power correlations in source space. The statistical significance testing was conducted using nonparametric permutation testing applying the z-values that were transformed from the correlation coefficients for within- and cross-frequency power correlations in source space (delay versus baseline intervals; p<0.05). Among the 17 sources, the sources that showed significant within- or cross-frequency power correlations are plotted. The color of markers denotes frequency band that was responsible for the sources (green: alpha; cyan: beta; magenta: gamma band). Within-frequency power correlations are depicted with the green lines between markers of the same color (found between alpha band sources only) while cross-frequency power correlations are depicted with the red lines between markers of different colors. Left: horizontal view; Right: back view (Right hemisphere is on the right). Cb, cerebellum; FG, fusiform gyrus; IPL, inferior parietal lobule; LG, lingual gyrus; MFG, middle frontal gyrus; MTG, middle temporal gyrus; PrCG, precentral gyrus; SFG, superior frontal gyrus; STG, superior temporal gyrus.
Within- and cross-frequency power correlations in source space shown in Figure 5 are displayed according to each region of interest (ROI).
L, left; R, right.
Discussion
In this study, we have identified a network involved in the maintenance of visuospatial working memory by means of oscillatory power correlations at source level. This provides new insight into the oscillatory neuronal dynamics related to working memory process, especially retention of information. Using beamforming and nonparametric permutation techniques, we identified sources with significant power modulations in the alpha (8–13 Hz), beta (16–24 Hz), and gamma (40–50 Hz) bands. Using power-to-power correlations, we observed within- and cross-frequency correlations across posterior, frontal, and temporal cortices. While alpha band sources showed the most prominent within-frequency correlations, gamma band sources had correlations with sources in other frequency bands. Especially, gamma power increase in the right STG had numerous connections and is thus likely to serve as a hub region when complex material has to be maintained.
In the statistical analysis of correlations, we did not perform a Bonferroni correction to correct for multiple comparisons. This approach would be quite conservative producing false negatives. Rather, we focused the interpretation on sources with three or more connections in order to reduce the likelihood of false positives. Also, since we compared the delay and the baseline periods, but not other memory conditions, the interpretation of the results might not purely attributable to memory process, but rather to combined complex processes occurring during the delay period, such as motor preparation, anticipation of upcoming stimuli, and suppression of task-irrelevant regions. Thus, our results should be interpreted with these limitations in mind.
Right STG dominated by gamma band activity serves as a hub region when spatial- and object-based information is maintained
Simultaneous processing in both the “where-” (dorsal stream) and “what-” (ventral stream) visual system might be needed to perform the visuospatial working memory task used in this study, even though the task was to remember the spatial locations of white dots. As shown in Figure 1, the stimulus was actually “an object” (i.e., a square) composed of different constellations of white dots. Further, the size of the stimulus was very small and sufficiently inside one's visual field (1.3°×1.3° visual angle) to be perceived as an object. Therefore, the subjects could remember the stimulus as an object defined by the spatial locations of the dots within a square. On top of that, an object with the same pattern was presented repeatedly with fairly small portion of difference, that is, spatial positions of white dots. It should have aroused perceptual priming that induced different viewpoints because we are able to perceive objects from different viewpoints (James et al., 2002). This notion was confirmed by the postexperiment interview where most participants reported that they memorized the stimulus as spatially arranged dots as well as a unitary object. Thus, maintaining the spatial configuration of the stimulus may require both the dorsal and the ventral streams. In the study of Ciesielski et al. (2011) using a similar, but more sophisticated paradigm, they also mentioned that this type of task requires both the dorsal frontoparietal and the ventral frontotemporal pathways. Especially, a previous article reported dorsal-ventral integration in object recognition based on the numerous findings (Farivar, 2009). The author mentioned that dorsal regions do encode certain aspects of the objects, including shape, size, and orientation, even though dorsal and ventral streams may make different use of the information. Thus, we assumed that interaction between the dorsal and the ventral streams would occur to maintain the stimulus used in this study.
It has been reported that right STG plays crucial role in spatial awareness, visual search, and spatial perception (Ellison et al., 2004; Gharabaghi et al., 2006; Karnath, 2001; Karnath et al., 2001). In particular, Karnath (2001) suggested that right superior temporal cortex mediates spatial awareness and exploration while left superior temporal cortex subserves language function. Based on spatial neglect patients and electrophysiological studies, it has been established that the STG receives polysensory inputs from both dorsal and ventral streams, indicating that this region serves to integrate both space- and object-related information (Felleman and Van Essen, 1991; Jones and Powell, 1970; Seltzer and Pandya, 1978; Vaina et al., 2001). Also, the findings that the superior temporal cortex receives afferent inputs from the inferior temporal cortex, parietal cortex, and intraparietal sulcus and projects to frontal cortex (Karnath, 2001) are consistent with our findings, demonstrating that the STG is coupled to several cortical regions.
Though we identified both alpha (BA22) and gamma (BA42/22) power increases in the right STG during maintenance, the gamma band source had more connections. Especially, the regions that showed a correlation with the gamma power in the right STG were characterized by activity in lower frequency bands, that is, alpha and beta bands. This supports the notion that regions with high frequency activity can modulate regions dominated by lower frequency activities (Bruns and Eckhorn, 2004; de Lange et al., 2008) and that, in particular, gamma band activity plays an important role in neuronal communication (Fries et al., 2007; Jensen et al., 2007).
In sum, we suggest that the neuronal dynamics in the STG dominated by gamma band activity allow this area to serve as a hub that functionally links other relevant regions during active maintenance of complex working memory representations. In future work, it would be very interesting to investigate whether causality measures can provide insight into directional interactions of the power-to-power correlations.
As Snyder and Foxe (2010) pointed out, if the task stimulus is not purely feature based such as color or motion, then there will be a strong tendency to integrate several features of stimulus as one because the perceptual system is biased to attend to an object as a whole, that is, feature binding (Molholm et al., 2007; Treisman, 2004). For example, in our study, people memorized the sample stimulus as an object and also used a spatial strategy. Therefore, in the study using stimulus that is not purely feature based, we suggest that the functional interaction between the dorsal and the ventral streams should be considered. Further, in this case, we can assume that gamma activity in the right STG plays a significant role in integration of several features.
Functional connectivity between alpha band sources during working memory maintenance
Posterior activity in the alpha band
During the delay period in this simple DMS task, alpha power increases were found in parieto-occipital areas, right frontotemporal areas, and bilateral Cb extending into occipital cortex. Alpha power increases in parieto-occipital regions during the delay period of working memory task are consistent with previous findings (Jokisch and Jensen, 2007). The function of the alpha power increases has by many been suggested to reflect active inhibition or disengagement of task-irrelevant cortical areas across modalities (Jokisch and Jensen, 2007; Klimesch et al., 2007; Snyder and Foxe, 2010; Weisz et al., 2011) while alpha power decreases reflect active information processing or anticipation of upcoming task at hand (Klimesch et al., 2007; Pfurtscheller and Klimesch, 1991). However, alpha activity has by others been proposed to reflect active neuronal processing (Palva and Palva, 2007).
We also identified alpha band sources in the Cb. It has been debated how reliably cerebellar activity can be detected with scalp EEG or MEG since the neurons in the Cb are arranged in a “closed field” configuration (Dalal, 2007; Ito, 1984). While both MEG sensor configuration and currently available head models for source reconstruction are not optimized for identifying cerebellar activities, there are several MEG studies reporting cerebellar sources (Dalal, 2007; Dalal et al., 2008; Diedrichsen et al., 2005; Gross et al., 2002; Ivry, 2000; Kujala et al., 2007; Pollok et al., 2007; Stam, 2006; Tesche and Karhu, 2000). The Cb sources that we identified did extend into occipital cortex. Given the proximity of the Cb and occipital cortex in the light of the spatial resolution of the beamforming technique, it is difficult to state how much of the activity should be assigned to the Cb versus the occipital cortex. With these limitations in mind, we examined the connectivity patterns between Cb and frontal (right MFG) or parietal (right IPL) areas. The left Cb showed a stronger alpha power increase and also more connections with beta activity in left FG and alpha/gamma activity in the right STG. This makes it possible that cerebellar alpha activity and its connectivity patterns are distinct in both terms of laterality and the neocortical alpha sources. However, the exact functional role of the cerebellar alpha oscillations and how they functionally differ from the occipital alpha sources remain to be uncovered in the future research.
Frontal activity in the alpha band
In addition, we found alpha power increases in right MFG (BA9) and bilateral SFG (BA9/10), which to the best of our knowledge have not been reported in the previous studies [but see (Allen and Cohen, 2010; Grimault et al., 2009; Mazaheri et al., 2011; Palva et al., 2010; Yordanova et al., 1998)]. We suggest that alpha activity in frontal areas might reflect functional inhibition of task-irrelevant interference given that functional inhibition orchestrated by prefrontal cortex is generally involved in executive control. For instance, prefrontal cortex might cooperate with sensory regions in order to suppress upcoming interferences, that is, through a sensory gating mechanism. Shimamura (2000) especially focused on the role of prefrontal cortex as a “dynamic filtering” mechanism. According to the dynamic filtering theory, prefrontal cortex is involved in both the engagement and the active inhibition of posterior cortical areas. Thus, our findings are consistent with the notion that filtering or gating of sensory information by inhibitory control mechanisms is orchestrated by prefrontal cortex (Postle, 2005; Shimamura, 2000).
However, several neuroimaging and electrophysiological studies of human and nonhuman primates have investigated the dorsolateral prefrontal cortex and suggested that activity in this area constitutes the neural substrates of working memory maintenance (Courtney et al., 1998; McCarthy et al., 1996). Therefore, as an alternative to the alpha inhibition hypothesis, the alpha power increase in prefrontal cortices that we observed might be interpreted as the neural constituent of maintenance-related activity (Palva et al., 2010). To conclusively determine the functional role of the frontal alpha activity, we need to perform more detailed task, for example, investigating load effect on task-relevant versus task-irrelevant regions.
Distributed alpha band sources
Power increases in the alpha band were observed in several brain regions. There is good evidence that alpha activity is produced by several sources rather than just a single posterior generator or one widespread general source (Palva et al., 2010). For instance, it has been demonstrated that the topography of the posterior alpha activity changes systematically with direction of covert attention (Rihs et al., 2007). This phenomenon can only be explained by several discrete alpha sources. There is also support for frontal alpha sources observed in various tasks (Allen and Cohen, 2010; Grimault et al., 2009; Mazaheri et al., 2011; Palva et al., 2010; Yordanova et al., 1998). When considering the distribution of alpha power in the current study, it is also clear that several sources must be involved in producing the observed distribution (Fig. 3A). Indeed, the within correlations in the alpha band appeared to be quite long range and thus cannot be explained by spurious effects stemming from one source.
Beta band activity and its connectivity during working memory maintenance
Mainly two lines of accumulated evidences on beta oscillation have been formed in the literature. The first one is on its role in motor control, especially in relation to functional inhibition (Hari and Salmelin, 1997), and more recently, in cognitive process such as feature processing, representation of contents of working memory, and integrative function such as decision making (Donner and Siegel, 2011; Pesonen et al., 2007). However, the functional role of beta oscillation is the least understood one at present [see (Donner and Siegel, 2011; Engel and Fries, 2010)].
We found beta power increases in bilateral FG (BA19) and decreases in right CG (BA23), PCu, and left IPL (BA40) (Table 1). Beta power in left FG was correlated with alpha power in left Cb and right MFG and gamma power in right STG, while beta power in right FG was correlated with alpha power in right MTG and gamma power in right LG (Table 2).
Recently, in the review article on beta band oscillation (Engel and Fries, 2010), it was proposed that beta oscillation might be reflecting status quo. Specifically, they hypothesized that the beta activity or correlations are expressed more strongly when the maintenance of the status quo is intended or predicted compared with when a change is expected. According to this view, one would predict that beta activity is also associated with working memory maintenance, which is about preserving a representation in time. The beta activity that we observed could be also interpreted to reflect endogenous top-down processes rather than exogenous bottom-up process (Engel and Fries, 2010), which is relevant for the delay period in working memory tasks.
Conclusion
A certain cognitive function is not associated with a single frequency band, but rather multiple frequency bands are likely to be involved across broad cortical areas (Engel and Fries, 2010; Jensen and Colgin, 2007; Schroeder et al., 2010). Further, optimal performance in various cognitive tasks needs both enhancement and suppression of certain oscillation in task-relevant and -irrelevant regions, respectively (Jensen and Mazaheri, 2010). Thus, there are good reasons to study the brain as a network by considering cross-frequency interactions between regions.
In the present study, we have observed functional connectivity in source space by means of within- and cross-frequency power-to-power correlations during the delay period of visuospatial working memory. This revealed a network in which various regions are functionally coupled in order to maintain complex working memory information. This demonstrates that power-to-power correlation between different frequency bands is a useful tool for revealing how the working brain is shaped as a network in order to perform cognitive processing. To obtain more precise insights when considering the brain as a network, we need to expand our efforts to include causal connectivity measures. These measures provide causal influences of certain region on another and their plausible relationship revealed by feedback loop.
Footnotes
Acknowledgments
This research was supported by a grant (M103KV010016-08K2201-01610) from Brain Research Center of the 21st Century Frontier Research Program funded by the Ministry of Science and Technology, the Republic of Korea, and a grant No. R31-2008-000-10103-0 from the WCU project of the MEST and the NRF. This research has been performed as a collaborative research project of project No. C11007 (Study for Building and Service Implementation of Future Cyber-Infrastructure Resources environment) and supported by the Korea Institute of Science and Technology Information (KISTI).
Author Disclosure Statement
The authors have no commercial associations that might create a conflict of interest in connection with this article.