
Abstract
Endocannabinoid receptors modulate synaptic plasticity in the brain and may therefore impact cortical connectivity not only during development but also in response to substance abuse in later life. Such alterations may not be evident in volumetric measures utilized in brain imaging, but could affect the local and global organization of brain networks. To test this hypothesis, we used a novel computational approach to estimate network measures of structural brain connectivity derived from diffusion tensor imaging (DTI) and white matter tractography. Twelve adult cannabis (CB) users and 13 healthy subjects were evaluated using a graph theoretic analysis of both global and local brain network properties. Structural brain networks in both CB subjects and controls exhibited robust small-world network attributes in both groups. However, CB subjects showed significantly decreased global network efficiency and significantly increased clustering coefficients (degree to which nodes tend to cluster around individual nodes). CB subjects also exhibited altered patterns of local network organization in the cingulate region. Among all subjects, schizotypal and impulsive personality characteristics correlated with global efficiency but not with the clustering coefficient. Our data indicate that structural brain networks in CB subjects are less efficiently integrated and exhibit altered regional connectivity. These differences in network properties may reflect physiological processes secondary to substance abuse-induced synaptic plasticity, or differences in brain organization that increase vulnerability to substance use.
Introduction
C
Neuroimaging methods have been used to examine functional and structural changes in the human brain associated with acute or chronic CB use. These studies are highly heterogeneous with respect to imaging methods and sample characteristics and focus on regional rather than network effects with few findings being replicated across labs. Recent reviews have, nevertheless, identified some consistent functional findings. Acute administration of CB or THC has been associated with increased resting state cerebral blood flow (CBF) in prefrontal cortex and anterior cingulate cortex (ACC) using single-photon emission tomography and positron emission tomography (Chang and Chronicle, 2007; Martin-Santos et al., 2010). In chronic CB users, however, resting prefrontal and ACC blood flow is reduced. Because of the great variety of cognitive tasks utilized in different fMRI studies, comparison across studies is difficult, although several tentative findings have emerged. Task-related activation is often associated with increased activation, either intensity or volume of activation, perhaps indicative of reduced efficiency of processing (Martin-Santos et al., 2010). On the other hand, decreased task-evoked activation has been observed in frontal and temporal regions (O'Leary et al., 2000, 2002), the Cb (O'Leary et al., 2003; Smith et al., 2004), and the hippocampus (Hp) (Jacobsen et al., 2004). No consistent gray matter structural findings have been observed across labs (Martin-Santos et al., 2010). Only a small number of diffusion tensor imaging (DTI) studies examining CB users have been reported and they found mixed results. For example, Gruber and Yurgelun-Todd (2005) initially found no differences in fractional anisotropy (FA) in frontal regions or the corpus callosum, but did find reduced left frontal FA in a second study (Gruber et al., 2011). Arnone et al. (2008) found increased mean diffusivity (MD) in the prefrontal region of the corpus callosum, with no change in FA. Ashtari et al. (2009) found reduced FA in heavy CB users in regions, including the posterior internal capsule, and middle and superior temporal gyrus, sometimes coupled with increased trace values and decrease axial diffusivity.
Studies to date have focused on regional differences or global measures of brain activation. CB1 retrograde signaling appears to play a major role in synaptic plasticity and learning across the lifespan (Harkany et al., 2008). This suggests that connectivity among brain regions may be especially sensitive to either endogenous variations in CB1 function or distribution, or chronic CB use. Until recently, noninvasive methods evaluating brain connectivity among discrete brain regions were not available. One promising approach to this problem uses graph theory to probe the organization of brain networks (for review, see Bullmore and Sporns, 2009). Graph theory models the brain as a network that consists of distributed regions (nodes) and their connections (edges). The development of techniques to delineate and quantify white matter structure through fiber tractography offers the possibility of generating a complete connection map (or connectome) as a human brain network (Sporns et al., 2005). Since the cognitive and behavioral dysfunctions requiring integrative processing among brain regions are affected by acute CB intoxication, it is possible that the connectivity among distributed regions in a brain network may also be especially sensitive to chronic CB use, and could be captured by measures of network properties.
In this study, fiber tractography and graph theoretic analysis were used to compare network properties in CB users and healthy controls and to test whether the measures sensitive to CB use are correlated with the personality measures associated with substance use. To this end, fiber tractography and graph theoretic analysis were used to investigate changes in the topological organization of structural networks in CB users compared to healthy controls.
Materials and Methods
Participants
Twelve adult (all men; mean age=19.33±0.98 years; 11 right-handed and one ambidextrous) heavy CB users with no current diagnosis of alcohol abuse or other illicit substance abuse or dependence, or previous neuropsychiatric history, and 13 healthy, CB-naïve right-handed volunteers (all men; mean age=21.62±3.84 years) participated in this study. Subjects were recruited using local newspaper advertisements and posted announcements. After providing a complete description of the study to all participants, written and verbal informed consent was obtained. The research protocol was approved by the Indiana University–Purdue University Indianapolis Human Subjects Review Committee. All participants were compensated $10/h. The American National Adult Reading Test (ANART) (Strauss et al., 2006) was used to assess reading performance. The Perceptual Aberration Scale (PAS) (Chapman et al., 1978) and Schizotypal Personality Questionnaire (SPQ) (Raine, 1991) were used to assess schizotypal personality characteristics. The Barratt Impulsiveness Scale (BIS), a widely used self-report assessment of impulsivity (Patton et al., 1995; Stanford et al., 2009), yielded measures of attentional, motor, and nonplanning impulsiveness.
Formal inclusion criteria were the following—(1) For the CB group: current CB consumption at the rate of at least once per week during the past month, no other illicit substance use during the past 3 months, and no Diagnostic and Statistical Manual of Mental Disorders, the 4th-edition (DSM-IV), diagnosis of Axis I or II disorders except CB abuse or dependence; (2) For the control group: no history of illicit substance use and no history of psychiatric illness (Axis I or II); (3) For all participants: age 18 years or older, completion of high school education, and no history of cardiovascular disease, disorders of hearing, neurological disease, learning disability, or head injury resulting in loss of consciousness. As in our previous studies (Fridberg et al., 2010; Skosnik et al., 2006, 2008), participants were excluded if they reported the consumption of more than 21 alcoholic drinks per week during the past month (and no more than five drinks in one single occasion). CB users who reported past use of three or more non-CB illicit substances reported use of an illicit substance other than CB within 3 months before their study participation, or who met criteria for a non-CB-related DSM-IV psychopathology were excluded from the study to minimize the influence of those variables on the results. Subjects in the CB group were required to abstain from CB use for at least 24 h before their participation in the study to eliminate possible acute CB effects during imaging. CB users showed increased SPQ and PAS scores compared to control subjects, indicative of higher levels of schizotypal symptoms. The CB and control groups did not differ in age, education, drinks per week, ANART score, or impulsivity measures. Demographic data are presented in Table 1.
PAS, Perceptual Aberration Scale; SPQ, schizotypal personality questionnaire; ANART, American National Adult Reading Test; BIS, Barrett Impulsivity Scale Factor Score; Imp, impulsivity; N/A, not applicable.
The Structured Clinical Interview for DSM-IV Axis I Disorders (SCID) (First et al., 2002) and a locally developed drug-use questionnaire were used to ascertain current and past diagnoses for substance abuse and dependence, as well as current and past CB consumption patterns. Measures of frequency, quantity, and density of CB consumption were determined via the SCID-I and questionnaire for the past week before the test session as described previously (Fridberg et al., 2010; Skosnik et al., 2006, 2008). Age of first use and total years of use were also determined. Urine screens (Q10-1, Proxam) were administered immediately preceding scanning in order to corroborate self-reports from the drug questionnaire and clinical interview. The Q10-1 kit screens for CB (THC-COOH; 50 ng/mL sensitivity), opiates, amphetamines, cocaine, MDMA (3,4-methylenedioxymethamphetamine: ecstasy), tricyclic antidepressants, phencyclidine, benzodiazepines, methamphetamines, and barbituates.
Imaging data acquisition
All MRI scans were acquired using a Siemens TIM Trio 3.0-T scanner (Erlangen, Germany) with 32-channel head coil. Head motion of the subject was minimized with restraining foam pads provided by the manufacturer. DTI based on single-shot echo-planar imaging consisted of two back-to-back scans for each subject. Each scan had four repetitions, each of which consisted of 20 diffusion-weighted direction volumes and one non-diffusion-weighted volume (T2-weighted reference image) with b-value of 1000 s/mm2, 128×128 imaging matrix with 48 axial slices, field of view 230×230×144 mm, 1.8×1.8×3.0 mm3 voxels, echo time 93 ms, repetition time 6500 ms, and iPAT=2. The DTI scans were 9 min 10 sec each. For segmentation and registration purposes, high-resolution T1-weighted MRI was also acquired using the 3D turbo flash sequence with the following parameters: 256×256 image matrix with 160 slices, 1×1×1 mm3 voxels, echo time 2.67 ms, and repetition time 1800 ms. The duration of this imaging sequence was 5 min 13 sec.
Preprocessing and white matter tractography
Graph theoretic analysis combined with fiber tractography involves five steps: (1) acquisition of diffusion tensor and T1-weighted MRI data; (2) whole-brain parcellation on T1-MRI; (3) regional demarcation of DTI data using spatial transformation of segmented regions of interest (ROI) on T1-MRI; (4) quantitative estimation of axonal trajectories via tractography; and (5) integration of anatomical ROIs from step 3 with tractography data to compute connection weights between selected pairs of ROIs.
Structural MRI data
Each subject's T1-weighted MRI scan was initially processed to determine the extent of brain tissue in each volume with the brain extraction tool of FSL (FMRIB Software Library,
DTI data
Distortion from eddy currents and subject head motion was corrected by registering all diffusion-weighted images (DWI) to non-diffusion-weighted volume (b=0) using 12-parameter affine registration of FSL diffusion toolbox. Since signal loss was found in some DWIs with large diffusion gradients along the read-out direction (i.e., G
x
>0.5; left–right direction of the subject), we eliminated DWIs having a read-out gradient >0.5 after careful visual inspection of the raw DTI volume set. Hence, 10 identical DWIs were used from 20 directions for each subject. To assure the data quality, we evaluated diffusion measures of FA, tracts-based spatial statistics, and network properties, which calculated from subjects with intact 20 directional DTI (n=7) and from those with only 10 artifact-free directions (n=18). (see Supplementary Data available online at
White matter tractography
In each subject's native DTI space, deterministic streamline tractography using the tensorline algorithm (Lazar et al., 2003) were performed with the Diffusion Toolkit (
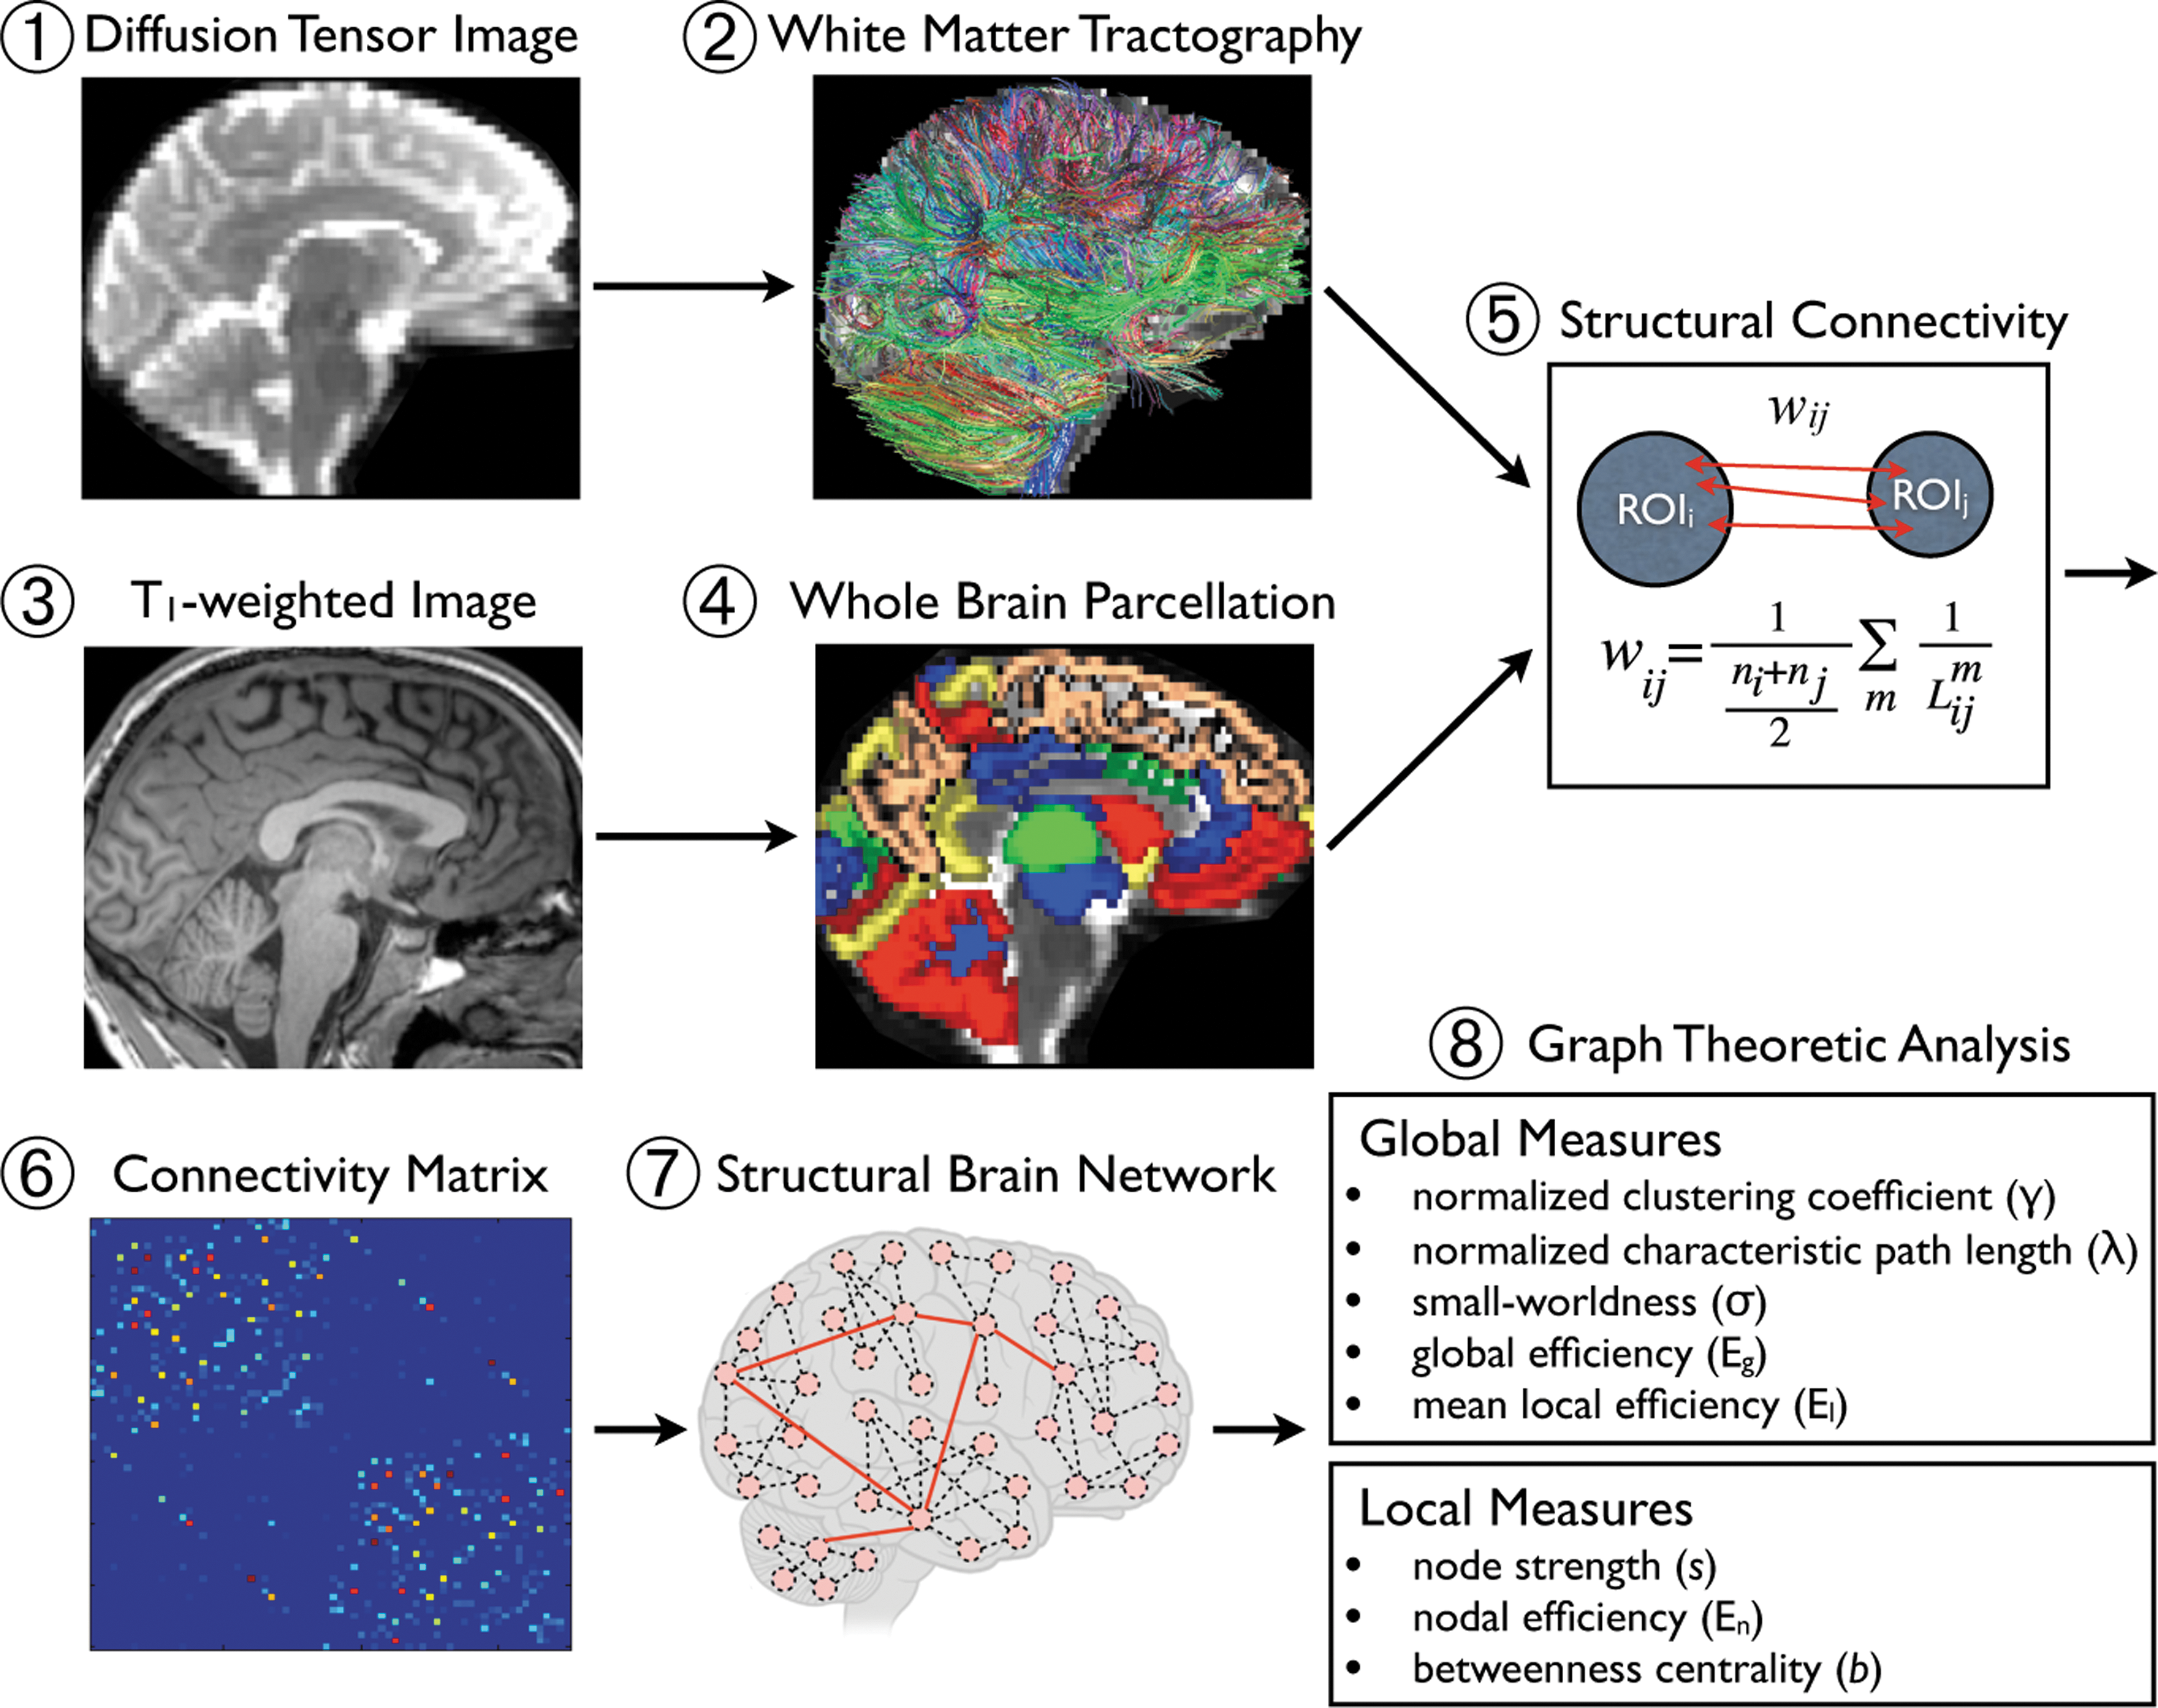
Overview of the network analysis for structural brain connectivity. For each subject, diffusion tensor images
Structural connectivity and network construction
The structural connectivity between two ROIs was defined as a weight reflecting the number and length of fibers that connect the two selected regions from the tractography algorithm as follows:
where
Graph-theoretic characteristics
A small-world network has short edge distances within highly clustered nodes (Rubinov and Sporns, 2010; Watts and Strogatz, 1998). For the structural MRI and DTI in our dataset, nodes and edge distances represent brain regions from FreeSurfer and the structural connectivity defined above, respectively. Here, the small-world properties of brain network were calculated from the weighted connection matrix using Brain Connectivity Toolbox (
Clustering coefficients
This metric provides information about the prevalence of clustered connectivity around a given node (Rubinov and Sporns, 2010), meaning a degree to which nodes tend to cluster around individual nodes. At i-th node, the weighted clustering coefficient (Ci
) was defined by the likelihood that the neighbors of a given node are interconnected with each other (Onnela et al., 2005) as follows:
where k
i
=degree representing the weighted number of links connected to i-th node, N=set of all nodes in the network, and w
ij
=weight between node i and j. The weighted clustering coefficient (C) in a given network can be defined by the mean of clustering coefficients for the all nodes as follows:
Characteristic path length
A shorter path length between brain regions can represent the stronger potential for structural integration (Rubinov and Sporns, 2010). In a given network, the weighted characteristic path length (L) is defined by the average of the shortest path length between a given node and the remaining nodes as follows:
where d
ij
=the shortest path length between nodes i and j, which is defined by
Small-world properties
Since C and L should be compared to appropriately constructed random models that typically preserve the local node structure but randomized global topology (Rubinov and Sporns, 2010), in this study, we generated 100 degree-matched random networks that preserve the connection weights as well as the number of nodes, edges, and degree sequences of individual networks (Maslov and Sneppen, 2002). Then, we computed the normalized clustering coefficient (γ=C/Crandom ) and normalized characteristic path length (λ=L/Lrandom ), where Crandom and Lrandom are calculated by the average of clustering coefficient and characteristic path length from the population of 100 randomized graphs (Humphries and Gurney, 2008; Humphries et al., 2006). Finally, the network small-worldness (the degree to which the network is tightly clustered) was defined by σ=(C/Crandom )/(L/Lrandom )=γ/λ (Humphries and Gurney, 2008).
Measures of network efficiency
The efficiency of a network grossly represents the capacity to exchange information (Latora and Marchiori, 2001, 2003). The global efficiency (Eg
) of a network is defined by the average shortest path length (Latora and Marchiori, 2001; Rubinov and Sporns, 2010) as follows:
The local efficiency (El
) of a network is also defined by the average local efficiencies of each node as follows:
where
Regional characteristics
For examining the regional network characteristics of structural brain networks, we first calculated the node strength (s) for a given node. The strength is a basic and fundamental metric that reflects the importance of nodes in the weighted network (Rubinov and Sporns, 2010) as:
For regional efficiency measurements, we also computed the nodal efficiency (En
) at a given node. This metric represents the importance of a given node to communicate within the network, and would be used to determine the network hubs (Achard and Bullmore, 2007) as:
Finally, we computed the betweenness centrality (b) as the fraction of all shortest paths passing through a given node in the network (Freeman, 1978) as:
where
Structural core regions as hubs
Since currently there is no gold standard for the definition of structural hubs in brain networks, multiple measures of regional centrality were used to identify putative hub nodes. The node strength (s), betweenness centrality (b), and nodal efficiency (En , a measure related to closeness centrality) were calculated to examine the regional characteristics of each brain region in the structural network. Regions with high s, b, and En are candidates for central roles in the communication between any pair of nodes within the brain network (Achard and Bullmore, 2007). In this study, we defined regions as network hubs if the summed ranks of the node strength, betweenness centrality, and nodal efficiency placed the region within the top 20th percentile of nodes (van den Heuvel et al., 2010).
Statistical analysis
Independent two-sample t-tests were performed for the number of connections and mean weights of network matrix for two groups. For global network measures, that is, small-worldness (σ), normalized clustering coefficients (γ), normalized characteristic path length (λ), and global/local efficiency (Eg and El ), analysis of covariance was applied to determine the between-group differences on each network property with age, educations, and drinks/week as covariates. In exploratory regional analysis, analysis of variances was applied to the regional network characteristics (node strength, betweenness centrality, and nodal efficiency) for all 88 brain regions. The relationships between the network measures and demographic, psychometric, and drinking variables were evaluated using Pearson correlation coefficients and partial correlation analysis. A probability level of p<0.05 was used to evaluate statistical significance.
Results
Basic properties of network matrix
The number of connections in the network matrix was significantly decreased in CB subjects (CB: 413.00±17.39, normal healthy control [NC]: 437.23±28.20, p=0.006), while the mean weights exhibited no significant differences between CB and NC groups (CB: 0.152±0.011, NC: 0.147±0.015) as in Figure 2.
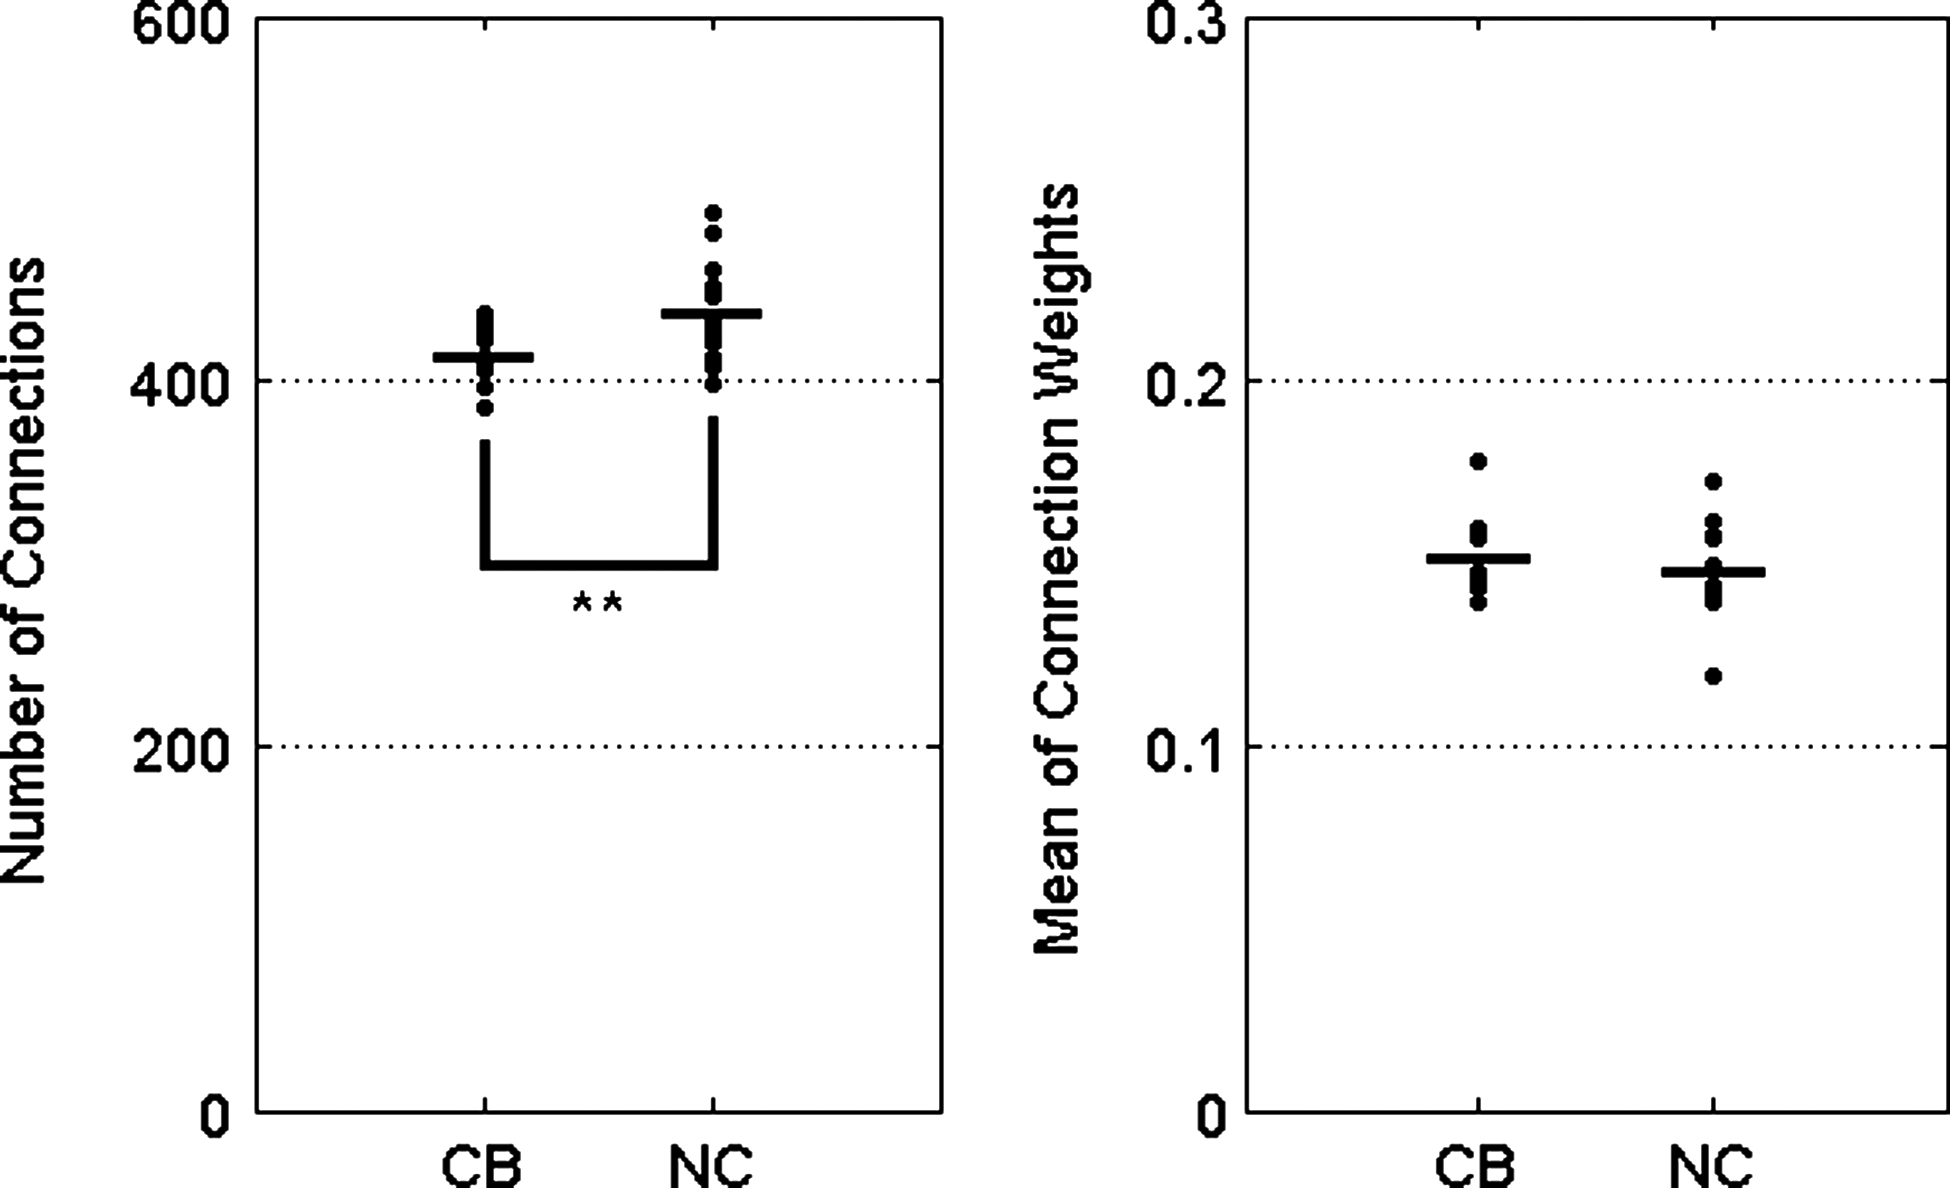
Group comparison for the number of connections and mean weights from matrix of connectivity networks. The number of connections of connectivity matrix was found to be significantly different between CB users and NC (**p<0.01). NC, normal healthy controls.
Overall topology
It has been known that the clustering coefficients of a small-world network are significantly greater than that of a random network (γ >> γrandom), the characteristic path length approximately equivalent to the random network (λ≈λrandom), and the small-worldness of a small-world network is typically greater than one (σ >> 1) (Watts and Strogatz, 1998). In Figure 3, our results showed that the clustering coefficients were about five times larger than those of random networks (γCB=5.472±0.273, γNC=5.107±0.420), and the characteristic shortest path lengths were very similar to those of random networks (λCB=1.125±0.061, λNC=1.091±0.069) for each group. The small-worldness (σ=γ/λ) was also larger than 1 (σCB=4.875±0.306, σNC=4.693±0.410). These results suggest that both CB subjects and NC had prominent small-world properties indicating an intact overall organization of the structural brain network, and consistent with previous findings in both healthy (Hagmann et al., 2007) subjects and individuals with a disorder such as schizophrenia (van den Heuvel et al., 2010) and Alzheimer's Disease (Lo et al., 2010).

Group comparison for the global network measures. Small-worldness (σ), normalized clustering coefficient (γ), normalized characteristic path length (λ), and global (Eg ) and mean local (El ) efficiency. p-values show t-test across groups with CB and NC. Normalized clustering coefficient and global efficiency was found to be significantly different between CB users and NC. *p<0.05, **p<0.01.
CB-related alterations on global measures
The normalized characteristic path length (λ), small-worldness (σ), and local efficiency (El ) exhibited no significant differences between CB and NC groups (all p>0.083) in Figure 3. However, we observed significantly decreased global efficiency (Eg : t=−1.800, p=0.042) and increased normalized clustering coefficients, (γ: t=2.782, p=0.006) in the structural brain networks of CB group. These results imply diminished network efficiency and increased clustering in the structural brain networks of CB subjects, possibly indicative of an increased propensity for structural segregation among groups of regions within the network.
Correlation between network and personality measures
Table 3 shows the correlation coefficients between network measures and demographic, clinical, and psychometric measures in the entire sample. Increased global efficiency was associated with decreased schizotypal symptoms and impulsivity and better reading performance. Figure 4 shows scattergrams and regression lines for Eg and each of the variables. When the correlation between Eg and individual characteristic was examined after partialing out the variance attributed to age, education, and drinks per week, the partial correlation coefficients for Eg and motor impulsivity (partial r=−0.59), PAS (r=−0.48), and ANART (r=0.59) remained significant at p<.05. Within the CB group, global efficiency (Eg ) showed significant (p<0.05) correlations with attentional impulsivity (r=−0.62), motor impulsivity (r=−0.79), nonplanning impulsivity (r=−0.59), and drinks/week (r=−0.65). In the control group, global efficiency only correlated with the ANART reading score (r=0.57, p<0.05).
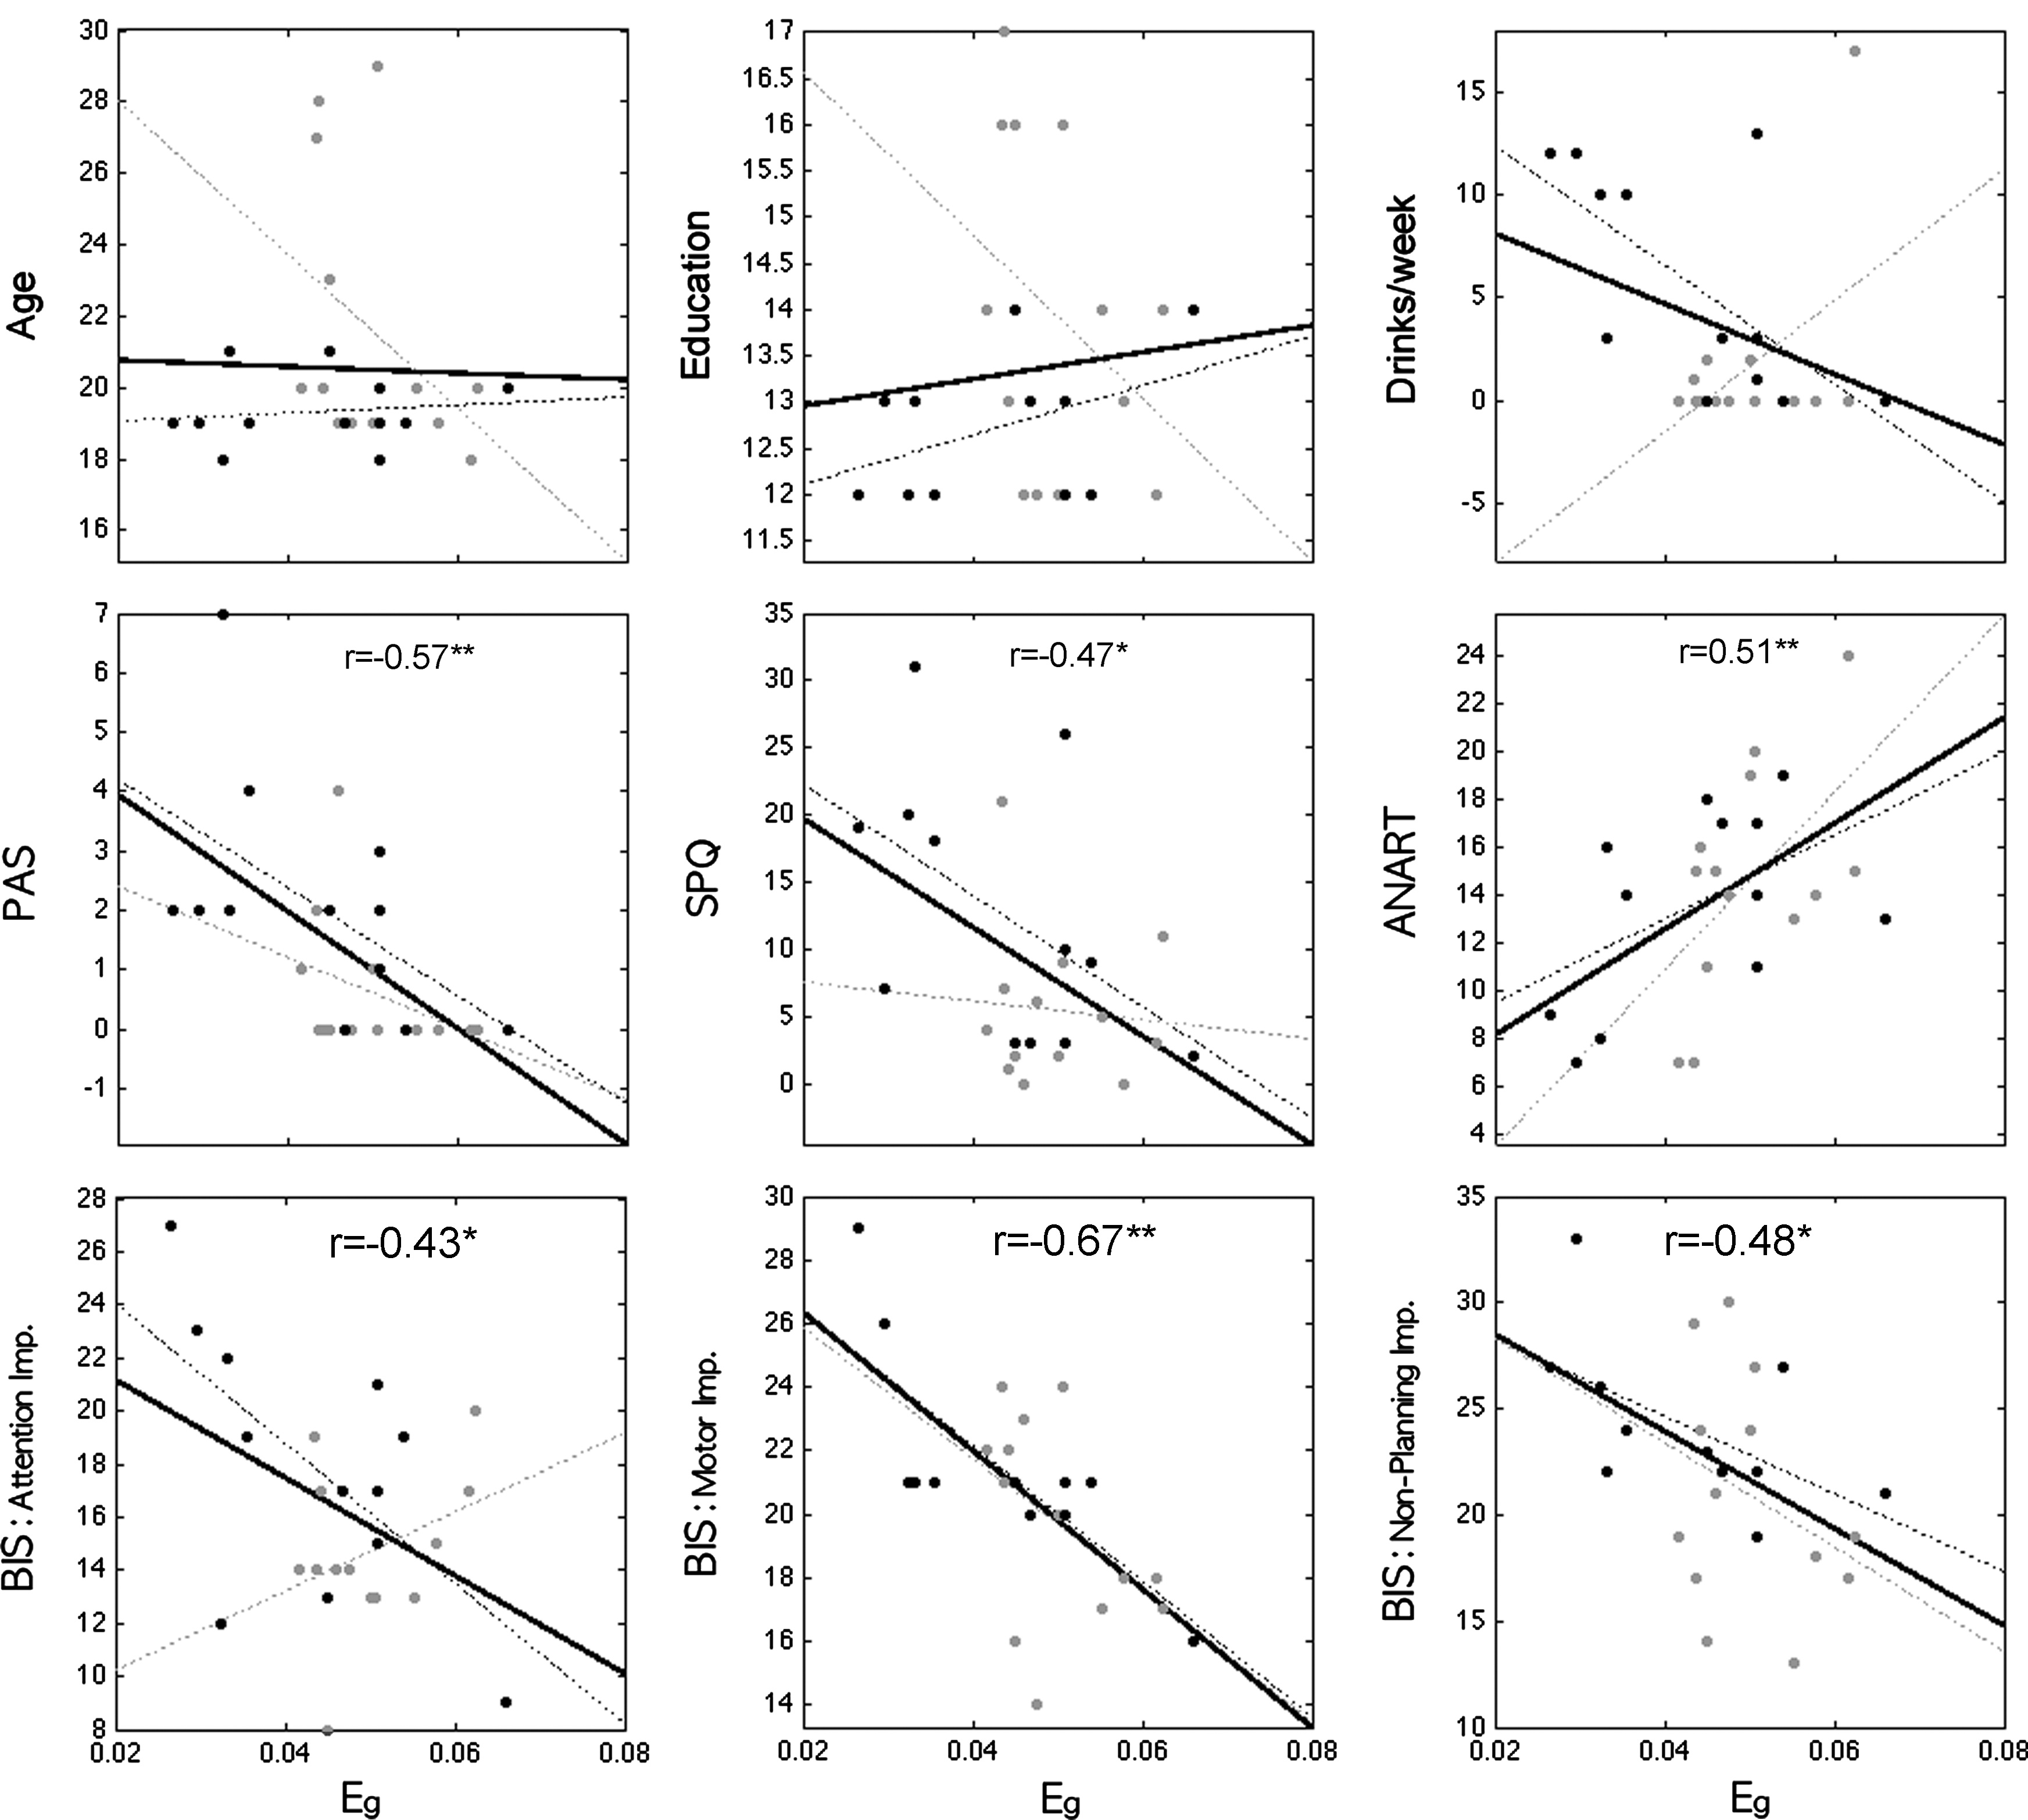
Correlations between global efficiency (Eg ) and demographic/personality/drinking measures. Regression was represented by a thick black line. Black and gray color represents CB users and healthy controls, respectively. Significances were found in PAS, SPQ, ANART, and all BIS impulsivities. *p<0.05, **p<0.01. PAS, Perceptual Aberration Scale; SPQ, schizotypal personality questionnaire; ANART, American National Adult Reading Test; BIS, Barrett Impulsivity Scale Factor Score.
ANART (Strauss et al., 2006).
p<0.05.
p<0.01.
Structural core regions as hubs
We found similar hub regions in each group as shown in Figure 5. In the NC group, eight subcortical regions, including the bilateral putamen (Pu), ventral diencephalon (VDC), Hp, and caudate, were identified as hubs. In addition, cortical regions, including the medial/lateral orbitofrontal cortex, superior frontal cortex (SF), lingual gyrus (LING), precuneus (PCUN), and posterior cingulate cortex, were also found as hubs for the NC group. On the other hand, in the CB group, six subcortical regions, including the bilateral Pu, VDC, right Cb, and right Hp, were identified as hubs. Additionally, medial orbitofrontal cortex, SF cortex, LING, fusiform gyrus, precentral cortex, PCUN, and the isthmus of the cingulate (ISTC) were identified as hubs among the cortical regions of CB group. Four subcortical (Pu, Hp, and VDC) and 6 cortical hub regions (medial orbitofrontal, PCUN, SF, and lingual regions) were shared between the two groups.
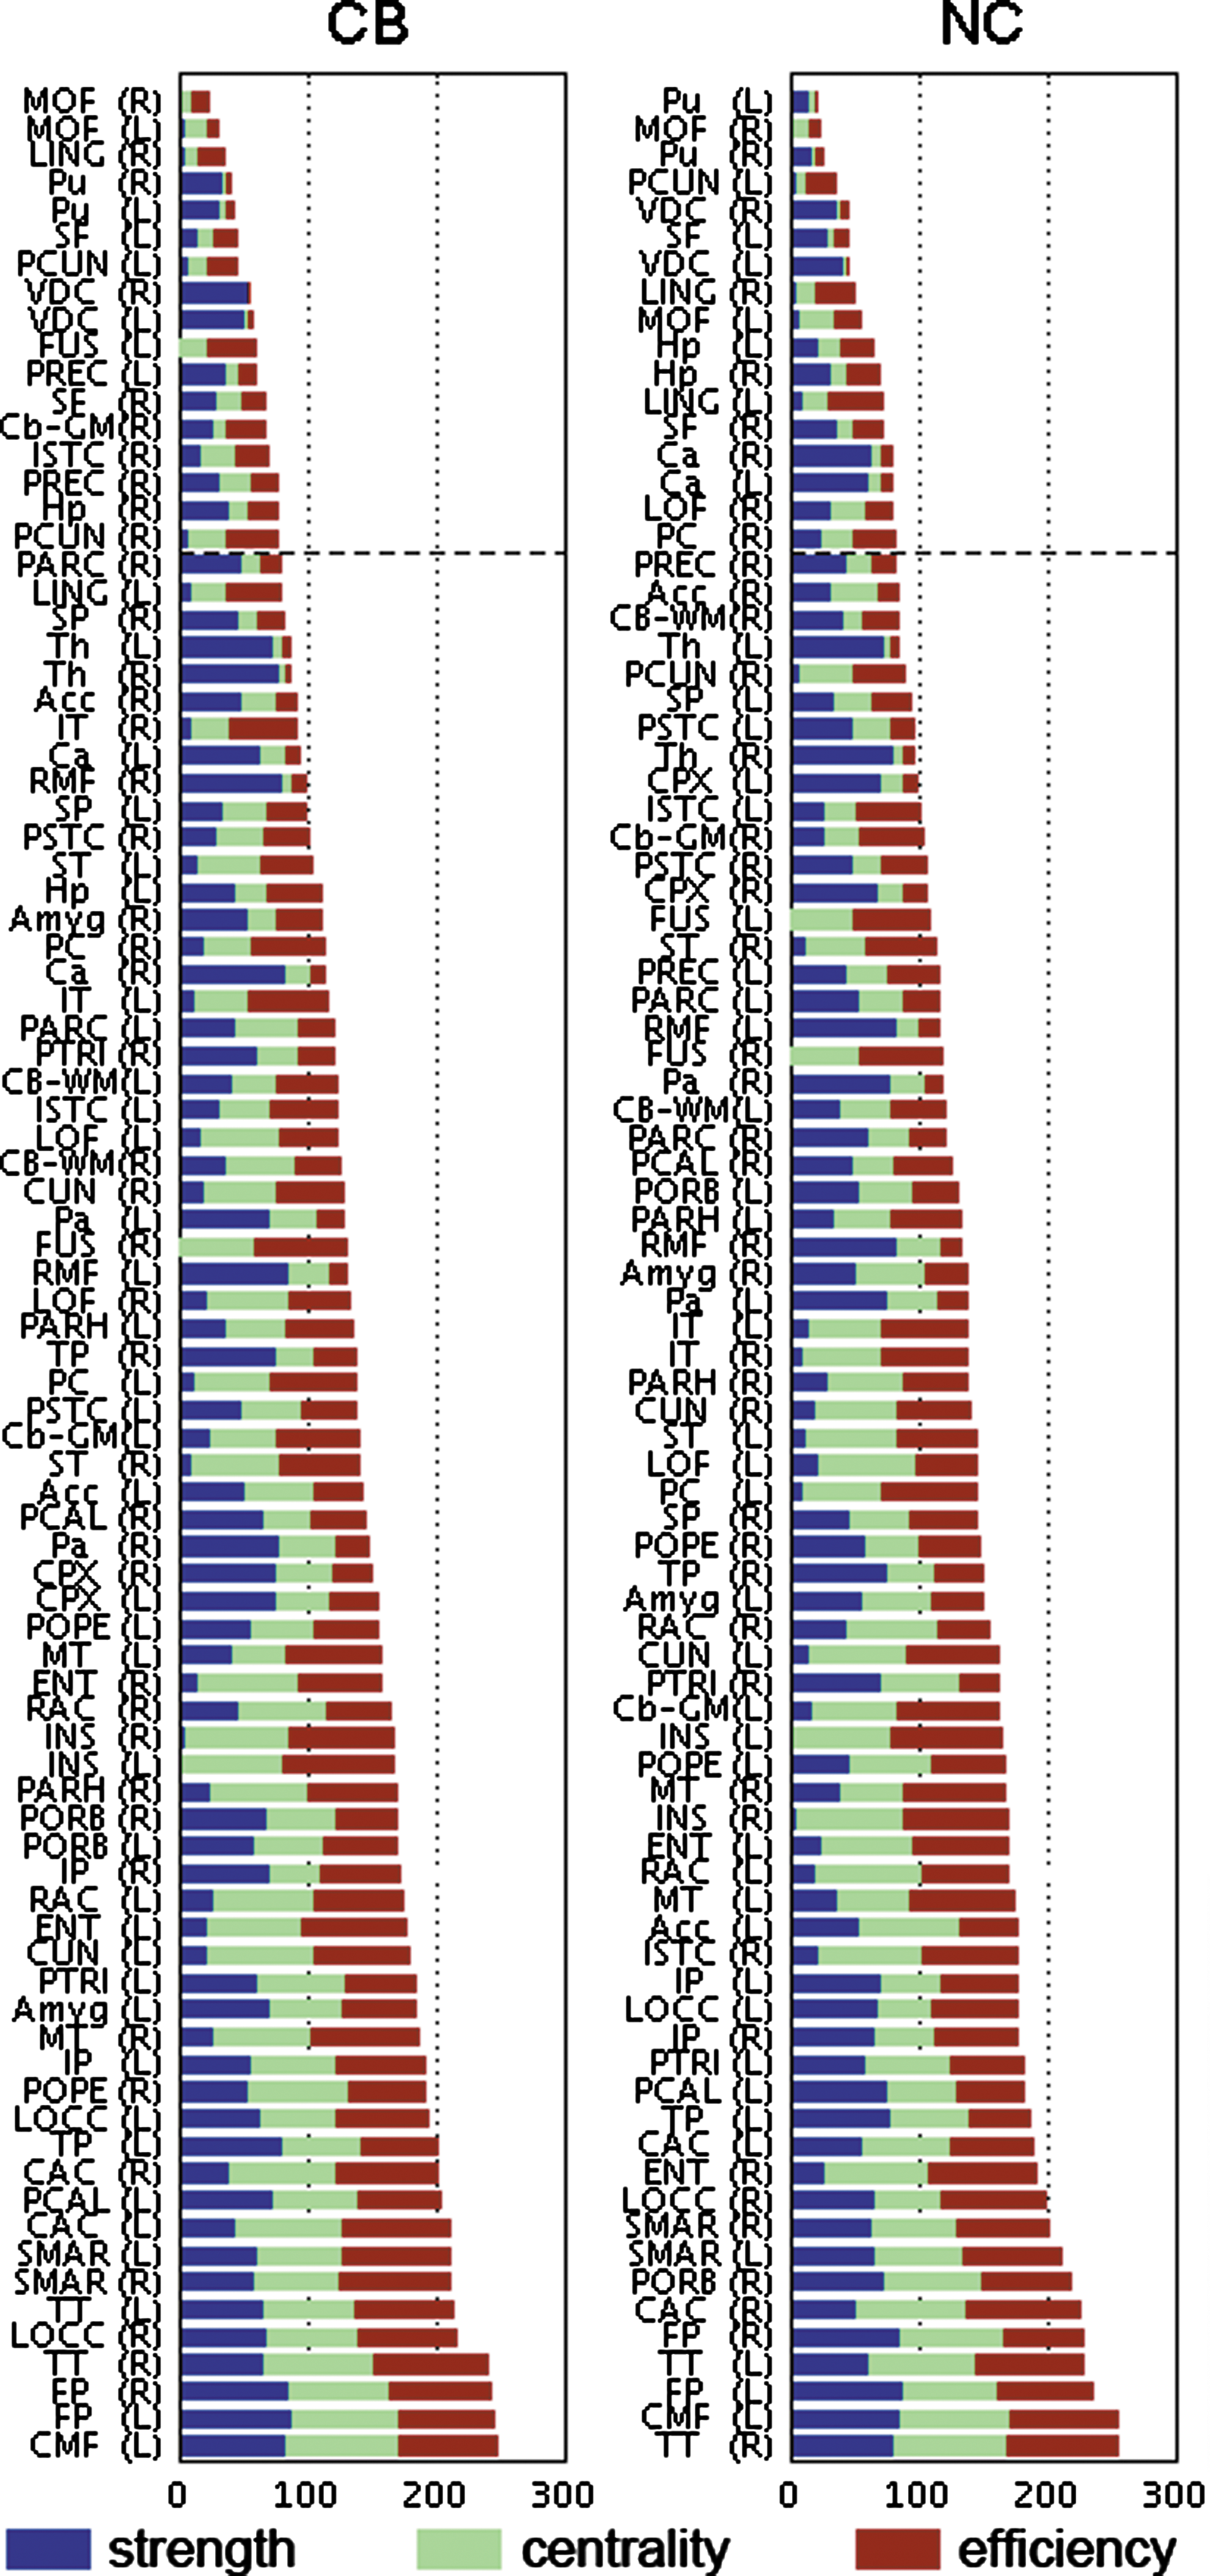
Network hubs with high strength, centrality, and nodal efficiency in CB-using subjects and NC. Dashed line represents the threshold for the hub definition, above which regions belong to the top 20% of sum of network measures. Abbreviations are shown in Table 2.
CB-related alterations on node-specific measures
In CB networks, the increased betweenness centrality was found in the right isthmus of cingulate (p<0.05, FDR corrected). No differences were found for node strength or efficiency.
Discussion
This study applied graph theoretic analysis of anatomical connectivity in CB users and healthy controls based on deterministic white matter fiber tractography. Our main findings were as follows: (1) the brains of both CB subjects and controls exhibited small-world network attributes; (2) CB subjects showed a decreased global efficiency and an increased normalized clustering coefficient, indicative of potentially more segregated but less efficient processing in the CB group; (3) global efficiency was correlated with personality variables related to impulsivity and schizotypy, as well as reading performance; (4) several highly connected network hubs were found in cortical and subcortical regions, with similar distributions observed in both groups; and (5) CB subjects also exhibited a pattern of altered local network organization in the cingulate cortical regions. Taken together, our findings suggest that CB subjects have a less efficiently integrated and more locally segregated structural brain network with altered regional network attributes across some brain regions.
The number of fiber tracts between regions varies with the degree of anisotropy such as FA and MD, and can reveal disease-specific abnormalities in the brain [e.g., autism (Hong et al., 2011) and tumor (Roberts et al., 2005)]. In this study, the number of connections within the network was significantly decreased in CB users, while preserving mean connection weights (Fig. 2). Since previous studies have not found consistent regional alterations in MRI gray matter or DTI measures, these findings suggest that the connectivity between distributed regions in a brain network might be sensitive to chronic CB use.
The present data indicate that small-world network properties are similar across both CB subjects and healthy controls, which extends previous DTI-based network findings in healthy individuals (Gong et al., 2009; Hagmann et al., 2008), as well as in neuropsychiatric disorders such as Alzheimer's disease (Lo et al., 2010) and schizophrenia (van den Heuvel et al., 2010). Although the structural brain networks of CB subjects showed prominent small-world properties (σ> 1), some network measures (γ and Eg ) exhibited altered distributions. We found an increased normalized clustering coefficient and decreased global efficiency in the CB brain network (Fig. 3). Since networks containing more segregated communities tend to have high clustering coefficients (Rubinov and Sporns, 2010; Watts and Strogatz, 1998), the increase of the clustering coefficient in CB subjects suggests potential differences in the capacity of these networks to perform local processing. Even though there may be an increased capacity for local computations, the lower global efficiency in CB subjects indicates that information transfer across the whole brain may be less efficient and/or slower.
Since the CB group showed higher levels of schizotypy, and trends for higher levels of attentional impulsivity and drinks per week, we evaluated the correlation coefficients between the global measures that differentiated the two groups (γ and Eg ), and the demographic and clinical measures. Global efficiency, but not the clustering coefficient, showed negative correlations with measures of impulsivity and schizotypy, and a positive correlation with reading performance. These results suggest that the difference between groups for the clustering coefficient is unlikely to be influenced by any of these individual differences. The pervasive influence of global efficiency on personality traits associated with psychopathology and on poorer reading performance is consistent with the hypotheses that this measure reflects optimization of the global workspace (Bullmore and Bassett, 2011). A loss of efficiency has been hypothesized to be responsible for increased CBF or metabolism after acute CB administration, and increased fMRI activation in some cognitive tasks (Martin-Santos et al., 2010). FMRI measures of efficiency also appear to correlate with intellectual function in other populations (see Bullmore and Bassett, 2011, for review).
As described previously, DTI regional measures of white matter integrity have been found to be abnormal in some (Arnone et al., 2008; Gruber et al., 2011), but not all, studies of CB users (Gruber and Yurgelun-Todd, 2005). These inconsistent findings across structural imaging studies might be attributable to the differences in recruited subject populations, differences in methodology, or the subtle nature of alterations in brain structure linked to CB use (Chang and Chronicle, 2007; Martin-Santos et al., 2010). The duration, age of onset, frequency, and dosage of use, age, psychiatric, and substance use comorbidity in the CB sample varies greatly across studies and may influence imaging measures. For example, variations in impulsivity were linked to global efficiency values in the present study, and Gruber and Yurgelin-Todd (2005) found that both impulsivity scores and age of onset were correlated with frontal FA values in CB users. Large-scale studies with Ns adequate for parsing the effects of relevant clinical and psychometric variables will be needed to achieve adequate power for multivariate analysis and to reliably detect small effect sizes.
There are several methodological limitations to our study. First, our sample size was relatively small due to our strict inclusion and exclusion criteria, and the data were cross-sectional. Consequently, the effects of prior neurodevelopmental and personality differences, which might predispose a person to CB use, and the consequences of CB use on the brain network, cannot be differentiated. A second limitation is raw DWI signal corruption of some subject data that limited the analysis of the overall DTI data set to 10 DWIs. These limited datasets could cause a bias in the principal diffusion tensor direction due to the restricted spans of the distribution with applied gradient space. However, since we used two back-to-back DTI scans consisting of 4 repetitions, 20 diffusion-weighted directions, and 1 non-diffusion-weighted direction, we concluded that the limited DTI sampling and distribution of the current diffusion gradients could be compensated to some extent by the number of scans (Jones, 2004)—that is, a total eight averages of DWIs in the current study, and consequently sufficient for network and correlation analysis. Third, gray matter regions were defined by automated software for brain segmentation (FreeSurfer). Of note, since there currently are no widely accepted standards to construct cortical and subcortical regions in the brain, the nodes of structural networks were defined by a predefined template such as the automated anatomical labeling map. However, different parcellation strategies are known to affect connectional maps (Bohland et al., 2009), and there are recent reports showing that different brain parcellation schemes may result in different topological properties of functional brain networks (Wang et al., 2009; Zalesky et al., 2010). In future studies, it will be important to investigate the brain network with more advanced parcellation methods—for example, smaller and more compact regions to partition the cortex into about 1000 parcels (Hagmann et al., 2008), or methods that attempt to define functional regions on the basis of resting-state or task-evoked responses (Nelson et al., 2010). A final issue relates to the definition of structural connectivity. For the weighted network, there are many candidates for connectivity measures such as the number or length of fibers connecting two regions, the fiber density per unit volume and the mean FA. However, at this current time, the physiological meaning of each measure is poorly understood with respect to pathological processes. In this study we employed three variables to define the structural connectivity (the number and length of fibers, and the area of two regions). Further studies using a more elaborated definition of structural connectivity, possibly in combination with improved tractography, may provide more exact information about the network properties of CB users.
Conclusion
In this study, graph theoretic analysis was applied to whole-brain DTI and MRI datasets of CB users and healthy controls to characterize their respective brain network properties. Brain networks of both CB and healthy control subjects exhibited small-world network properties, and highly connected network hubs were located mainly in subcortical regions for both groups. CB subjects had decreased global efficiency but increased clustering coefficients in their brain networks, implying a potential topological reorganization in the networks of this substance abuse population. Moreover, the network measure of global efficiency was associated with psychometric measures of impulsivity, schizotypy, and reading performance. These findings suggest that network measures may be highly sensitive tools to probe the properties of brain organization that increase the vulnerability to substance use, or are affected by chronic abuse.
Footnotes
Acknowledgments
This research was supported by the National Institute on Drug Abuse (1 R21 DA023097-01A1 to P.D.S.), the National Institute of Mental Health (R01 MH62150 and 1 R21 MH091774-01 to B.F.O.; R01 MH074983 to W.P.H.), the Faculty Research Support Program, Indiana University (B.F.O.), and the J.S. McDonnell Foundation (O.S.).
Author Disclosure Statement
No competing financial interests exist.
References
Supplementary Material
Please find the following supplemental material available below.
For Open Access articles published under a Creative Commons License, all supplemental material carries the same license as the article it is associated with.
For non-Open Access articles published, all supplemental material carries a non-exclusive license, and permission requests for re-use of supplemental material or any part of supplemental material shall be sent directly to the copyright owner as specified in the copyright notice associated with the article.