
Abstract
Neurological and psychiatric disorders disturb higher cognitive functions and are accompanied by aberrant cortico-cortical axonal pathways or synchronizations of neural activity. A large proportion of neuroimaging studies have focused on examining the focal morphological abnormalities of various gray and white matter structures or the functional activities of brain areas during goal-directed tasks or the resting state, which provides vast quantities of information on both the structural and functional alterations in the patients' brain. However, these studies often ignore the interactions among multiple brain regions that constitute complex brain networks underlying higher cognitive function. Information derived from recent advances of noninvasive magnetic resonance imaging (MRI) techniques and computational methodologies such as graph theory have allowed researchers to explore the patterns of structural and functional connectivity of healthy and diseased brains in vivo. In this article, we summarize the recent advances made in the studies of both structural (gray matter morphology and white matter fibers) and functional (synchronized neural activity) brain networks based on human MRI data pertaining to neuropsychiatric disorders. These studies bring a systems-level perspective to the alterations of the topological organization of complex brain networks and the underlying pathophysiological mechanisms. Specifically, noninvasive imaging of structural and functional brain networks and follow-up graph-theoretical analyses demonstrate the potential to establish systems-level biomarkers for clinical diagnosis, progression monitoring, and treatment effects evaluation for neuropsychiatric disorders.
Introduction
N
Research has suggested that neurological and psychiatric disorders disturb higher cognitive functions and are accompanied by structural and functional alterations in neural systems. Many studies have focused on the relationship between these diseases and the brain. With the advent of the noninvasive noninvasive magnetic resonance imaging (MRI) technique, it is now possible to observe aberrant cortico-cortical axonal pathways or neural activity synchronizations in vivo. Traditionally, the relationships between neuroimaging data and neuropsychiatric disorders have been widely investigated by examining the focal morphological abnormalities of various gray and white matter structures or the functional activation of brain areas during cognitive or emotional processing (for reviews, see Apostolova and Thompson, 2007; Kakeda and Korogi, 2010; Mitterschiffthaler et al., 2006). These studies have provided vast quantities of information on both the structural and functional changes that occur in diseased brains; however, the relationships between these regions are usually ignored. Given that the human brain is structurally and functionally organized into complex networks, which allow for the segregation and integration of information processing, the questions that arise regarding how these neuropsychiatric diseases affect the topological organization of brain connectivity networks still remain to be elucidated.
Recent advances on multi-modal neuroimaging techniques and the development of computational theory of massive data, especially the application of graph theoretical approaches to human brain networks, have allowed researchers to explore the structural and functional connectivity patterns of the human brain, which is also known as the “connectome” (Biswal et al., 2010; Sporns et al., 2005). For reviews about these graph-based brain networks studies, see Bullmore and Bassett (2011), Sporns (2011), Telesford et al. (2011), He and Evans (2010), Wang et al. (2010a), Bullmore and Sporns (2009). We conducted a literature search on PubMed (
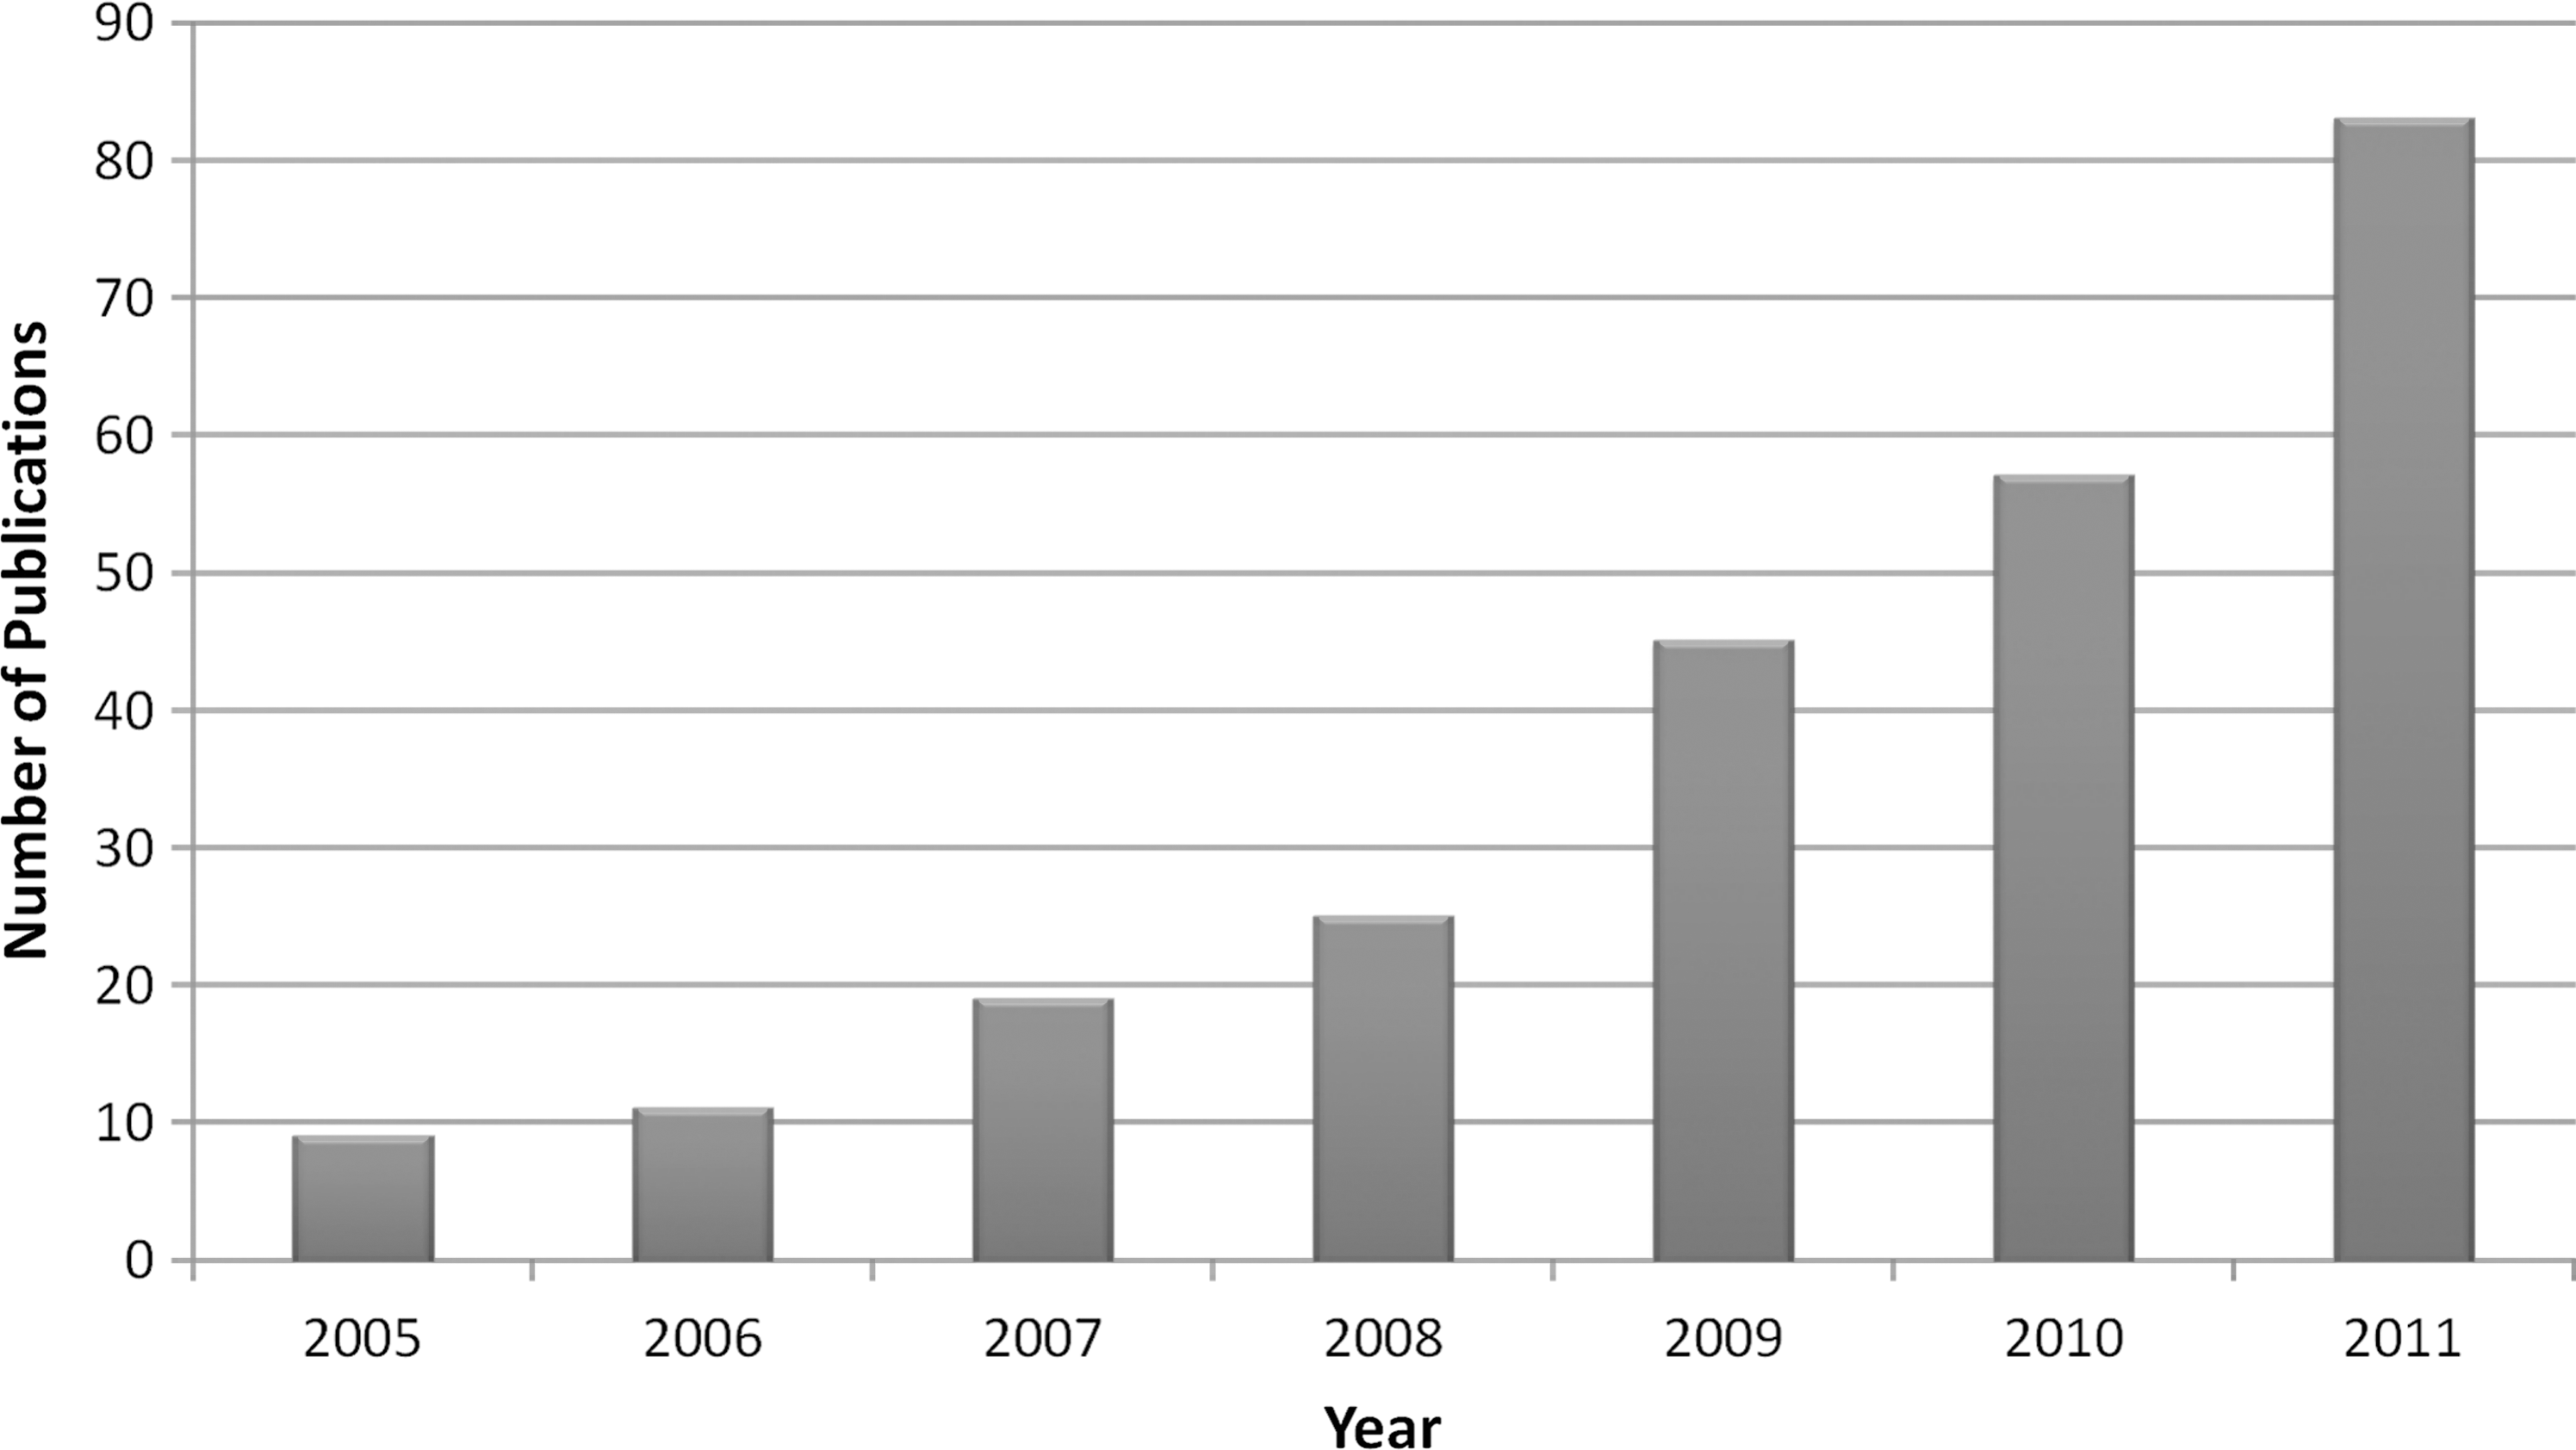
Number of publications related to graph-based brain network analysis from 2005 to 2011. The figure shown here represents a literature search result of of the key words “([“graph theory”] OR [“graph theoretical”] OR [“small-world”] OR [“connectome”]) AND (“brain”)” on PubMed (
In this article, we will summarize recent advances made in the studies of both structural (gray matter morphology and white matter fibers) and functional (synchronized neural activity) brain networks based on human MRI data pertaining to neuropsychiatric disorders. This article is organized into three sections. First, some basic principles and the application of graph theoretical approaches will be introduced. Then, we will survey various applications of graph theoretical approaches on MRI data, focusing specifically on the topological alterations that occur in neurological and psychiatric disorders (Table 1). Although graph theoretical studies based on EEG and MEG data are not included here, they can be found elsewhere (Reijneveld et al., 2007; Stam, 2010a, b; Stam and Reijneveld, 2007). Finally, we will highlight the emerging questions and future challenges that are currently present in this field.
AD, Alzheimer's disease; MCI, mild cognitive impairment; MS, multiple sclerosis; COS, childhood-onset schizophrenia; ARMS, at-risk mental state; TLE, temporal lobe epilepsy; GTCS, generalized tonic-clonic seizures; ADHD, attention-deficit/hyperactivity disorder; ALS, amyotrophic lateral sclerosis; OCD, obsessive-compulsive disorder; TBI, traumatic brain injury; sMRI, structural magnetic resonance imaging; DTI, diffusion tensor imaging; fMRI, functional magnetic resonance imaging; FEMDD, first-episode major depressive disorder; RMDD, resistant major depressive disorder; ANIMAL, automated nonlinear image matching and anatomical labeling; AAL, automated anatomical labeling; ICs, independent components; WM, white matter; B, binary network; W, weighted network; Dos 160 (Dosenbach et al., 2010); NA, not available; NC, normal control.
Graph Theoretical Approaches
Essential principles
In graph theory, a network can be represented as a graph G(N,K), with N denoting the number of nodes and K denoting the number of edges in graph G. Accordingly, a graph G can be numerically stored as an N×N matrix, which is also known as an association matrix. A network can be classified as directed or undirected depending on whether the edges have a sense of direction. Additionally, a network can be classified as unweighted (binary) or weighted if the edges in the graph are assigned with different strengths. Several key network metrics are illustrated next. For more details of graph theory methods, please refer to previous studies (Boccaletti et al., 2006; Kaiser, 2011; Rubinov and Sporns, 2010).
Small world and efficiency
The clustering coefficient and shortest path length are two basic properties of a network. The network clustering coefficient is calculated by averaging the clustering coefficient over all nodes in the network. In contrast, a nodal clustering coefficient is the number of edges linked to the node divided by all the possible edges in its neighborhood. It quantifies the extent of cliquishness, and a higher value expresses a higher local efficiency of information transfer. Likewise, the shortest path length is calculated by averaging the minimum number of connections that link any paired nodes in the network. It quantifies the global efficiency and the ability for information integration. These two metrics can be adopted to classify different types of networks such as regular, random, and small-world networks (Watts and Strogatz, 1998). The regular network has a higher clustering coefficient but a lower shortest path length, indicating good local efficiency, but poor global efficiency (Latora and Marchiori, 2001). In contrast to the regular network, the random network has a lower clustering coefficient but a higher shortest path length, thus indicating poor local efficiency, but good global efficiency. In comparison, the small-world network model possesses both a relatively higher clustering coefficient and shortest path length, indicating better local efficiency than the random network and a better global efficiency than the regular network.
Modularity and hierarchy
Modularity and hierarchy are also important parameters for describing the organization of a network. Modularity reflects the degree of how a network is organized into a modular or community structure. A module refers to a set of nodes with denser connections among them, but with sparser connections among the others within the network (Newman, 2006). The hierarchy reflects a “top-to-bottom” organizational structure of the network and is numerically estimated by the power-law relationship between the clustering coefficient and the degree of the nodes in the network (Ravasz and Barabasi, 2003).
Nodal properties
Nodal properties in a network can be characterized by several metrics such as the degree, efficiency, and the betweenness, eigenvector, and page-rank centrality. The degree of a node is the number of all the edges that link to the node, which represents the most local and directly quantifiable measure of centrality. The nodal efficiency is numerically the inverse of the averaged shortest path length between the node and each of the other nodes, reflecting the ability of information transfer from itself to the other nodes in the entire network (Achard and Bullmore, 2007). The nodal betweenness centrality is a number that represents the shortest path between any two nodes that pass the node, indicating an intersection of various arteries in the network (Freeman, 1979). The eigenvector centrality is simply the first eigenvector of the adjacent matrix corresponding to the largest eigenvalue (Bonacich, 1972). With its recursive property, the eigenvector centrality is able to capture an aspect of the global centrality features of the graph. The Google page-rank centrality algorithm is calculated by using an iteration strategy (Boldi et al., 2009) and is a variant of the eigenvector centrality that introduces a small probability of random dampening to handle walking traps on a graph. Although the page-rank centrality is a variant of eigenvector centrality, a recent resting functional MRI (R-fMRI) study has demonstrated quite different results while using these two centrality measures in an undirected and weighted brain network (Zuo et al., 2011). Moreover, they showed a high correlation between the degree centrality and page-rank centrality.
Graph Theoretical Brain Network Analysis in Healthy People
When applying graph theory methods to modeling human brain networks with neuroimaging data, the brain regions or the voxels can naturally be defined as the nodes in a graph (or network). In structural brain networks, the edges can be calculated by estimating the gray matter morphological correlation in structural MRI (sMRI) data (Chen et al., 2008; He et al., 2007) or by measuring the characteristics of white matter fibers between two brain nodes, such as fiber number, fractional anisotropy, apparent diffusion coefficient, or distance in diffusion tensor imaging (DTI) data (Gong et al., 2009b; Hagmann et al., 2007, 2008; Iturria-Medina et al., 2008), known as structural connectivity. In functional brain networks, the edges can be estimated by computing the Pearson's correlation (Dosenbach et al., 2007; Fair et al., 2007; He et al., 2009c), partial correlation (Ferrarini et al., 2009; Salvador et al., 2005), or the wavelet correlation coefficient (Achard et al., 2006; Meunier et al., 2009a, 2009b) between two time courses of the nodes in the functional MRI (fMRI) data, known as functional connectivity (Biswal et al., 1995; Friston et al., 1993). Moreover, current human brain network analyses have studied the simplest cases of undirected graphs, while few but an increasing number of studies have focused on directed graphs. Figure 2 illustrates the schematic representation of network construction using sMRI, DTI and fMRI data.
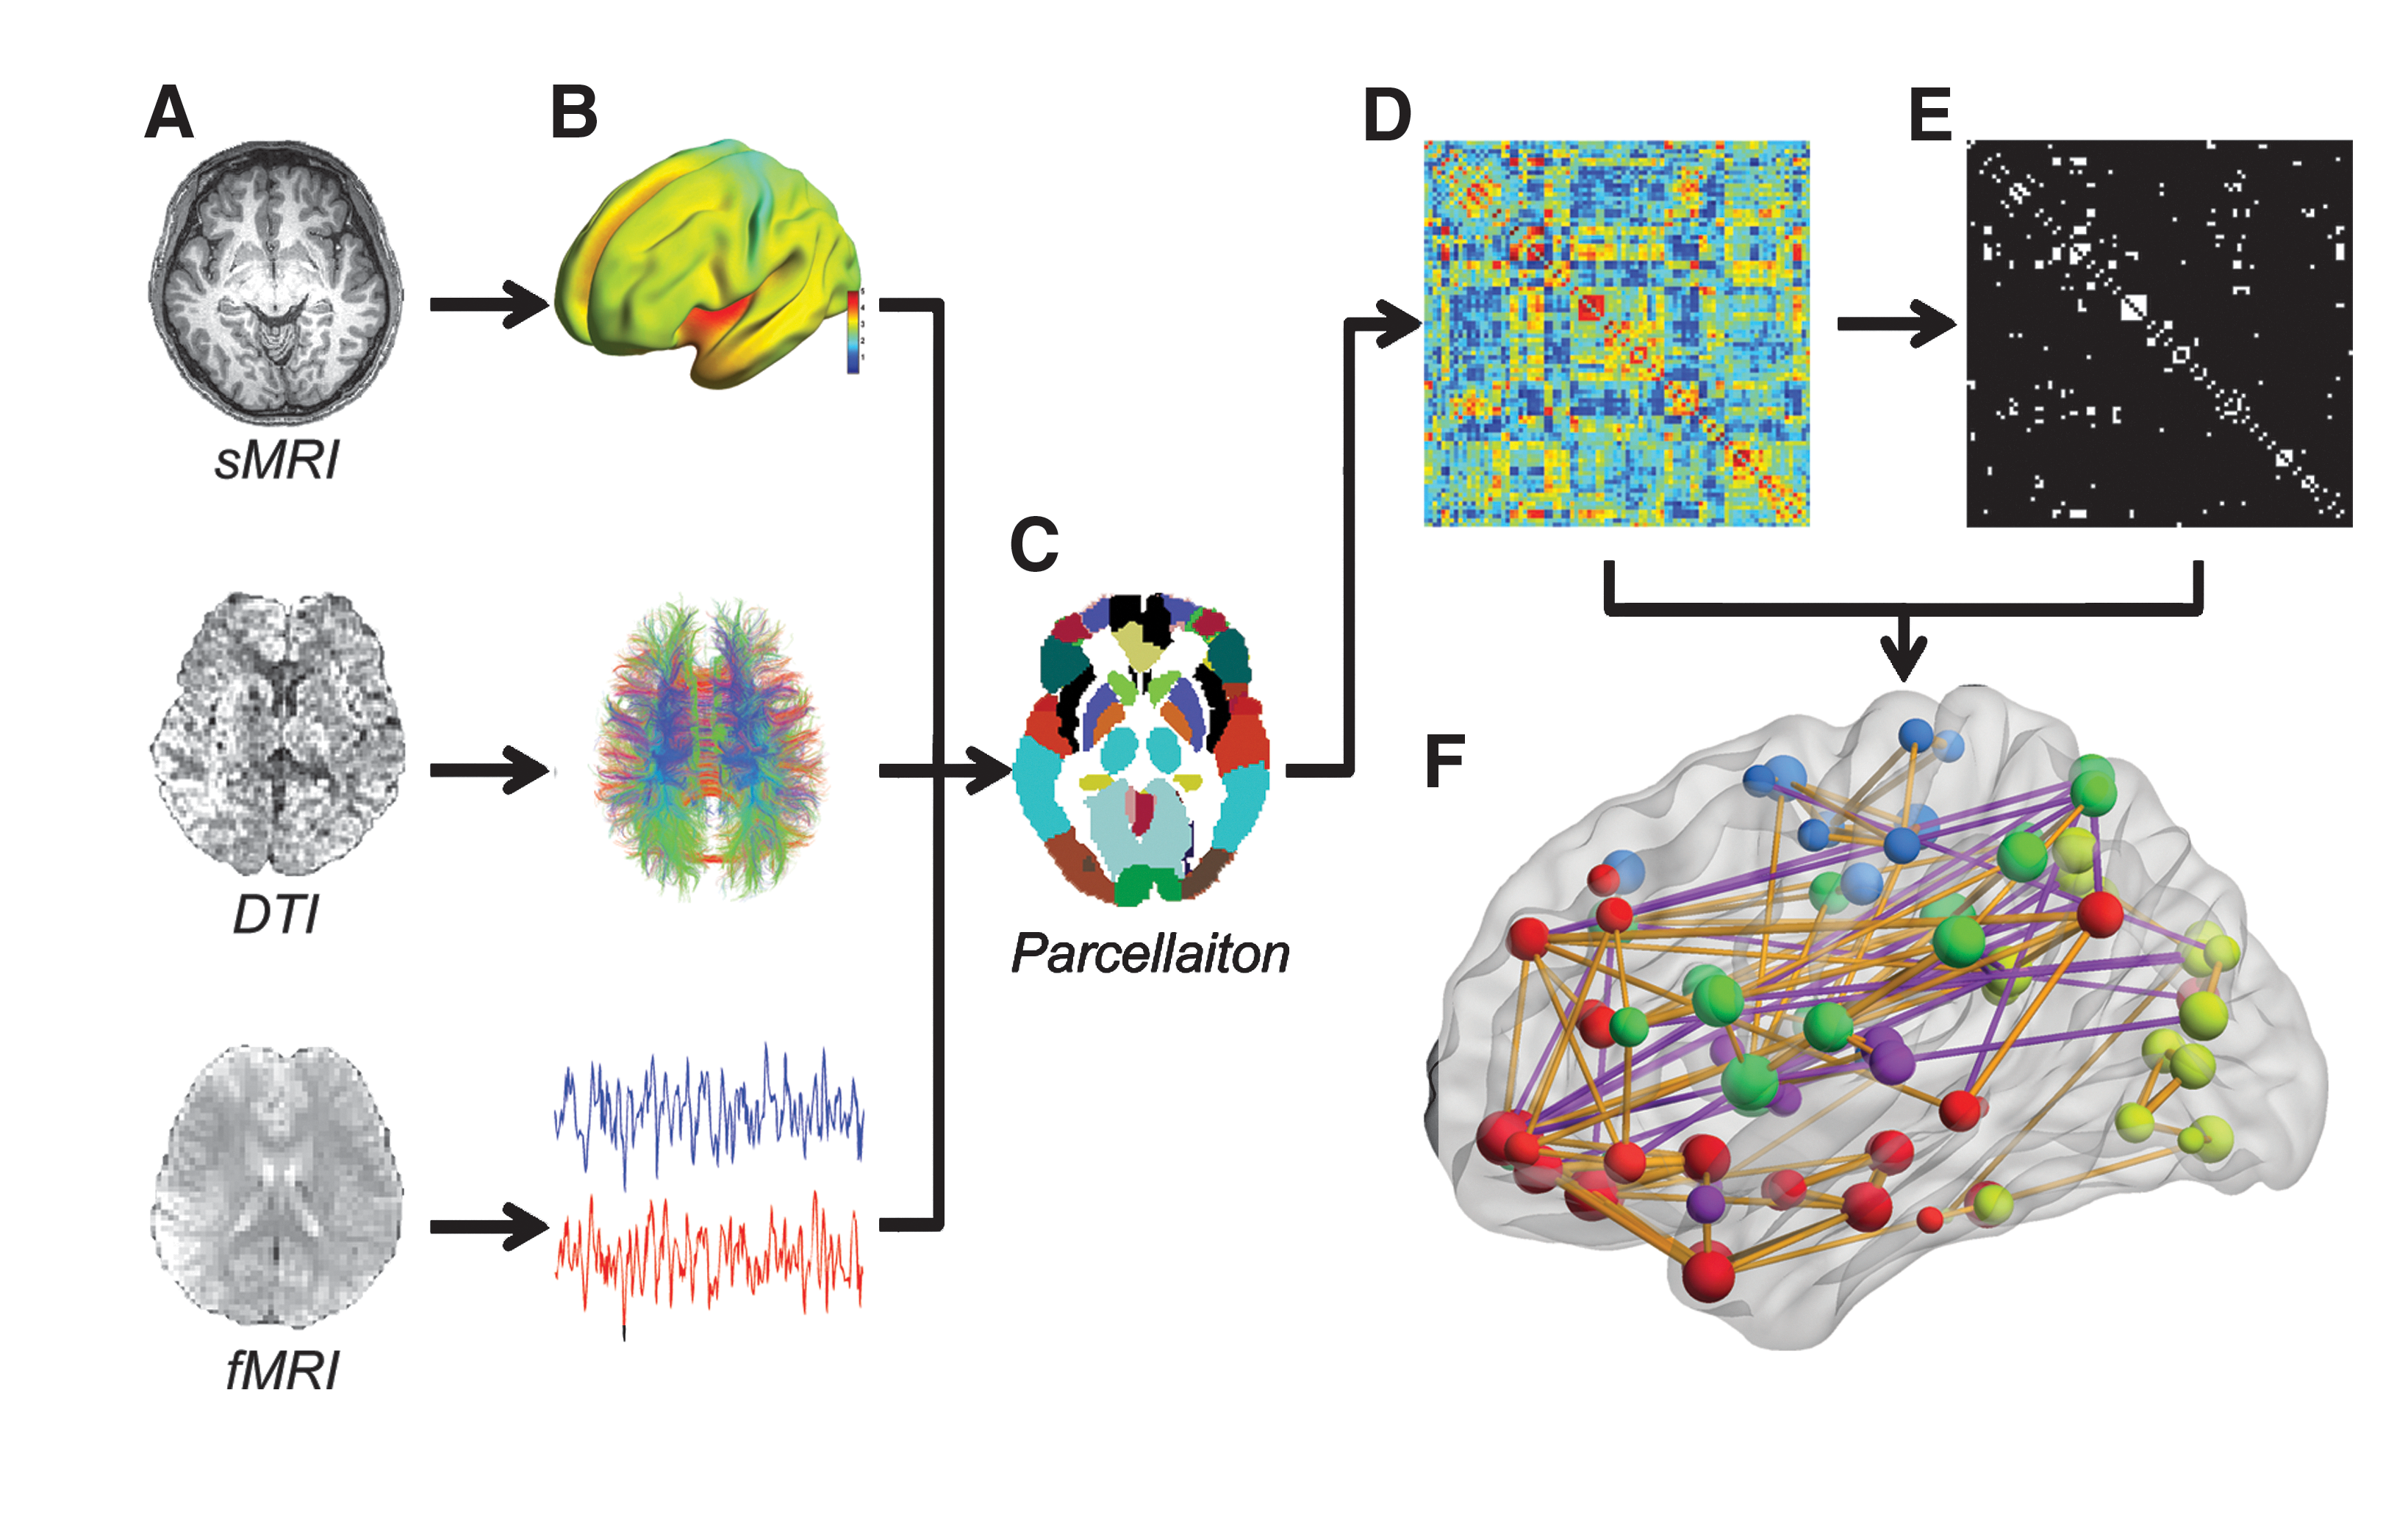
A flowchart for the construction of human brain networks using MRI data. First, the gray matter morphological measures from structural MRI data, the characteristics of the white matter fibers from the DTI data, or the time courses from the functional MRI data are extracted
Once the brain nodes and edges are extracted from neuroimaging data, graph theoretical algorithms can be further applied to the constructed networks. Small-world topological properties have attracted considerable attention, for quantitatively representing both the information segregation and integration abilities of the human brain. A series of these attractive network organizations have been revealed in healthy structural and functional human brain networks constructed using a variety of approaches (Hagmann et al., 2007, 2008; He et al., 2007; Salvador et al., 2005). In these efficient networks, several brain areas are identified as hubs, bridging disparate regional brain areas together to achieve a high global network efficiency; for instance, the precuneus, the insula, the superior parietal cortex, and the medial prefrontal cortex (Buckner et al., 2009; Gong et al., 2009b; Hagmann et al., 2008; He et al., 2007). Interestingly, a recent diffusion MRI study shows that the brain structural networks have the “rich-club” topological organization (van den Heuvel and Sporns, 2011), which was characterized by a tendency for high-degree nodes to be more densely connected among themselves rather than the nodes of a lower degree (Colizza et al., 2006). The members of this club comprise the precuneus and superior frontal and superior parietal cortex as well as several subcortical regions (e.g., the hippocampus, putamen and thalamus). Importantly, several studies have also demonstrated modular (or community) organizations in human brain networks, which mostly include the sensorimotor, visual, control, and default-mode network (DMN) and subcortical system modules (Chen et al., 2008; Ferrarini et al., 2009; He et al., 2009c; Meunier et al., 2009b). Interestingly, the modular organizations found in functional networks are approximately in accordance with those in structural networks, which may reflect shared organizational principles underlying both the anatomical and functional connectivities.
Subsequently, graph theoretical methods have been used in studying relationships between human brain network properties and population attributes such as aging (Gong et al., 2009a; Meunier et al., 2009a; Tomasi and Volkow, 2011a; Wang et al., 2010b; Wen et al., 2011b; Wu et al., 2011a), development (Fair et al., 2007, 2008, 2009; Gao et al., 2011; Supekar et al., 2009), gender effect (Gong et al., 2009a; Tian et al., 2011; Yan et al., 2011a), intelligence (Li et al., 2009; van den Heuvel et al., 2009b), and genetic effects (Brown et al., 2011; Fornito et al., 2011; Schmitt et al., 2008). Moreover, these graph-based network analysis methods have been applied to individuals with a variety of different neuropsychiatric disorders, which is reviewed next.
Graph Theoretical Brain Network Analysis in Neuropsychiatric Disorders
AD and mild cognitive impairment
AD is the most common type of dementia emerging in the aged population, and it is a progressive, neurodegenerative disease that is accompanied by significant impairments in multiple cognitive domains such as memory, executive functioning, attention, visuospatial skills, and verbal ability. Traditional neuroimaging AD studies have found regional gray matter reductions in the medial temporal lobe and posterior associative cortices (Dickerson and Sperling, 2005; Frisoni et al., 2007; Salmon et al., 2008). Recently, the graph-based network analysis method has been applied to study AD, and remarkable global property changes were observed in both the structural and functional networks of the patients [please see He et al. (2009a) for a review].
From a structural perspective, He et al. (2008) was the first study that utilized an sMRI-based brain network model to explore the pattern correlations of cortical thickness in AD. After constructing graph networks of more than 92 patients and 97 controls, network metrics such as small worldness, clustering coefficient, and shortest paths were calculated, in addition to hub analysis. Compared with normal controls, the AD patients showed abnormal small-world architecture and nodal characteristics that were predominantly located in the temporal and parietal regions of the brain. In particular, AD patients exhibited decreased cortical thickness intercorrelations between the bilateral parietal regions but increased intercorrelations in several select regions such as the lateral temporal, parietal, cingulated, and medial frontal cortical regions. The clustering coefficient and shortest path lengths were increased, while the nodal centrality was predominantly decreased in the temporal and parietal heteromodal association cortical regions but increased in the occipital cortical regions. Furthermore, the AD network was much more sensitive to computationally simulated lesions on the hub nodes than normal lesions. In a later study, which included 91 AD patients, 113 mild cognitive impairment (MCI) patients, and 98 healthy aged people, the gray matter volumes were used to construct cortical networks (Yao et al., 2010). Similar results were obtained in a previous study, where all three cortical networks exhibited small-world properties with strong interhemispheric correlations existing between bilaterally homologous regions. The AD patients showed the greatest clustering coefficient, the longest absolute path length, and an altered hub distribution. Furthermore, the small-world measures of the MCI network exhibited intermediate values.
Many studies employing the DTI technique to examine changes in white matter tracts in patients with AD have uncovered abnormalities of brain white matter connectivities in distributed regions (Bozzali et al., 2002; Rose et al., 2000; Xie et al., 2006). As the only AD-related DTI study based on a graph theory approach, Lo et al. (2010) observed that AD patients had a small-world topology in the white matter network with an increased shortest path length and a decreased global efficiency, which is consistent with the aforementioned study of the gray matter morphological networks. Specifically, they showed that AD patients had a reduced nodal efficiency that was predominantly located in the frontal regions, which are thought to be involved in emotional, memory, and executive functions. This study showed for the first time that an AD patient's brain was associated with disrupted topological organization in large-scale DTI-based structural networks.
From a functional perspective, Supekar et al. (2008) provided the first demonstration of abnormal small-world organization in brain functional networks in AD by using R-fMRI. After constructing a functional brain network for each of the 21 AD patients and 18 healthy controls, the network metrics were measured. In the low-frequency interval of 0.01 to 0.05 Hz, they found that the AD patients showed a loss of small-world properties, characterized by a significantly lower clustering coefficient, especially for the bilateral hippocampus. This was quite different from the gray matter structural network studies, which indicated a disruption in local neighboring connectivity. In addition, by comparing the clustering coefficient of distinguished AD participants and controls, a sensitivity of 72% and a specificity of 78% were determined. Dai et al. (2011) used the regional gray matter volume and the regional functional connectivity strength combined with the amplitude of low-frequency fluctuations and regional homogeneity as features to distinguish AD patients from healthy controls. This multi-modal imaging and multi-level characteristics with multi-classifier (M3) method led to a classification accuracy of 89.47% with a sensitivity of 87.5% and a specificity of 90.91%. This result suggests that these network indices may serve as useful biomarkers for AD diagnosis. In a larger database study, graph theoretical approaches of R-fMRI enabled Buckner et al. (2009) to identify stable network hubs of brain functional networks that were predominantly located in the heteromodal areas of the association cortex by analyzing fMRI data in both resting and task states. Prominent hubs were located within the posterior cingulate, lateral temporal, lateral parietal, and medial/lateral prefrontal cortices. The study also assessed the preferential vulnerability of these identified hubs to AD pathology. Furthermore, they utilized positron emission tomography (PET) amyloid imaging in 39 older adults (10 AD patients and 29 controls) and demonstrated that these cortical hubs had a large overlap with the brain regions exhibiting high amyloid-beta deposition, as found in AD patients. The highly consistent pattern of hubs between the database and imaging methods suggests that the cortical functional network possesses a stable architecture. In an MCI study of neuronal dysfunction and disconnection of cortical hubs, Drzezga et al. (2011) found disruptions of whole-brain connectivity in amyloid-positive MCI patients in typical cortical hubs (posterior cingulate cortex/precuneus). This strongly overlapped with regional hypometabolism. The hubs studies suggest that some cortical hubs, such as those in the posterior cingulate and precuneus, may serve as important indicators during disease progression that distinguishes normally aged individuals from AD patients. In addition, a study by Sanz-Arigita et al. (2010) reported inconsistent results with Supekar et al. (2008). Sanz-Arigita et al. (2010) found that the characteristic path length of AD functional networks is closer to the theoretical values of random networks, and no significant differences were found in the clustering coefficient. They also observed increased AD synchronization involving the frontal cortices and generalized decreases located in the parietal and occipital regions. AD-induced changes in the global brain functional connectivity specifically affected long-distance connectivity. Interestingly, the edge definition methods were quite different between these two studies (Sanz-Arigita et al., 2010; Supekar et al., 2008), which may be a potential reason for their inconsistent results. Therefore, the choice of edge definition methods should be considered during brain network construction in graph-based analysis.
Collectively, these previous studies have demonstrated that the brain networks in AD still retain small-world characteristics as the healthy controls. However, the patients' structural brain networks exhibit a tendency toward regular configurations with a less global integration, which could be used to explain the decline of memory and cognitive functions. Given that several previous studies have demonstrated that the brain networks are composed of different modules (He et al., 2009c; Meunier et al., 2009a), future works would be interesting to ascertain which modules show the most disrupted changes in the brain networks in AD. Notably, these results of structural brain networks in AD (He et al., 2008; Lo et al., 2010) were different from those of the functional brain networks derived from the fMRI data (Supekar et al., 2008), which needs to be clarified in future studies.
Multiple sclerosis
Multiple sclerosis (MS) is a chronic, inflammatory, progressive, and degenerative disease of the central nervous system that is usually accompanied by widespread lesions in white matter structures. He et al. (2009b) investigated structural brain networks using measurements of cortical thickness from the sMRI data of 330 MS patients. Their results showed for the first time that the structural cortical networks in MS patients demonstrated efficient small-world architecture regardless of the locations of the lesions; however, the small-world efficiency of the structural brain networks in MS was significantly disrupted in a manner proportional to the extent of the total white matter lesion loads. Regional efficiency was also decreased in several specific brain regions including the insula and precentral gyrus as well as regions of the prefrontal and temporal association cortices. This study also demonstrated that sMRI-based network analysis could emerge as a new way of describing disease progression. The following DTI study by Shu et al. (2011) reported that MS patients exhibited efficient small-world properties in their white matter structural networks. However, decreased global and local network efficiencies were found in MS patients compared with control subjects, with the most pronounced changes observed in the sensorimotor, visual, DMN, and language areas. Furthermore, the decreased network efficiencies were correlated with the expanded disability status scale scores, disease durations, and total white matter lesion loads. By applying a split-half method, they revealed a high reproducibility of their findings. Taken together, these two studies suggest a disrupted integrity in the large-scale anatomical brain networks in MS and provide structural evidence for the notion of MS as a disconnection syndrome.
Although MS patients were found to show decreased global and local efficiencies in structural brain networks, it is still largely unclear whether the patients also show alterations of functional brain networks. Furthermore, it remains unknown whether and how the white matter lesions in specific locations affect topological organization of brain networks.
Schizophrenia
Schizophrenia is a heterogeneous disorder with variations in expression and pathophysiology (Shenton et al., 2010). Recent studies are inclined to regard schizophrenia as a type of disconnection syndrome (Friston, 2005). After constructing the structural brain networks by calculating the inter-regional covariations of gray matter volume derived from the sMRI data of 203 schizophrenia patients and 259 healthy controls, Bassett et al. (2008) focused on the topological organization pattern of these networks. They found that changed topology in the multimodal brain network of people with schizophrenia is characterized by a reduction in hierarchy and the loss of frontal and the emergence of nonfrontal hubs, as well as an increased connection distance in the patients' networks. These topological changes in patients may represent the neurodevelopmental abnormalities found in schizophrenia.
The very first DTI study of white matter pathology in schizophrenia focused on the local lower diffusion anisotropy in the white matter of schizophrenic patients (Buchsbaum et al., 1998). In recent years, three DTI studies have analyzed the network based on DTI tractography (van den Heuvel et al., 2010; Wang et al., 2012; Zalesky et al., 2011). van den Heuvel et al. (2010) examined the DTI tractography-based structural brain networks of 40 schizophrenia patients and 40 healthy controls. Although the patients displayed a preserved, overall small-world network organization, significantly longer node-specific path lengths were found in specific frontal and temporal regions of the brain, especially in the bilateral frontal cortex and temporal pole regions. The frontal hubs of patients had a significant reduction of betweenness centrality. These findings indicated that the schizophrenia had impacted the global network connectivity of the frontal and temporal brain regions. In another study examining the DTI tractography-based structural brain networks of 74 schizophrenia patients and 32 age- and sex-matched controls, similar results were found (Zalesky et al., 2011). Small-world attributes were found to be conserved in schizophrenic patients; however, impaired connectivity in the patient group was found to involve a distributed area in the medial frontal, parietal/occipital, and the left temporal lobe. Furthermore, the cortical intercorrelations were found to be sparse and less efficient in 20% of the patients, and the intellectual performance was found to be associated with brain efficiency in control subjects, but not in patients. Wang et al. (2011b) examined the topological properties of human brain anatomical networks derived from 79 schizophrenia patients and 96 age- and gender-matched healthy subjects. They revealed a lower global efficiency in the patients' group associated with which the deleterious effects appear to be localized as reduced regional efficiency in hubs such as the frontal associative cortices, the paralimbic/limbic regions, and the left putamen. Additionally, the global efficiency in patients was negatively correlated with the score on the Positive and Negative Symptom Scale in schizophrenia. The DTI tractography-based structural brain network is a valid framework describing the white matter fiber pathway between cortices for information flow. Thus, the aberrant topological patterns of the networks revealed changes in the contact between cortices in schizophrenia patients. These findings suggest that complex brain anatomical network analysis may potentially be used to detect imaging biomarkers for schizophrenia.
Much more studies have been conducted on functional networks than structural networks in schizophrenia. Liu et al. (2008) was the first that provided the graph analysis of brain functional networks in schizophrenia using R-fMRI data. By constructing the individual resting state functional brain network of each of the 31 patients and 31 normal subjects, they found various disrupted topological properties in the patient group such as lower clustering coefficients, small-worldness, network efficiency, and longer absolute path length. The nodal characteristics were significantly altered in many brain regions located in the prefrontal, parietal, and temporal lobes. In addition, various topological measurements such as clustering and efficiency were negatively correlated with illness duration in schizophrenia. Wang et al. (2010c) revealed significant reductions in local, but not global, efficiency in the schizophrenia group. In addition, the network “hub” regions related to memory recollection, such as the bilateral dorsal anterior cingulate gyrus, showed reduced gray matter volume in schizophrenia patients. Similar to previous studies, Yu et al. (2011b) also found decreased small worldness values in both hemispheres, but longer shortest path length and lower global efficiency in the left task-related networks in the schizophrenia group. To determine whether the topological properties of functional network connectivity are also altered in schizophrenia (Yu et al., 2011a), they defined the graph node by using independent component analysis and constructed a functional brain network of 19 healthy controls and 19 schizophrenia patients. These results demonstrated altered topological properties in eleven independent components involving frontal, parietal, occipital, and cerebellar areas. High clustering coefficients were observed in the patient group. Furthermore, the topological measures of the whole network and the specific components in schizophrenia were correlated with the negative symptom score of the Positive and Negative Symptom Scale. Lynall et al. (2010) constructed a functional brain network in the 0.06–0.125 Hz frequency interval of 12 patients and 15 normal controls. Patients with schizophrenia exhibited a topological decrease in strength and an increase in the diversity of functional connectivity. They also showed reduced clustering and small worldness, reduced probability of high-degree hubs, and increased robustness to random attack. They found that the functional connectivity and topological metrics were correlated with each other and with behavioral performance on a verbal fluency task. In a study of childhood-onset schizophrenia (Alexander-Bloch et al., 2010), there was a reduced modularity of brain functional networks due to the relatively reduced density of intra-modular connections between neighboring regions. Not surprisingly, a decreased clustering coefficient and increased complementary measures of global efficiency and robustness were observed in the patients group. These findings suggested that the functional brain network of schizophrenia patients evolved into a random network pattern from the small-world patterns. In addition, a study of at-risk subjects with elevated symptoms (Lord et al., 2011) reported a reduction in the topological centrality of the anterior cingulate cortex (ACC), indicating a reduction in the contribution of the ACC to task-relevant network organization in at-risk subjects with elevated symptoms relative to both the controls and the less symptomatic at-risk subjects. These findings provide evidence of network abnormalities and ACC dysfunction in people with prodromal signs of schizophrenia. Moreover, the ACC region may serve as a potential biomarker in diagnosing schizophrenia.
The brain networks of schizophrenia patients appear to have decreased local clustering coefficient together with decreased hierarchy and modularity. It is gradually being recognized to exhibit random network model characteristics in the context of comparisons to healthy individuals. However, schizophrenia is a psychiatric disorder with large individual variations. Thus, the studies on different subtypes will provide more intriguing results.
Epilepsy
The first temporal lobe epilepsy (TLE) study based on structural networks using the graph theory method was by Raj et al. (2010). This study was composed of 14 patients with TLE with normal MRI (TLE-no) and 30 controls. Cortical thickness was used to construct the structural brain network. The network metrics were then used to classify TLE and normal subjects. This proposed network approach improved the accuracy of classifying subjects into two groups (control and TLE) from 78% to 93% for non-network classifiers. Another more recent large-sample TLE study of 122 TLE patients and 47 age- and sex-matched healthy controls (Bernhardt et al., 2011) reported that the networks in TLE patients still remained within a small-world topology; however, the network of patients demonstrated an increased path length and clustering coefficient, altered distribution of network hubs, and higher vulnerability to targeted attacks compared with healthy controls.
Using graph theoretical approaches (Liao et al., 2010), the first study of R-fMRI analysis of brain functional networks in mesial TLE (mTLE) included 18 mTLE patients and 27 healthy controls. The mTLE patients were associated with increased connectivity within the medial temporal lobes but decreased connectivity within the frontal and parietal lobes. Between the frontal and parietal lobes, a large number of areas the DMN showed a decreased number of connections to other regions. Furthermore, altered small-world properties, along with a smaller degree of connectivity, smaller absolute clustering coefficients, and shorter absolute path length were observed in the patient group. These analogical findings were reported in another functional study of 14 Generalized Tonic-Clonic Seizures epilepsy patients and 29 normal subjects (Song et al., 2011). In addition, decreased functional connectivities within the DMN and the reduced degree of some brain areas within the DMN, including the anterior medial prefrontal cortex, the bilateral superior frontal cortex, and the posterior cingulate cortex, were shown in their study. Vlooswijk et al. (2011) recruited 41 adult patients with cryptogenic localization-related epilepsy and 23 healthy controls. By applying graph theoretical network analysis on fMRI data, they found a disruption of both local segregation and global integration, as well as the association of intellectual decline with local segregation in the patient group. The most recent graph theoretical study on epilepsy was from Zhang et al. (2011c) and was based on both the DTI and R-fMRI datasets obtained from 26 patients with idiopathic generalized epilepsy characterized by tonic-clonic seizures and from 26 age- and gender-matched healthy controls. The patients had lost optimal topological organization in both the structural and functional brain network, indicated by altered nodal topological characteristics in several distributed cortical and subcortical regions. Most importantly, a decreased degree of coupling between the structural and functional networks and a negative correlation with epilepsy duration were revealed in patients.
The network topology modifications in epilepsy patients exhibited complex transitions: some studies showed a translation toward a more regular network configuration, whereas others studies showed a trend toward a more random configuration. The differences in results could be explained by several factors such as the different epilepsy phenotypes and the modalities of connectivity measurement used in these studies.
Depression
Using R-fMRI, Zhang et al. (2011a) utilized graph-based network analysis to characterize network topological properties, and individual brain networks were constructed for 30 drug-native, first-episode major depressive disorder (MDD) patients and 63 healthy control subjects. Although both the MDD and control groups showed small-world architecture in their brain functional networks, the MDD patient group showed altered quantitative values in the global properties, characterized by a lower path length and a higher global efficiency, implying a shift toward randomization in their brain networks. Furthermore, increased nodal centralities were found in MDD patients who were predominately located in the caudate nucleus and DMN. Further, there were reduced nodal centralities located in the occipital, frontal (orbital part), and temporal regions. The altered nodal centralities in the left hippocampus and caudate nucleus were also correlated with disease duration and severity in MDD patients. Jin et al. (2011) constructed the resting functional networks in 16 first-episode, un-medicated adolescents with MDD and 16 healthy controls. Disrupted topological properties of networks as well as the dysregulation of distributed brain regions were observed in depressed adolescents. Furthermore, the degree of amygdala was positively correlated with the duration of depression. Tao et al. (2011) investigated the alteration of the functional connections in the brain for 15 first-episode and 24 longer-term, drug-resistant patients suffering from severe depression. Compared with the brain functional network constructed from healthy control subjects, the greatest change in both groups of depressed patients was the uncoupling of the so-called “hate circuit,” which involves the superior frontal gyrus, insula, and putamen. Other major changes occurred in regions related to risk and action responses, reward, and emotion, as well as attention and memory processing. Their findings suggest reduced cognitive control over negative feelings toward both oneself and others in patients with depression. Currently, there is no study showing alterations of topological organization in the structural brain networks in depression patients.
Stroke
Crofts et al. (2011) used a DTI tractography network that assesses the connectivity between brain regions in nine chronic stroke patients and 18 age-matched controls. Reduced communicability was found in patients in regions surrounding the lesions located in the affected hemisphere. The communicability was also reduced in homologous locations in the contralesional hemisphere for a subset of these regions in the patient group. They interpreted this as evidence for secondary degeneration of fiber pathways, which occurred in remote regions that were interconnected, directly or indirectly, within the area of primary damage.
There are two functional network studies on stroke patients. The first, Wang et al. (2010d), constructed a functional brain network from 21 brain regions for each of the 10 first-onset stroke patients and separately for two groups of healthy subjects of 36 and 12.They revealed that in the patient group, the motor execution network gradually shifted toward a random mode during the recovery process and that increased regional centralities within the network were observed in the ipsilesional primary motor area, while the contralesional cerebellum and the ipsilesional cerebellum showed decreased regional centrality. In the study by Nomura et al. (2010), which included 21 patients and 21 healthy subjects, there were correlations between the degree of network damage and a decrease in functional connectivity within the network while sparing the nonlesioned network. In addition, they uncovered differences in the graph theory properties of the intact nodes within the damaged network compared with the undamaged network, providing evidence of dysfunction.
Other neuropsychiatric diseases
Attention-deficit/hyperactivity disorder
Wang et al. (2009b) were the first to use R-fMRI to investigate boys with ADHD by applying graph theoretical approaches. The authors found that the functional brain network in both the diseased and healthy groups exhibited an economical small-world topology. However, children with ADHD were associated with abnormal small-world topology characterized by significantly increased local efficiencies combined with a decreasing tendency in global efficiencies, suggesting a shift toward regular networks. Furthermore, decreased nodal efficiency was found in the orbitofrontal cortex, which is associated with the executive function network, and in several regions belonging to the temporal and occipital cortices. Increased nodal efficiency was also exhibited in the inferior frontal gyrus, which is critical for response inhibition. The altered nodal efficiency suggests that the nodal roles in the brain functional networks are profoundly affected by this disorder. Together, these findings imply a loss of the optimal organizational pattern of the brain functional network in ADHD children during development.
Autism spectrum disorder
Autism or autism spectrum disorder (ASD) is a neurodevelopmental disorder characterized by social deficits, communication difficulties, and/or cognitive delays. Increasing studies have revealed altered brain connectivity in ASD (Belmonte et al., 2004; Di Martino et al., 2009; Wicker et al., 2008). Currently, there are no MRI studies based on graph theoretical network analysis in ASD. Supekar et al. (2009) compared functional network properties between 23 children (age 7–9 years) and 22 young-adults (age 19–22 years). The functional networks of the children had less hierarchical organization and exhibited more short connections than those of young adults, indicating a germinating of long-range connections and pruning of short-range connections during the development of large-scale brain network. A later EEG study from Barttfeld et al. (2011) revealed that the functional networks of ASD subjects lacked long-range connections whereas showed increased short-range connections, suggesting an abnormal development of brain functional networks.
Obsessive-compulsive disorder
Zhang et al. (2011b) studied the alterations in the functional connectivity patterns of the brain's top-down control network constructed using data from 18 patients with obsessive-compulsive disorder (OCD) and 16 healthy controls using graph theory-based approaches. A direct between-group comparison of the functional connectivity revealed significantly decreased functional connectivity in the posterior temporal region and increased connectivity in the cingulate, precuneus, thalamus, and cerebellum, which is related to control in the patient group. Subsequent graph theoretical analysis also demonstrated abnormal functional organization in the patient group compared with the small-world architecture in the control group, which is indicated by significantly higher local clustering. The results provide empirical evidence for aberrant functional connectivity in large-scale brain systems in people with OCD.
Amyotrophic lateral sclerosis
Verstraete et al. (2011) utilized DTI data to examine the topology of structural brain networks in 35 patients with amyotrophic lateral sclerosis (ALS) and 19 healthy controls. They demonstrated a significant reduction in overall efficiency and clustering as well as an impaired sub-network of regions in ALS patients. The regions were centered on primary motor regions, including secondary motor regions as well as high-order hub regions (right posterior cingulate and precuneus). Notably, these areas were interlinked and targeted to the motor connectome. Their findings suggest a widespread disruption in the structural brain networks in ALS, which was compatible with their previous study (Verstraete et al., 2010). These findings demonstrated that the structural connectome approaches have potentials to uncover useful biomarkers for ALS diagnosis (Filippini et al., 2010; Turner et al., 2009).
Traumatic brain injury
Nakamura et al. (2009) examined the changes in the topological properties of the brain functional network derived from each of the six participants at separate time points between 3 and 6 months during recovery after severe traumatic brain injury using R-fMRI and graph theoretical approaches. They found alterations of network properties, including a change in the degree of distribution, reduced overall strength in connectivity, and increased small-worldness alterations of network properties, which is suggestive of a network recovery after severe brain injury. Thus, graph-based network approaches may be useful in evaluating the adaptation of intrinsic brain networks to neural disruption during recovery.
Addiction
Using graph theory analysis, Liu et al. (2009) studied the brain functional network topological properties of a specific population of chronic heroin users and illustrated their impairments. Twelve chronic heroin users and twelve controls were involved in this study. The results showed a typical small-world configuration in both groups; however, a smaller extent of small-worldness was found in the drug users. In addition, abnormal topological properties were explored in the brains of chronic heroin users, shown in detail as the dysfunctional connectivity in the prefrontal cortex, ACC, supplementary motor area, ventral striatum, insula, amygdala, and hippocampus, an area responsible for decreased self-control, impaired inhibitory function, and deficits in stress regulation, which are symptoms characterized by chronic heroin users. Yuan et al. (2010) also studied the abnormal topological properties of functional brain networks in heroin-dependent individuals. Eleven abstinent, heroin-dependent patients and 11 age-, education-, and gender-matched, healthy, right-handed individuals were recruited. Some of the key areas of drug addiction-related circuits and stress regulation were shown to have abnormal topological properties. Moreover, the duration of heroin use was positively correlated with the degree length in the right parahippocampal gyrus, left putamen, and bilateral cerebellum, but negatively correlated with the shortest absolute path length in the same areas. Chanraud et al. (2011) concentrated on a specific population of alcoholics and evaluated the disruption of the brain functional network constructed during both resting and task states. Fifteen alcohol-dependent subjects and 15 healthy controls were included in this study, and group-level differences were found. During the resting state, alcoholics had lower efficiency indices between the posterior cingulate and multiple cerebellar sites but greater efficiency in regions with longer sobriety. In contrast, while in the task state, alcoholics showed more robust connectivity between the left posterior cingulate and left cerebellar region, which suggests compensatory networking.
It is interestingly to point out that there are some commonalties and differences in alterations of topological organization of brain networks among these aforementioned neuropsychiatric disorders. For instance, both ADHD (Wang et al., 2009b) and OCD (Zhang et al., 2011b) patients have been found to show increased local clustering in brain functional networks, which could be related to greater local connectivity of the brain. The ADHD and OCD have been proposed as psychiatric disorders with a development delay, which provides explanations for the similar disruption of small-world organization. Despite these similarities, there are still some differences: ADHD patients showed altered small-world organization in whole-brain networks (Wang et al., 2009b), whereas OCD patients showed altered small-world topology in top-down control networks rather than whole-brain networks (Zhang et al., 2011b). We also found that both schizophrenia (Alexander-Bloch et al., 2010; Liu et al., 2008; Lynall et al., 2010; Wang et al., 2012) and depression (Zhang et al., 2011a) patients showed similar disrupted small-world organization as characterized by a random-like configuration. However, different changing patterns were also found mainly in the regional connectivity. From these studies, we speculate that the disorders with similar alterations in brain networks might belong to the same disease family, whereas the differences in brain networks might reflect distinct across-disorder mechanisms. Understanding the commonalities and differences in network alterations across different disorders would be very important for many aspects. For example, (1) it would have potentials for studying drug intervention that could alter the “commonly affected” brain organization; (2) it might lead to targeted computational models for different disorders; and (3) it would also be useful for uncovering cross-disorder biomarkers for disease diagnosis and progression monitoring.
Future Perspectives
This article summarizes the recent application of network analysis techniques based on graph theory to study the abnormal topological characteristics in the structural and functional human brain networks derived from sMRI, DTI and/or fMRI data of patients with neurological or psychiatric disorders. These novel methods have brought to us revolutionary insights into the intrinsic networks of the human brain and the underlying disease mechanism in patients. These findings have proved that these modern approaches are efficient. However, we should acknowledge that studies of the complex brain networks of people with neuropsychiatric disorders, even in normal subjects, are still at the early stage. To validate and improve such methods, vast studies should be performed to evaluate the various parameters and strategies used in brain network analyses, such as DTI parameters (Vaessen et al., 2010), node definition (Wang et al., 2009a; Zalesky et al., 2010), overlapping (Wu et al., 2011b; Yan et al., 2011b), and reliability (Bassett et al., 2011; Braun et al., 2012; Park et al., 2012; Telesford et al., 2010; Wang et al., 2011; Whitlow et al., 2011). There are still many challenging issues in this new research field that need to be addressed.
First, there are many different methodological choices at several steps of the construction of the whole-brain structural and functional network and parameters of the subsequent analyses. We do not yet fully understand their impact; for instance, the effect of the definition of nodes and edges. Given the limitation in methodology, it is hard to construct a human whole-brain network on a micro- and meso-scale corresponding to single neurons and at the synaptic and cortical column level respectively, due to the enormous number of neurons (Sporns et al., 2005). On a macro-scale, some present studies usually define a node as the region in the brain that uses various templates or a parcellation scheme (Bassett et al., 2008; Crofts et al., 2011; Dosenbach et al., 2007; Fair et al., 2007; Gong et al., 2009b; He et al., 2007; Wen et al., 2011b). The frequently used templates include the automate anatomical labeling template (Tzourio-Mazoyer et al., 2002), Brodmann areas (Brodmann, 1909), Harvard-Oxford atlas (Smith et al., 2004), automated nonlinear image matching and anatomical labeling package (Collins et al., 1995; Robbins et al., 2004), FreeSurfer parcellation (Dale et al., 1999; Fischl et al., 1999, 2002), and some other user-defined functional regions of interest (ROIs) (Dosenbach et al., 2008; Fair et al., 2007). The other studies directly use the voxels as nodes in the network (Buckner et al., 2009; Eguiluz et al., 2005; Tomasi and Volkow, 2011a; van den Heuvel et al., 2008b; Zuo et al., 2011). Recent evidence has demonstrated the meaningful influence of choice of node definition on the topological metrics of resulting networks (Hayasaka and Laurienti, 2010; Wang et al., 2009a; Zalesky et al., 2010). Likewise, multiple choices of the definition of network edges are currently employed in studies, such as the Pearson's correlation (Fair et al., 2007; He et al., 2007; Wang et al., 2010b), partial correlation (Ferrarini et al., 2009; Salvador et al., 2005; Sanabria-Diaz et al., 2010), wavelet correlation (Achard et al., 2006; Meunier et al., 2009a; Supekar et al., 2009), and white matter tractography in DTI (Gong et al., 2009b; Hagmann et al., 2008; Iturria-Medina et al., 2008). Furthermore, the weighted (Honey et al., 2009; Schmitt et al., 2008; van den Heuvel et al., 2008a) or binary (Chen et al., 2008; van den Heuvel et al., 2009b; Wen et al., 2011b) edge weights are another parameter that should be of concern. Furthermore, some studies employed normalized graph metrics such as gamma (normalized clustering coefficient), lambda (normalized shortest path length), and small worldness, whereas others adopted non-normalized metrics such as clustering coefficient and path length. These different metrics might partly account for the differences in results. Encouragingly, some results seem to be robust in their methodological details; however, given the lack of a gold standard for the definition of network nodes and edges, researchers still need to develop a more solid basis for choosing between alternative options. Furthermore, with the development of graph theoretical approaches, some relatively new metrics (e.g., rich-club measure and overlapping modules) are introduced into this field, which provides different perspectives into topological organizations in the brain.
Second, the combination of different MRI modalities becomes an important future topic to determine the relationship of the structural and functional connectivity of the brain. Accumulating evidence has shown that the strength of the intrinsic functional connectivity derived from R-fMRI positively correlates with the strength of the structural connectivity, supporting the notion that functionally linked networks are shaped largely by underlying structural pathways (Damoiseaux and Greicius, 2009; Greicius et al., 2009; Honey et al., 2009; Teipel et al., 2010; van den Heuvel et al., 2009a). To date, human brain functional networks can also be studied with neurophysiological data such as EEG/MEG/electrocorticography (ECoG). Compared with fMRI, EEG/MEG/ECoG techniques provide better temporal resolution on functional brain networks; therefore, there are prominent advantages for the time-frequency analysis and the studies of dynamical network configuration between different brain states. Using EEG/MEG/ECoG data, many studies have shown that brain functional networks had small-world organization in healthy subjects (Bassett et al., 2009; Smit et al., 2008; Stam, 2004), and such a topology was disrupted in various neuropsychiatric disorders such as AD (de Haan et al., 2009; Stam et al., 2007), MCI (Buldu et al., 2011), schizophrenia (Jalili and Knyazeva, 2011; Micheloyannis et al., 2006; Rubinov et al., 2009), and epilepsy (Baccala et al., 2004; Horstmann et al., 2010; Ponten et al., 2007). In the future, the combination of multimodal imaging techniques including MRI, EEG/MEG/ECoG, and PET will provide integrative information which map out patterns of brain networks that underlie cognition and behaviors in human neuropsychiatric disorders.
Third, the stability and reproducibility of graph theoretical brain network metrics also attracts a great deal of attention. Recent DTI studies (Bassett et al., 2011; Vaessen et al., 2010) reported consistently high reproducibility of basic connectivities and several graph metrics in structural brain networks. In functional networks, high reproducibility of graph metrics (Buckner et al., 2009; He et al., 2009c; Telesford et al., 2010) and high reliability in local low-frequency fluctuations (Zuo et al., 2010a), ROI-based functional connectivity (Shehzad et al., 2009), independent components (Zuo et al., 2010b), and different strategies for confound correction (Braun et al., 2012) were also reported. However, in test-retest studies, the global networks metrics were sensitive and dependent on several factors, including scanning time interval, network membership, and network type (Wang et al., 2011). Park et al. (2012) revealed that the local brain networks are temporally stable but that long-range integration exhibits dynamic behavior throughout a day. These findings provide important implications on how to choose reliable analytical strategies and network metrics of interest. Taken together, the graph theoretical brain network analysis has acceptable reliability and reproducibility, but more systematic evaluation and improved methodology is still needed.
Fourth, there are a few articles discussed in this article that concentrate on the topological architecture of the large-scale neuronal networks during the performance of tasks. Bassett et al. (2009) found a positive correlation between the superior task performance of working memory and the cost efficiency of the β-band brain network. Wang et al. (2010b) revealed a longer path length in older adults in their investigation of an age-related functional network during memory encoding and recognition tasks. Many previous studies have shown cognitive function impairments in people with neurological and psychiatric disorders; however, studying the impaired brain networks under a task condition may offer new insights into the pathological reconfiguration of neuronal ensembles that underlie the changes of cognitive states. A directed network or a dynamic network model may better describe the information flow in the brain during task states. Although most graph theoretical studies model brain networks as simple undirected networks overlooking the information flow, the brain networks are actually regarded as directed networks within some of the regions sending information, while others receive information. Recent studies have taken these into account (Cecchi et al., 2007; Liao et al., 2011; Yan and He, 2011), and their results would be helpful to better understand the causes and effects of neuropsychiatric diseases. The brain networks are rapidly and continually adjusting to behavioral changes or cognitive demands (De Vico Fallani et al., 2008) or even switching to resting states (Chang and Glover, 2010; Kang et al., 2011). Modeling dynamic structural or functional networks in patients may facilitate the monitoring of disease course and recovery.
Fifth, we still know very little about how brain networks relate to individual characteristics and genetic factors. Li et al. (2009) and van den Heuvel et al. (2009b) demonstrated the correlation between network topological metrics and the intelligence quotient (IQ) in the structural and functional brain network, respectively. Interestingly, in both studies, the findings consistently revealed that the path length of the brain network had a strong negative correlation with IQ. Correlations were also observed between the cortical fiber connectivity of specific regions and cognitive functions such as processing speed, visuospatial, and executive functions (Wen et al., 2011b). Using resting state EEG, sMRI, and R-fMRI imaging data of twins, Smit et al. (2008), Schmitt et al. (2008), and Fornito et al. (2011) revealed genetic effects on network properties including clustering coefficient and cost efficiency. Of note, some neurological and psychiatric disorders are regarded to have links with a specific gene; for instance, the carriers of the APOE-4 gene are more vulnerable to suffer from AD. Accordingly, the relationship between brain network properties and individual traits and genetic factors is of great interest and should be investigated in the future.
Sixth, any disease has a gradual process of change. The topological organization of brain networks should change gradually at the conversion stage as the disease progresses (Bernhardt et al., 2011; Wang et al., 2010d). Longitudinal studies will be valuable in clarifying the progression of the disease and to evaluate treatment effects. Moreover, the specific topological alternations of structural or/and functional brain networks in distributed neurological and psychiatric disease might serve as potential biomarkers for disease diagnosis. A relatively high classification rate has been reached in AD (Dai et al., 2011; Supekar et al., 2008), MCI (Wee et al., 2011), and epilepsy (Raj et al., 2010). Particularly, the co-morbidity of the diseases confounds diagnosis and treatment strategies, leading to a limited treatment effect. For instance, depression and schizophrenia commonly occur simultaneously in adolescents. The challenge of how to establish meaningful biomarkers for clinical use will still require tremendous efforts.
Finally, the collection and distribution of neuroimaging data are necessary and momentous for the investigation of structural and functional brain connectivity in diseases. There are several MRI neuroimaging databases of normal healthy people, such as fMRIDC (
Conclusion
Taken together, the accumulating evidence suggests that applying graph theoretical approaches to neuroimaging data offers new insight into the topological principles and pathological fundamentals of brain networks in neurological and psychiatric disorders. Combined with advances in brain imaging techniques and improved multiple analytical approaches, future studies in neurological and psychiatric disorders may further uncover the biological substrates underlying brain connectivity and provide clinical diagnostic assistance for such diseases.
Footnotes
Acknowledgments
This work was supported by the Natural Science Foundation of China (Grant Nos. 81030028 and 30870667), Beijing Natural Science Foundation (Grant No. 7102090), and the Scientific Research Foundation for the Returned Overseas Chinese Scholars (State Education Ministry, YH).
Author Disclosure Statement
No competing financial interests exist.