
Abstract
Structural and functional connectivity are intrinsic properties of the human brain and represent the amount of cognitive capacities of individual subjects. These connections are modulated due to development, learning, and disease. Momentary adaptations in functional connectivity alter the structural connections, which in turn affect the functional connectivity. Thus, structural and functional connectivity interact on a broad timescale. In this study, we aimed to explore distinct measures of connectivity assessed by functional magnetic resonance imaging and diffusion tensor imaging and their association to the dominant electroencephalogram oscillatory property at rest: the individual alpha frequency (IAF). We found that in 21 healthy young subjects, small intraindividual temporal IAF fluctuations were correlated to increased blood oxygenation level-dependent signal in brain areas associated to working memory functions and to the modulation of attention. These areas colocalized with functionally connected networks supporting the respective functions. Furthermore, subjects with higher IAF show increased fractional anisotropy values in fascicles connecting the above-mentioned areas and networks. Hence, due to a multimodal approach a consistent functionally and structurally connected network related to IAF was observed.
Introduction
T
The notion that FCNs are directly or indirectly structurally connected by neural fiber bundles suggests that FCN activity and synchronization represent ongoing information exchange within these distributed networks. Baria and colleagues (2011) found that distinct FCNs display characteristic oscillatory activity. However, these oscillations are in the low-frequency domain of blood oxygenation level-dependent (BOLD) signal fluctuations that represent a delayed and dispersed metabolic reaction of altered neural demands and thus are not compatible with the fast oscillatory properties of neuronal assemblies. The feasibility to simultaneously record EEG and fMRI has opened the opportunity to investigate the relationship between the functional connectivities and signal fluctuations observed on these two different temporal scales (Jann et al., 2009, 2010b). The dominant EEG oscillatory property at rest lies in the alpha frequency range (8–12 Hz) and can be characterized as the individual alpha frequency (IAF). There are two recent studies exploring the association between IAF and either function or structure (Jann et al., 2010a; Valdes-Hernandez et al., 2010). The latter study found that subjects with higher IAF exhibit higher DTI fractional anisotropy (FA) values in specific fascicles (posterior corpus callosum, inferior frontooccipital, and inferior longitudinal fascicle) connecting left and right hemispheres or providing frontoposterior connections that are important for brain function integration (Valdes-Hernandez et al., 2010). Furthermore, IAF is correlated with higher cerebral blood flow in brain areas involved in attentional modulation and preparedness (Jann et al., 2010a). Recent empirical validation of theoretical models for alpha generation concluded that white matter properties like connectivity strength and delay times are major determinants for alpha frequency oscillations (Valdes-Hernandez et al., 2010), whereas global determinants such as brain size and cortical surface area as proposed earlier (Nunez et al., 1978) are less important.
Connectivity strength is proportional to the fiber density of given connections (Iturria-Medina et al., 2007), while the delay time is determined by conduction velocity that depends on the cross-sectional proportion of an axon occupied by myelin (Goldman and Albus, 1968; Rushton, 1951; Sabah, 2000). DTI FA values are modulated by these two properties of the fiber bundles; however, proper separation of their influences is not straightforward. Yet the three principal diffusion eigenvalues have recently received more attention in DTI research besides the conventional measure of FA. Changes in axial diffusivity (AD; diffusivity parallel to the axon fibers) may be related to axonal alterations (Budde et al., 2007; Song et al., 2002, 2003, 2005; Sun et al., 2006); whereas radial diffusivity (RD; diffusion perpendicular to the axonal fibers) may be more sensitive to changes in myelination as it has been shown in animal studies and as well in human aging studies (Bennett et al., 2010; Budde et al., 2007; Nair et al., 2005; Song et al., 2002, 2003, 2005). Thus, FA is interpreted as the integrity of white matter representing the amount of microstructural organization of fiber tracts. Further information of this organization is indicated by the respective RD/AD values constituting the FA.
In this work, we aimed at integrating the individual measures extracted from EEG, fMRI, and DTI in order to enhance insight into the above-mentioned behavioral and physiological variables and their interrelation. To this end, we performed simultaneous EEG-fMRI recordings in 21 healthy young subjects with subsequent structural acquisition of white matter (using DTI). This allowed assessing intra- and interindividual IAF fluctuations and correlating them to simultaneous fluctuations in the fMRI BOLD signal to reveal the brain areas related to IAF. The resulting pattern of functionally correlated brain areas could then be compared to FCNs related to distinct sensory or cognitive functions. Furthermore, we could correlate the individual mean IAF (m-IAF) to the FA, AD, and RD values to delineate the structural substrate of interindividual IAF differences.
Materials and Methods
Subjects
Twenty-one healthy young subjects participated in the study (10 women/11 men; mean age±standard deviation: 26.2±2.6 years) and gave their written informed consent. Exclusion criteria were as follows: any current or previous neurological or psychiatric disorder, intake of psychotropic medication or psychoactive substances (e.g., caffein, nicotine, or alcohol less than 6 h before measurement), as well as standard exclusion criteria for MRI investigations. The study was approved by the ethics committee of the Canton of Bern, Switzerland.
Recoding and preprocessing of datasets
Electroencephalogram
First, we recorded a 92-channel eyes-closed-resting-state EEG outside the scanner (5 kHz sampling rate, 16.3 mV input range, bandpass filter 0.1–250 Hz, impedance below 50 kΩ; BrainAmp MR, Brain Products, Gilching, Germany). This recording lasted ∼6 min. After this recording, the subjects were placed inside the scanner for simultaneous EEG-fMRI acquisition. During recording, subjects remained with their eyes closed and were instructed not to fall asleep. The EEG recorded inside the scanner is generally contaminated with artifacts related to the switching of read-out gradients of the magnetic resonance (MR) scanner (MR-pulse artifact) and artifacts associated with small head movements caused by the heartbeat (cardioballistic artifact [CBA]) besides the usual eye-movement and muscular artifacts. These specific scanner-related artifacts were corrected using previously described procedures (Jann et al., 2009). The MR-pulse artifact was eliminated by subtracting an average MR-pulse template (Allen et al., 1998, 2000) and the CBA was removed by an ICA approach (after resampling the EEG to 250 Hz to keep the computation feasible). Further preprocessing was similar for the outside and inside EEG and included visual inspection and rejection of epochs with artifacts, bandpass filtering between 1 and 30 Hz, and segmentation of the EEG into 2-sec epochs for the outside-EEG and 1980 msec epochs corresponding to single MR-volumes for the inside-EEG, respectively. All EEG preprocessing was performed in VisionAnalyzer (1.05.0005; Brain Products, Gilching, Germany).
Magnetic resonance imaging
fMRI data were acquired on a 3T Siemens Magnetom Trio Scanner (Siemens, Erlangen, Germany) using an echo-planar imaging (EPI) sequence with a circumpolar head coil and the following parameters: 252 volumes, 32 slices, gap thickness=0.75 mm, matrix size=64×64, field of view (FOV) 192×192 mm2, and repetition time (TR)/echo time (TE)=1980/30 msec. Preprocessing was performed in BrainVoyager QX (10.6; Brain Innovation, Maastricht, The Netherlands) and involved slice scan-time correction, three-dimensional (3D) motion detection and correction, removal of low-frequency drifts, and spatial smoothing with an 8-mm FWHM Gaussian Kernel.
After the simultaneous EEG-fMRI recording, T1-weighted anatomical images were acquired with a 3D modified driven equilibrium Fourier transform sequence (Deichmann et al., 2004) with a 12-channel head coil (176 sagittal slices, slice thickness=1.0 mm, FOV 256×256 mm2, TR/TE=7.92/2.48 msec, Flip angle=16°, inversion with symmetric timing [inversion time=910 msec], and fat saturation). Finally, DTI was performed with a spin echo EPI using two 180° pulses (TR/TE=6800/93 msec, matrix size=128×128, FOV 256×256 mm2, 50 slices, slice thickness=2 mm, gap thickness=0 mm, and pixel bandwidth 1346 Hz/pixel). The trapezoidal diffusion sensitizing gradients were applied around the two 180° pulses at b-value of 0 sec/mm2 and at a maximal b-value of 1300 sec/mm2 along 42 noncollinear directions. The calculation and diagonalization of the diffusion tensors were based on the multivariate regression approach (Basser et al., 1994). Six independent elements of the diffusion tensor were extracted (Basser and Pierpaoli, 1996). Eigenvalues and eigenvectors were determined for each voxel, and FA, RD, as well as AD values for each voxel were computed resulting in FA, RD, and AD maps, respectively.
The BOLD and the FA maps were then coregistered to the structural images using the scanner's slice position parameters of the BOLD and DTI measurements and the T1-weighted anatomical measurements. During this step the resolution of these BOLD and FA maps was resampled to voxel dimensions of 3×3×3 mm3 and 2×2×2 mm3, respectively. BOLD and FA maps were transformed into Talairach space (Talairach and Tournoux, 1988).
Statistical data analysis
A schematic overview that should aid to follow the combinations of measures from the three different modalities (EEG, fMRI, and DTI) is provided in Supplementary Figure S1 (Supplementary Data are available online at
IAF estimation and correlation
IAF was estimated as the frequency-position of the global center of gravity (CoG) either in the single epochs of the segmented EEG resulting in a vector of IAF fluctuations over time (temporal IAF [t-IAF]) or in the mean frequency spectra of all epochs, the m-IAF. The CoG in a multichannel EEG spectrum was defined as follows (Jann et al., 2010a):
where f i is the i-th frequency bin above 8 Hz (frequency resolution of the fast Fourier transformation [FFT] was 0.5 Hz), n is the number of frequency bins between 8 and 12.5 Hz (the EEG alpha frequency band), v is the spectral amplitude at electrode j and frequency bin i, and m is the number of electrodes. Note that the CoG's unit is Hz; this measure is thus substantially different from the spectral amplitude/power since it reflects another characteristic of the alpha band, namely, the frequency at which the subject's alpha oscillates rather than the magnitude of this oscillation.
t-IAF–fMRI BOLD correlation
Intraindividual variability of IAF across time (t-IAF; i.e., the IAF calculated for each fMRI volume) were convolved with a standard hemodynamic response function and used to predict the fMRI BOLD signal in a random-effects general linear model (GLM). Statistical maps were thresholded at p<0.002 and corrected for type I errors at α<0.05 by estimation and application of a minimal cluster size threshold (Forman et al., 1995). The spectral power within the alpha range and its association to the fMRI BOLD were already published elsewhere for subsets of the subjects [(Jann et al., 2009): 16 subjects; (Jann et al., 2010b): 20 subjects].
m-IAF–DTI FA, AD, and RD correlation
The subjects' m-IAFs were voxel-wise correlated to the respective FA, AD, and RD maps. To visualize the results, the maps display voxels reaching a significant correlation (| r(20) |>0.42; p<0.05; corrected for type I errors at α<0.05 by estimation and application of a minimal cluster size threshold (Forman et al., 1995).
Resting-state networks
In the fMRI datasets, we also computed several FCNs. This computation was done by means of ICA in BVQX (Esposito et al., 2005). Individual datasets were decomposed into 30 independent components that were then subjected to a hierarchical clustering algorithm implemented in BVQX as self-organizing group ICA (sogICA). The sogICA algorithm clustered the 30 components of each individual into group components (GC) according to their spatial similarity (SS, i.e., the spatial correlation coefficient of the 3D distribution of their activation patterns), respectively, their dissimilarity based on Euclidian distances. Seven GCs exhibited a mean SS above 0.2. They represent the Default Mode Network (DMN), the Frontoparietal Control Network, the left and right Working Memory Networks (LWMN/RWMN), the Occipital Visual Network, the Somato-Motor Network, and the Auditory Cortex Network (Cole et al., 2010; Damoiseaux et al., 2006; De Luca et al., 2006; Jann et al., 2010b). Finally, we computed the SS between the random effects GLM t-IAF-BOLD correlation map and the seven FCNs. Statistical significance of the similarity was tested by randomization statistics following the approach by Patel and associates (2006) and is briefly reviewed here. The t-IAF-BOLD correlation map was used to generate 399 surrogate maps with the same significance values and spatial frequency of their distribution (Britz et al., 2010; Patel et al., 2006). For each of these surrogate maps and FCN combinations, the SS was computed. The resulting SS values were ordered in a descending manner. The threshold for significance (p<0.05) is then equivalent to the SS value greater than that of the 20th element.
DTI fiber tracking
To approximate the structural connections between the clusters of the resting state networks, we performed a fiber-tracking analysis using the preprocessed DTI datasets. The eigenvalues and eigenvectors were calculated at each voxel and the clusters of either resting state network (DMN and LWMN) were used as seed areas for the deterministic iterative tracking algorithm implemented in the BVQX DTI toolbox. The fiber tracking was limited to region-to-region connectivity where a fiber was tracked between the regions starting at either seed region (ROI2ROI and vice versa). FA/projection/angle thresholds were 0.15/0.4/60. Step size for the iterative tracking algorithm was set to 0.5, and seed range and seed density were 1.5 and 5^3 voxels, respectively.
Results
t-IAF-BOLD correlates and FCNs
The voxel-wise random effects GLM analysis of t-IAF with the fMRI BOLD signal revealed a symmetrical correlation pattern of significant positive correlations (p<0.002, corrected for type I errors at α<0.05 using a cluster-size threshold comprising a volume of 162 mm3) in the superior and inferior frontal gyri, the middle temporal gyri, and the anterior and posterior cingulate cortices (Fig. 1 and Table 1). The second analysis highlighted a significant SS of the t-IAF-BOLD correlates with the DMN (SS 0.26) and the two WMN (SS 0.30 and 0.13 for the LWMN and the RWMN, respectively). These SS values between IAF correlates and FCNs were found to be significant based upon the randomization statistic using surrogate maps (thresholds were DMN 0.22, LWMN 0.11 and RWMN 0.07, respectively). The SS calculated for the other four FCNs did not reach the respective thresholds.
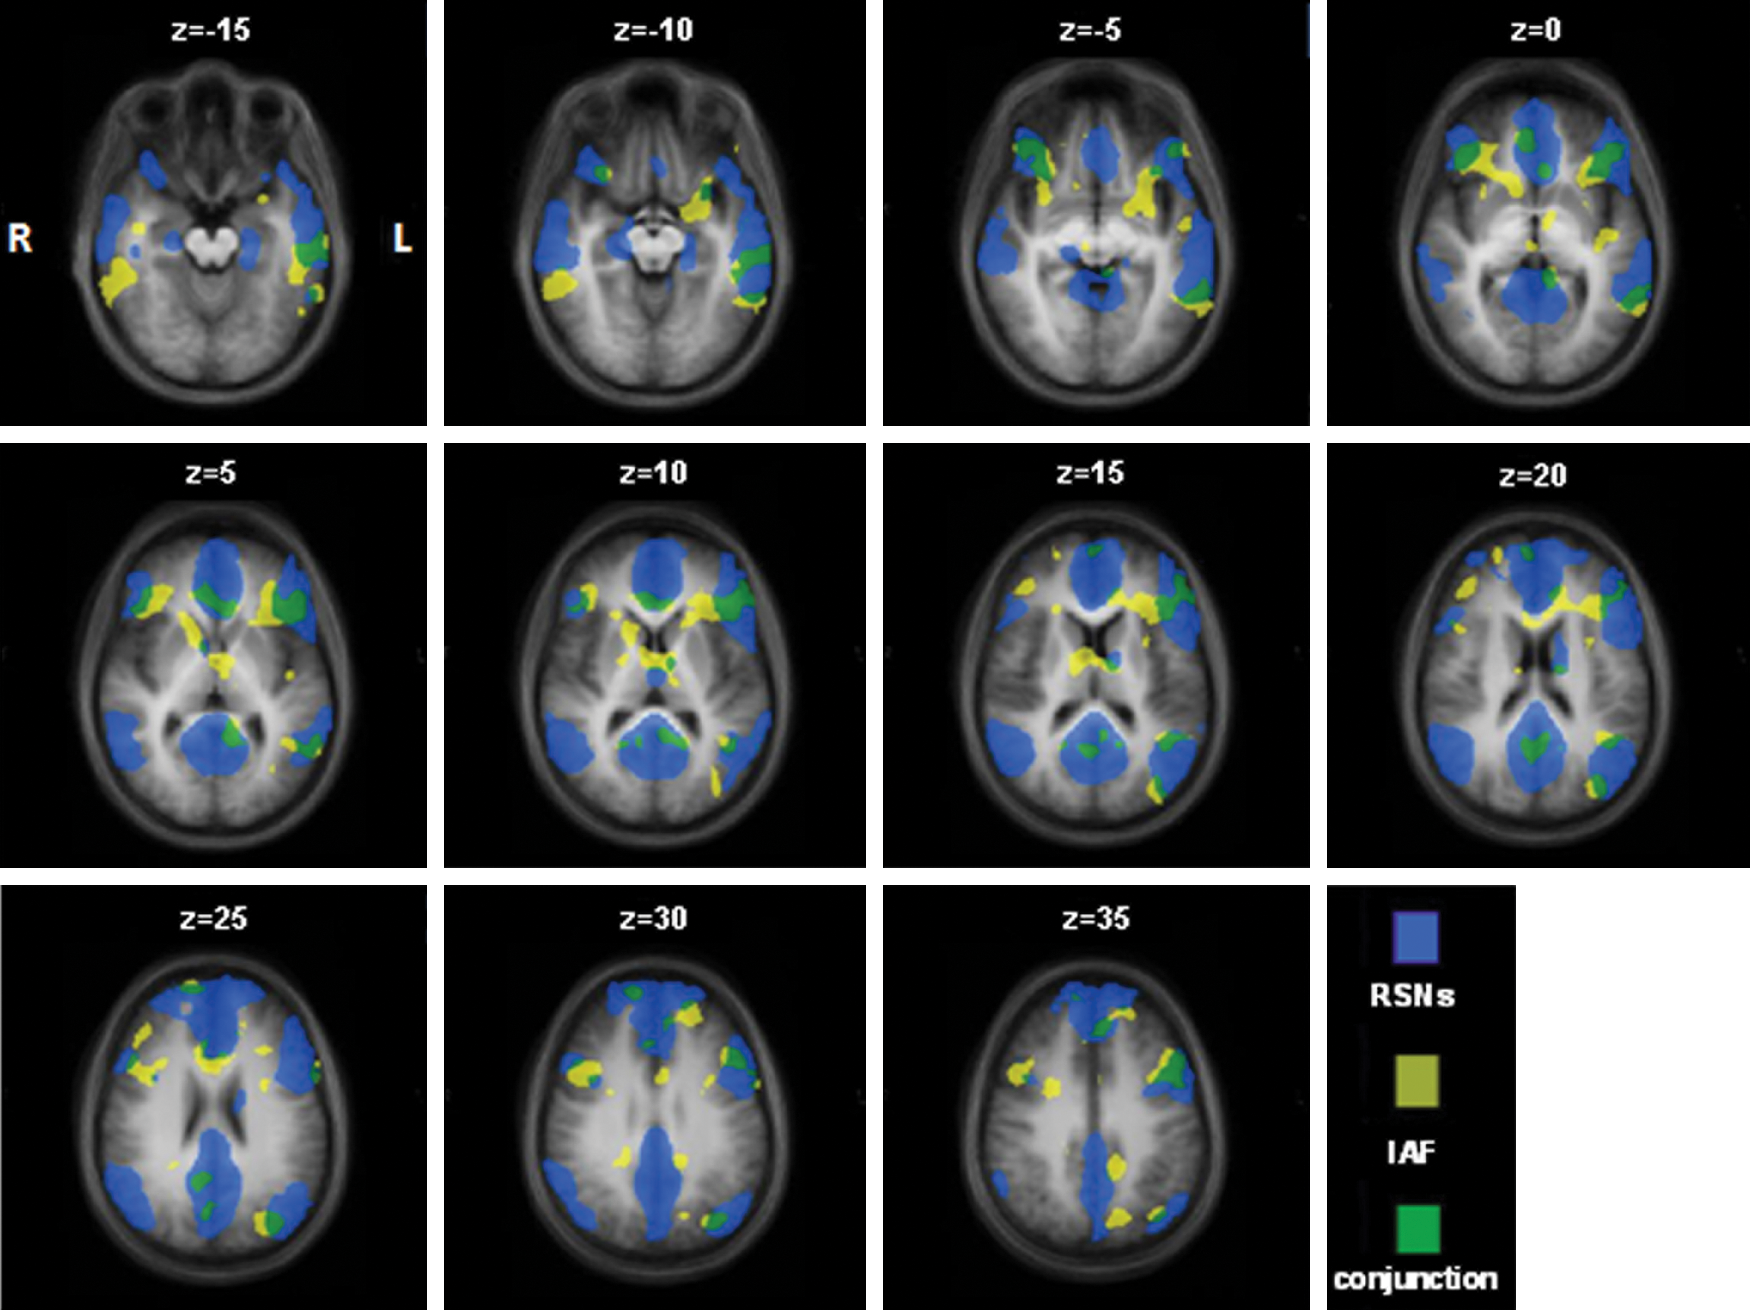
Illustration of the spatial overlap (green) between the combined functionally connected networks (blue; combination of default mode network [DMN], the left and right Working Memory Networks [LWMN and RWMN]) and the temporal-individual alpha frequency (t-IAF) blood oxygenation level-dependent correlates (yellow; note: random effects general linear model with p<0.01 corrected at α<0.05).
p<0.002; spatial extent threshold 162 mm3 equaling type I error correction at α<0.05.
SD, standard deviation; BA, Brodmann area.
m-IAF correlated to FA, RD, and AD maps
We found significant positive correlations of m-IAF with white matter (p<0.05 after type I error correction with α<0.05=cluster size threshold comprising a volume of 512 mm3) in the genu and the splenium of the corpus callosum and the right superior longitudinal fascicle (SLF; Table 2 and Fig. 2). Interestingly, these correlations delineated fascicles that connect the core regions of the FCNs (Damoiseaux and Greicius, 2009; Jann et al., 2009), in particular of the DMN and the two WMNs. The correlation pattern of m-IAF to RD and AD were strikingly similar to the one with FA and both were as well positively correlated (Fig. 2).

Axial slices displaying the correlation pattern between mean IAF and fractional anisotropy (FA), axial diffusivity (AD), and radial diffusivity (RD), respectively (p<0.05 r(20)=0.42, corrected at α<0.05).
p<0.05; spatial extent threshold>512 mm3 equaling type I error correction at α<0.05. Fiber identification based on Wakana and associates (2004).
DTI fiber tracking within FCNs
Using the clusters of the LWMN and the DMN, we could identify the structural connections of the networks. Figure 3 displays the 3D reconstruction of the cumulative fibers of all subjects and the seed regions as surface clusters for both networks separately.
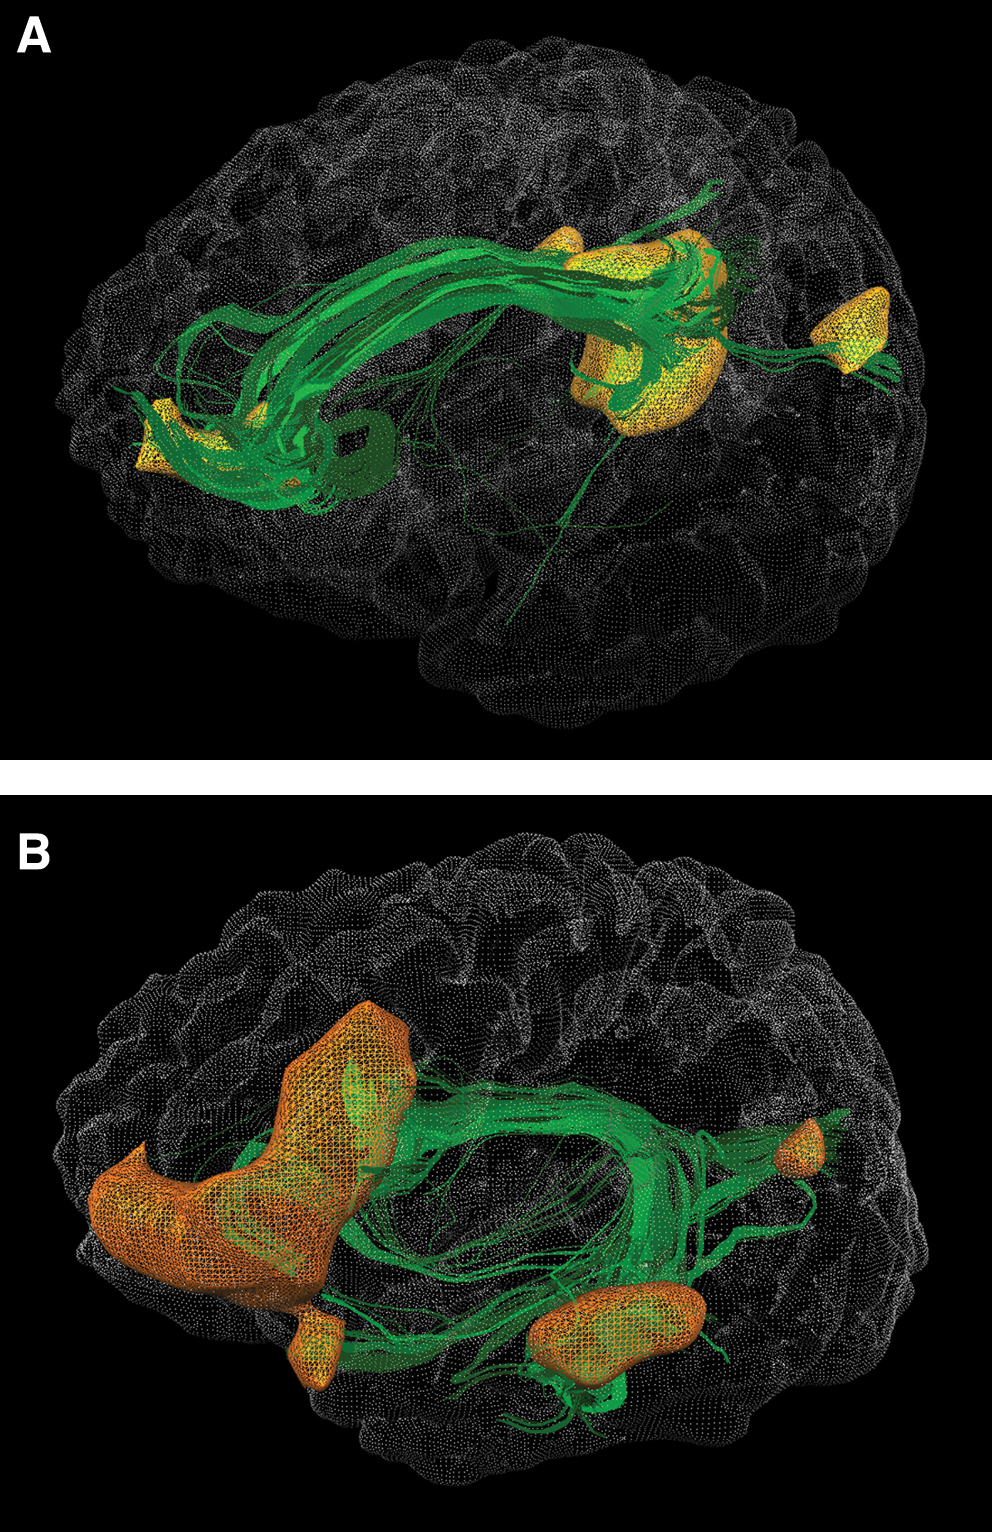
Three-dimensional reconstruction of the cumulative fibers of all subjects and the seed regions as surface clusters for DMN
Discussion
The present study investigated the interrelation of individuals' connectomes across different timescales. Millisecond synchronization of neuronal oscillations (as assessed by the EEG IAF), networks of hemodynamic coactivation that are organized within seconds (as measured by the fMRI BOLD signal), and the structural connections (as measured with DTI) that underlie the functional connectivities in EEG and fMRI were put into a common frame.
In one group of analyses, the t-IAF were correlated to fluctuations of the BOLD signal to explore the brain network that is associated with t-IAF changes. In parallel, we identified FCN in fMRI BOLD data by ICA and compared them to the identified t-IAF-BOLD pattern. The t-IAF-BOLD correlates overlapped significantly with three FCNs: the DMN and the LWMN and RWMNs. The DMN is known to be related to attention, (error)-monitoring, and self-reference (Begre et al., 2008; Walther et al., 2011), while LWMN and RWMNs relate to working memory (Damoiseaux et al., 2006). This is interesting because there is also a functional overlap: alpha-band EEG activity has often been related to attention and working memory functions.
To identify the substrate of interindividual IAF differences in terms of structural connectivity, we computed voxelwise correlations between the subjects' m-IAF and indices of white matter properties such as FA, AD, and RD values. We found significant positive correlations in the genu and the splenium of the corpus callosum and the SLF. These fiber bundles connect nodes of the FCNs that were associated with the IAF. An additional DTI fiber-tracking analysis could show that these fiber bundles were indeed connecting clusters of these FCNs. Our fiber-tracking results were also well in line with findings by other groups [DMN (Skudlarski et al., 2008; Teipel et al., 2010) and LWMN/RWMN (van den Heuvel et al., 2009)] and support the notion of communality of the functional and structural connectivities within these networks.
These results largely coincide with a previous study on IAF correlations with white matter structures reported by Valdes-Hernandez et al. (2010). The major difference between the two studies is that we did not find any significant negative correlation between IAF and FA values, whereas Valdez-Hernandez found negative correlations of FA in the inferior splenium of the corpus callosum while tapetum and isthmus showed positive associations with IAF. This is in contrast to our finding of positive correlations in the splenium of the corpus callosum. These differences may be explained by methodological differences of the two studies. While computing the IAF from the whole electrode set (Valdes-Hernandez et al., 2010), we used a reduced set of two occipital electrodes O1/O2 only. Accordingly, their IAF most likely represents occipital alpha, while in the present study more widespread global alpha activity was assessed. The IAF is sometimes discussed as an epiphenomenon representing the superposition of several alpha rhythms occurring during rest with distinct topographies (Klimesch, 1997). In two own recent studies—with largely overlapping subject cohorts—we found support for this view as we correlated lower and upper alpha band power as well as a synchronization index with BOLD fluctuations (Jann et al., 2009, 2010b). In the first study we revealed an association of global alpha band synchronization and power to two distinct FCNs, namely, the DMN for upper alpha and the frontoparietal network for lower alpha. Furthermore, the second study explored the association of FCN fluctuations to the topography of EEG power fluctuations in different frequency band. Notably, the topographies for upper and lower alpha were significantly different for the DMN, the LWMN, and RWMNs and the visual networks. In addition, the correlation had an opposite sign for different networks at the same electrode and frequency band. Furthermore, there is evidence for rivalry for resources between networks (Kelly et al., 2008) that suggest that efficiency in one network might be detrimental for others. Based on these observations Valdez-Hernandez’ correlation pattern might most likely reflect the occipital alpha rhythm originating in visual cortices, highlighting correlations to FA in the fiber bundles connecting the visual areas, whereas we assessed IAF globally across all electrodes and thus probably increased our sensitivity to the processes related to more extended networks such as the DMN and LWMN/RWMNs.
The findings of positive correlations of FA with m-IAF within the genu and splenium of the corupus callosum and the right SLF show a relationship between functional activities in the range of milliseconds with structural properties of white matter. Given that FA represents integrity in these specific tracts, our findings suggest a more efficient information exchange between the areas of the functional networks with increasing IAF. Since axonal diameters as well as myelination are influencing conductance velocity along the axon (Madden et al., 2004; Ritchie, 1982; Sabah, 2000; Tuch et al., 2005; Waxman, 1980), it would be of great interest to have measures that separate these two factors. FA has been suggested to represent an indirect measure of the integrity of white matter, to which the myelination of axons as well as ordered and dense packing of fiber bundles contribute. Thus, it is difficult to disentangle the contributions of different microstructural characteristics in white matter using FA (Beaulieu, 2002). Therefore, more information, such as the diffusivities parallel (AD) or perpendicular (RD) to the fibers, might be helpful to see whether AD or RD or both together contribute to changes in FA. Previous studies found that AD alterations were more associated with axonal changes (Song et al., 2003) and RD alterations rather with myelination changes (Sun et al., 2006). The findings that AD and RD correlated positively with m-IAF at the same locations show that diffusion along the primary axis and the perpendicular axis seems to have a relationship with m-IAF. It might seem surprising that RD is correlated positively with the m-IAF, since degeneration studies have shown that loss of myelination often relates to increases in RD. The locations of these degenerative findings are—among others—situated in the corpus callosum. The corpus callosum is considered the most ordered white matter structure; however, it is also displaying great microstructural heterogeneity encompassing axons of different size, an unevenly spaced extracellular matrix and glial cells of different shapes and sizes (Assaf and Gohen, 2009). Since positive correlations of RD with m-IAF coincide with positive correlations of AD and FA with m-IAF, this indicates also greater mean diffusivity. The finding that the m-IAF correlates positively in the same regions with AD, RD, and FA indicates that the increased FA level is more likely to be due to high AD values. Animal studies comparing histology in various areas of the brain with DTI scalar measures showed that AD positively correlates with the axons' diameter (Harsan et al., 2006; Schwartz et al., 2005), with the fractional axonal area over the fiber area and with the count of myelinated axons (Wu et al., 2007). This last structural characteristic was also found to correlate positively with FA. Furthermore, the study of Mäder and associates (2008) showed an overlap of myelin water fraction with FA values in the splenium of the corpus callosum, which corroborates the findings of positive correlation between FA and m-IAF, suggesting faster signal conductance within thicker myelinated axons.
In this view, our data thus suggest that the IAF as implemented here represents a global rate of information transfer between distributed networks. In individuals with higher FA the microstructural organization of the tract might support faster nerve conduction in the networks they connect.
Furthermore, the BOLD correlates of IAF were positive in three networks, the DMN involved in attentional modulation and the LWMN and RWMNs associated to working memory. Hence, we might speculate that individual differences of the activity of these networks and the efficiency of the information exchange might result in better performance in specific tasks. This notion is supported by a recent review on brain areas associated with intelligence where the same areas and fascicles were discussed as important substrates of interindividual differences (Deary et al., 2010).
Indeed, the IAF is discussed as a putative marker for subjects' overall cognitive abilities (Anokhin and Vogel, 1996; Doppelmayr et al., 2002), speed of information processing (Klimesch et al., 1996), and attention (Klimesch et al., 1993, 1996). Moreover, IAF has been found to reflect subjects' performance in a diversity of cognitive tasks (Klimesch, 1996; Surwillo, 1963), especially in working memory tasks (Klimesch et al., 1993; Richard Clark et al., 2004). Our results as well as the results by Valdes-Hernandez and colleagues (2010) and Jann and colleagues (2010a) support this literature on IAF as a marker for working memory performance and attention by demonstrating an association of IAF, on the one hand, with white matter tracts between, and, on the other hand, activity in terms of functional connectivity within the respective cognitive networks. Similar findings were made in a previous study suggesting increased metabolism (in terms of absolute cerebral blood flow) in networks modulating attention in association to IAF (Jann et al., 2010a). Interestingly, the IAF correlates with absolute cerebral blood flow were at similar locations as those comprised by the two WMNs in this study. Specifically, in the inferior frontal gyrus bilaterally BOLD as well as blood flow showed a positive association to IAF. Besides correlations to IAF we also investigated the temporal correlations between alpha power and the BOLD signal and its overlap with ICA-defined FCNs (Jann et al., 2009). Comparable to IAF, alpha power was also correlated to the BOLD signal in areas of the DMN and a frontoparietal network. Thus, taken together, there seems to be a physiological association between blood flow, BOLD signal fluctuations, and EEG features in the alpha band (IAF and power) in networks relevant for specific tasks involving attention and working memory.
Further support of the view of an association to task performance is provided by studies that demonstrated a relation of FA (within association fascicles) with reaction time (Konrad et al., 2009), cognitive performance (Madden et al., 2009; Moseley et al., 2002; Sasson et al., 2010), and mental disorders (Begre et al., 2008). Our results of the present study, together with previous work, indicate that transient activity of FCNs is related to baseline activity of the same FCNs, and structural connectivity within those FCNs. This possibly mutual influence across widely different time-scales may account, on the one hand, for training effects but, on the other hand, also for a loss of function due to decreased structural connectivity.
Neurofeedback on the EEG alpha frequency has positive effects on cognitive performance (Angelakis et al., 2007; Hanslmayr et al., 2005), and working memory training has been shown to increase FA values (Takeuchi et al., 2010) in some of the regions where we found FA correlates of IAF. On the other side, EEG slowing is observed in patients with dementia (Hubl et al., 2004; Moretti et al., 2004) as well as in schizophrenia (Boutros et al., 2008; Galderisi et al., 2009). Both patient groups display functional deficits in working memory as well as alterations in structural connections. Demented patients display decreased structural integrity in the posterior corpus callosum (Teipel et al., 2008) and disruptions of DMN functional connectivity have been reported (Greicius, 2008). In schizophrenia, two regions with decreased structural integrity are consistently reported: the anterior part of the corpus callosum and an area in the left temporal lobe white matter (Camchong et al., 2009; Ellison-Wright and Bullmore, 2009), indicating a disconnection of gray matter areas. Additionally, in schizophrenic patients a dysregulation of the WMN and the DMN was observed during a working memory task (Federspiel et al., 2006). Taken together, the fasciles connecting the regions within the DMN and the WMN show decreased integrity in disease and the networks themselves display a reduced functionality, which may explain the cognitive impairment. In the present study we were able to demonstrate an interrelation between exactly these networks, the integrity of their connective fascicles, and the IAF as marker for cognitive capacities during rest.
However, the main limitation of this study is the lack of a direct behavioral measure of the subjects' cognitive capacities or task performance. Thus, the assumption that IAF, as we have measured it in our subjects, might be a marker for cognitive capacities remains speculative. We recommend that future studies on resting state data should conduct an extensive testing of the subjects' cognitive capacities.
Conclusion
Our data link a direct electrophysiological marker for global rate of neuronal oscillations to a set of well-known cognitive networks and underlying structural connections that are typically associated with attention, working memory, information integration, or error monitoring. The associations found in transient, intraindividual fluctuations of brain state were strikingly similar to those found in trait-related, interindividual structural differences. Our study therefore suggests that the measures and their combination employed here may be suited to study the mutual effects of (transient) usage of brain networks during higher order cognitive processing, and long-term modulations of the baseline activity and structural connectivity within these networks. Further research will have to show whether similar observations can be made in clinically distinct populations, and how the functional and structural markers identified here are related to individual differences in cognitive deficits, or usage and training.
Footnotes
Acknowledgments
We thank Simon Schwab for his help in manuscript preparation. This study was partially financed by the Swiss National Science Foundation (SNSF) Grant 320000-108321/1.
Author Disclosure Statement
No competing financial interests exist for any of the authors.
References
Supplementary Material
Please find the following supplemental material available below.
For Open Access articles published under a Creative Commons License, all supplemental material carries the same license as the article it is associated with.
For non-Open Access articles published, all supplemental material carries a non-exclusive license, and permission requests for re-use of supplemental material or any part of supplemental material shall be sent directly to the copyright owner as specified in the copyright notice associated with the article.