
Abstract
Recently, carriers of a common variant in the autism risk gene, CNTNAP2, were found to have altered functional brain connectivity using functional MRI. Here, we scanned 328 young adults with high-field (4-Tesla) diffusion imaging, to test the hypothesis that carriers of this gene variant would have altered structural brain connectivity. All participants (209 women, 119 men, age: 23.4±2.17 SD years) were scanned with 105-gradient high-angular-resolution diffusion imaging (HARDI) at 4 Tesla. After performing a whole-brain fiber tractography using the full angular resolution of the diffusion scans, 70 cortical surface-based regions of interest were created from each individual's co-registered anatomical data to compute graph metrics for all pairs of cortical regions. In graph theory analyses, subjects homozygous for the risk allele (CC) had lower characteristic path length, greater small-worldness and global efficiency in whole-brain analyses, and lower eccentricity (maximum path length) in 60 of the 70 nodes in regional analyses. These results were not reducible to differences in more commonly studied traits such as fiber density or fractional anisotropy. This is the first study that links graph theory metrics of brain structural connectivity to a common genetic variant linked with autism and will help us understand the neurobiology of the circuits implicated in the risk for autism.
Introduction
M
The recently discovered autism risk gene, CNTNAP2, encodes CASPR2, or contactin-associated protein-like 2, a member of the neurexin superfamily of transmembrane proteins. CASPR2 is involved in clustering voltage-gated potassium channels (Kv1.1) at the nodes of Ranvier (Strauss et al., 2006; Vernes et al., 2008). CASPR2 has a suggested developmental role as a cell adhesion molecule responsible for neuroblast migration and laminar organization (Arking et al., 2008; Bakkaloglu et al., 2008; Vernes et al., 2008). In a study of an Amish family, a deletion mutation in CNTNAP2 was linked with a disorder with many hallmarks of autism, involving seizures, language difficulties, and impaired social abilities (Strauss et al., 2006). Subsequent research in both autistic and language-impaired (but nonautistic) populations has discovered further support that CNTNAP2 is associated with autism (Alarcón et al., 2008; Arking et al., 2008; Bakkaloglu et al., 2008) and language ability (Alarcón et al., 2008; Vernes et al., 2008). A recent study characterizing CNTNAP2 knockout mice found behavioral deficits characteristic of autism—namely, seizures—as well as neuronal migration abnormalities, reduced interneuron density, and abnormal neuronal network activity (Peñagarikano et al., 2011). CNTNAP2 expression is highest in the frontal and temporal lobes (Abrahams et al., 2007; Arking et al., 2008; Bakkaloglu et al., 2008; Vernes et al., 2008), areas responsible for language abilities, particularly in the left hemisphere (Baynes et al., 1998), supporting the link between CNTNAP2 and language function. Stein et al. (2011) found that a CNTNAP2 SNP (rs2710102) was associated with increased risk for selective mutism, an anxiety disorder in which a child is unable or unwilling to speak in certain situations, despite having normal language abilities in other situations. This disorder is similar, in some respects, to autism; they both involve characteristic deficits in language and social interactions.
In a recent analysis of functional brain connectivity using functional MRI, Scott-Van Zeeland et al. (2010) compared risk and nonrisk allele carriers of CNTNAP2 (rs2710102) in a cohort consisting of both autistic and typically developing children. Children with the genetic risk allele did not show the same left-lateralized pattern of medial prefrontal cortex connectivity as noncarriers. This association was consistent with previous research linking CNTNAP2 to language ability. Scott-Van Zeeland et al. also found stronger long-range anterior-posterior connections in the nonrisk subjects and stronger short-range frontal lobe connectivity in the at-risk subjects. Since short-range connections are typically pruned and long-range ones are strengthened over the course of development (Dosenbach et al., 2010; Huttenlocher, 1990), this may be evidence of delayed development in those at risk.
The graph theory can quantify brain connectivity at the network level. This branch of mathematics—for describing and analyzing graphs—examines brain networks as collections of nodes (i.e., specific brain regions) and edges (connections between those regions) (Sporns et al., 2004). The complex web of brain structural or functional connectivity may be quantified using a number of key parameters that summarize network characteristics. Path length, for example, is a measure of the distance (i.e., number of edges) between one brain region and another (Rubinov and Sporns, 2010). A network with a shorter average path length is considered more efficient in terms of information transfer (Bullmore and Sporns, 2009). We recently found these metrics to be heritable in this same sample (Dennis et al., 2011).
Here, we set out to investigate how variations in a CNTNAP2 SNP (rs2710102) might relate to graph theoretical measures from diffusion-weighted MRI. Further impetus for this work came from a recent report that found an association between a different CNTNAP2 SNP (rs7794745) and FA (Tan et al., 2010). Tan et al. (2010) found lower FA in individuals homozygous for the risk allele in a number of regions implicated in autism, including the cerebellum, fusiform gyrus, occipital, and frontal cortices. Given this previous success in linking a different CNTNAP2 SNP with structural connectivity, we decided that this might be a promising method for understanding the results of Scott-Van Zeeland et al., who found an association between our CNTNAP2 SNP (rs2710102) and alterations in functional connectivity. Functional and structural connectivity are closely related, with functional connectivity existing between areas that are structurally connected; yet functional connections may exist where no structural connections exist (Honey et al., 2009). Results from these different modalities may assess different types of connectivity, but they are complementary and together generate a more complete picture of brain networks. In some cases but not others, differences in functional synchronization may be explained by detectable differences in structural connections. Additionally, findings from different modalities may discover the general principles of neural organization from multiple very different modalities, such as network hubs, small-world properties, as well as metrics of efficiency and resilience to disruption. Previous research associating CNTNAP2 with cognitive or behavioral traits focused on autistic populations or people with known language difficulties. To test whether this very common genetic variant leads to detectable brain differences outside of populations with language or developmental disorders, we focused on healthy adults with normal variations in language ability. Since Scott-Van Zeeland et al. (2010) were able to find and replicate CNTNAP2's association with brain connectivity in a population of both autistic and typically developing children, we hypothesized that we might be able to detect differences in the structural networks of healthy normal carriers of the CNTNAP2 risk allele (rs2710102). In this study, we assessed both global and hemisphere-specific brain network properties. We recently reported on genetically influenced left-right asymmetries in white matter tracts (Jahanshad et al., 2010). Given those asymmetries, we expected that the relationship between CNTNAP2 and network measures might differ by hemisphere, as CNTNAP2 is linked with language ability (Alarcón et al., 2008; Vernes et al., 2008)—a generally left-lateralized function (Baynes et al., 1998). As such, we tested for the effects on each hemisphere independently.
Materials and Methods
Participants
Participants were recruited as part of a 5-year research project examining healthy young adult Australian twins using structural MRI and DTI with a projected sample size of ∼1150 at completion (de Zubicaray et al., 2008). Our analysis included 328 right-handed subjects (209 women/119 men, average age=23.4, SD=2.17). This population included 118 monozygotic (MZ) twins, 183 dizygotic (DZ) twins, and 27 nontwin siblings, from 189 families. The population was racially homogenous: 100% of subjects were Caucasian. In studies of genetic variations, a genetically homogenous population is preferable to avoid incorrectly ascribing effects to alleles that have different frequencies in different racial/ethnic groups. The subjects were screened to exclude those with a history of significant head injury, neurological or psychiatric illness, substance abuse or dependence, or who had a first-degree relative with a psychiatric disorder. All the participants were right handed, as assessed by 12 items on the Annett's Handedness Questionnaire (Annett, 1970). The study participants gave informed consent; the institutional ethics committees at the Queensland Institute of Medical Research, the University of Queensland, the Wesley Hospital, and at UCLA approved the study.
Establishing zygosity and genotyping
Zygosity was established objectively by typing nine independent DNA microsatellite polymorphisms (polymorphism information content>0.7), using standard polymerase chain reaction methods and genotyping. Results were cross-checked with blood group (ABO, MNS, and Rh), and phenotypic data (hair, skin, and eye color), giving an overall probability of correct zygosity assignment>99.99%. Genomic DNA samples were analyzed on the Human610-Quad BeadChip (Illumina) according to the manufacturer's protocols (Infinium HD Assay; Super Protocol Guide; Rev. A, May 2008). For our SNP of interest, rs2710102, 47 (20.1%) were homozygous for the nonrisk allele (TT), 111 (47.4%) subjects were heterozygous for the risk allele (TC), and 76 (32.5%) subjects were homozygous for the risk allele (CC).
Scan acquisition
Whole-brain anatomical and HARDI were collected with a 4T Bruker Medspec MRI scanner. T1-weighted anatomical images were acquired with an inversion recovery rapid gradient echo sequence. The acquisition parameters were as follows: TI/TR/TE=700/1500/3.35 ms; flip angle=8°; slice thickness=0.9 mm, with an acquisition matrix of 256×256. Diffusion-weighted images (DWIs) were also acquired using single-shot echo planar imaging with a twice-refocused spin echo sequence to reduce eddy-current induced distortions. The acquisition parameters were optimized to provide the best signal-to-noise ratio (SNR) for estimation of diffusion tensors (Jones et al., 1999). The imaging parameters were as follows: 23 cm FOV, TR/TE 6090/91.7 ms, with a 128×128 acquisition matrix. Each three-dimensional (3D) volume consisted of fifty-five 2-mm-thick axial slices with no gap and 1.79×1.79 mm2 in-plane resolution. One hundred five images were acquired per subject: 11 with no diffusion sensitization (i.e., T2-weighted b 0 images) and 94 DWIs (b=1159 s/mm2) with gradient directions evenly distributed on the hemisphere. The scan time for the HARDI scan was 14.2 min.
Cortical extraction and HARDI tractography
Connectivity analysis was performed as in Jahanshad et al. (2011). Briefly, nonbrain regions were automatically removed from each T1-weighted MRI scan, and from a T2-weighted image from the DWI set, using the FSL tool “BET” (FMRIB Software Library,
Thirty-five cortical labels per hemisphere, as listed in the Desikan–Killiany atlas (Desikan et al., 2006), were automatically extracted from all aligned T1-weighted structural MRI scans using FreeSurfer (
The transformation matrix from the linear alignment of the mean b 0 image to the T1-weighted volume was applied to each of the 94 gradient directions to properly re-orient the orientation distribution functions (ODFs). At each HARDI voxel, the ODFs were computed using the normalized and dimensionless ODF estimator, derived for q-ball imaging in (Aganj et al., 2010). We performed HARDI tractography on the linearly aligned sets of DWI volumes using these ODFs. Tractography was performed using the Hough transform method as described in (Aganj et al., 2011). Briefly, tractography was performed after linearly aligning and scaling the DWI data to anatomical (T1-weighted) image space. Since a linear transform was applied to the diffusion-weighted images, we also reoriented the gradient table so that the tract tracing algorithm could correctly follow the dominant direction of diffusion. The table of gradient vectors was corrected to reflect the nonrigid transformation by applying the same transformation to each directional gradient vector. Running tractography after re-orienting the images, as we did here, might slightly affect the SNR of the diffusion signals, as it would act as a very mild spatial filter on the data.
Elastic deformations obtained from the EPI distortion correction, mapping the average b 0 image to the T1-weighted image, were then applied to the tracts' 3D coordinates for accurate alignment of the anatomy. Each subject's dataset contained 2,000–10,000 useable fibers (3D curves). Fibers were filtered to eliminate those likely to be erroneous. All duplicate fibers were removed; those with a very small number of points (<5) were considered unreliable and were also removed.
For each subject, a full 70×70 connectivity matrix was created. Each element described the proportion of the total number of fibers connecting each of the labels; the diagonal elements of the matrix describe the total number of fibers passing through a certain cortical region of interest. Since these values were calculated as a proportion, they were normalized to the total number of fibers traced for each individual participant, so that the results could not be skewed by raw fiber count.
Graph theory analyses
On the 70×70 matrices just generated, we used the Brain Connectivity Toolbox (Rubinov and Sporns, 2010;
One step in graph theory analysis is selecting a threshold for the network, termed the sparsity. Networks with a sparsity of 0.2 retain only 20% of the connections of the “full-sparsity” network. Selecting a single sparsity level may arbitrarily affect the network measures, so we computed measures at multiple sparsities, and integrated across that range to generate more stable scores. We calculated these measures for the whole brain over a range of sparsities (0.2–0.3, in 0.01 increments), and calculated the area under the curve of those 11 data points to generate an integrated score for each measure. Twenty-three participants completed two separate scanning sessions 3 months apart in which DTI data were collected. The measures were calculated for both scans for each of these participants over the whole range of sparsities, and we found that the range 0.2–0.3 gave the most stable network measures. Supplementary Figure S1 (Supplementary Data are available online at
Association controlling for relatedness
We performed a mixed-model regression for each network measure to find the association of the SNP while incorporating a model accounting for family relatedness (Kang et al., 2008). When family members are analyzed, the relatedness among members of the sample should be taken into account, and each individual cannot be treated as independent as some share part (in the case of siblings and DZ twins) or all (MZ twins) of their genome. This analysis was performed using Efficient Mixed-Model Association (EMMA;
Here, y is a vector representing the network property; X is a matrix of fixed effects containing the genetic effect of the SNP for each subject (coded additively or using other models that combine genotype groups; see above) and a constant term; β is a vector representing the fixed-effect regression coefficients; Z is an identity matrix; u is the random effect with
False discovery rate correction for multiple comparisons
All results were controlled for multiple comparisons using the standard false discovery rate (FDR) method (Benjamini and Hochberg, 1995). The FDR is the expected proportion of false positives among results that are declared significant. Simply setting the alpha at a value of 0.05 implies that 5% of the results are expected to be false positives. An FDR q value of 0.05, as used in this article, implies that, on average across experiments, 5% of the results declared significant are expected to be false positives.
Results
Carriers of two (CC) but not just one (CT) risk allele have a higher risk of speech development delay and/or impairment (see SNPedia, at
Results—whole brain measures
We tested associations of the rs2710102 CNTNAP2 SNP with five commonly studied network measures: CPL, MCC, EGLOB, SW, and MOD. The allele dose at the SNP (i.e., the number of risk alleles) was significantly associated with the CPL in the whole-brain structural network (b=0.17, p=0.0069), as well as SW (b=−0.6, p=0.00068) and EGLOB (b=−0.09, p=0.00099) in the left hemisphere and the EGLOB in the right hemisphere (b=−0.077, p=0.0056). Here, b represents the unnormalized slope of the regression coefficient, where the at-risk group is coded as 0, and the non-at-risk group is coded as 1. These results remained significant after correcting for multiple comparisons using the FDR procedure (Benjamini and Hochberg, 1995) across all 15 tests performed (5 in the left hemisphere, 5 in the right hemisphere, and 5 for whole brain, q<0.05). Individuals homozygous for the risk allele (N=99) had greater EGLOB in both hemispheres and greater SW in the left hemisphere. Individuals carrying one or no copies of the risk allele (N=229) had a greater CPL in the whole-brain structural network. The whole-brain results, with significant results bolded, along with average values for each group, are shown in Table 1. They are visualized in Figures 1 and 2.
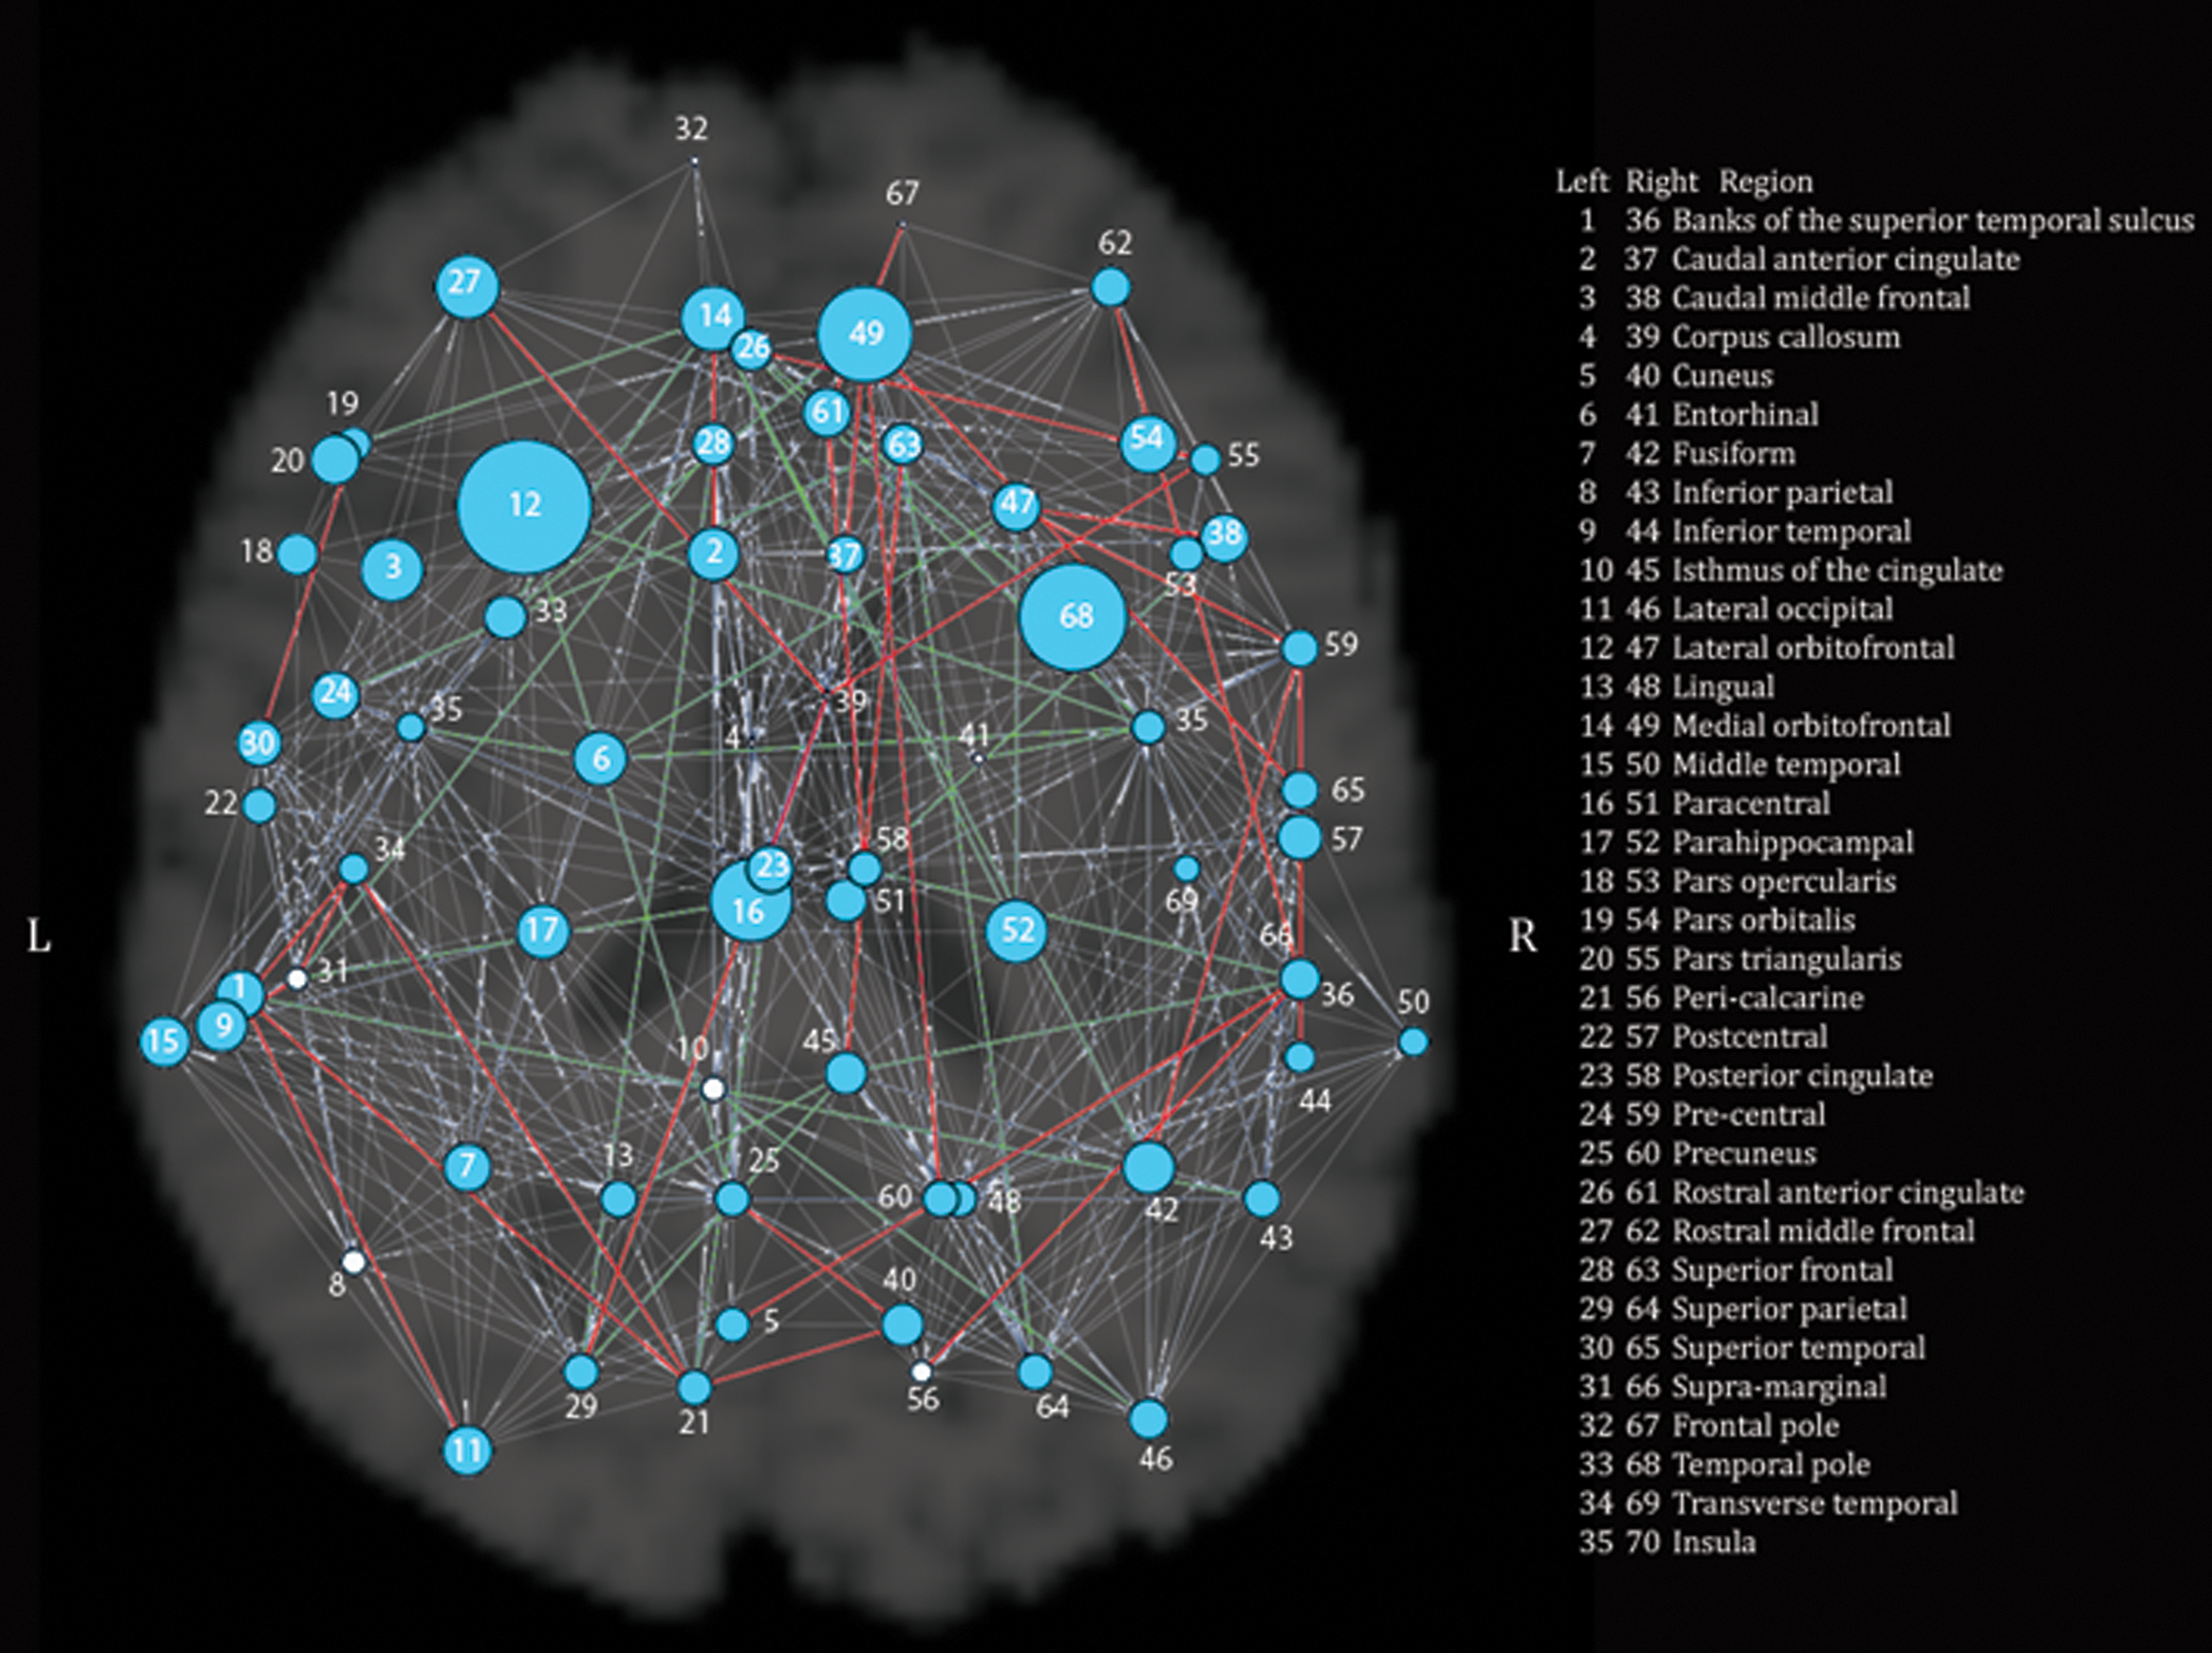
Global results of CNTNAP2 association with graph theory metrics for the whole brain. The radius of each node is proportional to the inverse of the p value for the comparison between risk (CC) and nonrisk (CT, TT) subjects in the measure of eccentricity. Thus, larger radii indicate nodes showing significant differences between the two groups. Significant nodes are in blue, and nonsignificant nodes are in white. Nodes are labeled with numbers: the legend on the figure lists numbers as they correspond to regions in each hemisphere. Additionally, differences in paths are shown in this figure. Paths that both risk and nonrisk groups have are in gray, those only present in the risk group are in red, and those only present in the nonrisk group are in green. Nodes are labeled with numbers; the legend in the figure lists numbers in each hemisphere as they correspond to regions. Figures 1 and 2 were generated at sparsity=0.25, using the UCLA Multimodal Connectivity Package (
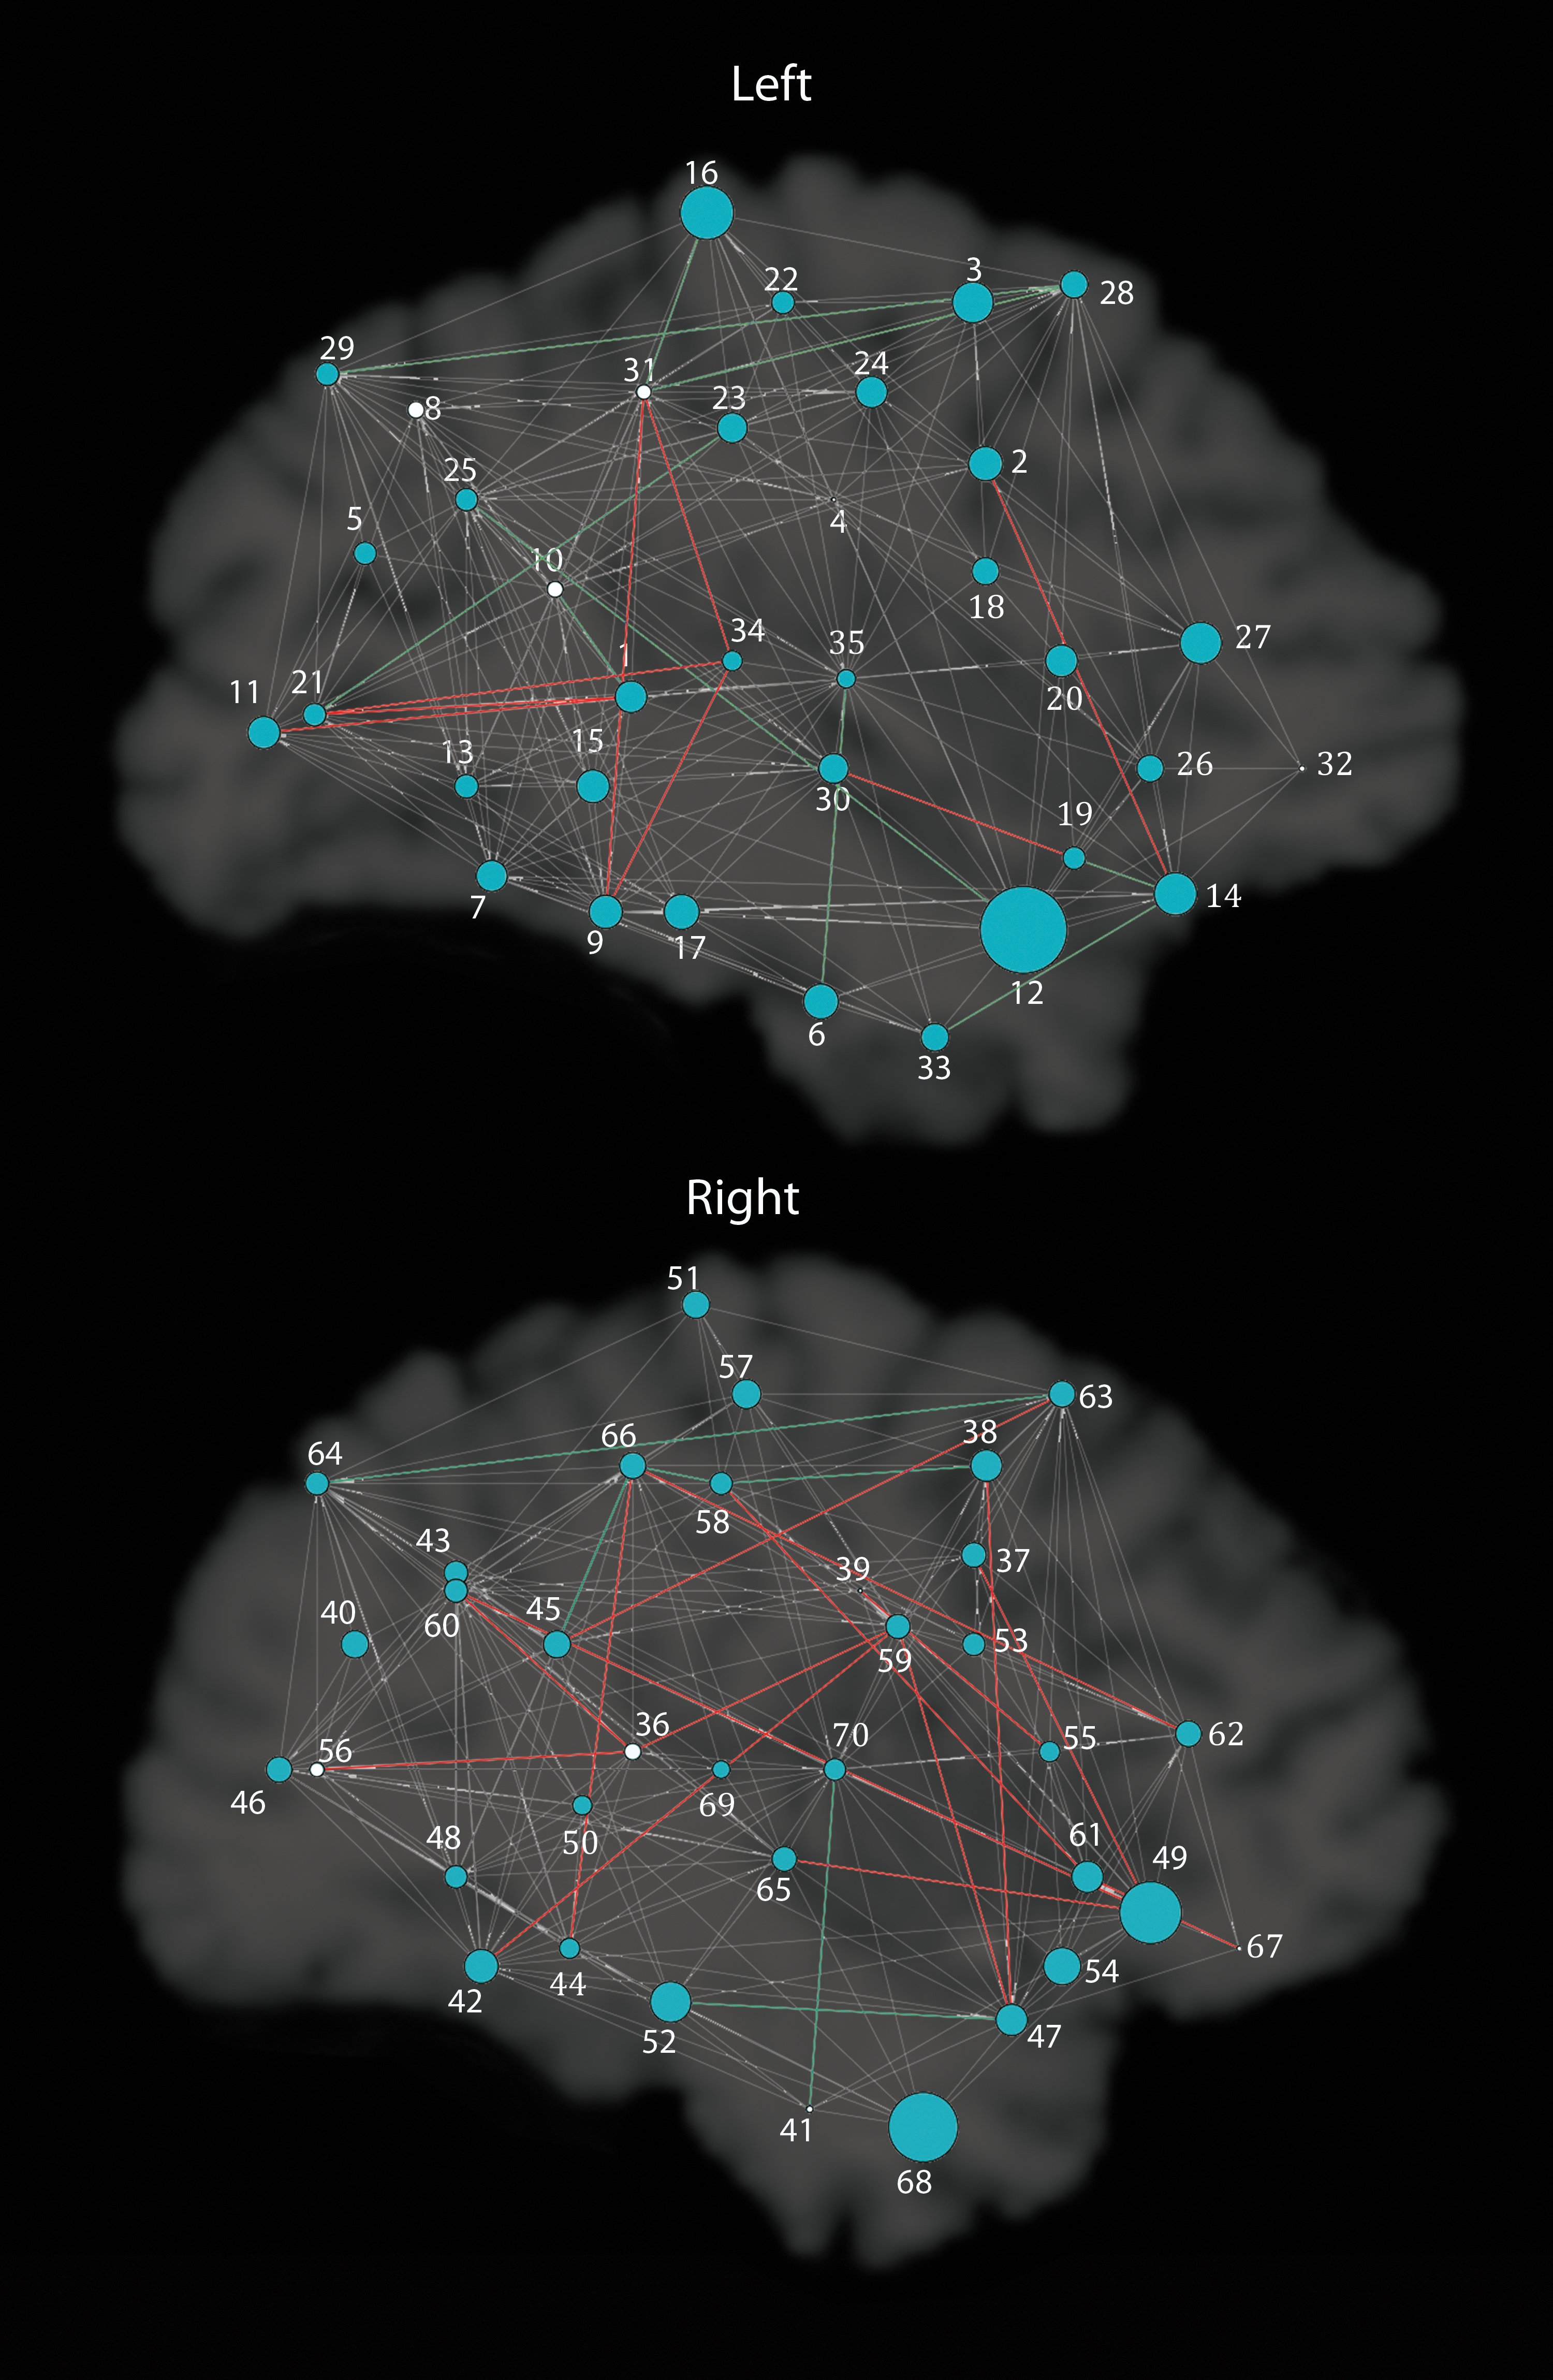
Global results of CNTNAP2 association with graph theory metrics for each hemisphere separately. As in Figure 1, larger radii indicate nodes showing significant differences between the two groups in the measure of eccentricity. Significant nodes are in blue, and nonsignificant nodes are in white. Gray paths are present in both groups, red in risk only, and green in nonrisk only. Nodes are labeled with numbers; the legend in the figure lists numbers in each hemisphere as they correspond to regions.
Significant results are bolded. Results pass FDR correction for multiple comparisons across all 15 p values.
Whole-brain results showing CNTNAP2 SNP associations with graph theory measures of structural connectivity. Results are separated by hemisphere and are shown for the recessive model's SNP effect.
CPL, characteristic path length; MCC, mean clustering coefficient; EGLOB, global efficiency; SW, small-worldness, MOD, modularity; FDR, false discovery rate; SNP, single nucleotide polymorphism.
Results—EREG
Our association analysis of the rs2710102 CNTNAP2 SNP with the EREG of each node, integrated across sparsities .2–.3, yielded results in 11 of the 70 nodes that passed p<0.05 but did not pass the more stringent FDR correction. These results, along with average values for each group, are shown in Table 2. To preserve space, only nodes passing p<0.05 are presented in Table 2.
Nonrisk (CT and TT) coded as “1” and risk (CC) coded as “0” such that positive b value indicates greater average in nonrisk participants. Only results passing p<0.05 are presented.
Regional efficiency results showing CNTNAP2 SNP associations with graph theory measures according to recessive model.
L, left; R, right.
Results–ECC
To more fully examine the distribution of path lengths in the network, we tested the effect of CNTNAP2 on ECC, a nodal measure of the maximal shortest path length for each node, meaning the length computed between that node and the farthest node it is connected to. Given the significant results in CPL, EGLOB, and SW, all of which are related to path length, we decided to look further into other measures related to path length. Of course, these are not entirely independent analyses, and should be considered post hoc and exploratory. Our analyses of the associations between the rs2710102 CNTNAP2 SNP and the ECC of each node, integrated across sparsities .2–.3, yielded significant results for 60 of the 70 nodes, 30 in the left hemisphere and 30 in the right hemisphere, as seen in Figure 3 (q<0.05). These results are displayed in Figure 3 along with averages and resultant b and p values in Table 3. To preserve space, only nodes passing q<0.05 are presented in Table 3.
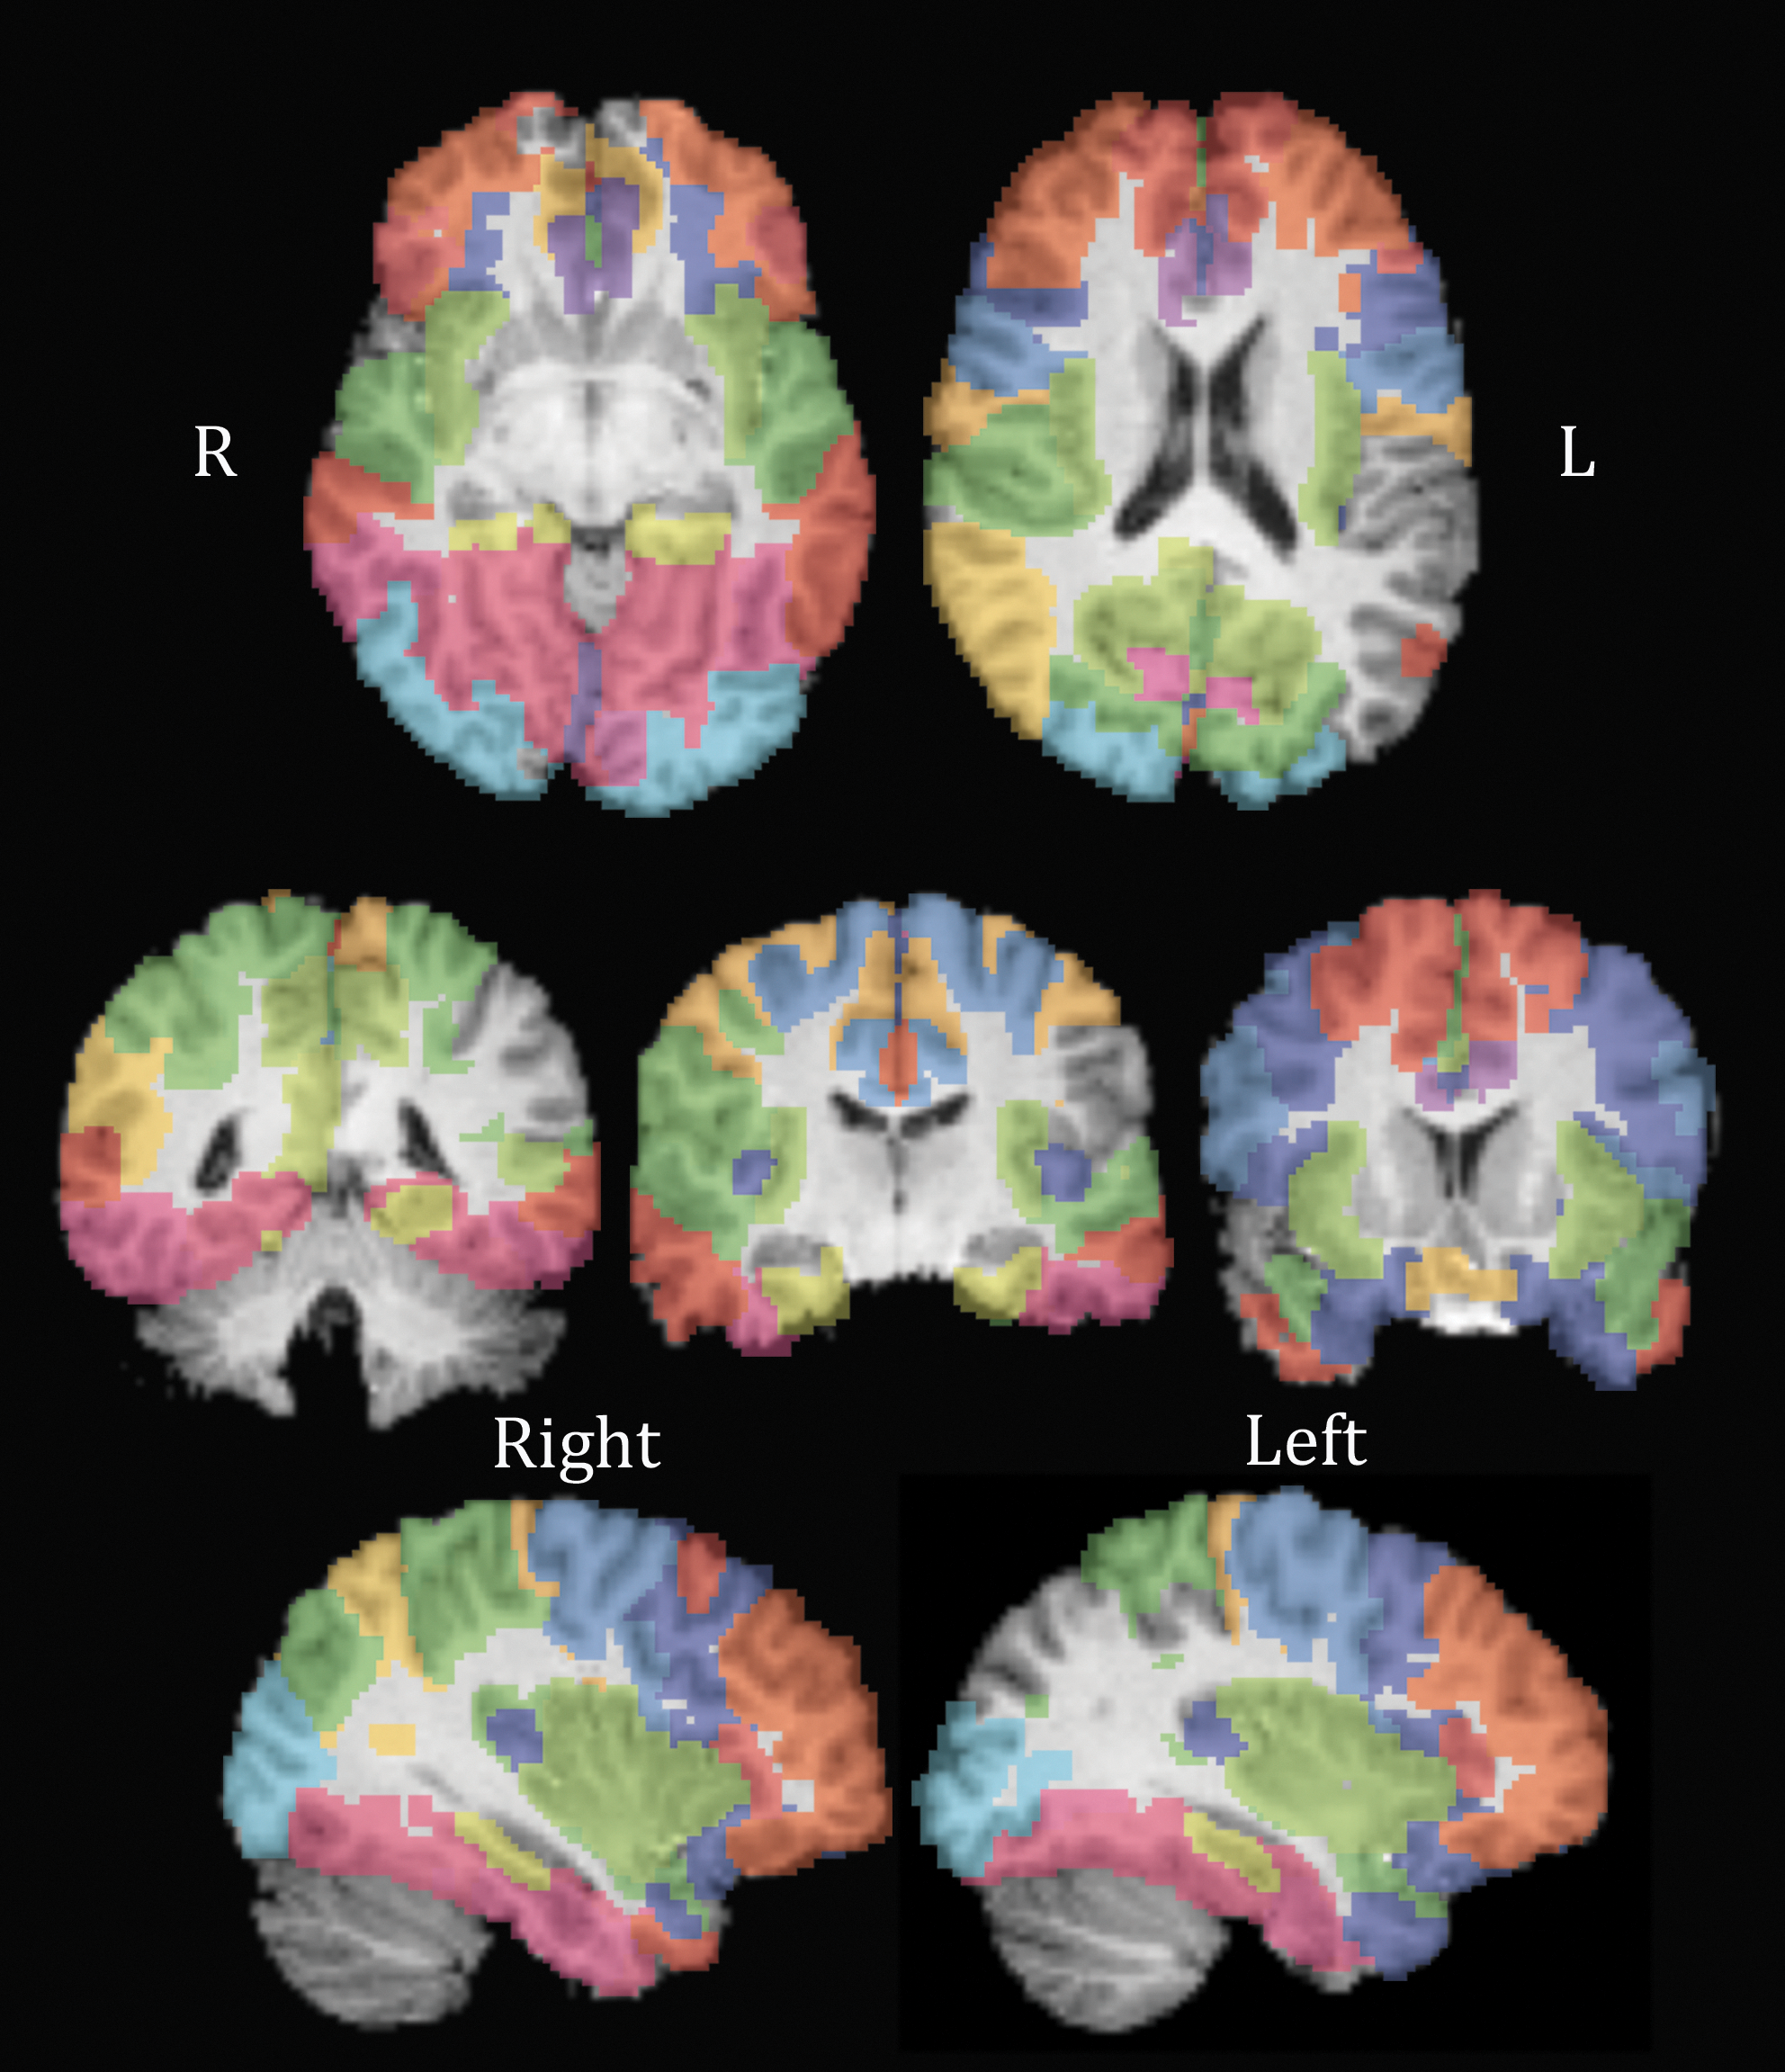
Image of nodes showing association between eccentricity and the CNTNAP2 allele dose in the recessive model. Results pass false discovery rate correction for multiple comparisons across all 70 nodes. Colors differentiate each node, with the same color representing one node bilaterally. See Table 3 for color code. From top to bottom, left to right, slices are as follows: Z=46, Z=60, Y=41, Y=52, Y=70, X=36, and X=72.
Nonrisk coded as “1” and risk coded as “0”; b value represents gain in eccentricity for nonrisk group (CT and TT) compared with risk group (CC). All passing FDR corrected across all 70 nodes tested (q<0.05). Only significant results are presented. Colors refer to Figure 3.
Regional results showing CNTNAP2 SNP associations with node eccentricity.
L, left; R, right.
Post hoc analysis—additive and dominant models
Based on evidence that only carriers of two risk alleles (CC) are affected (see SNPedia, at
Post hoc analyses of the additive model passing FDR.
Post hoc analysis—fiber density in frontal, parietal, and temporal lobes and FA
We had initially analyzed whether our two groups differed in their whole fiber density matrices, that is, the number of fibers per unit volume connecting each node, and found no significant differences. Given the promising findings suggesting associations with global and nodal network measures, we ran post hoc tests on the fiber density in the frontal and temporal lobes, where CNTNAP2 gene expression is enriched (Abrahams et al., 2007; Arking et al., 2008; Strauss et al., 2006; Vernes et al., 2008). In addition, Scott-Van Zeeland et al. had found associations between this gene and measures of functional connectivity in the frontal and parietal lobes; so, we included parietal nodes in this analysis as well. The nodes counted in this subset are listed in Supplementary Table S3. There was a trend for greater fiber density in the nonrisk subjects in all three lobes, but these results did not pass FDR correction. We also checked whether our two groups differed in FA or apparent diffusion coefficient (ADC) along the tracts connecting each node and found no association for any of the connections. One reason we focused our genetic analysis on FA was that we had completed a series of earlier papers that aimed at finding out which DTI-derived measures were most highly heritable. In a twin sample scanned with DTI, it is possible to estimate the proportion of variance in a measure that is attributable to genetic variation, by examining covariances between different types of twins (MZ and DZ). In these early analyses, FA was found to be highly heritable (Lepore et al., 2008) and so were the three diffusion eigenvalues when treated as a multivariate vector (Lee et al., 2009a). The full tensor was also highly heritable, so long as the meaning of heritability was appropriately redefined using a Lie group metric to measure tensor differences (Lee et al., 2009b, 2010). Since FA was more highly heritable than mean diffusivity, we preferred to use it as the target for our subsequent genetic association analyses (Braskie et al., 2011, Jahanshad et al., 2012). In addition, we weighted our fiber density matrices to emphasize those tracts that are expected to be more heavily myelinated by multiplying our fiber density and FA matrices element wise; even so, we found no associations between the CNTNAP2 dose and those values. Thus, the global and nodal network differences in carriers of the risk gene were not readily reducible to the effects on more common network properties, such as fiber density.
Post hoc analysis—interhemispheric connections
Given evidence that individuals with autism may have abnormalities in interhemispheric connectivity (Just et al., 2007), we generated 35×35 matrices of interhemispheric connections for all participants. We analyzed these for differences in fiber density for these interhemispheric connections between the two groups, and found no significant differences that passed FDR correction. We also analyzed whether the number of interhemispheric connections present differed between the groups, meaning the number of elements in the 35×35 matrix where >95% of the subjects had nonzero entries, again finding no significant differences.
Discussion
In this study, we found that carriers of a common variant in the autism risk gene, CNTNAP2, had differences in structural brain connectivity computed from high-field DTI. Graph theory measures differed in individuals homozygous for the risk allele. This higher-risk group had shorter CPL in the whole-brain network, greater SW and greater EGLOB in the left hemisphere, and greater EGLOB in the right hemisphere. These results may seem counter-intuitive given findings of higher efficiency, but higher efficiency in structural networks may reflect more random connections in the risk-group's brain networks, as random networks have high levels of EGLOB (Bullmore and Sporns, 2009). Further analysis at the nodal level revealed that the homozygous at-risk participants had lower ECC across 60 of the 70 network nodes in the nonrisk participants, and borderline significant results (passed p<0.05 but not FDR correction) in EREG in 11 of the 70 nodes. A final analysis attempted to further simplify the results by assessing FA and fiber density differences, but did not detect associations with these more common fiber measures. In other words, several global and nodal properties of the structural network were different in carriers of the risk gene, but they were not attributable to more common characteristics of fibers, such as fiber density or FA. A larger sample size might detect differences in FA in carriers of the risk gene, but our findings suggest that differences are more prominent at the network level.
In their recent study, Scott-Van Zeeland et al. (2010) found that a CNTNAP2 SNP was associated with differences in the functional connectivity of frontal and parietal cortical networks, including effects on the strength of short- and long-range connections to the frontal and parietal cortex. In this case, the range reflected the physical distance between two regions, while in graph theory, distance instead reflects the number of paths between one node and another. While path distance and physical distance are not the same, they both indicate distance between one brain region and another. Since this is the property measured by CPL and EGLOB using graph theoretical methods, we hypothesized that we could assess corresponding measures from structural networks using DTI, and that these measures might be altered in carriers of the CNTNAP2 risk allele. We found that carriers have altered structural connectivity—as measured by a number of graph theory metrics—which may partly underlie the alterations in functional connectivity.
SW is a well-developed concept from graph theory (Watts and Strogatz, 1998) that has more recently been applied to brain networks (Sporns et al., 2004). A network with high SW has high local clustering and a short CPL. Subjects homozygous for the risk allele had greater SW and greater EGLOB in their left hemispheres, which are both driven in part or wholly by shorter CPLs. Risk subjects also had higher EGLOB in the right hemisphere as well as shorter CPL at a whole-brain level. Since there were no significant differences in clustering, differences in path length may drive the observed differences in SW. Greater efficiency in those at risk is unexpected, as Hagmann et al. (2010) found greater efficiency as development progressed, and Pollonini et al. (2010) found decreased EGLOB in autistic subjects. However, Hagmann et al. based their calculations on 1/ADC, while we based ours on fiber density, and Pollonini et al. was a magnetoencephalography (MEG) study with Granger causality, so the comparison is not direct. A random network has high efficiency (Bullmore and Sporns, 2009), but it may not be functionally advantageous if the proper connections are not made. Neural network complexity is typically achieved by a balance of randomness and regularity—at either extreme, you have a system less able to learn, because it is either never stable enough to remember or never flexible enough to adapt (Sporns, 2011). A more random network, while having a shorter average path length, will be less complex, and arguably further from ideal in terms of brain function. A more random network, while having a shorter average path length, will be less complex, and may not reflect the organization found in real functional brain networks. Individuals differ widely in brain structure and function, but complete “randomness” of connections is not typical of functional circuitry in the brain. A random network, with no stability in time or logical set up, does not tend to make the most efficient use of the brain's resources (Chialvo, 2010). While additional studies are required, higher EGLOB may reflect more random connections in the structural networks of the at-risk participants, as random networks have low path lengths.
Based on our global results, we decided to look further into various nodal measures of connectivity. In these post hoc tests, we found a significant association between CNTNAP2 allele dose and the ECC at 60 of the 70 nodes, with nonrisk carriers having greater ECC across all nodes. ECC is the distance, in paths traversed, between a given node and the node farthest from it (Sporns, 2002). Nonrisk participants had greater ECC across most of the brain. Studies of ECC in brain networks are few (Pollonini et al., 2010) and have not generated any significant results so far; so, we have little context for these results. However, given that they are across a majority of nodes in the brain, they could underlie the global trends we found as well. We found 11 nodes with borderline significant differences (passed p<0.05 but not FDR correction) in EREG, 8 of which were in the frontal lobe, 2 in the temporal lobe, and 1 in the parietal lobe. These are the areas where CNTNAP2 expression is especially enriched (Abrahams et al., 2007; Arking et al., 2008; Strauss et al., 2006; Vernes et al., 2008) and where Scott-Van Zeeland found differences in functional connectivity.
In attempting to discover a simpler underlying cause of these results, we looked into possible differences in the fiber density matrices of the two groups. We had initially ruled out differences in overall connectivity by running our analysis of CNTNAP2 on the whole fiber density matrices. However, in trying to understand our results of greater EGLOB and shorter CPL in the risk allele carriers, we decided to look only at those connections with at least one terminus in the frontal, parietal, or temporal lobes. While we found a trend for greater fiber density in the nonrisk subjects in a large number of frontal, parietal, and temporal connections, these results did not pass FDR correction. Tan et al. (2010) conducted a study of a different CNTNAP2 SNP, rs7794745, in a large cohort of healthy subjects as well. Regional gray and white matter volumes were lower in those homozygous for the risk allele. We will continue to search for an explanation for our unexpected findings, but currently they do not appear to be reducible to more simple measures of structural connectivity.
Our findings relating a common risk variant in CNTNAP2 with structural connectivity suggests that the protein it codes for, CASPR2, may be involved in white matter tract structure. This seems likely, as CASPR2 has a role in neuroblast migration (Strauss et al., 2006) and in stabilizing K+ channels in the juxtaparanodal region (Poliak et al., 1999, 2003). CNTNAP2 risk allele carriers may have aberrant neuroblast migration or K+ channel clustering early in development; this may even underlie the differences we see in structural connectivity. Abnormal neuronal migration early in development could lead to altered development of white matter, leading to the changes we see. Abnormal K+ channel clustering could affect axonal physiology for developing tracts, perhaps even affecting overall tract structure. The recent study characterizing the CNTNAP2 knockout found, along with various behavioral hallmarks of autism, neuronal migration abnormalities, including abnormal clustering of neurons in the deep layers of the cortex (Peñagarikano et al., 2011). CNTNAP2 is a risk gene for autism, but it also has effects in nonautistic populations with language disorders. It may be more appropriate to consider it as a risk gene for language difficulties—a key component of autism. A disorder as complex and varied as autism most likely results from a constellation of genetic variations interacting with environmental influences (Szatmari et al., 2007). The SNP rs2710102 in CNTNAP2 may be one of these polymorphisms that, when combined with others, could increase te risk for autism by increasing the susceptibility to language difficulties. In this article, our focus was the effects of CNTNAP2 on brain structural connectivity. Understanding why a gene increases risk for a disorder is as crucial as determining that it increases risk in the first place, as a more mechanistic understanding is necessary for ultimately developing interventions. Here, we discovered a mechanistic clue that might explain the association between CNTNAP2 and autism and language disorders. This altered connectivity may represent an intermediate phenotype for one source of language difficulties. Our participants were a large cohort of twins screened for psychiatric disorders and developmental conditions; thus, they fall within the normal range of language ability.
Of the three different models, the recessive model yielded the strongest results. We chose this model based on information that individuals with the CC genotype have an increased risk of language impairment (
Conclusions
In this study, the first to link graph theory measures of brain structural connectivity with a specific genetic variant associated with autism, we searched for structural differences that might contribute to the reported effects of CNTNAP2 on functional networks. In our large cohort of healthy adults, the same CNTNAP2 SNP was also associated with detectable differences in structural connectivity. In comparing findings from different imaging modalities, these efforts lead to a better understanding of genetic liability for autism and related disorders. Our results not only add to previous work on the effects of CNTNAP2 on brain structure but also raise new questions regarding the underlying difference. A new approach to neuroimaging genetics is combining multiple polymorphisms–in the same or different genes—when testing for associations with phenotypes, leading to increased predictive accuracy (Chiang et al., 2011b; Hibar et al., 2011). Studies using this method have already been conducted on another autism risk gene (Kohannim et al., in review) that was a top hit in a genome-wide scan for risk alleles (Anney et al., 2010). CNTNAP2 is classified as an autism risk gene, but we have shown that it has effects in a healthy population as well. These results will further our understanding of how vulnerabilities for various genetically influenced disorders are displayed in the brain.
Footnotes
Acknowledgments
This study was supported by the National Institute of Child Health and Human Development (R01 HD050735) and the National Health and Medical Research Council (NHMRC 486682, 1009064), Australia. Genotyping was supported by NHMRC (389875). Additional support for algorithm development was provided by NIH R01 grants EB008432, EB008281, EB007813, and P41 RR013642. NJ was funded, in part, by the NLM (T15 LM07356); AWT was partially funded by the HCP (U01 MH093765).
Author Contributions
K.L.M., G.I.d.Z., G.M., N.G.M., and M.J.W. collected the data. E.L.D., N.J., J.D.R., J.A.B., and P.M.T. analyzed the data. E.L.D., N.J., and P.M.T. wrote the initial manuscript draft. All authors contributed to revisions and commented on drafts.
Author Disclosure Statement
The authors have no competing financial interests.
References
Supplementary Material
Please find the following supplemental material available below.
For Open Access articles published under a Creative Commons License, all supplemental material carries the same license as the article it is associated with.
For non-Open Access articles published, all supplemental material carries a non-exclusive license, and permission requests for re-use of supplemental material or any part of supplemental material shall be sent directly to the copyright owner as specified in the copyright notice associated with the article.