
Abstract
It is now widely accepted that Alzheimer's disease is characterized by a functional disconnection between brain regions. The disease appears to begin up to decades prior to clinical diagnosis. Therefore, in the present study, we combined magnetoencephalography, a memory task, and functional connectivity analysis in mild cognitive impairment subjects in order to identify functional connectivity patterns that could characterize subjects who would eventually go on to develop the disease. We monitored 19 subjects and finally 5 of them developed Alzheimer's disease. These progressive patients showed a differential profile of functional connectivity values compared with those patients who remained stable over time. Specifically there were higher synchronization values over the parieto-occipital region in α and β frequency bands. The involvement of this brain region in amyloid-β accumulation and its possible association with hyper-synchronization are also discussed.
Introduction
T
In other words, for a couple of time series (X and Y), the SL measures the probability that repetition of temporal patterns in the time series X and Y coincides. Thus, we will know the statistical interdependencies between physiological signals, obtaining information about functional interactions between the corresponding brain regions.
It is of interest to evaluate whether functional connectivity profiles are affected in clinical conditions, such as mild cognitive impairment (MCI), considering its high rate of conversion to dementia (10% to 15% per year develop dementia).
In the present study, we recorded oscillatory brain magnetic activity during a memory task using magnetoencephalography (MEG), with the aim being to evaluate whether progressive MCI (PMCI) patients show a differential profile of functional connectivity values compared with those patients who remain stable over time (stable MCI [SMCI]) and compared with healthy aging (HA) subjects. Previous results revealed higher synchronization in MCI subjects (Bajo et al., 2010) compared with HA subjects, reflecting a compensatory mechanism. Here, we predict that PMCI subjects will demonstrate an overuse of this compensatory mechanism in the sense of higher synchronization values than SMCI and HA subjects.
Materials and Methods
Participants
Forty-one right-handed, elderly participants recruited from the Geriatric Unit of the Hospital Universitario San Carlos, Madrid, participated in the study. Three recordings were excluded from further analysis due to an excessive noise level. Participants were divided into two groups based on their clinical profiles: 19 participants had been diagnosed as amnestic-MCI subjects and 19 as HA participants. After two-and-a-half years of follow-up, five MCI patients converted to AD (PMCI). See Table 1 for population details.
MMSE, mini-mental state examination; GDS, global deterioration scale; MCI, mild cognitive impairment; PMCI, progressive MCI; SMCI, stable MCI.
MCI diagnosis was established according to the criteria proposed by Petersen (2004). Their clinical evolution is monitored every 6 months with a clinical interview and a neuropsychological assessment. Thus, the progression to AD was clinically established when patients achieved the NINCDS-ADRDA (National Institute of Neurological and Communicative Disorders and Alzheimer's Disease and Related Disorders Association) (McKhann et al., 1984) criteria of AD.
Stimuli and task
A modified version of the Sternberg's letter-probe task (Maestu et al., 2001) was used. A set of five letters was presented and the participants were asked to keep the letters in mind and then raise a finger every time they detect a letter that was in the previous list. Subjects had a second of time to respond. All participants were over 90% correct.
MEG data collection
The MEG signals were recorded with a 254 Hz sampling frequency and a band pass of 0.5 to 50 Hz, using a 148-channel whole-head magnetometer (MAGNES® 2500 WH; 4-D Neuroimaging) confined in a magnetically shielded room. Single-trial epochs were visually inspected by an experienced investigator, and epochs containing visible blinks, eye movements, or muscular artifacts were excluded from further analysis. Artifact-free epochs from each channel were then classified into four different categories, according to the subject's performance in the experiment: hits, false alarms, correct rejections, and omissions. Only hits were considered for further analysis because we were interested in evaluating the functional connectivity patterns that support recognition success. Thirty-five epochs (1000 ms in duration each) were used to calculate SL values.
In-house Fortran code was used to implement the SL algorithm as described by Stam and van Dijk (2002). The following frequency bands were considered: alpha1 (α1, 8–11 Hz), alpha2 (α2, 11–14 Hz), beta1 (β1, 14–25 Hz), beta2 (β2, 25–35 Hz), and gamma (γ, 35–45 Hz). The SL index was not computed for bands under 8 Hz as the epoch length and sampling rate do not allow an accurate enough estimation (Montez et al., 2006).
Statistical analysis
To compare the SL between each two groups (PMCI vs. SMCI, PMCI vs. controls, and SMCI vs. controls), a between-group Kruskal-Wallis (KW) test was calculated for each channel pair (p=0.02). After that, nonparametric permutation testing (Ernst, 2004) was applied to find channel pairs with significant differences between groups. In brief, a two-sample KW test between groups was performed for each channel pair.
Next, surrogate t-maps were calculated. First, per each participant all channels (1482) were randomized (taking in mind it is a symmetric matrix) and subsequently participants were randomly divided into two groups matching the numbers in the original groups. This was repeated 10,000 times and from each resulting t-map the t-value that was 98% (p=0.02) from the maximum absolute t-value was kept. Since this distribution, the threshold was also obtained from the 98th percentile, which ensures that there is only a 2% chance that one or more connections will present differences above threshold due to statistical fluctuations. This way we are guaranteeing a correction for multiple comparisons in both patients and channel pairs.
Results
PMCI, SMCI, and HA subjects did not show differences in task performance (p>0.05). Significant outcomes appear only in α1, α2, and β1 frequency bands. PMCI subjects, in comparison to the SMCI and HA subjects, showed higher synchronization values mainly over the parieto-temporal region in the α1, α2, and β1 frequency bands (see Fig. 1).
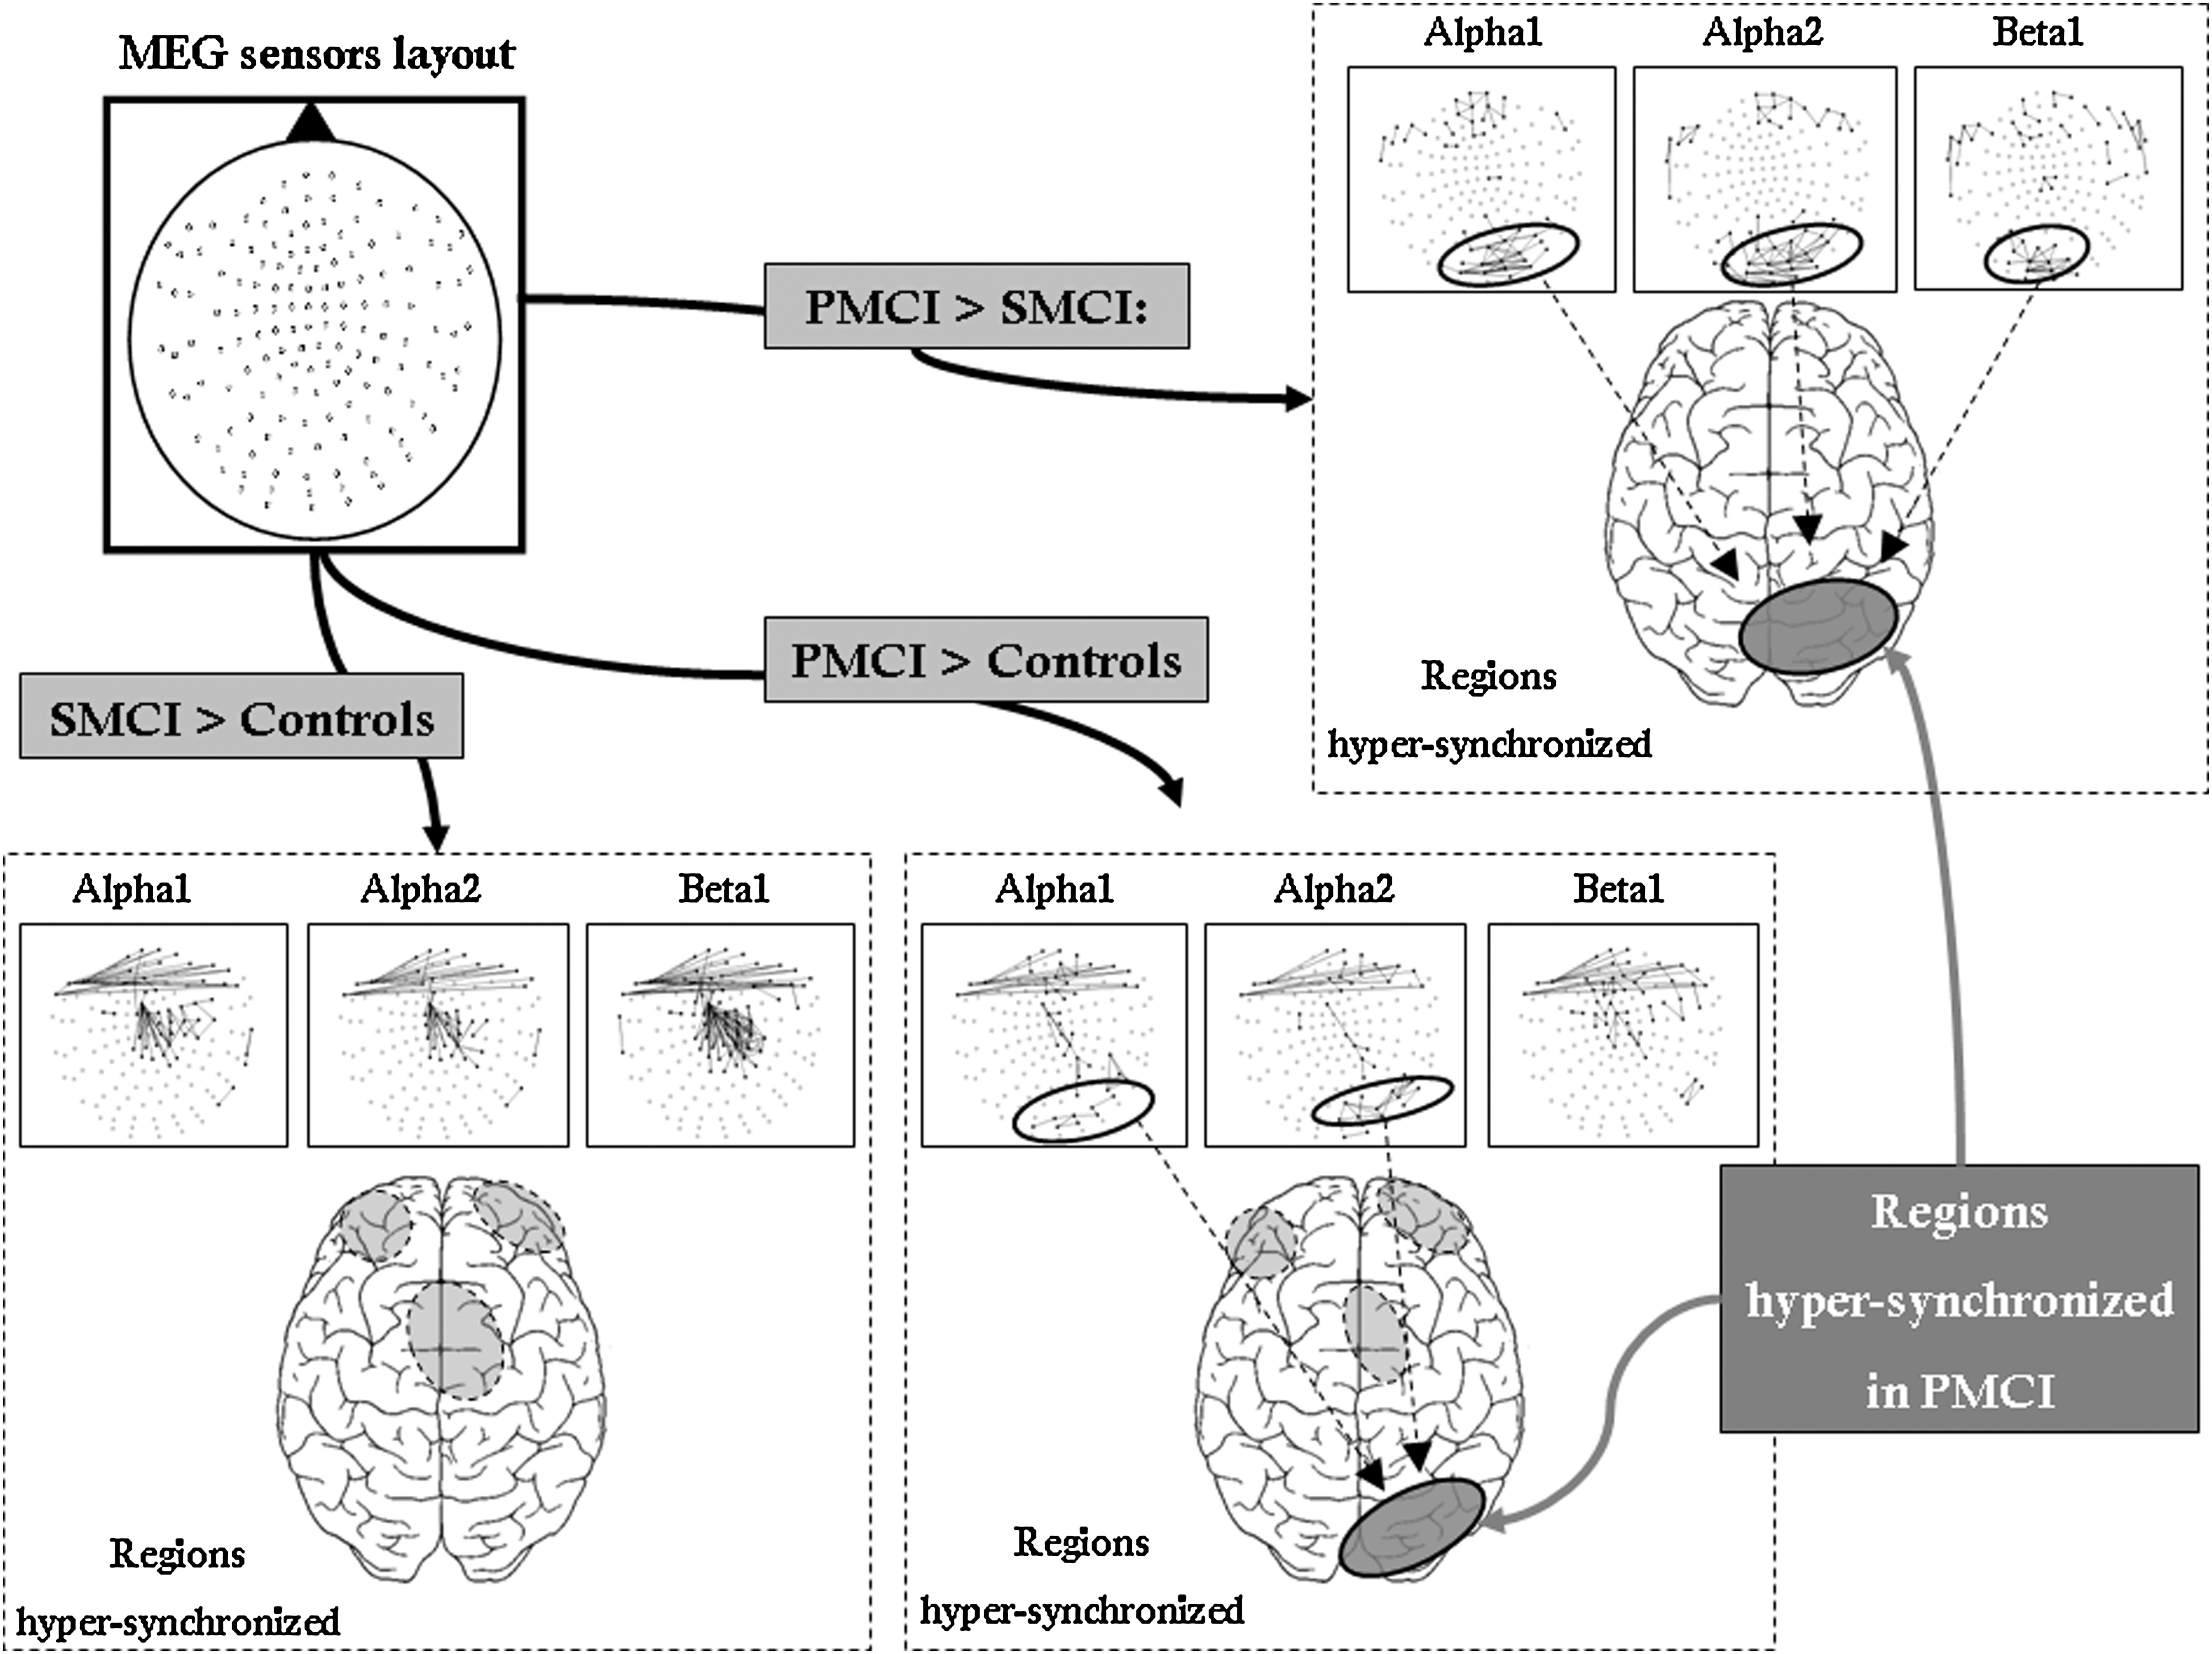
Significant differences in synchronization likelihood between MEG sensors for different frequency bands and groups (PMCI, SMCI, and controls). Gray circles in the figure show cortical brain regions where are located the statistical differences (in SL) between groups. MCI, mild cognitive impairment; PMCI, progressive MCI; SMCI, stable MCI; MEG, magnetoencephalography; SL, synchronization likelihood.
Discussion
In the present study, by studying MCI subjects who develop or not develop dementia, we were able to describe a differential profile of functional connectivity between them, and also in comparison with HA subjects. Since the evolution of AD is characterized by the progressive loss of functional connectivity within neocortical association areas (Stam et al., 2009), the hyper-connectivity or the increased activity found in MCI subjects compared with HA subjects could be a compensatory mechanism for the inefficiency of the memory networks (Dickerson et al., 2005). In fact, Bajo et al. (2010) found with MEG increased functional connectivity in MCI patients as a sign of compensatory mechanism. This compensatory mechanism seems to be transitory as AD patients showed lower long-distance connectivity than controls (Stam et al., 2009). Thus, our PMCI subjects appear to be overusing such compensatory mechanisms two-and-a-half years prior to developing AD. It is of interest that PMCI subjects showed higher connectivity in the α and β ranges as these frequency bands have been previously associated with working memory mechanisms (Palva et al., 2010). Besides, Teipel et al. (2009) found a relationship between functional connectivity among temporoparietal regions in the α band and anatomical connectivity in predominantly posterior white matter tracts.
In addition, the region (where PMCI subjects present high synchronization) has been previously associated with higher volume reduction (Apostolova and Thompson, 2008) and an increased accumulation of the amyloid-β peptide (Nordberg, 2008) in PMCI patients. This leads to the question of what could be the relationship between brain hyper-synchronization and the accumulation of this peptide in MCI or AD patients? Cirrito et al. (2005), in an elegant study, showed that the increase of synaptic activity leads to a rapid increase of amyloid-β peptide levels in specific brain regions. Thus, this study indicates that synaptic activity may modulate the neurodegenerative disease process. Bearing in mind that MEG signals are the consequence of postsynaptic electrical currents within the dendrite, the increased activity observed in PMCI subjects over parieto-occipital areas could be a risk factor for amyloid-β deposition and, as a consequence, a risk factor for a subsequent cognitive decline.
At any rate, regard to the connectivity patterns shown, we must point out that they could be affected by volume conduction effects because of the influence of common sources. Nearby MEG sensors have a high probability of capturing activity from common sources, and therefore show spurious strong correlation. About this “volume conduction” problem, Stam et al. (2009) found that phase lag index results were largely in line with previous studies (some of them performed with SL). They concluded that the influence of volume conduction in those studies had been smaller than had sometimes been suggested.
Besides, we should add that connectivity between sensors is not the same as connectivity between brain regions, and thus we should take into account that the labels of brain regions used to describe profiles of connectivity could be subjected to some spatial deviations.
Whether functional connectivity analysis could be a better measure of cognitive decline than other previous measures used to characterize the MEG signals in MCI patients is still a matter of debate. Previous MEG articles have used dipole fitting (Fernández et al., 2006) or minimum norm estimates of averaged evoked fields (Maestú et al., 2008; Maestú et al., 2011) to evaluate the progression to dementia. Although those approaches gave rise to a valuable clinical result, we believe that due to the neuropathological characteristics of the disease (accumulation of the amyloid-β protein and damage of the Tau protein), which impair cell communication, measures such as functional connectivity could detect more specifically the early impairment (see Bajo et al., 2010) in cortical communication than those approaches where only the regional increase or decrease of activity was taken into account. Future studies should evaluate whether functional connectivity achieves better classification scores than other measures, such as dipole fitting or regional power.
Footnotes
Acknowledgment
This study was partially funded by the Madr.IB (CAM i+d+I project; S-SAL-0312-2006) and the Spanish Ministry of Science SEJ-2006-07560 and PSI2009-14415-C03-01.
Author Disclosure Statement
No competing financial interests exist.