
Abstract
Although expectation- and attention-related interactions between ventral and medial prefrontal cortex and stimulus category-selective visual regions have been identified during visual detection and discrimination, it is not known if similar neural mechanisms apply to other tasks such as visual search. The current work tested the hypothesis that high-level frontal regions, previously implicated in expectation and visual imagery of object categories, interact with visual regions associated with object recognition during visual search. Using functional magnetic resonance imaging, subjects searched for a specific object that varied in size and location within a complex natural scene. A model-free, spatial-independent component analysis isolated multiple task-related components, one of which included visual cortex, as well as a cluster within ventromedial prefrontal cortex (vmPFC), consistent with the engagement of both top-down and bottom-up processes. Analyses of psychophysiological interactions showed increased functional connectivity between vmPFC and object-sensitive lateral occipital cortex (LOC), and results from dynamic causal modeling and Bayesian Model Selection suggested bidirectional connections between vmPFC and LOC that were positively modulated by the task. Using image-guided diffusion-tensor imaging, functionally seeded, probabilistic white-matter tracts between vmPFC and LOC, which presumably underlie this effective interconnectivity, were also observed. These connectivity findings extend previous models of visual search processes to include specific frontal–occipital neuronal interactions during a natural and complex search task.
Introduction
R
The characterization of frontal–visual interactions during naturally occurring visual tasks, that is, sustained searching for an object embedded within a complex scene, as well as the quantification and characterization of structural connections that underlie these functional interactions, remains as an active research goal. Here, we hypothesized that during natural visual search, when only the target object category is known in advance, frontal regions interact with stimulus category-responsive visual areas, and that structural and functional pathways between these regions could be demonstrated.
In the current study, subjects were instructed to indicate the presence and location of a specific object that varied in the size and location in a complex natural visual scene. A model-free multivariate analysis (spatial-independent component analysis [ICA]) was applied to the functional imaging data to identify spatially distributed and synchronized regions engaged during this complex visual search task. We first conducted an ICA (rather than a standard general linear model [GLM] analysis) for three reasons: (1) we aimed to identify groups of synchronized, or functionally connected regions, and of particular interest were visual and frontal regions within the ventral and medial prefrontal cortex (vmPFC); (2) ICA avoids imposing a priori models and assumptions to the data, which were particularly important, given that we used a complex and relatively natural and ecologically valid task; and (3) while vmPFC is a part of the Default Mode Network, which is typically deactivated during tasks requiring attention, a component of vmPFC activity that is synchronized with positive visual activity during search should be isolated by ICA.
Independent components (ICs) were sorted according to their temporal profiles to isolate functionally meaningful brain areas related to the visual search task. The highest task-related spatial component included dorsal and ventral visual areas as well as vmPFC. Based on previous findings, suggesting a role for vmPFC in stimulus object-category expectation and imagery during object discrimination and detection and concomitant interactions with visual association areas in a stimulus selective manner (Bar, 2003; Mechelli et al., 2004; Summerfield et al., 2006), we hypothesized that vmPFC also interacts with object/feature-sensitive visual regions during visual search. Finally, we employed diffusion tensor imaging (DTI) to test the hypothesized structural connectivity between activated regions in vmPFC and lateral occipital cortex (LOC) using probabilistic tractography in a sample of 108 additional subjects that were not participants in the functional study. We focused on LOC, since it is known be highly specialized to visual objects (Amedi et al., 2001; Grill-Spector et al., 2001; Ishai et al., 2000; Spiridon et al., 2006), and also, because it has been shown to be responsive to the anticipation of search for an object, even in the absence of visual input, and predicted performance during subsequent detection (Peelen and Kastner, 2011).
Here, we show that (1) vmPFC is involved in visual processing during search for an object embedded within a complex scene; (2) there is increased functional connectivity and bidirectional, positive effective connectivity between vmPFC and object-sensitive LOC during the task; and (3) there exist white-matter tracts between these interacting regions. These findings provide evidence of structural and functional paths underlying task-related functional interactions between vmPFC and object-sensitive regions (LOC) during visual search.
Materials and Methods
Subjects
Fifteen (five female) healthy volunteers (mean age=31; SD=10, 13/15 right handed) with normal or corrected-to-normal vision participated in the search study, and 108 subjects (mean age=30.8; SD=11.3) participated in the DTI-only study, in accordance with institutional guidelines for research with human subjects. Recruitment, evaluations, and scans were all performed at the Columbia University Medical Center in the fMRI Research Center.
Experimental paradigms and procedure
Stimuli were presented in Visual Basic and displayed on a back-projection screen that was viewed by the subjects via a mirror attached to the scanner head coil. The visual search trials (26 per run) were presented within a slow event-related (nonjittered) design with 20 sec, or 10 TRs, between the onsets of each trial. Each trial consisted of a stimulus presentation lasting 10 sec, with 10 sec of rest between the end of one trial and the beginning of the next. Within each rest epoch, 2 sec of static noise was presented (to erase iconic memory) followed by 8 sec of a black, blank field. The total run time was 9 min 12 sec. Each trial consisted of a presentation of 1 of 8 types of pictures: 1 that contained no target, and 7 that contained the target (an object resembling a 2.5-ton truck that was not camouflaged) at one of 7 different sizes, calibrated by distance from the viewer (600, 700, 1100, 1300, 1700, and 2800 meters). Each picture consisted of the same background (i.e., photo of a cluttered landscape). The location of the target also varied, so that it appeared pseudorandomly in one of 9 areas of the picture (left, middle, right and lower, middle, and upper sections of the scene). Each target location was presented three times in each run, and the no-target trial was presented five times. Stimuli were presented in a random order. Subjects were instructed to decide whether a target was present in the image: if “no,” they would click on “next”, and if “yes,” they would click on the location of the target with a trackball (using the right hand). The task is summarized in Figure 1. The response time and the decision type, correct positive (hits: +C), incorrect positive (false alarm: +F, no target was present or a wrong location was clicked in the image), correct negative (correct reject: -C), and incorrect negative (-F: miss, a false “no”) were recorded. Although eye movements were not measured, subjects were given instructions to scan the scene while maintaining a stable head position.

Visual search task. Subjects were instructed to indicate whether a target was present in the image: if “no,” they would click on “next” in the bottom right corner of the image, and if “yes,” they would click on the location of the target with a trackball (using the right hand). Each epoch consisted of the presentation of a picture, which either contained no target, or a target that varied in size and location within the scene (see the Methods section). Each picture consisted of the same background, as shown in the top left panel.
Image acquisition
All functional images were acquired with a GE Twin-Speed 1.5T scanner, with T2*-weighted echo planar imaging (EPI) sequence of 24 contiguous interleaved axial slices [TR=2000, TE=38 ms, field of view (FOV)=192 mm, array size=64×64”] of 4.5-mm thickness and 3×3-mm in-plane resolution, providing whole-brain coverage. High-resolution anatomical scans were acquired with a T1-weighted spoiled gradient recalled (SPGR) sequence (TR=19 ms, TE=5 ms, flip angle=20°, FoV=220×220 mm), recording 124 slices at a slice thickness of 1.5 mm and in-plane resolution of 0.86×0.86 mm.
DTI images were acquired on the same scanner using an 8-channel sense head coil with a single-shot sequence of 55 unique diffusion directions at a b-value=900 with TE=7.8 ms and TR=17000 ms. A single volume (b-value=0) was acquired and used as a reference to correct for eddy currents and head motion (Jenkinson and Smith, 2001). Isotropic (2.5-mm3 voxels) diffusion-weighted data were acquired for all subjects. The array size was 128×128 in an FOV of 32×32 mm. A total of 58 slices were acquired, and the total scan time was 16 min and 32 sec. DTI scans from 108 total healthy volunteers, which were acquired and archived in our lab, were included in the structural connectivity portion of this study that examined pathways between vmPFC and bilateral LOC.
Image analysis
Preprocessing was done in SPM2 (
Spatial ICA
Group spatial ICA was implemented with the GIFT toolbox v1.3d (Calhoun et al., 2001). Spatial ICA assumes that signal sources (i.e., ICs) consist of spatially distributed brain regions that are largely spatially independent (i.e., functional modularity) and add linearly (McKeown and Sejnowski, 1998). Thus, at each voxel in the brain, the BOLD response is decomposed into a sum of sources (time courses of the ICs), each weighted by a different value particular to that voxel. Group ICA is implemented by concatenating the subjects' (spatially normalized) time series together, so that the resulting spatial ICs are the same across all subjects (but the temporal profiles may vary from subject to subject). For each IC, statistical inference is then conducted on the loadings across all subjects at each voxel. For more details, please see Calhoun et al., 2001.
The minimum description length criteria (Li et al., 2007) were used to estimate the number of informative ICs (25). Briefly, this approach employs a subsampling scheme to obtain a set of effectively independent and identically distributed samples from the dependent data samples and apply the information–theoretic criterion formulas to this set to estimate the number of informative components. The Infomax algorithm (default in GIFT) was used to conduct the ICA. ICA is model free and allows for variations in the shape of the hemodynamic response function (HRF) (temporal profile) of each spatial IC from subject to subject. We sorted resulting spatial ICs by regressing their temporal profiles with a reference function created by convolving task onsets with the canonical HRF, and ranking the obtained R2 values in descending order (Table 1). The reference function included onsets for all trials, as our main goal was to identify ICs that contained visual activity, which presumably would be high on every trial. This reference function served primarily as a temporal proxy for the activation due to the task to identify ICs that were search related. While the rank order of ICs might be affected by the use of a different reference function, the overall set of identified task-related ICs is unlikely to differ. The main goal of sorting was to aid in identifying a task-related IC that contained visual cortex as well as regions in vmPFC. Group statistics was also performed, whereby beta values obtained from this regression (done separately for each subject without concatenation) for each spatial component were averaged over each subject and tested for significance from zero (one-sample t-test).
p-values are from one-sample t-tests testing for significance from zero.
ICs that were significantly correlated (or anticorrelated) with the reference function and surviving a threshold at p≤0.0001 (for the one-sample t-test of beta weights over all subjects) are listed in Table 1. There were additional 9 ICs that were correlated or anticorrelated with the task surviving a threshold of p<0.05, three of which were, on average across all subjects, positively correlated. Visual inspection of these ICs, however, revealed that they included nonphysiological spatial patterns indicative of motion artifact coinciding with the task.
GLM analysis
Two GLM models were estimated: a single-condition GLM for defining dynamic causal modeling (DCM) inputs, which consisted of all 26 search trials, and a three-condition GLM, where trials were categorized according to response type. For the latter, negative responses (Misses and correction rejections; trials in which subjects responded that there was not a target), positive responses (Hits and False Alarms [FAs]; trials in which subjects responded that there was a target), and no responses (trials that timed out before the subject responded) were modeled separately. First-level regressors were created by convolving the onsets of each trial with the canonical HRF, and the duration of each trial was set equal to the reaction time (RT). The following contrast—positive response greater than negative response trials—was then submitted to 2nd-level RFX analyses (one-sample t-test) to identify visual activity associated with perception of the target. For this contrast, only subjects that exhibited three or more instances of each trial type were included in the group analysis (12 subjects).
Psychophysiological interaction (PPI) analysis: The PPI analysis measures the extent to which regions are differentially correlated during a given task. Ventromedial prefrontal cortex (vmPFC), the primary seed of interest, was defined by each subject's maximum loading factor onto IC20 (a highly task-correlated IC that contained visual activity). An additional seed included precentral gyrus/dlPFC, which was defined by its peak MNI coordinates in IC20, [62, 0, 40]. Activity was extracted from 6-mm spheres centered at the above coordinate locations. The BOLD signal throughout the whole brain was then regressed on a voxel-wise basis against the product of this time course and the vector of the psychological variable of interest, (1*Search condition±1*Nonsearch condition), with the physiological and the psychological variables serving as regressors of no interest (nonsearch condition was defined as the period encompassing the end of one trial to the beginning of the next). Resulting beta maps were subsequently passed to 2nd-level random effects analysis (one sample t-test as well as multiple regression with subjects' accuracy scores). For whole-brain cluster-extent correction, an uncorrected p-value of 0.005 was used, and contiguous clusters of size 147 or more were deemed significant at p<0.05 corrected. This number was determined by 2000 Monte Carlo simulations of whole-brain functional magnetic resonance imaging (fMRI) data with respective data parameters of the present study, according to the approach as implemented in AFNI 3dClustSim (Cox, 1996).
Effective connectivity
Effective connectivity analyses were carried out using DCM as implemented in SPM8 (
in which dz1/dt is the state vector per unit time for the target region, and z2 corresponds to time series data from the source region. ui indicates the direct input to the model, whereas um indicates input from the modulatory variable onto intrinsic pathways specified by the model. Activity in the target region is therefore determined by an additive effect of the intrinsic connectivity with the source region (Az2), the bilinear variable (umBz2, corresponding to the modulatory experimental manipulation), and the effects of direct input into the model (Cui).
A single-condition GLM analysis was conducted (see the GLM analysis section) to extract time series data from the regions of interests (ROIs). The MNI coordinates of vmPFC activity were the same as those used for PPI analysis (see above). An LOC mask of coordinates containing >40% probability of the label, lateral occipital cortex, inferior division, was defined using the Harvard-Oxford atlas. Individual subject's MNI coordinates that fell within this mask were specified according to highest T-values from the positive response greater than negative response (Hits+FA>Misses+Correct rejects) contrast from the 3-condition GLM analysis described above (see Table 3). For each ROI, time series data were extracted from a 6-mm-diameter sphere around each coordinate and were adjusted for effects of interest.
Model Comparison and Selection: We estimated and compared a set of DCM models that included connections between vmPFC and LOC. Within this set, model parameters were systematically varied with respect to task effects on regions and connections, with the primary goal of determining whether a model that included task-modulated connections between vmPFC and visual cortex was the most likely. Multiple DCM models were evaluated separately for each subject, and random-effects Bayesian model selection (RFX BMS) as implemented in SPM8 was used to identify the optimal model that explained the data. RFX BMS accounts for heterogeneity of the model structure across subjects and yields exceedance probabilities, which is the probability that one model is more likely than any other model, given the group data (Stephan et al., 2010). For each connectivity parameter from the optimal model, significance was assessed using a one-sample t-test over all subjects. Unless otherwise indicated, there were 14 degrees of freedom for all reported t-values (including those from GLM analysis and ICA).
Tractography analysis
DTI analyses were completed using the FMRIB's software library diffusion toolbox (
DTI probabilistic fiber was tracked in the individual diffusion space, and resulting tracks were then normalized to the MNI standard space for visualization purposes. FLIRT (FMRIB's Linear Image Registration Tool) was used to transfer ROIs (and estimated fiber tracks) between subject and standard spaces. Spatially normalized paths were added across all subjects, generating a group representation of individual pathways. A positive (blue) value at each voxel means that 50% or more subjects contained at least one streamline (waypoint) passing through that voxel. Note that the group image does not correspond to a map of probabilistic connectivity from the seed to the waypoint mask as presented for individual subjects, but instead represents the importance of each voxel to this pathway with respect to all subjects.
Definition of ROIs
For DTI tractography on 108 subjects (who did not participate in the task), the seed ROI for vmPFC was defined as a 12-mm-radius sphere about the peak MNI coordinates for vmPFC [0, 62, −4] from the group t-map in IC20 (see Table 2). Bilateral target LOC masks for DTI were defined using 12-mm-radius spheres about the peak MNI coordinates from the contrast used to identify object-sensitive LOC in the 15 subjects who had performed the task (left: [−46, −70, −4]; right: [46, −68, −10]).
LGN, lateral geniculate nucleus.
Bold region (vmPFC) defined primary seed for subsequent functional and structural connectivity analysis.
For PPI and effective connectivity (DCM) analyses, vmPFC was defined using individual peak coordinates from each individual's IC20 (μ=[−1.6, 56.1, −8.4]; stdev=[3.6, 5.1, 4.1]). For DCM analyses, bilateral LOC was defined for each subject using the coordinate with the maximum T-value from the contrast positive response greater than negative response (see the GLM analyses section) within the same LOC mask used for DTI analyses above. Table 3 summarizes the ROI definition strategies used for all the analyses.
Contrast of positive response greater than negative response trials (Hits+FA>Misses+Correct Rejects), thresholded at p<0.05 uncorrected, with a cluster extent threshold of 30.
To ensure that no voxels within ROIs lay outside the brain, the center was shifted 3 voxels medially to [− 46, −70, −4].
N/A, Not applicable; ROI, regions of interest; MNI, Montreal Neurological Institute; PPI, Psychophysiological Interaction; DCM, dynamic causal modeling; DTI, diffusion tensor imaging; vmPFC, ventromedial prefrontal cortex; LOC; lateral occipital cortex; GLM, general linear model.
Results
Behavioral results
The overall group mean RT for the task was 6.5 sec (std=2.5), and the mean accuracy (hits+correct rejects)/total trials) was 62.1% (std=20.6). While RT increased as the target size decreased (RT vs. ranked target size, r=−0.77, p=0.02), there was not a significant correlation between accuracy and the target size (accuracy vs. target size, r=−0.56, p=0.15). Average RT for positive-response trials was 5.2 s (std=1.98), whereas average RT for negative-response trials was 7.87 s (std=1.33).
A cluster within vmPFC is synchronized with primary and association visual areas during visual search
Temporal sorting of ICs derived by spatial ICA and group statistics of beta values (Table 1) revealed three highly task-related components (Fig. 2A): 1) IC20, which consisted of primary and association visual areas, LOC, parietal and middle temporal lobe, lateral geniculate nucleus (LGN), superior colliculus, prefrontal cortex, and vmPFC; 2) IC17, which consisted of supplementary motor area (SMA), primary motor (M1), thalamus, anterior insula, and cerebellum; and 3) IC6, which consisted of posterior parietal, prefrontal, and LOC. Two ICs were also significantly anticorrelated to the task: IC25 consisted of the putative default network (posterior cingulate, lateral parietal, and medial prefrontal cortex) and IC23 consisted of lingual and parahippocampal gyrus. In addition to the group T-maps of these five components (Fig. 2A), their associated time courses averaged overall subjects are shown in Figure 2B.

Search-related spatial-independent components.
Given previous reports of ventral and medial prefrontal involvement in expectancy-related visual discrimination tasks (Bar, 2003; Peelen and Kastner, 2011; Summerfield et al., 2006), of particular interest was the appearance and inclusion of a cluster in vmPFC in the most highly task-correlated component (IC20, white arrow in Fig. 1 and bold in Table 2) that also included bilateral primary and visual association areas. This observation is consistent with the involvement of vmPFC in visual processing during the visual search task. Based on previous reports that suggest vmPFC is a source of expectancy-related signals (or predictive codes) and interacts with stimulus-category-responsive association visual cortex during the discrimination and perception of face and objects (Bar, 2003; Summerfield et al., 2006), we further tested whether our visual-related vmPFC cluster was functionally connected with object-sensitive visual association cortex during visual search.
vmPFC and LOC are functionally connected during visual search
Based on previous findings that suggest ventral and medial PFC interact with stimulus-category-specific visual regions during visual discrimination tasks (Bar, 2003; Summerfield et al., 2006), we hypothesized that vmPFC interacts with object-sensitive LOC during visual search. As there was no independent localizer task for these subjects, we used the contrast positive (Hits+FA) greater than negative (Misses and Correct Rejections) trials to define object-sensitive LOC for each subject (i.e., visual activity associated the subjective perception of an object). Since vmPFC is not necessarily associated with the perception of objects, but rather the anticipation and expectation of target category features, which should occur on every trial, vmPFC could not be isolated in this same manner. Instead, we relied on ICA to identify the vmPFC cluster whose component was synchronized with visual activity during the task.
We conducted two separate and complementary analyses: (1) we identified which visual areas exhibited increased connectivity with vmPFC during search (described more below) and (2) we located object-sensitive regions in the current design by contrasting the positive response (i.e., Hits+FA) greater than negative response (i.e., Misses and correct rejection) trials to identify regions associated with the perception of the target. We then examined the overlap within visual cortex of the above analyses. For (2), the only significant results in the entirety of visual and visual association cortex, even at a very loose threshold of p<0.1, uncorrected was LOC (left peak at [−52, −70, −4], t=5.46, p<0.001, k=83; right peak at [46, −68, −10], t=9.02, p<0.001, k=370). This is consistent with previous evidence that LOC is highly sensitive to object perception (Amedi et al., 2001; Grill-Spector et al., 2001; Ishai et al., 2000; Spiridon et al., 2006).
To identify regions that were functionally connected with vmPFC during visual search, we performed a psychophysiological interaction (PPI) analysis, an exploratory approach that identifies regions that are differentially coupled with a particular seed region during one condition versus another (i.e., searching vs. not searching). We used each subject's peak w (loading factor from IC20) nearest the vmPFC group peak [2, 52, −14] to define the vmPFC coordinates. When the seed region was vmPFC, we observed clusters within LOC, but not elsewhere within visual cortex that were more significantly more coupled with vmPFC during search condition (Fig. 3A, circled red). Furthermore, these clusters overlapped regions that were associated with perception of the target in the task (i.e., object-sensitive LOC as defined by the contrast Hits+FA>Misses+Correct Rejections, Fig. 3A, circled blue). An ROI analysis (a 12-mm sphere about peak LOC coordinate in above contrast Hits+FA>Misses+Correct Rejections) confirmed that object-sensitive left LOC was significantly more functionally connected with vmPFC during search (t=2.36, p=0.02), whereas right LOC failed to reach significance (t=1.18, p=0.13). Event-related averages for the above contrast also reveal that the effect of the perception of the target was stronger in the left LOC (relative to right LOC, Fig. 3B). The above results indicate that vmPFC is functionally connected with object-sensitive LOC during visual search.
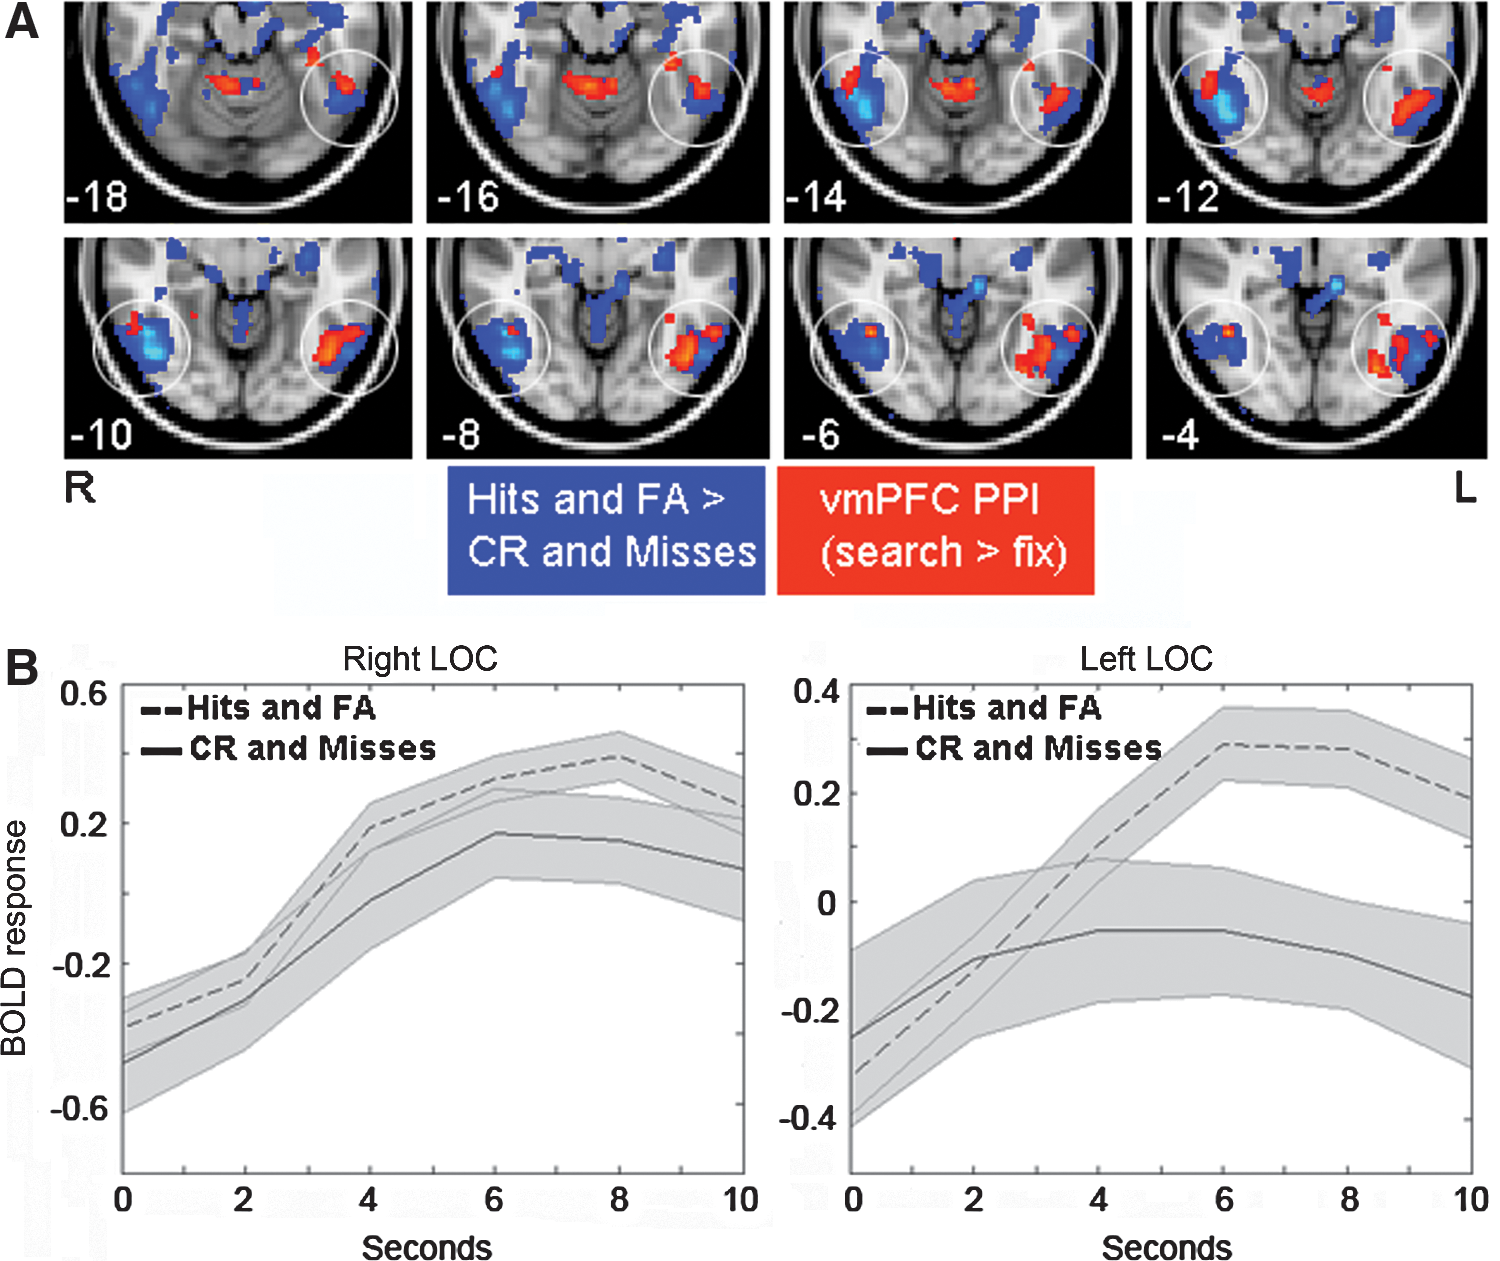
Functional connectivity between vmPFC and lateral occipital cortex (LOC) during visual search.
To further test the relative specificity of the vmPFC-LOC connectivity during visual search, we also conducted the above analyses using another seed region that was also present in IC20 (precentral gyrus/prefrontal cortex, MNI: [62, 0, 40], Table 2). For this analysis, no cluster within visual cortex survived even a loose threshold (p<0.05 uncorrected, k=10), further suggesting that frontal–occipital connectivity during search is relatively specific to the vmPFC. Finally, when LLOC was used as a seed region, three clusters survived whole-brain cluster-extent correction at p<0.05 corrected (p<0.005 uncorrected): medial PFC, peak MNI coordinate at [4, 60, 4], t=4.7, k=569, as well as a cluster in posterior cingulate and anterior middle temporal gyrus (data not shown). Taken together, the above results suggest that connectivity between vmPFC and object-sensitive LOC is preferentially engaged during visual search, and is consistent with the fact that LOC is involved in the anticipation of and search for an object (Peelen and Kastner, 2011). However, this connectivity did not correlate with performance across subjects (p=0.57), suggesting that this connectivity reflects a neural process that is generally engaged during visual search, but is not predictive of the overall performance ability in the task.
vmPFC and LOC are effectively connected during visual search
PPI analyses, a voxel-wise regression approach, were used to test the engagement and relative specificity of vmPFC-LOC frontal–occipital connectivity during visual search. However, PPI does not measure the directionality of interactions between regions. Therefore, we also conducted DCM and BMS to infer the directionality of connectivity between vmPFC and LOC and to also provide additional evidence for the existence of effective connectivity between vmPFC (as defined by each subject's IC20) and object-sensitive LOC (as defined above). Given the recently raised technical and theoretical issues regarding DCM and Bayesian Model selection (Lohmann et al., 2012), we present vmPFC-LOC and dlPFC-LOC DCM results primarily as supplementary and as additional confirmation of the above PPI results.
Twenty-one simple DCMs that include vmPFC and bilateral LOC were defined (Fig. 4A). The first set of 7 models included the full model (all regions and bidirectional connections modulated by the task), and subsequent variants where task inputs are successively removed from each region. Models 5, 6, and 7 contain no task modulation of connectivity. The second and third sets of (7) models are structured the same as the first, except that in the first set (8–14), only top-down connections are modeled, and in the second (15–21), only bottom-up connections are modeled. The primary aim of model specification and selection was to determine whether a model that included task-modulated connectivity between vmPFC and LOC was most optimal. Coordinates defining LOC for each subject were informed by the GLM analysis (positive response greater than negative response trials) restricted to left and right LOC masks (see the Methods section, Table 3).
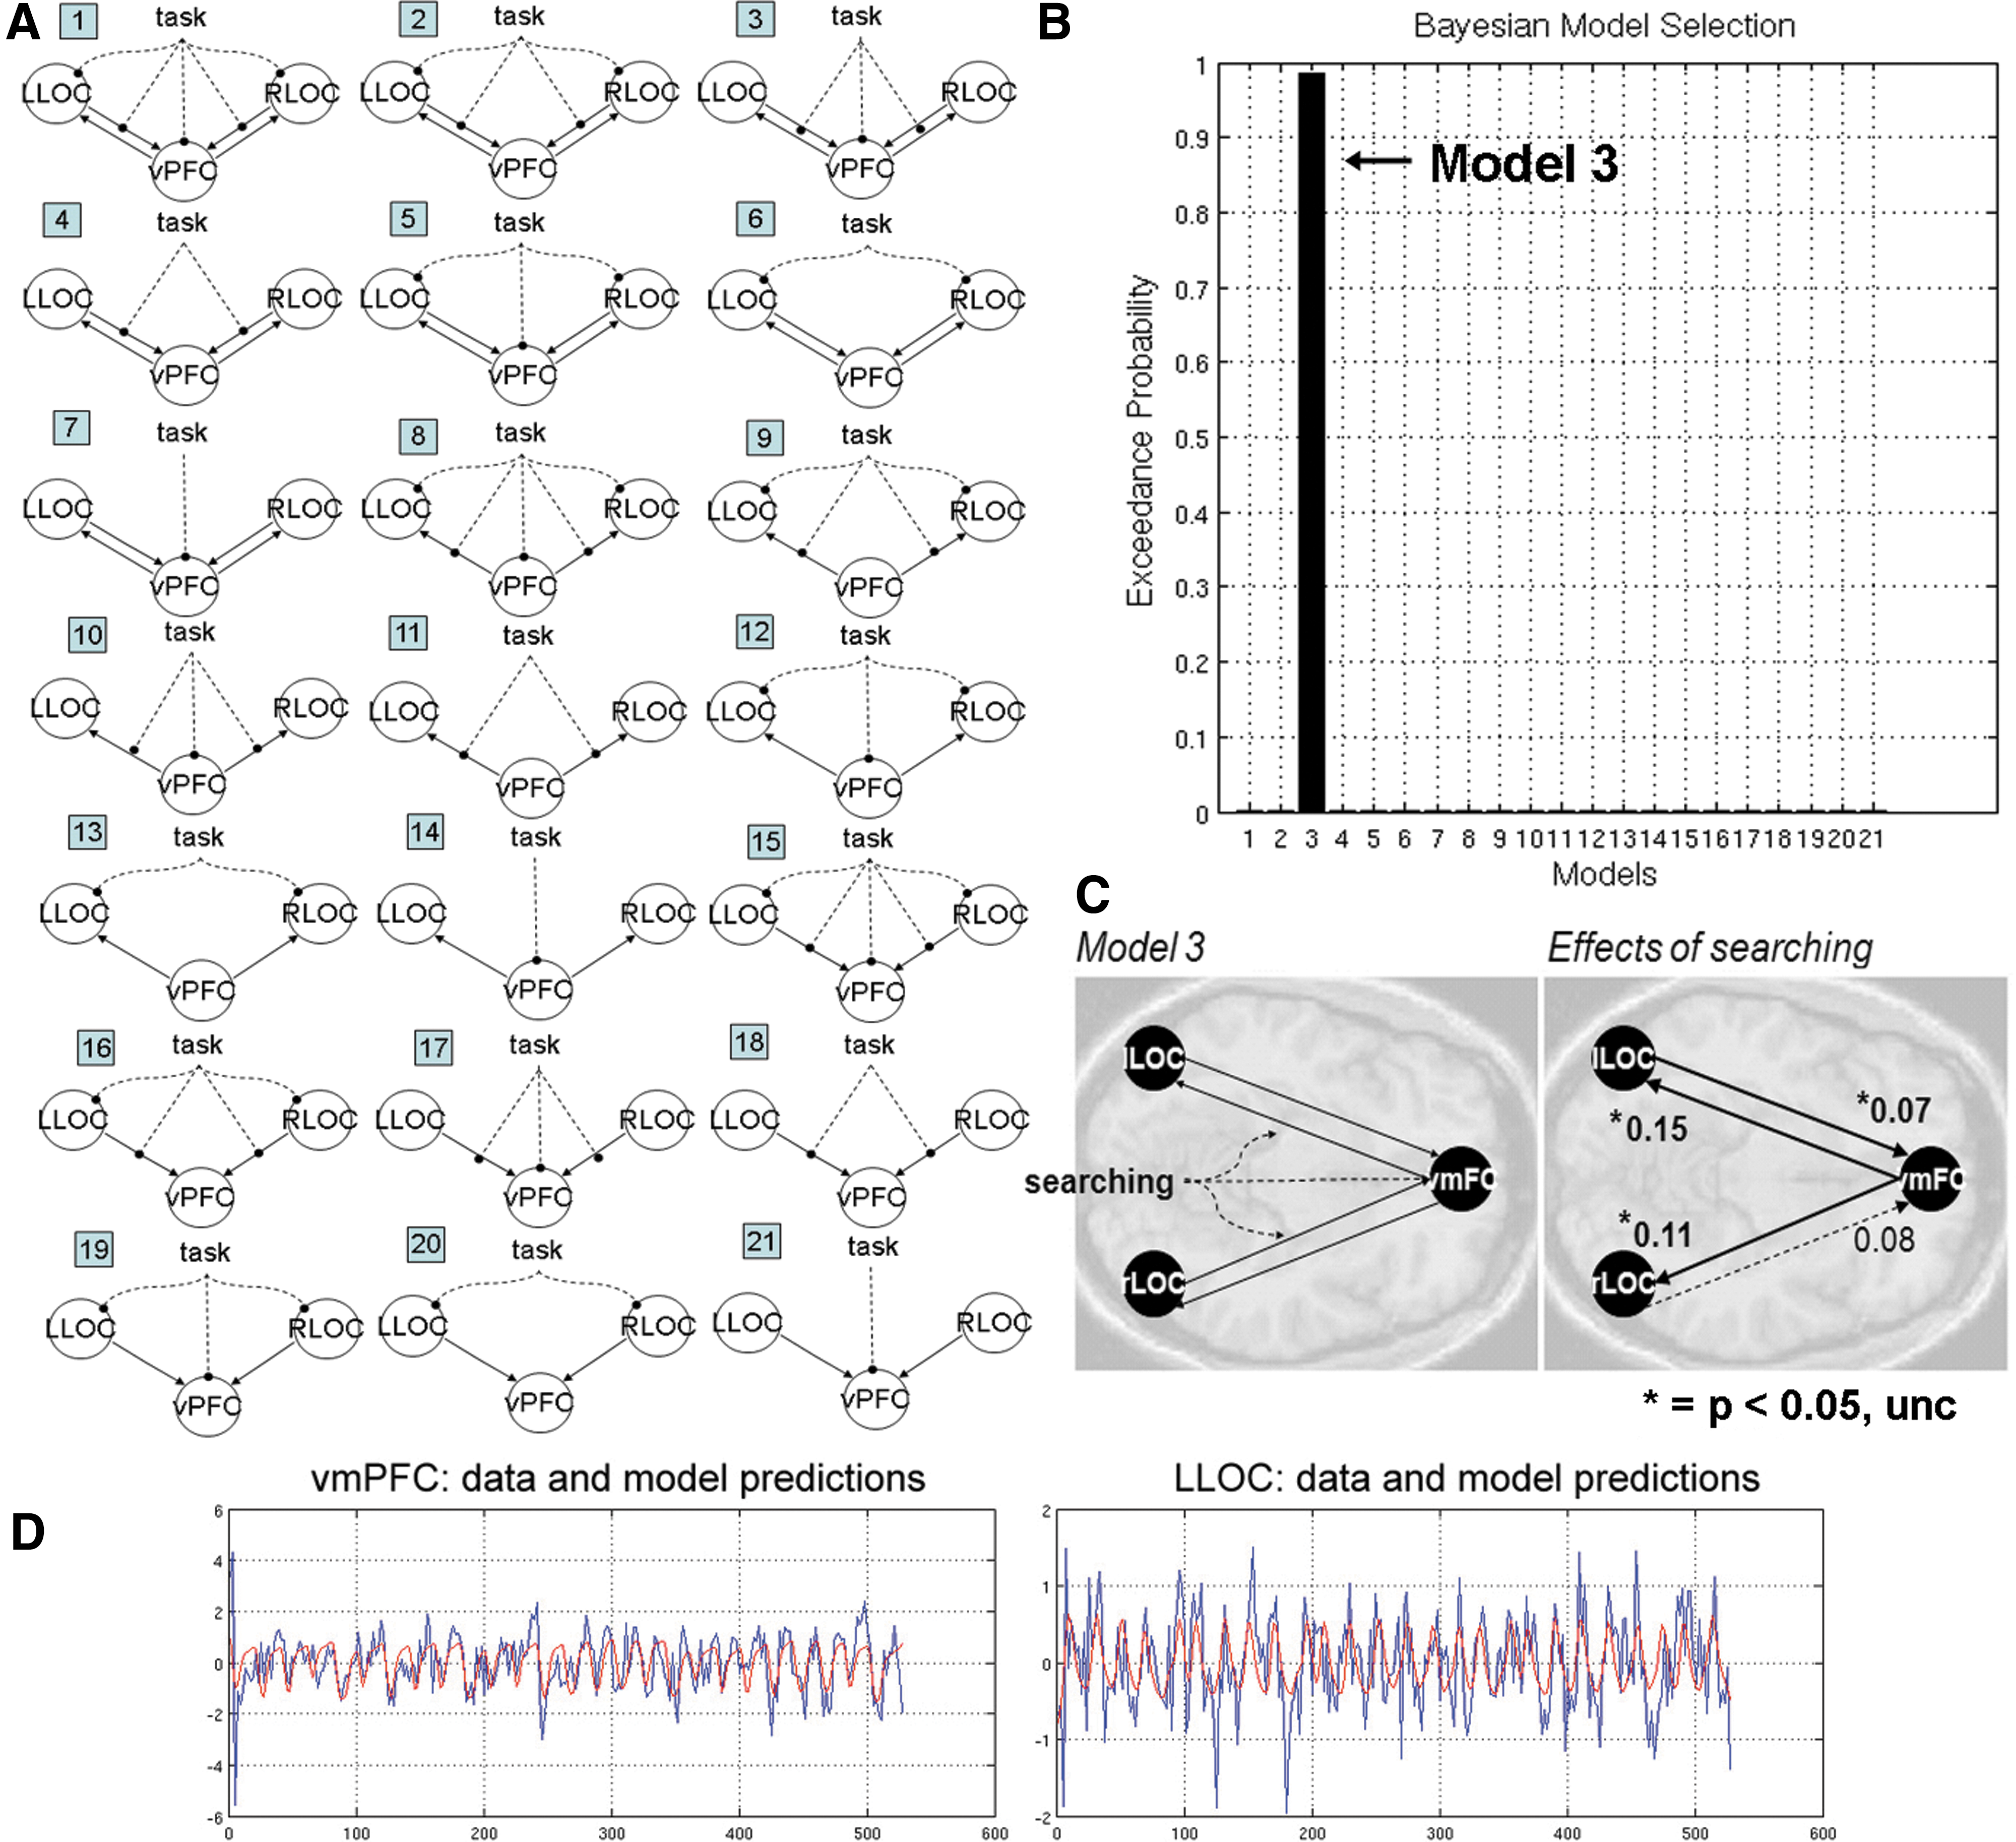
Effective connectivity between vmPFC and LOC during visual search.
According to Bayesian model selection (BMS, see the Methods section), the most optimal DCM included direct input of the task into vmPFC and bidirectional connections between vmPFC and bilateral LOC that were modulated by the task (exceedance probability=0.99, Fig. 3B, C). The mean exceedance probability over all models was 0.05, std=0.21, and the maximum was 0.99. For the optimal model (Model 3), task-induced effective connectivities in both directions between vmPFC and bilateral LOC were positive and significant across all subjects at the p<0.05 level (Fig. 3D).
We further tested whether increased frontal effective connectivity with LOC was specific to the vmPFC, to help ensure that the estimation of significant connectivity parameters was not a product of relatively few parameters and regions included in our model. For this, we reran the above 21 DCMs for 200 iterations, in which vmPFC was replaced with a randomly selected coordinate in the dorsal prefrontal cortex (defined by the AAL masks Frontal_Sup_L, Frontal_Sup_R, Frontal_Sup_Medial_L, Frontal_Sup_Medial_R, Frontal_Mid_L, and Frontal_Mid_R in the WFU_Pickatlas). In this null distribution, model 3 was still the most optimal model, but the mean exceedance probability was only 0.56 (stdev=0.20, data not shown), whereas the maximum observed value was 0.96 (as stated above, the exceedance probability with vmPFC was 0.99). The mean of the mean exceedance probabilities over all models was 0.05, std=0.13, and the maximum was 0.56. For model 3 and for each of our 200 null iterations, we conducted one-sample t-tests overall all subjects and generated a null distribution of t-scores for each of four connectivity parameters (bidirectional connections between a frontal region and left and right LOC). The mean t-values of these four connectivity parameters fell between the range of t=− 0.48 to t=0.40. We ascribed nonparametric p-values (npp) to the t-values observed for each connectivity parameter when using vmPFC as a frontal node based on the observed frequency of greater t-values when using a random dorsal prefrontal region: vmPFC->lLOC, t=2.62, npp=0.02; vmPFC->rLOC, t=2.41, npp=0.04; lLOC->vmPFC, t=2.24, npp<0.005; rLOC->vmPFC, t=1.65, npp=0.065. Taken together, the above results indicate that an increase in effective connectivity with the LOC was relatively specific to the vmPFC.
Structural connectivity between vmPFC and LOC
Although strong effective and functional interactions may still occur without direct anatomical connectivity, it is assumed that anatomical connectivity data are important in guiding the construction of neurobiologically realistic models of effective connectivity (Stephan et al., 2009). Therefore, we also tested the extent of structural connectivity between vmPFC and LOC. It should be noted that DTI does not necessarily assess direct anatomical connectivity, and the observed structural paths may be polysynaptic. For DTI analyses, seed and target masks were created from 12-mm-radius spheres about the peak coordinate for vmPFC from IC20 (Table 2) and bilateral LOC as defined above (i.e., from the contrast Hits+FA>Misses and correct rejections, see Table 3). Structural paths between vmPFC and left and right LOC for 108 subjects who did not complete the task are shown in Figure 5. These findings confirm substantial white-matter connectivity between vmPFC and (particularly left) LOC. The DTI results are based on a large sample of subjects, most of which did not perform the task. Since only 6 of the subjects who actually performed the task also acquired DTI scans, association of the integrity of this and other tracts with performance and/or functional connectivity measures is not possible in this study.
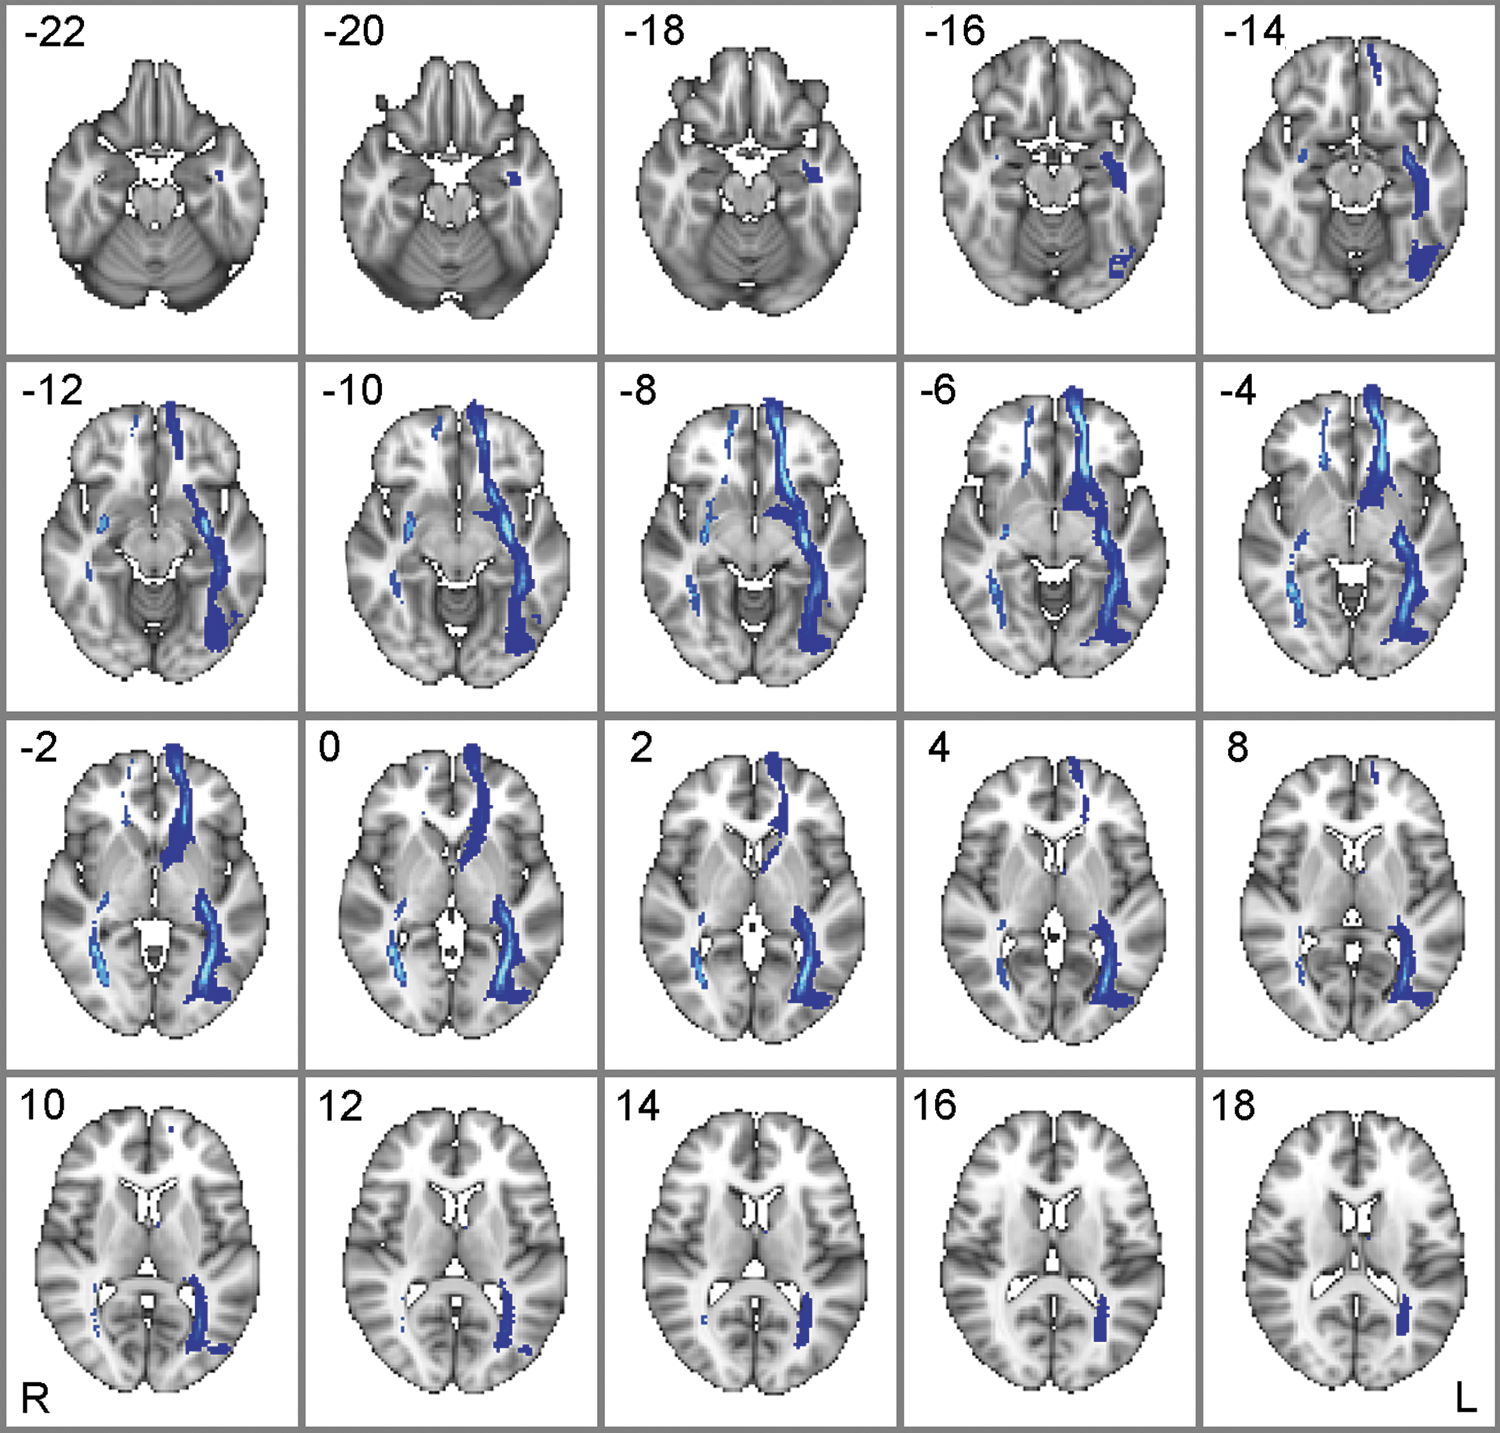
White matter paths between vmPFC and bilateral LOC. White matter paths for 108 subjects that did not participate in the task. The vmPFC regions of interest was defined by a 12-mm-radius sphere about the peak coordinate from the group IC20 t-map [0 62 4], and bilateral LOC was defined by 12-mm-radius spheres about peak coordinates for object-sensitive LOC (left: [−46, −70, −4], right: [46, −68, −10]; see Table 3). Paths were thresholded to show voxels in which 50% or more subjects exhibited at least one or more waypoints from vmPFC to LOC (the maximum streamlines in the left pathway was 42, whereas the right pathway was 3). Maps are in radiological convention (right=left, and top-left numbers in each panel indicate the z MNI coordinate).
Discussion
Here, we show that (1) vmPFC is correlated with visual activity involved in search for an object embedded within a complex scene; (2) there is bidirectional, positive functional, and effective connectivity between vmPFC and LOC during the search task; and (3) there exist white matter tracts between these interacting regions. These findings provide evidence of structural paths underlying task-related functional interactions between vmPFC and object-sensitive regions (LOC) during visual search.
A recent and related study applied search light and multivoxel pattern analysis to reveal that activity patterns within the medial prefrontal cortex (whose peak MNI coordinates—[2, 43, 5]—were very close to ours, [0, 62, −4]) as well object-sensitive LOC showed a significant category-specific cue effect in anticipation of visual search for people or cars in subsequent briefly presented (100 ms) natural scenes (Peelen and Kastner, 2011). The authors conclude that medial prefrontal cortex may constitute a top-down source of preparatory activity observed in object-sensitive LOC. Here, we extend these findings with the demonstration of increased effective connectivity between these regions during extended visual search lasting ∼4–10 sec.
To the authors' knowledge, this study was the first to characterize functionally seeded, probabilistic white-matter paths between vmPFC and object-sensitive LOC. We propose that these structural paths underlie the observed fronto-occipital functional interactions during visual search. It is suggested that the vmPFC and its projections to visual cortex may mediate expectancy-related, stimulus-specific attentional mechanisms during visual discrimination and search, and may be more or less an enhanced feature of the human brain.
A recent DTI study used a spatial attention task to determine visuospatial attention-related ROIs to functionally seed DTI analyses of a visuospatial attention network (Umarova et al., 2010). Dorsal connections that link temporoparietal cortex with frontal eye fields and area 44 of the inferior frontal gyrus were described, as well as the ventral connections, which traveled in the white matter between insular cortex and putamen parallel to the sylvian fissure. However, while this study used fMRI to inform structural DTI analyses, they did not focus on ventral prefrontal–occipital pathways.
Our observation of bidirectional positive effective connectivity between vmPFC and LOC during the search task is consistent with the theory of predictive coding, which postulates that bottom-up, degenerate sensory information is matched with top-down expectations (Mumford, 1992; Rao and Ballard, 1999), and that bottom-up and top-down analyses appear to occur in the cortex simultaneously (Friston, 2002; Grossberg, 1980) (Lee and Mumford, 2003). Top-down modulation of visual processing during face recognition has been shown to involve positive effective connectivity between vmPFC and a fusiform area responsive to faces (FFA) during a face detection task (Summerfield et al., 2006). Similar top-down projections from orbital frontal cortex during object recognition have been shown using fMRI combined with magnetic encephalography (MEG) (Fenske et al., 2006). These and other studies have also suggested that bottom-up, coarse visual information is rapidly projected to areas within vmPFC to form an initial template for predictive codes that are subsequently projected to object-sensitive and face-sensitive visual processing regions during matching with more detailed bottom-up information (Bar, 2003; Summerfield et al., 2006).
Spatial ICA extracted several independent spatial components that were significantly correlated to the task. IC25 was anticorrelated with the task and contained the putative default mode network (Greicius et al., 2003; Raichle et al., 2001), and IC23 contained task-related deactivation of the lingual and parahippocampal gyrus. IC6 contained an attentional, or task-positive (Fransson, 2006; Kennedy and Courchesne, 2008), frontoparietal network made up of parietal lobule, dorsolateral prefrontal cortex, and tempero-occipital lobe. These areas are assumed to be associated with the mediation of spatial selective attention (Dosenbach et al., 2007; Hahn et al., 2006; Lawrence et al., 2003), as well as executive attention and cognitive control (Dosenbach et al., 2007). IC17 consisted of supplementary premotor and motor areas, thalamus, and cerebellum and are consistent with spatial orienting and saccade and response execution during the task (Ploran et al., 2007; Rosen et al., 1999; Seeley et al., 2007). The most highly task-related spatial component (IC20), which had the highest R 2 value (0.41) from temporal sorting using the canonical HRF as a reference function, contained early visual areas (bilateral LGN and V1/V2/V3/V4), association visual areas (LOC and fusiform gyrus), ventral and dorsal stream visual areas (middle temporal and posterior parietal cortex), superior colliculus, SMA, M1, and vmPFC.
Conclusion
In the present study, we employed a multivariate analysis of fMRI data obtained during a natural search and a detection task to isolate a highly task-related component that contained primary and association visual areas, as well as vmPFC. The functional and structural connectivity of this visual and search-related vmPFC cluster with object-sensitive visual areas was tested using functional (PPI), effective (DCM), and structural (DTI) connectivity analyses. These analyses revealed increased functional and effective connectivity between vmPFC and LOC during visual search, as well as substantial white-matter connectivity between them. These data suggest a role of vmPFC during visual search that involves functional interactions with object-sensitive visual regions.
Author Contributions
S.P.P. and J.H. collected data; J.H. supervised the study, contributed primary hypotheses, and made substantive intellectual and editorial contributions. S.P.P analyzed the data, except for DTI tractography, and wrote the article. T.K.Y and X.Z. analyzed the DTI tractography and developed relevant methods. T.M. and J.H. designed the experiment.
Footnotes
Acknowledgments
Funding for this research was provided in part by an U.S. Army RDECOM-TARDEC W56H2V-04-P-L (JH), an MSTP 5T32GM007367-34 (TY), and an NRSA F31MH088104-02 (SP). We thank Darryl Bryk, Mary Bienkowski, and Euijung Sohn for programming the task paradigm, and Stephen Dashnaw for technical assistance related to image acquisition. We would like to thank Michelle Umali for theoretical and organizational contributions to the article, and Robert Debellis and Katherine Henry for proofreading the article.
Author Disclosure Statement
No competing financial interests exist.