
Abstract
The function of sleep in humans has been investigated using simultaneous electroencephalography (EEG) and functional magnetic resonance imaging recordings to provide accurate sleep scores with spatial precision. Recent studies have demonstrated that spontaneous brain oscillations and functional connectivity dissociate during nonrapid eye movement (NREM) sleep; this leads to spontaneous cognitive processes, such as memory consolidation and emotional modulation. However, variations in network connectivity across the sleep stages or between sleep/wake transitions require further elucidation. We observed changes in the connectivity of the sensorimotor and default-mode networks (DMN) mediated by midnight sleep among 18 healthy participants. The results indicated that (1) functional connectivity in both networks showed increasing dissociation as NREM sleep deepened, whereas hyperconnectivity occurred during rapid eye movement (REM) sleep; and (2) compared with connectivity before sleep, the DMN presented a comparable connectivity pattern immediately after awakening, whereas the connectivity of the sensorimotor network remained disrupted. These findings showed that connectivity patterns dissociate and reconnect coherently in both cortical networks during NREM and REM sleep, respectively. After the person awakened, the DMN connectivity was re-established before the sensorimotor reconnection. These dynamic sleep-related dissociations and reconnections between sleep/wake conditions might provide the key to understanding cognitive modulations in sleep. If so, connectivity changes might serve as an alternative indicator beyond the EEG signature to unveil the spontaneous processes that occur during sleep.
Introduction
W
The majority of sleep studies have been conducted in animal models, using invasive recording techniques and/or measurements of electroencephalography (EEG). EEG is regarded as the gold standard to identify the sleep stage: nonrapid eye movement (NREM), slow-wave sleep, or rapid eye movement (REM) sleep (Aserinsky and Kleitman, 1953). In recent decades, neuroimaging methods have become prevalent in the field of sleep research, especially in human studies. EEG-based investigations have successfully demonstrated the spontaneous and recurrent processes of neural assembly in sleep (Dang-Vu et al., 2007; Maquet et al., 1990). Positron emission tomography (PET) was used to investigate regional brain activity by mapping the reductions in regional glucose metabolism and cerebral blood flow (CBF) during human sleep (Balkin et al., 2002; Kajimura et al., 1999; Maquet et al., 1990;). Recent studies have used simultaneous EEG and functional magnetic resonance imaging (fMRI) recordings to obtain large-scale maps of brain activity during sleep. These methods offer the advantage of optimal spatiotemporal resolution, and overcome the limitation of constrained spatial (centimeters in EEG) and temporal (minutes in PET) information; they also avoid the dangers of radioactivity.
To date, studies using simultaneous EEG/fMRI methods have localized the brain activity involved in sleep regulation. Schabus et al. (2007) convolved EEG-based spindle (11–15 Hz) activity with the canonical fMRI hemodynamic response function and fed into a general linear model (GLM) to localize the brain areas, such as thalamus and anterior cingulate cortex, corresponding to NREM sleep. The following study also showed that slow wave activity was associated with the frontal gyrus, parahippocampal gyrus, and posterior cingulate cortex (PCC) (Dang-Vu et al., 2008). Similarly, ponto-geniculo-occipital waves were confirmed in human participants using simultaneous EEG/fMRI methods (Miyauchi et al., 2009). These findings and related earlier animal studies provided useful information to characterize brain activity during the various sleep stages. However, the associations between sleep activities and cognitive functions during sleep remain unclear.
Recent studies have hypothesized that interregional brain connectivity, either thalamocortical or corticocortical, might be the key component in understanding high-order cognitive functions, such as the genesis of consciousness (Boly et al., 2008a; Boveroux et al., 2010). Horovitz et al. (2009) observed a reduction in connectivity within the default-mode network (DMN) after deep sleep commenced, suggesting that future sleep investigations might gainfully investigate frontoparietal connectivity and its potential coupling with consciousness. Nevertheless, the basis of consciousness remains enigmatic, as does other brain functions during sleep. To better understand the underlying spontaneous processes that occur in sleep, further studies examining brain connectivity are warranted.
Widespread subjective human experience indicates that the key function of sleep is the restoration of physical sensitivity and energy level (Dworak et al., 2010). Previous studies have reported a phenomenon of sleep inertia, referring to slowed behavior observed after sleep (Broughton, 1968; Lubin et al., 1976). Several reports indicate that the synchronization of the sensorimotor network (SMN) that occurs during sleep may linger after the person awakens for a period ranging from minutes to hours; this after-effect is similar to that of hypnosis (Massimini et al., 2005; Tassi and Muzet, 2000). Balkin et al. (2002) used H2 15O PET to observe regional CBF changes two time points after awakening. They concluded that the connectivity between regions might account for “rapid re-establishment of consciousness followed by the relatively slow re-establishment of alertness” (Balkin et al., 2002). A recent study that investigated brain connectivity during hypnosis reported enhanced DMN connectivity and maintenance of the motor network (Pyka et al., 2011). The researchers concluded that hypnotic paralysis might induce modified cerebral representation of the self and motor abilities (Pyka et al., 2011). However, of all these investigated phenomena, sleep paralysis after awakening has yielded the least robust neurophysiological evidence to date. We hypothesized that the within-network SMN connectivity is modulated by sleep, leading to changes in the connectivity patterns during sleep and upon awakening. To estimate the integration of other cortical networks, we also examined the DMN, for its constitution of remarkable neural assemblies associated with self-awareness, to establish whether DMN connectivity changes during and after sleep.
Materials and Methods
Preparation
Eighteen healthy men (aged 20 to 39 years; mean±standard deviation: 24.2±4.5 years; all right-handed) participated in the study. All participants reported that they slept for 7 to 8 h/night; had consistent times of sleeping and rising, and no habits of taking daytime naps; experienced no excessive daytime sleepiness; and had no history of sleep, medical, or psychiatric disorders. These self-reported data were recorded during a clinical interview. Informed consent forms were obtained from all participants before the experiment, in accordance with the protocol approved by the Institutional Review Board of National Yang-Ming University. Before participating in the study, participants were asked to maintain regular sleep patterns for at least 3 days (12:00 AM to 8:00 AM as recommended sleep times) and not to consume any alcohol and/or caffeinated food or drinks on the night of the experiment. They were then instructed to complete the Pittsburgh Sleep Quality Index (PSQI), which assesses sleep quality, latency, duration, and efficiency. This instrument was used to provide a further measure of the participants' sleep quality.
EEG protocol
EEG data were recorded only for sleep scoring in this study, using a 32-channel MR-compatible system (Brain Products, Gilching, Germany). The EEG caps (BrainCap MR, EasyCap GmbH, Breitbrunn, Germany) consisted of 30 scalp electrodes for the 10–20 system and 2 additional electrodes to provide electrooculogram (EOG) and electrocardiogram (ECG) recordings. Abrasive electrode paste (ABRALYT HiCl) and the built-in 5 kΩ resistor were used to reduce electrode-skin impedance to <5 kΩ. We conducted the EEG experiments in an MRI environment using simultaneous EEG/fMRI acquisition. The EEG data were recorded using Vision Recorder software (Brain Products), synchronized to the scanner trigger signal, and then transferred through fiberoptic cables to a personal computer. The EEG signal was digitized at a 5-kHz sampling rate with a 100 nV resolution, and analog-filtered by a low-pass filter at 250 Hz and a high-pass filter at a cutoff frequency of 0.0159 Hz.
fMRI protocol
We conducted the experiments between 11:00 PM and 4:00 PM, with measurement beginning at midnight according to the usual bedtime of the participants. The MRI data were acquired using a 3T Siemens Tim Trio system (Erlangen, Germany) with a 12-channel phased-array head coil. Movement-related artifacts were minimized by placing customized cushions around the participant's head. The participants were instructed to relax and to stay awake in the scanner until the second functional scan.
For geometric localization, a set of high-resolution T1-weighted anatomical images was acquired for each participant before the functional time series. The T1-weighted images were obtained by 3D-MPRAGE (192×192×176 matrix size; 1×1×1 mm3 in-plane resolution; 900 ms inversion time; repetition time [TR]=1900 ms; echo time [TE]=2.28 ms; flip angle=9°). All functional images were acquired using a single-shot, gradient-recalled echo planar imaging (EPI) sequence (TR=2500 ms, TE=30 ms, and 80° flip angle). Whole-brain coverage was ensured by obtaining 35 axial slices per participant (220×220 mm2 field-of-view, 64×64 in-plane matrix size, and 3.4-mm slice thickness) aligned along the anterior–posterior commissure line.
The functional experiments were separated into three sessions: (1) Presleep, (2) Sleeping, and (3) Awakening. In the Presleep session, participants were instructed to rest with their eyes closed, not to think of anything in particular, and not to fall asleep during the EEG/fMRI recording. The recordings lasted for 6 min and provided 144 scans per person; the first four scans were discarded to enhance steady signal intensity. When the Sleeping session began, participants were instructed to fall asleep as soon as possible. The acoustic noise from the EPI acquisition was presented continuously with an equal-timing interval, and thus, a minimal chance of inducing EEG arousal. The scan was terminated after either of the following conditions: (1) a preset maximum scanning time (125 min, 3000 scans) was reached, or (2) the participant could not fall asleep, or woke up during a scan and was unable to return to sleep. The participants had been instructed to press a pneumatic button to indicate their desire to terminate a session under either of these conditions. In the Awakening session, participants were given the same instructions as for the Presleep session, and remained resting for 6 min immediately following the end of the Sleeping session.
During the scanning protocol, cardiac pulsation and respiratory oscillations were recorded simultaneously using an infrared oximeter and a pneumatic belt, respectively. After the scanning session, the participants were asked to describe their subjective feelings and sleep performance. These reports were used to confirm the quality of sleep recorded during the Sleeping session and the participants' wakefulness in both Presleep and Awakening measurements.
Data analysis
The EEG data were analyzed offline because of interference from strong gradient artifacts (Analyzer 2.0, Brain Products). Only four electrodes (C3, C4, O1, and O2, all referenced to the reference electrodes) were used to determine the sleep stage, in compliance with the typical sleep EEG montage. The analysis included downsampling the 4-electrode EEG signal to 250 Hz, removal of the scanner gradient (adaptive average subtraction), and removal of ballistocardiographic artifacts (using an algorithm based on estimation of R-R intervals derived from the ECG electrode). A licensed sleep technician from Kaohsiung Medical University Hospital visually categorized the sleep stages as Stage I (N1), Stage II (N2), Stage III (N3), or REM sleep. The sleep recordings were divided into 30-sec epochs according to the criteria currently used by the American Academy of Sleep Medicine (Conrad et al., 2007).
Functional MRI data were analyzed using statistical parametric mapping (SPM5; Wellcome Institute of Cognitive Neurology, UK) implemented in MATLAB (MathWorks, Inc., Torrance, CA). Motion correction was performed by registering each 3D volume to a base volume. Images were then converted into Montreal Neurological Institute (MNI) space and linearly resampled to an isotropic resolution (2×2×2 mm3). Spatial smoothing was applied using a Gaussian isotropic kernel (full width at half maximum of 6 mm) to minimize individual variances and to enhance the signal-to-noise ratio (SNR). The subsequent functional connectivity analyses (seed-correlation) were computed using REST software (Song et al., 2011). Linear detrending was applied to eliminate possible signal drift induced by system instability. A low-pass filter (<0.1 Hz) was applied to all data sets to focus on connectivity induced by low-frequency fluctuations (Wu et al., 2008).
Connectivity analysis was based on our hypothesis that SMN/DMN connectivity changes occur during sleep. We used the seed-correlation strategy to waive the uncertainty of dimensionality and component selection ambiguity (Cole et al., 2010). Spherical seeds (6 mm in diameter) were assigned on the left side of the primary motor cortex (M1) (−36, −28, 53) to measure the motor network and on the left side of the PCC (−3, −54, 24) to measure the DMN. Individual analyses were conducted using linear regression analysis. The average time series from each spherical seed was used as the major regression variable in the following GLM analysis. Other nuisance covariates were considered in GLM as well, including 6 motion parameters and time series data retrieved from the whole-brain and segmented cerebrospinal fluid masks. The resulting correlation coefficients (r) were converted to a normal distribution using Fisher's z-transform before further analysis. The Fisher transform equation is as follows:
To minimize unconscious movement in the Sleeping session, we corrected for motion and then re-estimated the signal. If the residual motion was >1 mm, the time points were removed and replaced with the average value across four neighboring time points, to preserve the temporal information. Two subsequent processes were adopted for the observation of sleep effects, as follows: (1) Segmented-timeframe analysis: All data in the Sleeping data set of each participant were partitioned into 13 nonoverlapping frames (500 sec; 200 scans per frame). Using the same seed correlation analysis over all timeframes, we assessed dynamic changes in r during sleep, for each of the two functional networks. The transformed z scores were directly used as the statistical threshold (z>0.6, uncorrected p<0.001), with a cluster size of 30 voxels (240 mm3). (2) Stage-dependence analysis: Ten participants in the group of 18 showed continued sleep stages (N1, N2, and N3) that lasted for at least 2 min each, consecutively, without EEG arousal. These 10 participants were selected for further group analysis of each sleep stage. The fMRI scoring data for participants during equivalent sleep stages were concatenated, forming a new data set for every sleep stage. Before concatenation, the voxel-wise baseline intensity in the fMRI dataset was removed to prevent false positives in connectivity maps. Same seed correlation analysis was applied to the concatenated data sets, and the results were transformed into z scores. Because the concatenated time points were stage-dependent in each person, the z scores were corrected using Bartlett's theory by dividing the variance by the degrees of freedom, for each time course of the sleep stage (Fox et al., 2005). The individual analysis was applied to connectivity maps for both NREM sleep (n=10) and REM sleep (n=2). The group results for NREM sleep were assessed using the single-sample t-test across the 10 participants, using the corrected z maps. Corrections for multiple comparisons were performed using Monte Carlo simulations to estimate the family-wise error (FWE) rate, based on the spatial correlations and minimal cluster size in the data set. The overall chance of false positives was set as p<0.05 (uncorrected p<0.001, with a minimum cluster volume of 336 mm3). For REM sleep, we reported the connectivity based on individual z maps for a small sample size.
Pre-/postsleep and selection of regions of interest
Group-level analysis was conducted for Presleep and Awakening sessions using the single-sample t-test. Group differences between the Presleep and Awakening sessions were evaluated using the paired t-test. For both tests, we used FWE-corrected p<0.05 (uncorrected p<0.001, with a minimum cluster volume of 360 mm3). To minimize condition bias, multiple regions of interest (ROIs) for each network were identified among regions that showed statistically significant connections during the Presleep session. The selected ROIs included the bilateral primary motor cortices (M1) and the supplementary motor area (SMA) for the SMN (t>7.5) and the PCC; the medial prefrontal cortex (MPFC); and the bilateral inferior parietal cortices for the DMN (t>5). For the subsequent ROI analysis, average statistics from the sleep-dependence and pre-/postsleep analyses were retrieved using the predefined ROIs, based on the group results for Presleep.
Results
One of the 18 participants reported being unable to sleep inside the scanner. The remaining participants showed effective sleep (scoring at least N1 for 2 min consecutively) with varying durations and efficiency (Table 1). The PSQI scores are shown in Table 1, and indicated the general sleep quality of each participant. Data from the 17 participants were used for Presleep and Awakening comparisons. Among the 17 participants, 10 participants who showed all three NREM sleep stages (N1–N3) were selected for further analysis of Stage-dependence process. Table 2 lists the individual time durations for each sleep stage and wakefulness during the Sleeping session. Two participants showed REM sleep patterns that lasted ∼4 min. We found no correlation (r=0.003) between sleep efficiency inside the scanner and the PSQI index (Table 1).
PSQI, Pittsburgh Sleep Quality Index.
REM, rapid eye movement.
Perturbations of connectivity while sleeping
Figure 1 shows 13 segmented frames of connectivity maps in SMN and DMN (single participant, z>0.75 for SMN and z>0.6 for DMN). Distant connectivity patterns were dynamically dissociated, proportional to the sleep depth in both networks. In SMN, connectivity strength (mean r between seed and specific brain areas) decreased among all ROIs. By contrast, the brain areas in DMN showed persistent connectivity (to PCC) in both the spatial extent (size of spatial clusters, showing significant r with seeds) and connectivity strength. Data from all other participants showed similar spatiotemporal features in functional connectivity that were contingent on the depth of sleep.
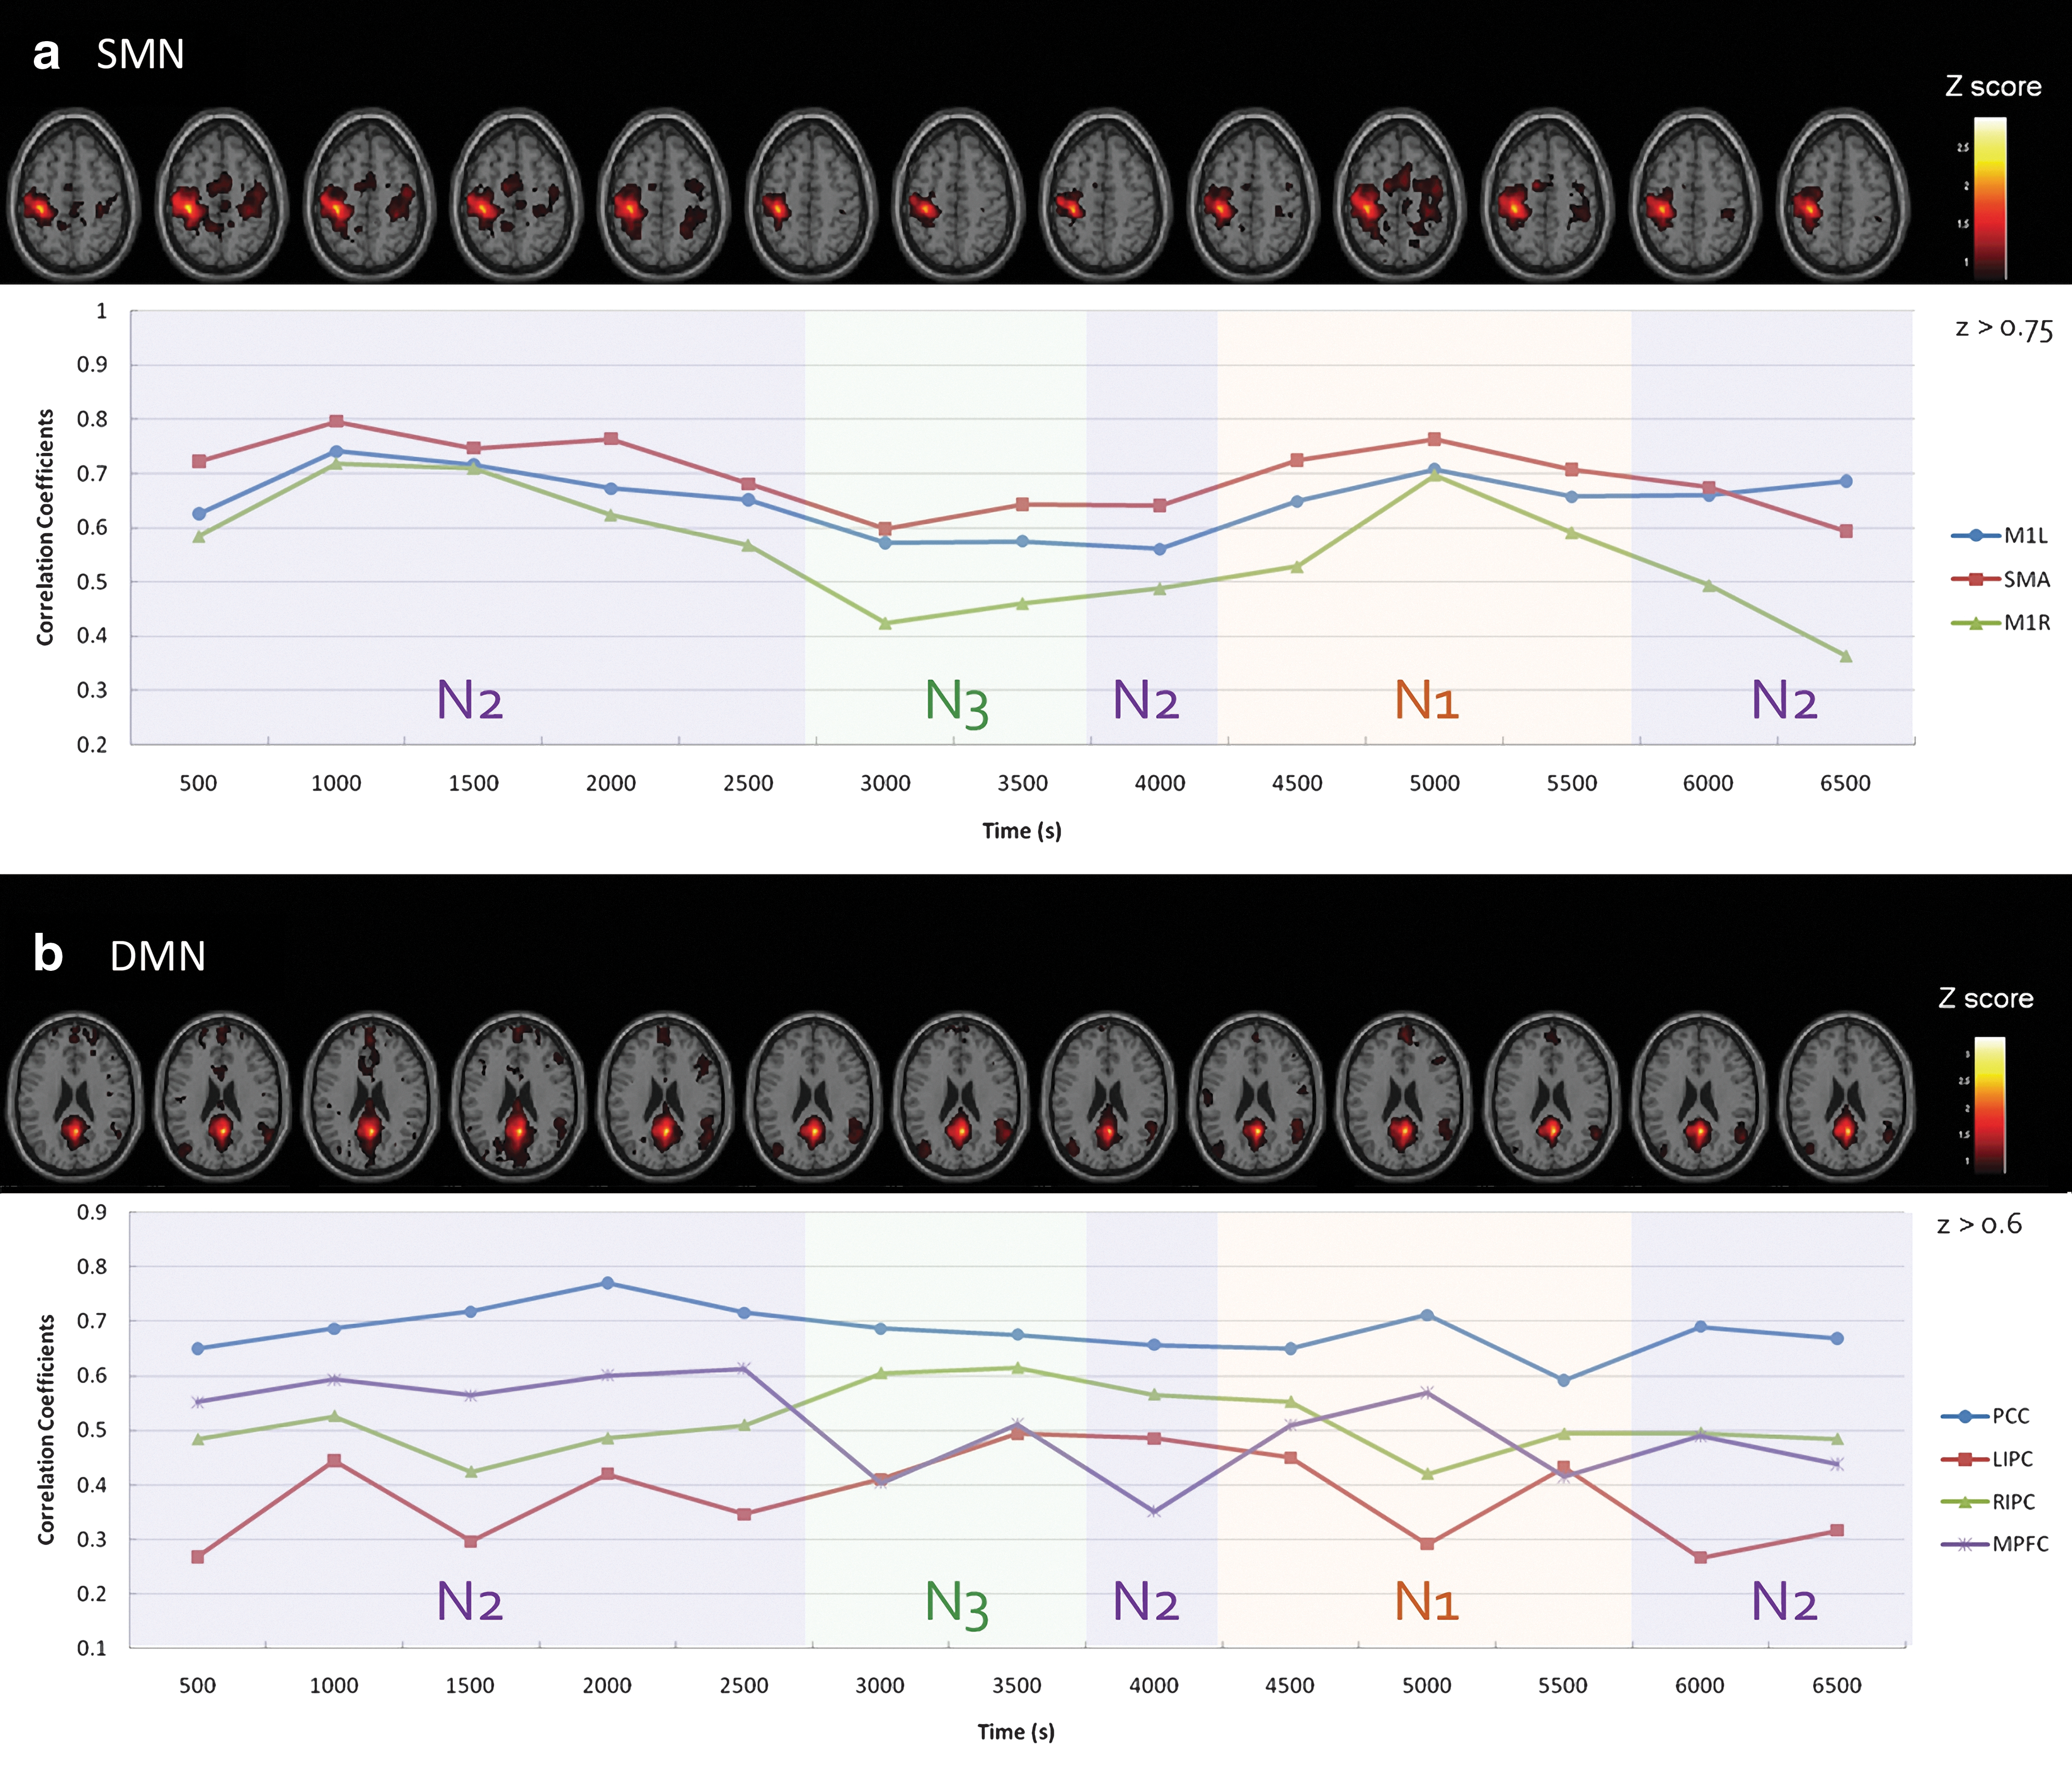
Segmented diagram (segmented in 13 nonoverlapped frames) of connectivity maps and strengths for participant 6 in the Sleeping session, showing
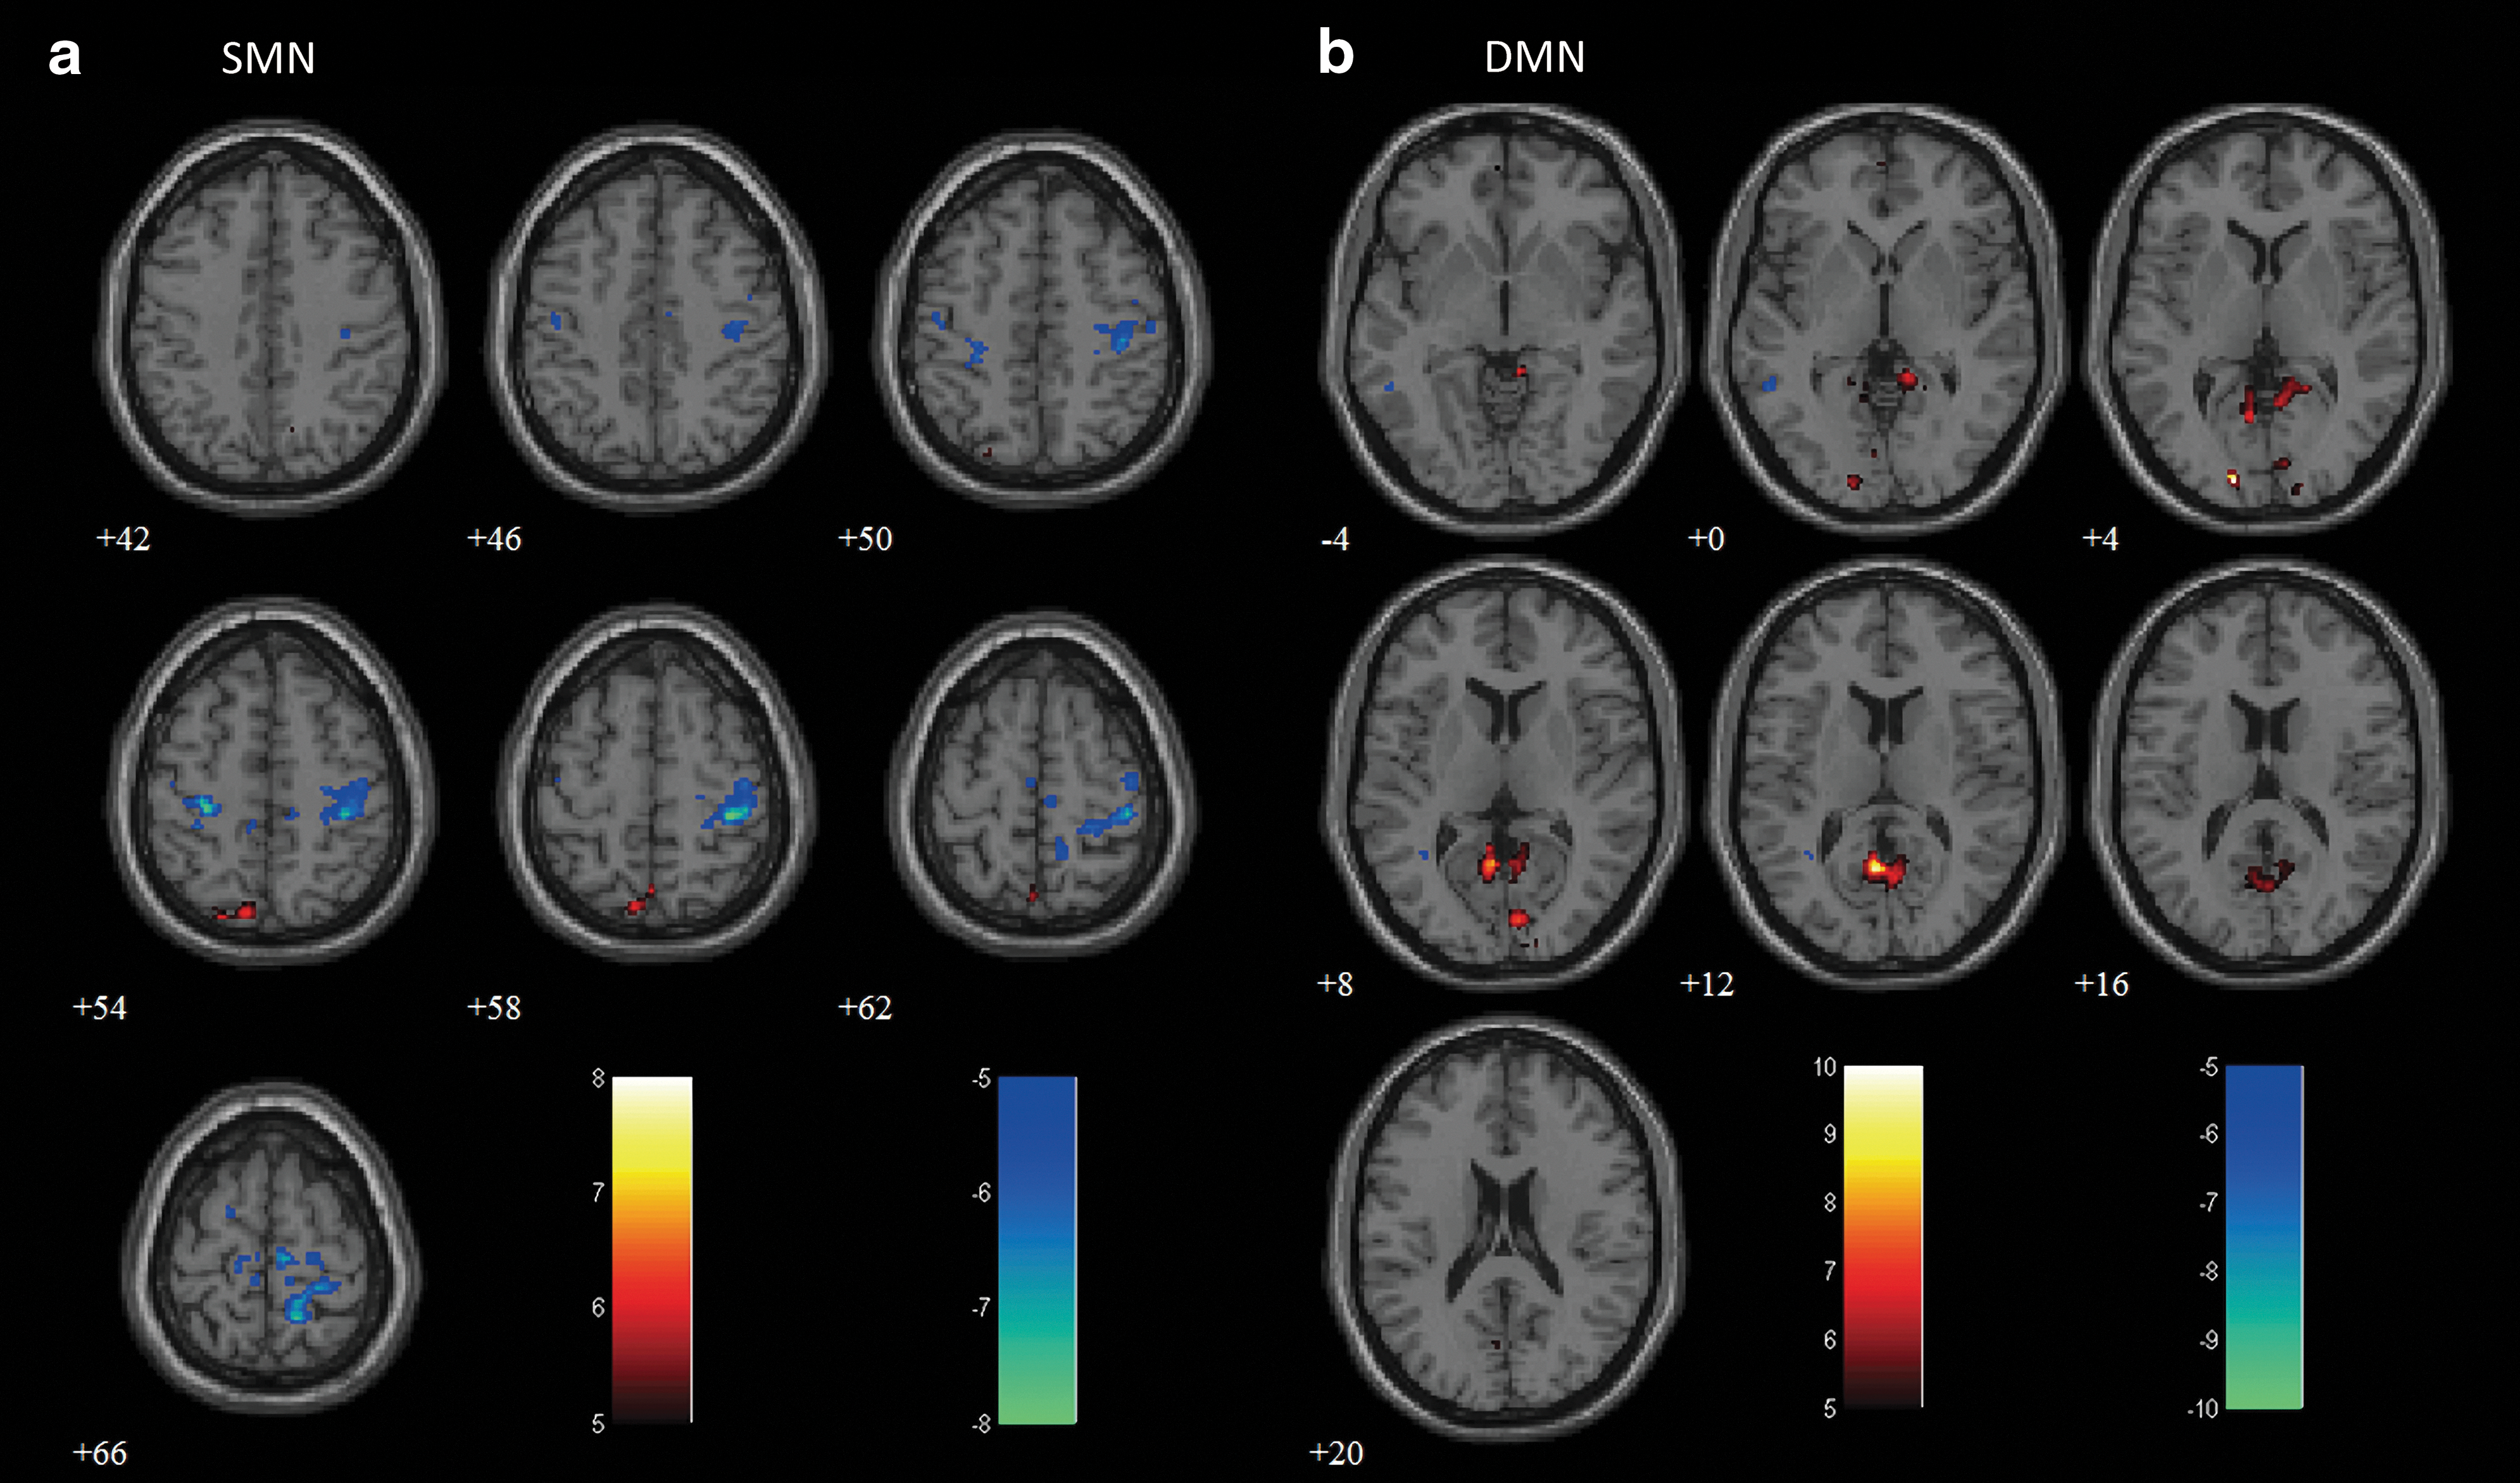
Figure 2 shows the results of the stage-dependence group analysis (t>7.5 for SMN and t>5 for DMN, FWE-corrected p<0.05), overlaid on an averaged anatomical image. Similarly, to the individual example, we observed a gradual reduction in connectivity according to sleep depth in both networks. This decrease in connectivity was especially prominent in N3, where only the ipsilateral (left M1) or local (PCC) connected regions were present around the seed locations. Applying predefined ROI masks (obtained from the Presleep session) to both networks, we evaluated r between the averaged time courses within seed and ROI regions in each network, and performed a pairwise t-test for each stage pair (Fig. 3). In SMN, connectivity strength significantly decreased at every stage (two-tailed p<0.05). However, for DMN, the only significant reduction appeared in PCC-MPFC during the transition from N2 to N3 (two-tailed p<0.05).
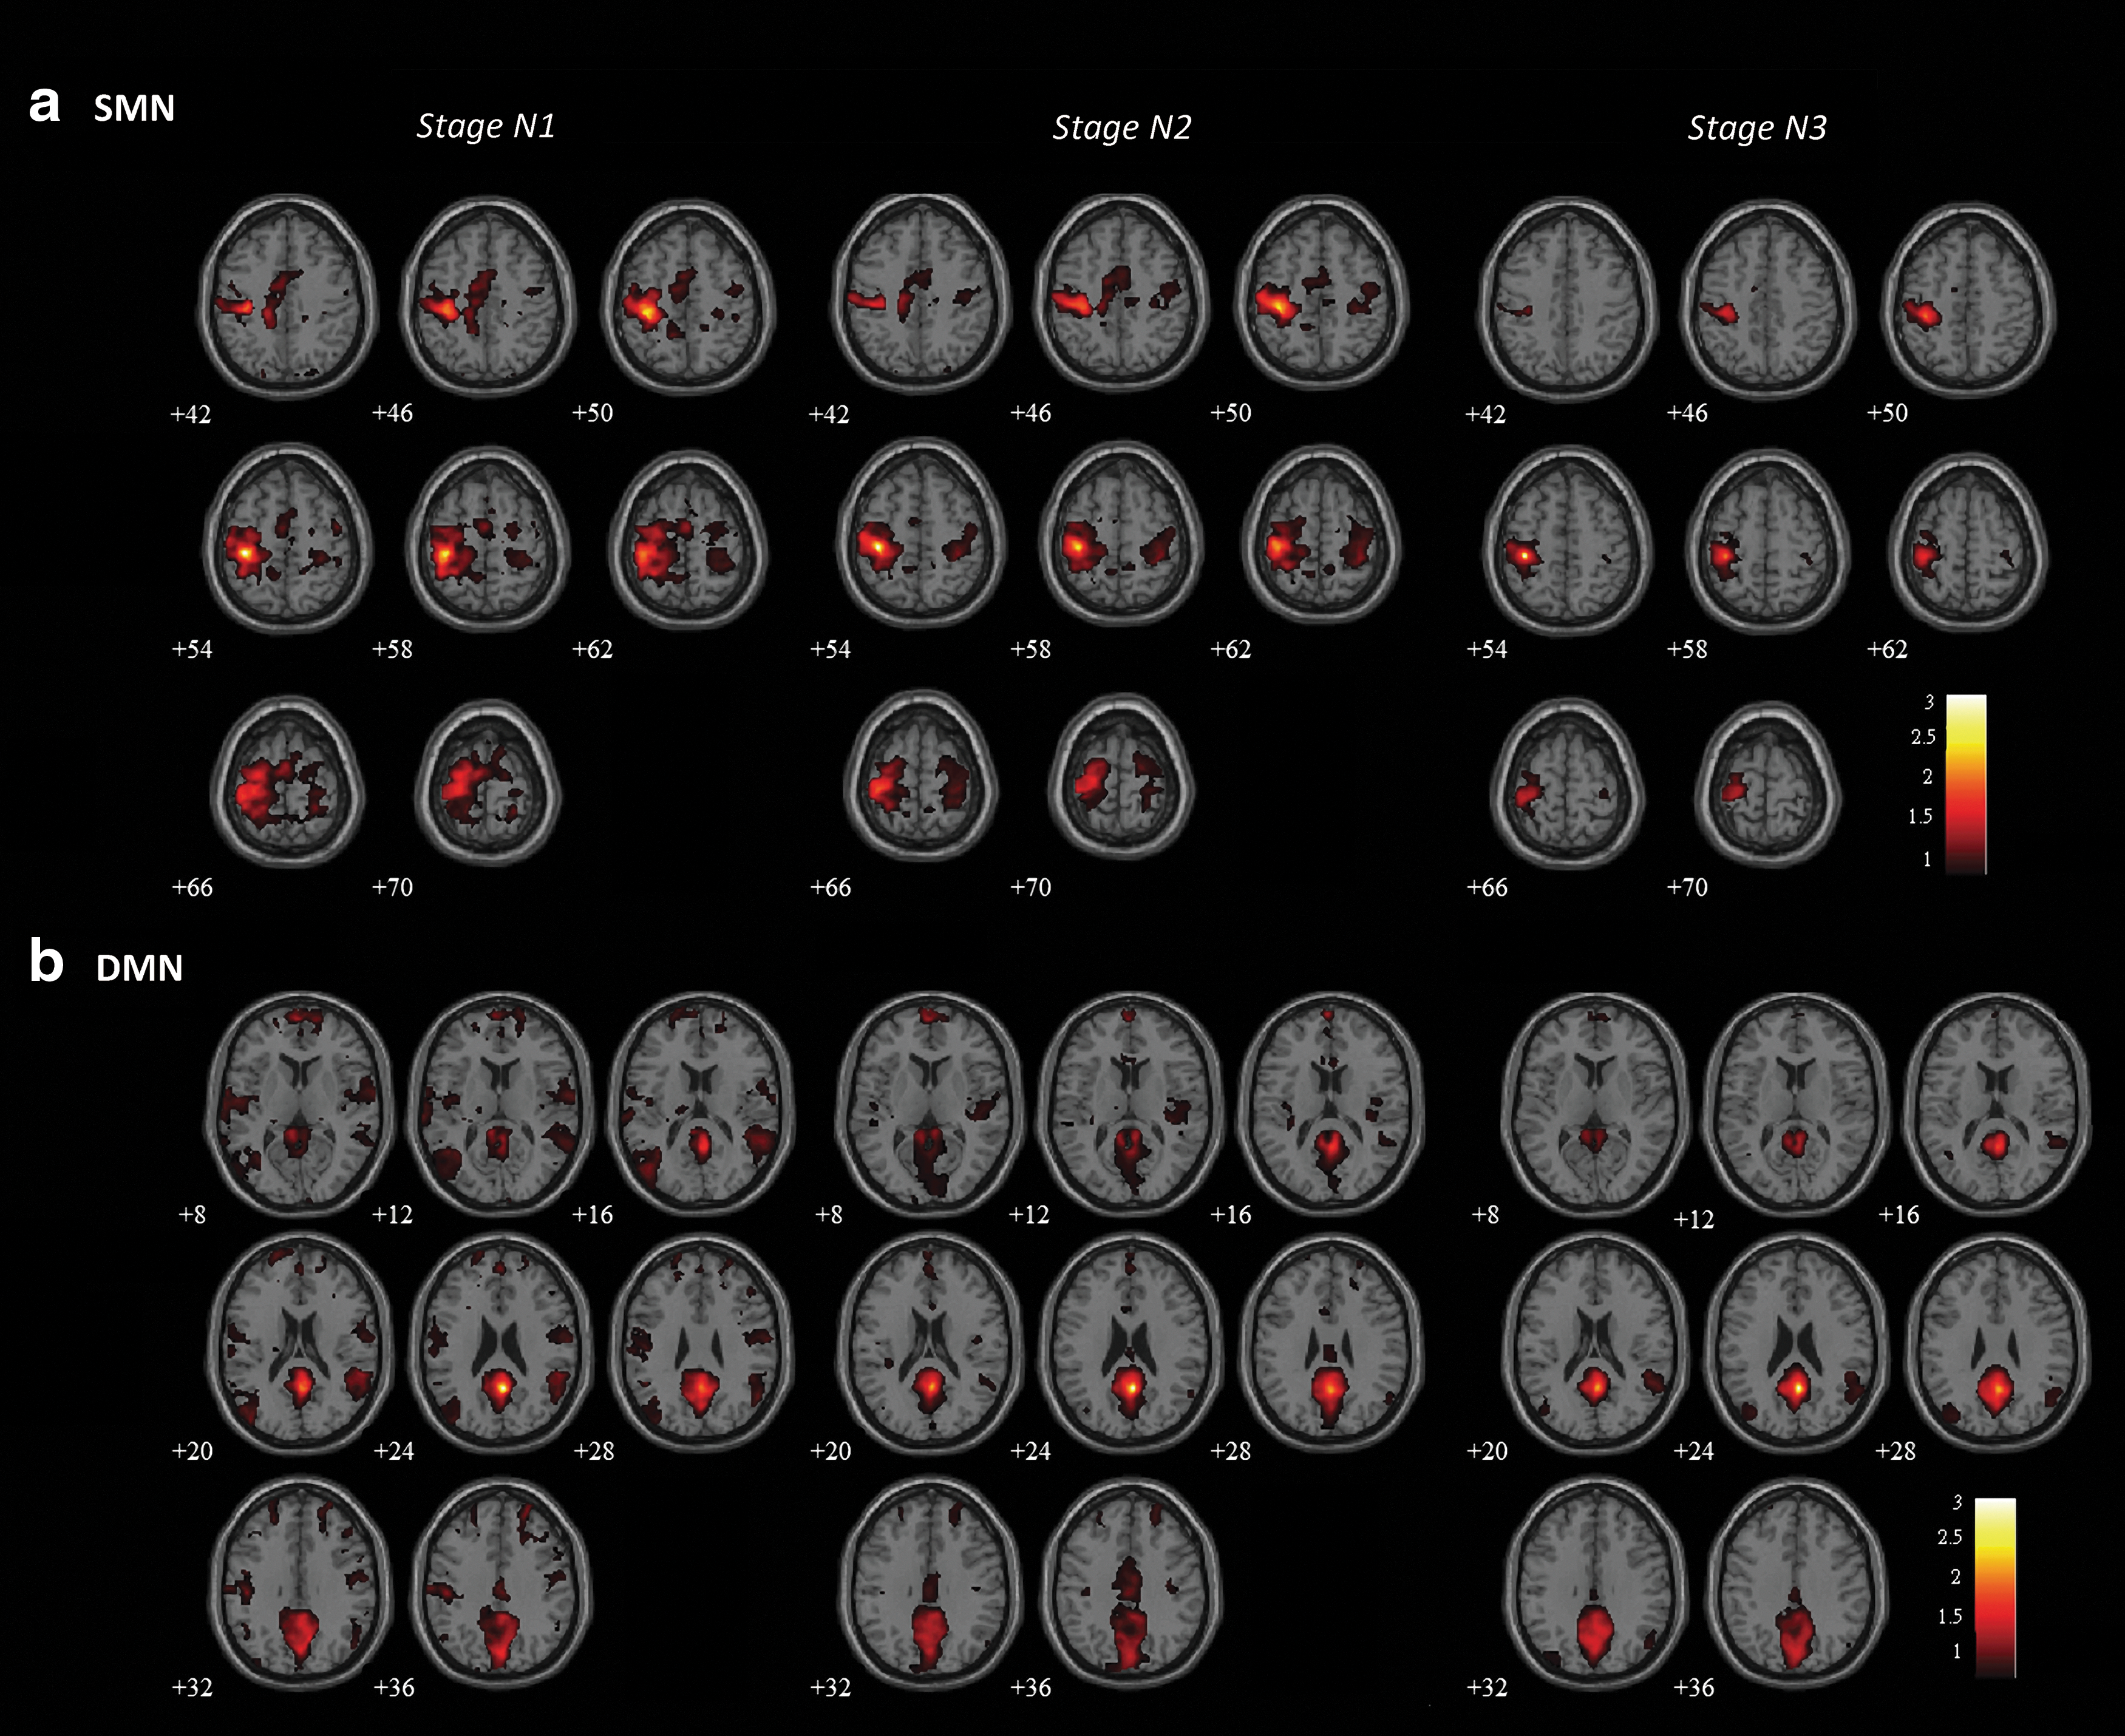
Group-level connectivity maps for

Comparisons of connectivity strength in
In addition, the connectivity patterns in REM sleep were evaluated for the Sleeping session of two participants, using the same procedure as the individual segmented timeframe analysis (z>0.75 for SMN and z>0.6 for DMN). The results showed that bilateral connectivity was re-established in both networks during REM sleep. The spatial extents in both SMN and DMN showed substantial enhancement over the connectivity patterns of Presleep (Fig. 4). However, only two participants achieved REM sleep during our study; thus, the data were too limited for group analysis.
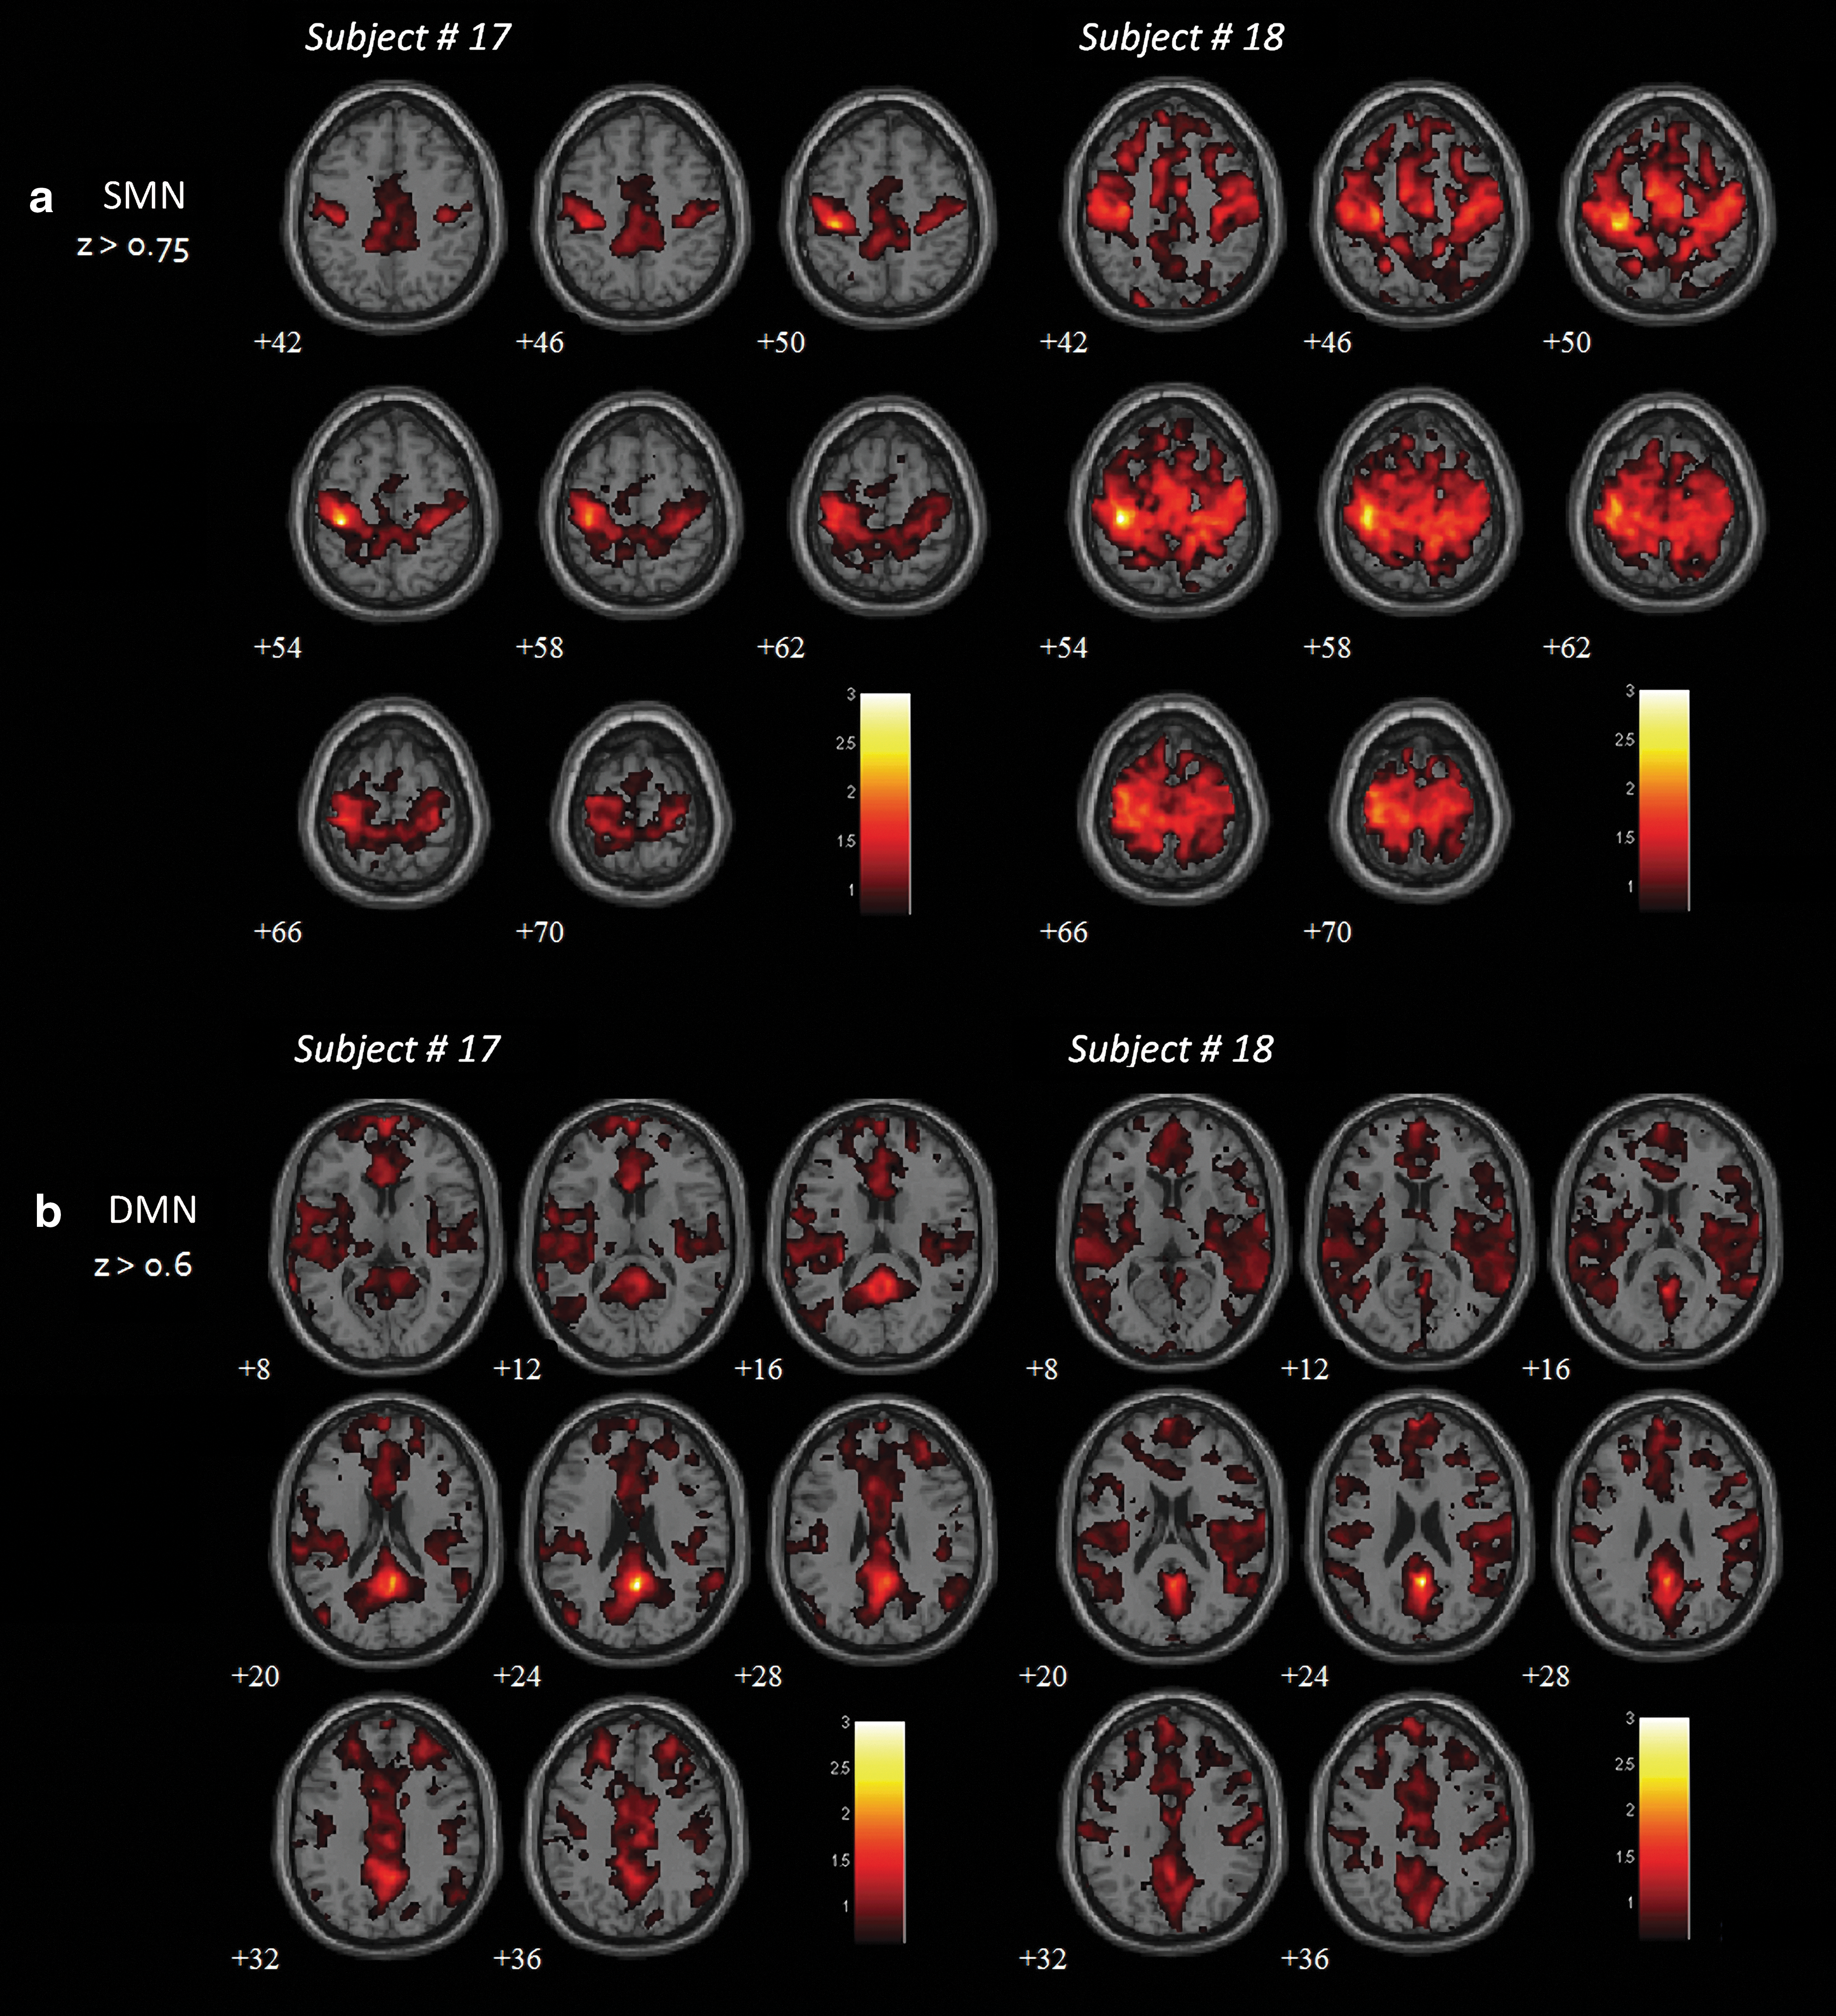
Functional connectivity maps for
Perturbations of connectivity on awakening
To assess postsleep effects on functional connectivity, we performed group analyses (n=17) to compare the changes in connectivity between Presleep and Awakening sessions. The average connectivity maps of SMN (Fig. 5) demonstrated significant disruptions in connectivity after awakening (t>7.5, FWE-corrected p<0.05). During Presleep, spatial connectivity formed a typical SMN pattern from the seed location (left M1, cluster size=1428 mm3) to the midline SMA (cluster=369 mm3) to the contralateral M1 (cluster=1064 mm3). However, only the ipsilateral connections remained in the Awakening session under the same threshold (cluster=369 mm3). The connectivity during Presleep was significantly stronger than in Awakening, for SMN (two-tailed p<0.05). In contrast to this reduction shown in the SMN, sustained connectivity or even hyperconnectivity was observed in the DMN postsleep. Figure 6 shows the group-level comparisons for DMN connectivity (t>5, FWE-corrected p<0.05). Before sleep, connectivity appeared among the PCC (cluster=2962 mm3), MPFC (cluster=410 mm3), and bilateral temporal gyrus (cluster=735 mm3); these connected regions subsequently increased in spatial extent during Awakening (PCC: cluster=3727 mm3; MPFC: cluster=2659 mm3; temporal gyrus: cluster=1058 mm3). However, we found no significant enhancement in connectivity strength (two-tailed p>0.16). Second-level analysis was conducted to confirm the discrepancies in connectivity between Presleep and Awakening (Fig. 7; |t|>5, FWE-corrected p<0.05). The largest significant differences occurred in the contralateral M1 reduction in SMN, and increased PCC (local) connectivity in the DMN. Table 3 shows these results and additional details.
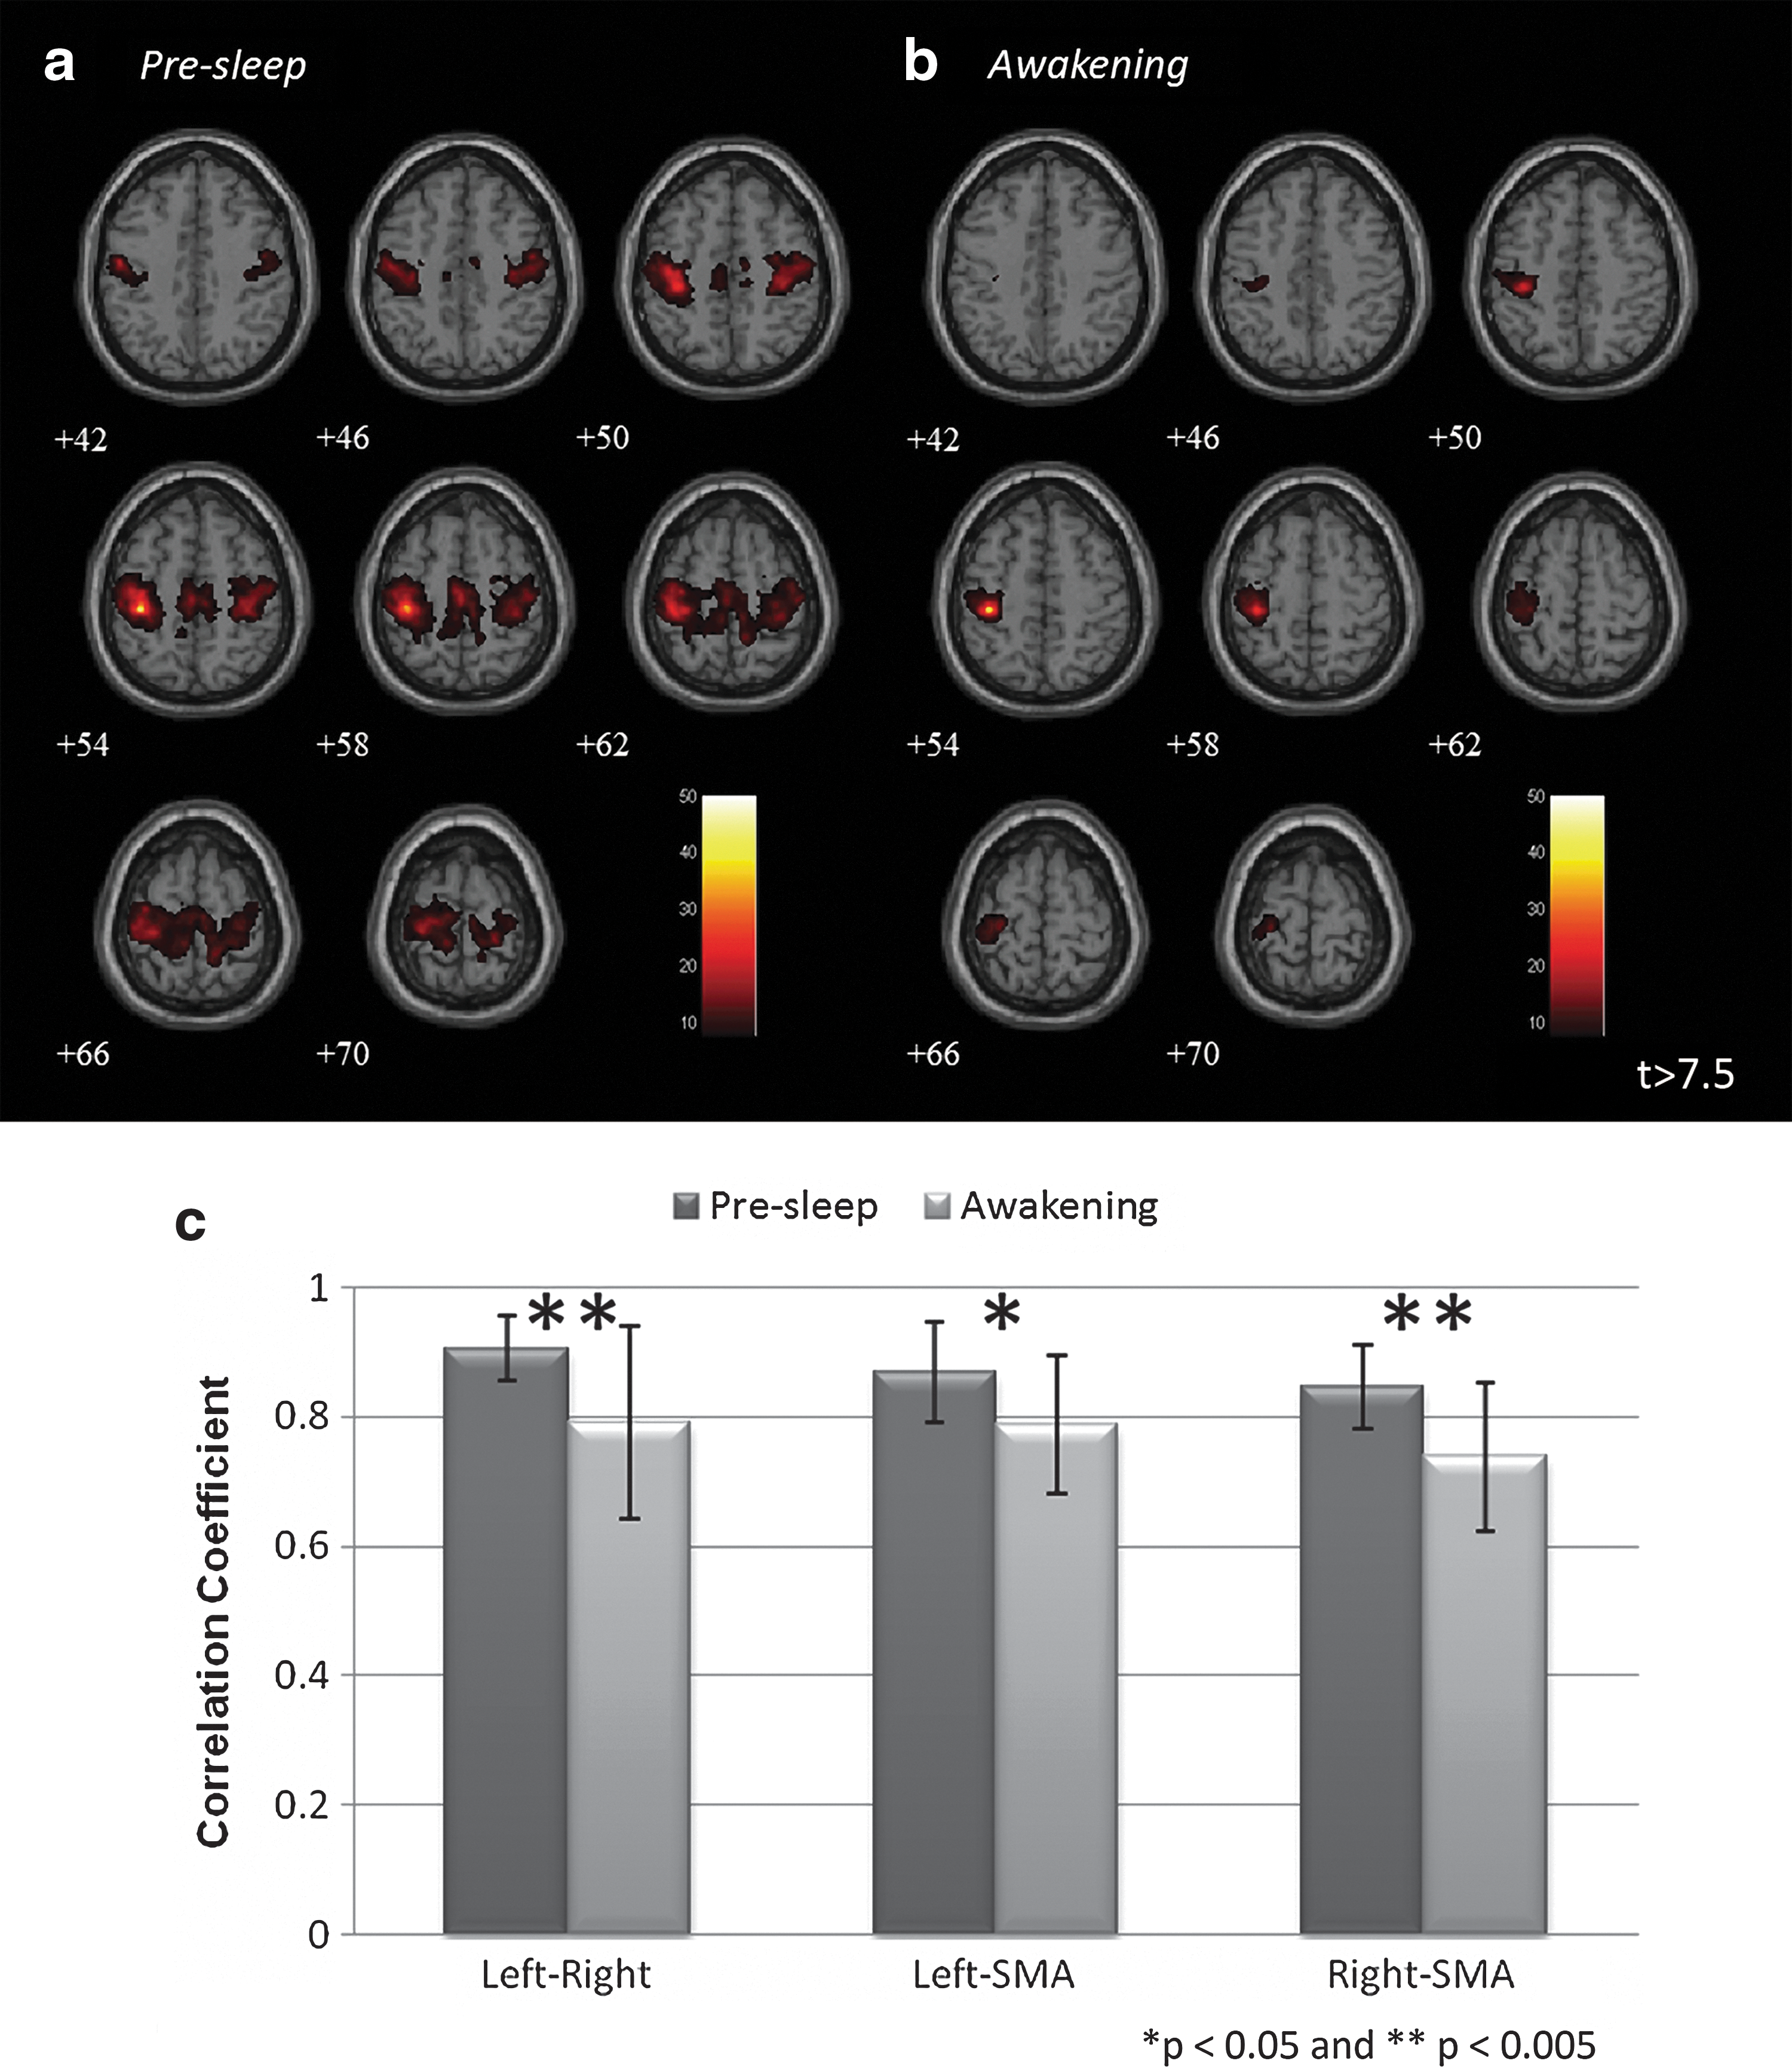
Group-level SMN connectivity maps of
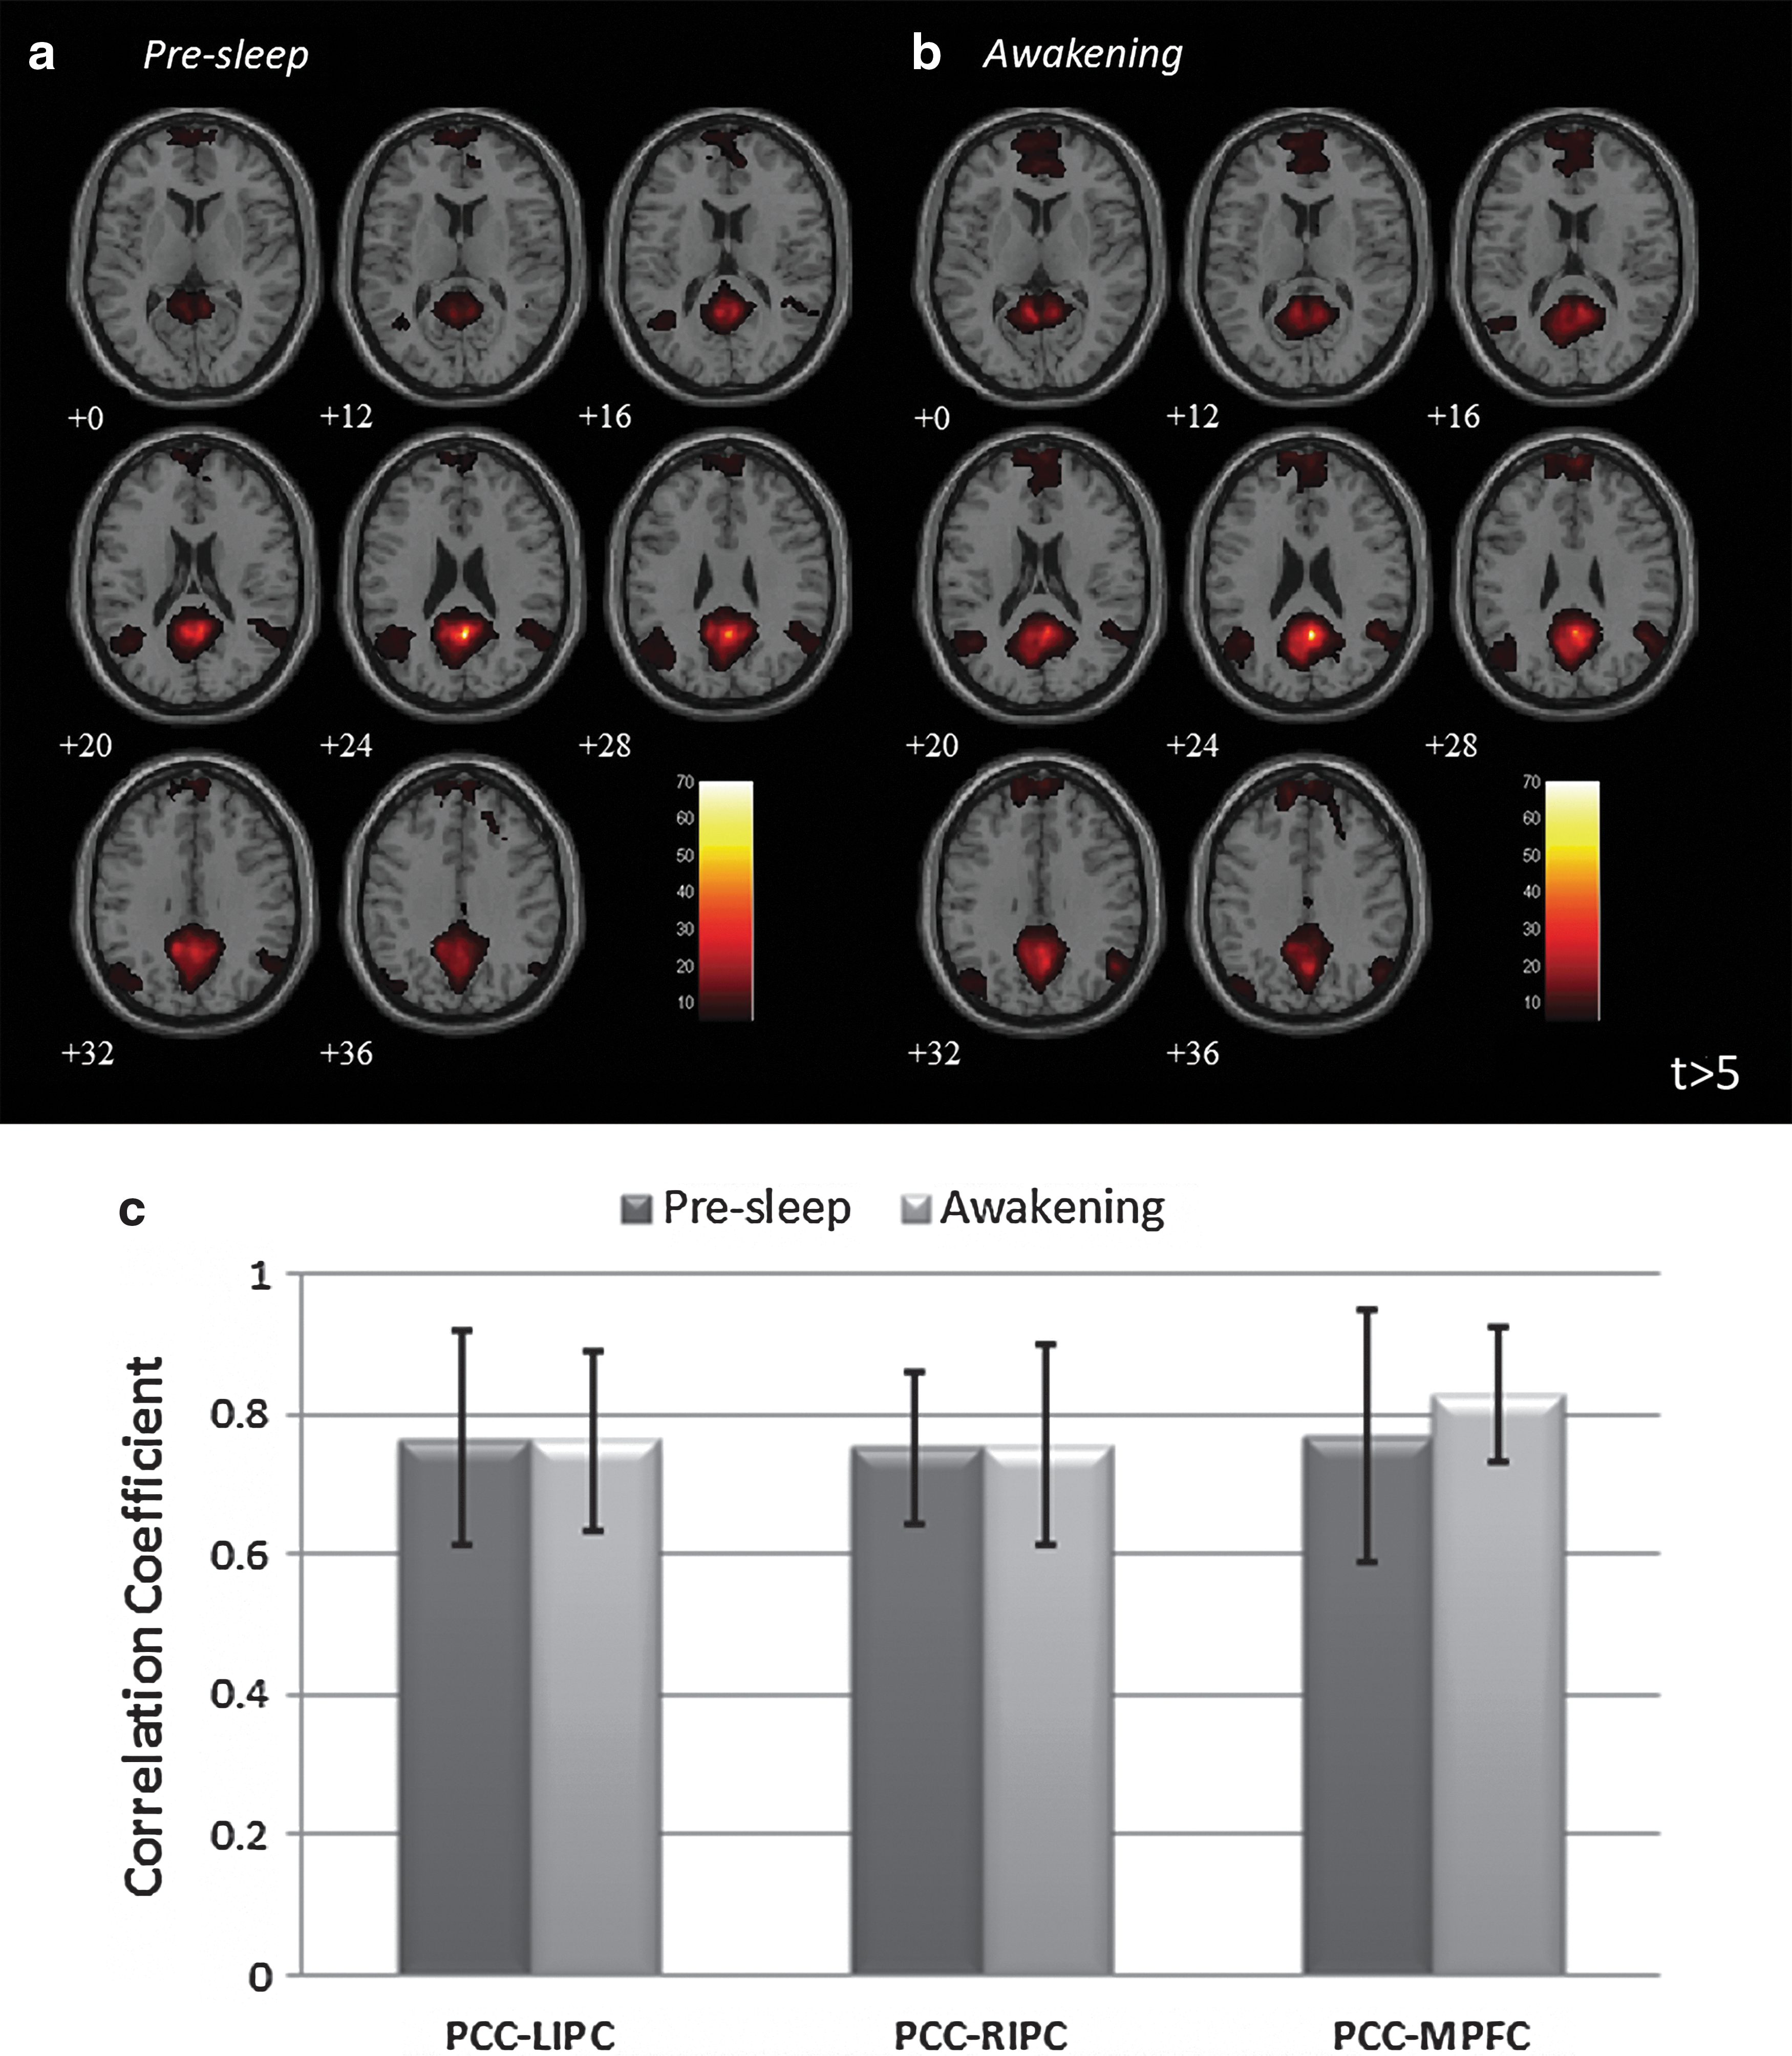
Group-level DMN connectivity maps of
Disparities in group connectivity maps between Presleep and Awakening sessions in
MNI, Montreal Neurological Institute; R, represents right side; L, represents left side.
Discussion
We measured the resting-state fMRI with simultaneous EEG recordings to analyze coherent connectivity variations associated with sleep depth, for both NREM and REM stages, among various brain regions of the SMN and DMN. Previous fMRI studies have indicated changes in brain connectivity during NREM sleep or slow-wave sleep (Horovitz et al., 2008, 2009; Larson-Prior et al., 2009; Spoormaker et al., 2010). Our study identified the full spectrum of sleep stages more clearly than previous studies, in the perspective of network connectivity. A recent separate study reported DMN connectivity change in deep sleep, but focused mainly on DMN and its anticorrelation networks (Sämann et al., 2011). However, because sleep modulates multiple cognitive functions, functional connectivity is thought to be globally affected by sleep (Boly et al., 2012). Nonetheless, the influence of sleep might be network-specific (Larson-Prior et al., 2009), as shown by our findings.
The connectivity changes occurring in REM sleep were addressed in this study, and the results showed hyperconnectivity for REM compared with other sleep stages. Although only two of our participants entered REM sleep, their data showed enhanced connectivity with a broader spatial extent compared with the Presleep session. In addition to the Sleeping session, our results showed variations in connectivity immediately after awakening. A prolonged recovery period was evident for sensorimotor function after sleep, termed “sleep inertia”; this phenomenon represents the complex process of returning to a normal resting condition (Balkin et al., 2002; Tassi and Muzet, 2000). Previous studies have investigated sleep inertia using EEG and PET (Balkin et al., 2002; Marzano et al., 2011). Balkin et al. (2002) concluded that between-region connectivity underlies the re-establishment of consciousness after sleep. The researchers initially observed regional CBF changes, but because of the limited spatiotemporal resolution of PET scans, they evaluated the connections only in specific brain regions rather than adopting a network perspective (Balkin et al., 2002). Thus, the current study constitutes pioneering work using fMRI to evaluate the connectivity changes beyond the DMN and to characterize the sleep-wake transition from the perspective of whole-brain functional connectivity. We believe that connectivity analysis might provide the basis for a clinical index for patients with obstructive sleep apnea or narcolepsy (Chugh et al., 1996; Mullington and Broughton, 1994).
Connectivity alterations while sleeping
Previous reports have indicated that evoked brain activity was partly predicted by spontaneous baseline fluctuations or resting-state connectivity when the participant was awake (Boly et al., 2007; Eichele et al., 2008; Kannurpatti and Biswal, 2008). However, studies investigating brain activity under differing physical conditions or different sleep stages have been scant. Our observations for NREM sleep showed that disruptions in functional connectivity occurred in the stages of deep sleep among brain regions of the SMN and DMN. These findings support the notion that disconnections of corticocortical connectivity relate to the fading of consciousness induced by natural sleep or anesthesia (Boveroux et al., 2010; Massimini et al., 2005). Using transcranial magnetic stimulation to activate the associated sensory gyrus of a sleeping person, Massimini et al. (2005) recorded propagations of EEG signals throughout the brain. They reported that the evoked electric signal was confined within the local regime during NREM sleep, unlike the global propagations observed during wakefulness (Massimini et al., 2005). Peltier et al. (2005a) found that functional connectivity between the bilateral primary motor cortices was inversely correlated with sevoflurane anesthesia dosage. Similarly, Boveroux et al. (2010) found a negative correlation between propofol-induced unconsciousness and connectivity in the default-mode and executive control networks. These disconnection phenomena have been observed not only in sleeping adults, but also in infants (Liu et al., 2008).
Compared with the brain connectivity evident during wakefulness, the dissociation observed in NREM sleep can be used as an index of loss of consciousness. Such a measure may be valuable for the clinical diagnosis of patients who are comatose or in a vegetative state (Boly et al., 2008b; Owen and Coleman, 2008). However, the disruption of normal connectivity patterns in the brain does not necessarily indicate a decrease in brain activity. Destexhe et al. (2007) demonstrated that the neuronal up state is associated with spindle oscillations during NREM sleep, suggesting that neural dynamics in this stage resemble fragments of wakefulness that retain functional interaction. These findings imply that during NREM sleep, not only is functional integrity reduced, but the organization of internal functions might be enhanced within specific brain regions; NREM might also be associated with a restructuring of alternative brain connectivity that is specifically apparent during sleep. By contrast, the REM period showed hyperconnectivity of the SMN and DMN networks. These findings confirmed the results of previous neuroimaging studies, which showed that brain metabolism in REM resembles that in wakefulness (Maquet et al., 1990). However, the underlying mechanism remains enigmatic, and further studies are warranted to provide greater insight into the reasons humans require sleep.
Lingering functional connectivity on awakening
In addition to our observations of brain connectivity during sleep, we examined functional connectivity before and after sleep. Compared with the Presleep condition, contralateral SMN connectivity remained at a relatively low level immediately on Awakening, and was similar to the connectivity evident in N3. By contrast, in the DMN, frontoparietal connections were enhanced. These findings suggested the following two possibilities: (1) self-awareness preceded a delayed recovery of the sensory system, and (2) recovery of frontoparietal connectivity occurred more rapidly after awakening than that between the parietal cortices.
Based on their observations of multiple task performances, Ferrara et al. (2000) reported that cognitive performance reached the baseline level ∼30 min after awakening, whereas motor performance remained below the baseline level. Ferrara et al. (2006) and Marzano et al. (2011) reported that the spectral EEG signature for various scalp locations showed that sleep inertia was relatively strong (i.e., increased delta–theta power) in the posterior lobe, with decreased beta power in the frontal lobe. In comparison, our findings also indicated that frontal connectivity (DMN) recovered ahead of posterior connections (SMN). The dissociation of SMN connectivity implied that a person might exhibit reduced sensorimotor performance for a short period immediately after awakening. The possible cause of SMN disruption could be due to either hypnosis or fatigue. Similar to the report by Peltier et al. (2005b), a decrease in SMN connectivity was present during rest periods after a fatiguing task. Overall, these results indicate the common occurrence of sleep paralysis, or the reduced motor activity after awakening, which is especially prevalent in patients with narcolepsy (Cheyne, 2002). The underlying mechanism might be the continued activation of the Pontine center to impose a paralysis signal for a short period after sleep ceases. However, the limited sleep cycles in our study might have artificially amplified this evidence of the paralysis effect.
In contrast to the reduction of SMN connectivity on awakening, the connectivity seeded from PCC seems to be unaffected or slightly increased (but with insignificant difference). The PCC, as a component of the DMN, is associated with working memory, executive control, and self-monitoring processes (Badre and Wagner, 2004; Boly et al., 2008a; Schlösser et al., 2006). Therefore, increased local connectivity might represent the instantaneous recovery of these high-level cognitive functions on awakening. However, a recent study that investigated brain connectivity showed that hypnosis induced a slight reduction in motor connectivity, but a significant enhancement in PCC/precuneus connectivity (Pyka et al., 2011). The authors hypothesized that hypnotic paralysis might be the result of the DMN assuming control of the motor system. The state of hypnotic paralysis resembles sleep inertia in that the person is inattentive to extraneous stimuli and shows reduced spontaneous thinking; thus, the effect of DMN takeover might provide an alternative explanation for the lowered arousal and decreased behavioral performance that people widely report after awakening from sleep.
Simultaneous EEG/fMRI recordings for sleep study
Previous neuroimaging studies of sleep stages have primarily used PET (with H2 15O or 18FDG). The results have consistently shown decreased brain activity during NREM sleep and sustained brain function during REM sleep (Hofle et al., 1997; Kajimura et al., 1999; Maquet et al., 1990). However, the spatiotemporal resolution of PET is currently limited. The simultaneous use of EEG and fMRI technology provides more reliable findings with optimal temporal and spatial resolution (Dang-Vu et al., 2008; Horovitz et al., 2009; Miyauchi et al., 2009). The combined use of EEG and fMRI must be applied with extreme caution due to the unmatched physiological sources and the general assumption of linearity between electrophysiology and hemodynamic responses. These concerns arise from the intrinsic disparity between the sources of the two respective signals. The neuronal-based EEG signal has a high temporal resolution with limited and superficial geometry, whereas the fMRI signal represents a sluggish hemodynamic response and provides good spatial information.
Mantini et al. (2007) demonstrated a significant correlation between the fMRI signal and EEG spectra. However, a direct mapping strategy of convolving the EEG signal (such as the spindle complex or theta waves) with a predefined hemodynamic kernel may induce two uncertainties: nonspecific selection of hemodynamic response functions and unknown coupling between hemodynamics and neural activity. By contrast, functional connectivity analysis using resting-state fMRI fluctuations provides an alternative for studying sleep-related issues without involving problems of mismatched physiological mechanisms. Resting-state fMRI indicates a hemodynamic temporal correlation between different brain regions individually, which has been applied to investigate multiple physical states, such as wakefulness, anesthesia, vegetative states, and NREM sleep (Boveroux et al., 2010; Horovitz et al., 2009;Owen and Coleman, 2008). In this study, we successfully adopted functional connectivity analysis to reveal the brain oscillatory activity during sleep, with a high spatial resolution. We speculated that functional networks are reorganized during sleep. Our results revealed that dissociation and reinforcement of functional connectivity during the NREM and REM stages, respectively, correspond with the changes in cerebral metabolism known to occur during sleep (Maquet et al., 1990).
Limitations
A person's quality of sleep in the EEG/fMRI-fusion environment cannot be guaranteed or assessed before the experiment, which posed a limitation to this study. Despite a high percentage of participants reporting that they were able to stay asleep inside the scanner, the effect of wearing an EEG cap (with a head fixation and accompanying acoustic noise) was likely to have reduced the quality of sleep. Several participants reported difficulties in sleeping in this environment, compared with their good quality of sleep at home. However, we believe that the influence of the experimental environment did not affect the results substantially, because consistent observations of sleep patterns were confirmed from the EEG-scoring by a licensed sleep technician. In addition, the subjective experience of sleep does not necessarily correlate to objective sleep measurements, as indicated by studies on insomnia patients (Bastien, 2011; Orff et al., 2007). However, in future EEG/fMRI studies, sleep conditions could be improved by providing a more comfortable environment compared with our study. Such improvements might entail a superior bed design or the use of silent MRI sequences to increase the percentage of participants who achieve a good quality of sleep, and to mimic home-based sleeping conditions.
Further refinement of our experimental design to incorporate cognitive measures would allow for investigation of the association between the conscious/cognitive state and the connectivity reorganization that occurs in sleep. Recent neuroimaging studies have focused on the corticothalamic loop and brainstem to localize brain regions that elicit the spindle complex or ponto-geniculo-occipital waves in sleep (Miyauchi et al., 2009). However, we investigated only the corticocortical connections, which yield a higher SNR compared with limbic regions. Further studies on connectivity in the limbic system are warranted to better understand the brain's behavior during sleep. However, deep brain regions close to the brainstem (such as the orbitofrontal cortex or parts of the basal ganglia) might suffer substantial MR artifacts, including signal loss or distortion, which might obscure the genuine brain response. Z-shim or zoomed-image techniques can be applied to overcome these difficulties in sleep-related studies (Glover, 1999).
This study used the seed correlation method as the basis of functional connectivity analysis. This is a statistical method that assumes temporal stationarity. However, the brain rarely maintains a stationary state during sleep, especially among the various sleep stages. Therefore, we concatenated the fMRI signal from chosen stages into a single time series and used these data for seed correlation analysis. This semistationary approach might have obscured transient changes in brain connectivity during sleep. An additional nonstationary method, such as wavelet analysis, would be necessary to determine specific changes in brain activity during sleep.
Finally, we used only the EEG signal for our polysomnographic purposes in this study. The use of an efficient fusion strategy to combine the neuroimaging modalities of EEG and fMRI might lead to an improved understanding of brain functions during sleep. We recommend that future studies should employ the fusion strategy in a combined measurement approach.
Conclusion
This study showed that dissipated connectivity occurred within the sensorimotor and DMN in NREM sleep, but that both networks were concomitantly hyperconnective in REM sleep. The reduction in SMN connectivity might imply the brain's isolation from external stimuli during sleep, whereas reduced connectivity in the DMN might be related to fading consciousness. The DMN maintained high connectivity when sleep ceased, whereas the SMN showed a significant decrease in interregional connectivity, which might be linked to a transient reduced sensorimotor function upon awakening. These findings suggest that variability in brain connectivity during sleep is a crucial component of spontaneous cognitive processes, such as consciousness or revitalization.
Footnotes
Acknowledgments
This study was supported in part by grants from the following organizations: the National Science Council of Taiwan (NSC100-2218-E-008-018-MY2, NSC98-2923-B-010-001-MY3, NSC100-2628-E-010-002-MY3, and NSC100-2517-S-004-001-MY3); the National Health Research Institute (NHRI-EX100-9813EC); and Academia Sinica (AS-100-TP-AC1). The authors would also like to thank the MRI Core Laboratory of National Yang-Ming University, Taiwan, for support provided with the MRI aspect of this study.
Author Disclosure Statement
No competing financial interests exist.