
Abstract
Recent studies have shown that blood oxygen level-dependent low-frequency (<0.1 Hz) fluctuations (LFFs) during a resting-state exhibit a high degree of correlation with other regions that share cognitive function. Initial studies of resting-state network mapping have focused primarily on major networks such as the default mode network, primary motor, somatosensory, visual, and auditory networks. However, more specific or subnetworks, including those associated with specific motor functions, have yet to be properly addressed. We performed independent component analysis (ICA) in a specific target region of the brain, a process we name, “localized ICA.” We demonstrated that when ICA is applied to localized fMRI data, it can be used to distinguish resting-state LFFs associated with specific motor functions (e.g., finger tapping, foot movement, or bilateral lip pulsing) in the primary motor cortex. These ICA components generated from localized data can then be used as functional regions of interest to map whole-brain connectivity. In addition, this method can be used to visualize inter-regional connectivity by expanding the localized region and identifying components that show connectivity between the two regions.
Introduction
T
Initial studies in resting-state network mapping have focused primarily on major networks such as the default mode network, primary motor, somatosensory, language, visual, auditory, episodic memory, and dorsal and ventral attention networks (Beckmann et al., 2005; Chen et al., 2008; Damoiseaux et al., 2006; Smith et al., 2009; van de Ven et al., 2004). These networks can be mapped using independent component analysis (ICA) or region of interest (ROI) analysis. ICA uses sophisticated algorithms to analyze datasets and determine maximally statistically independent components (Beckmann and Smith, 2004; McKeown et al., 1998). In fMRI, spatial maps, which exhibit synchronous temporal BOLD fluctuations, are automatically determined. The benefit of this method is that it is purely data driven, that is, it does not require an a priori hypothesis. This means that without the traditional temporal models used in classical fMRI analysis, ICA is able to identify different types of signal fluctuations based on their spatial and/or temporal characteristics. However, ICA analysis is not an ideal method for mapping the smaller subnetworks of the brain. Visualization of these networks using ICA requires the use of a high number of components that often give irrelevant components (Abou-Elseoud et al., 2010; Abou Elseoud et al., 2011; Kiviniemi et al., 2009). Additionally, because interpretation of these can be very time consuming, ICA is a poor method for this type of analysis.
When mapping of these more specific subnetworks, ROI analysis is commonly used. However, this technique also has significant drawbacks, in that it requires an a priori hypothesis for the seed region, which draws on anatomical or functional data from a previous experiment. Additionally, a variety of other issues are relevant, given that there is no established standard for selecting these ROIs, since exact seed size and location chosen can result in different functional connectivity maps (Cordes et al., 2000, 2001). Finally, there is no guarantee that the extracted time series is a true independent variable or an accurate representation of the true signal of interest (Fox and Raichle, 2007).
In this study, we present a new method for resting-state analysis we term “localized ICA.” According to this method, the ICA procedures are modified so that instead of performing ICA on the whole brain, the data being analyzed are limited to those obtained from a target of the brain. The aim of which is to distinguish the subnetwork, which exists inside the larger major cognitive networks. For the purpose of this study, we isolated the primary motor cortex (M1) for localized ICA, because it displays a high degree of differentiation with respect to different motor functions (Andersen et al., 1975; Cheney and Fetz 1985; Cordes et al., 2000; Kwan et al., 1978; Nudo et al., 1992; Waters et al., 1990; Xiong et al., 1999).
Methods
Image acquisition
Twenty-three healthy right-handed subjects, aged 20–32 years, with no history of neurological disease or head trauma were scanned using a 3.0 T scanner (Model: Philips Intera Achieva, Phillips Healthcare). Five-minute resting-state scans involved the acquisition of 35 axial slices using a gradient echo planar imaging pulse sequence: TR=3000 ms; TE=35 ms; FOV (RL, AP, FH)=220 mm×140 mm×220 mm; voxel size (RL, AP)=2.875 mm×2.875 mm. During scanning, participants were instructed to remain still with their eyes open. Additionally, T1-weighted anatomical images were obtained for each subject (TR=9.902 ms).
Data preprocessing
Data preprocessing and processing were performed with the FMRIB Software Library (FSL:
Data processing
Figure 1 shows a generalized flowchart of the localized ICA process. Localized fMRI data were extracted from the primary motor cortex and the thalamus. The thalamus was included to determine whether connectivity between regions could be detected. Masks for these regions were created using the Harvard–Oxford Cortical Structural Atlas and MNI Structural Atlas in FSL. ICA was performed using FSL's multivariate exploratory linear optimized decomposition into independent components toolbox. Components for group-localized ICA were obtained via multisession temporal concatenation across subjects, and data were separated into 20 independent components and tested for reproducibility (Himberg et al., 2004). Components for all ICA analyses are rendered using thresholded Z-stat maps.
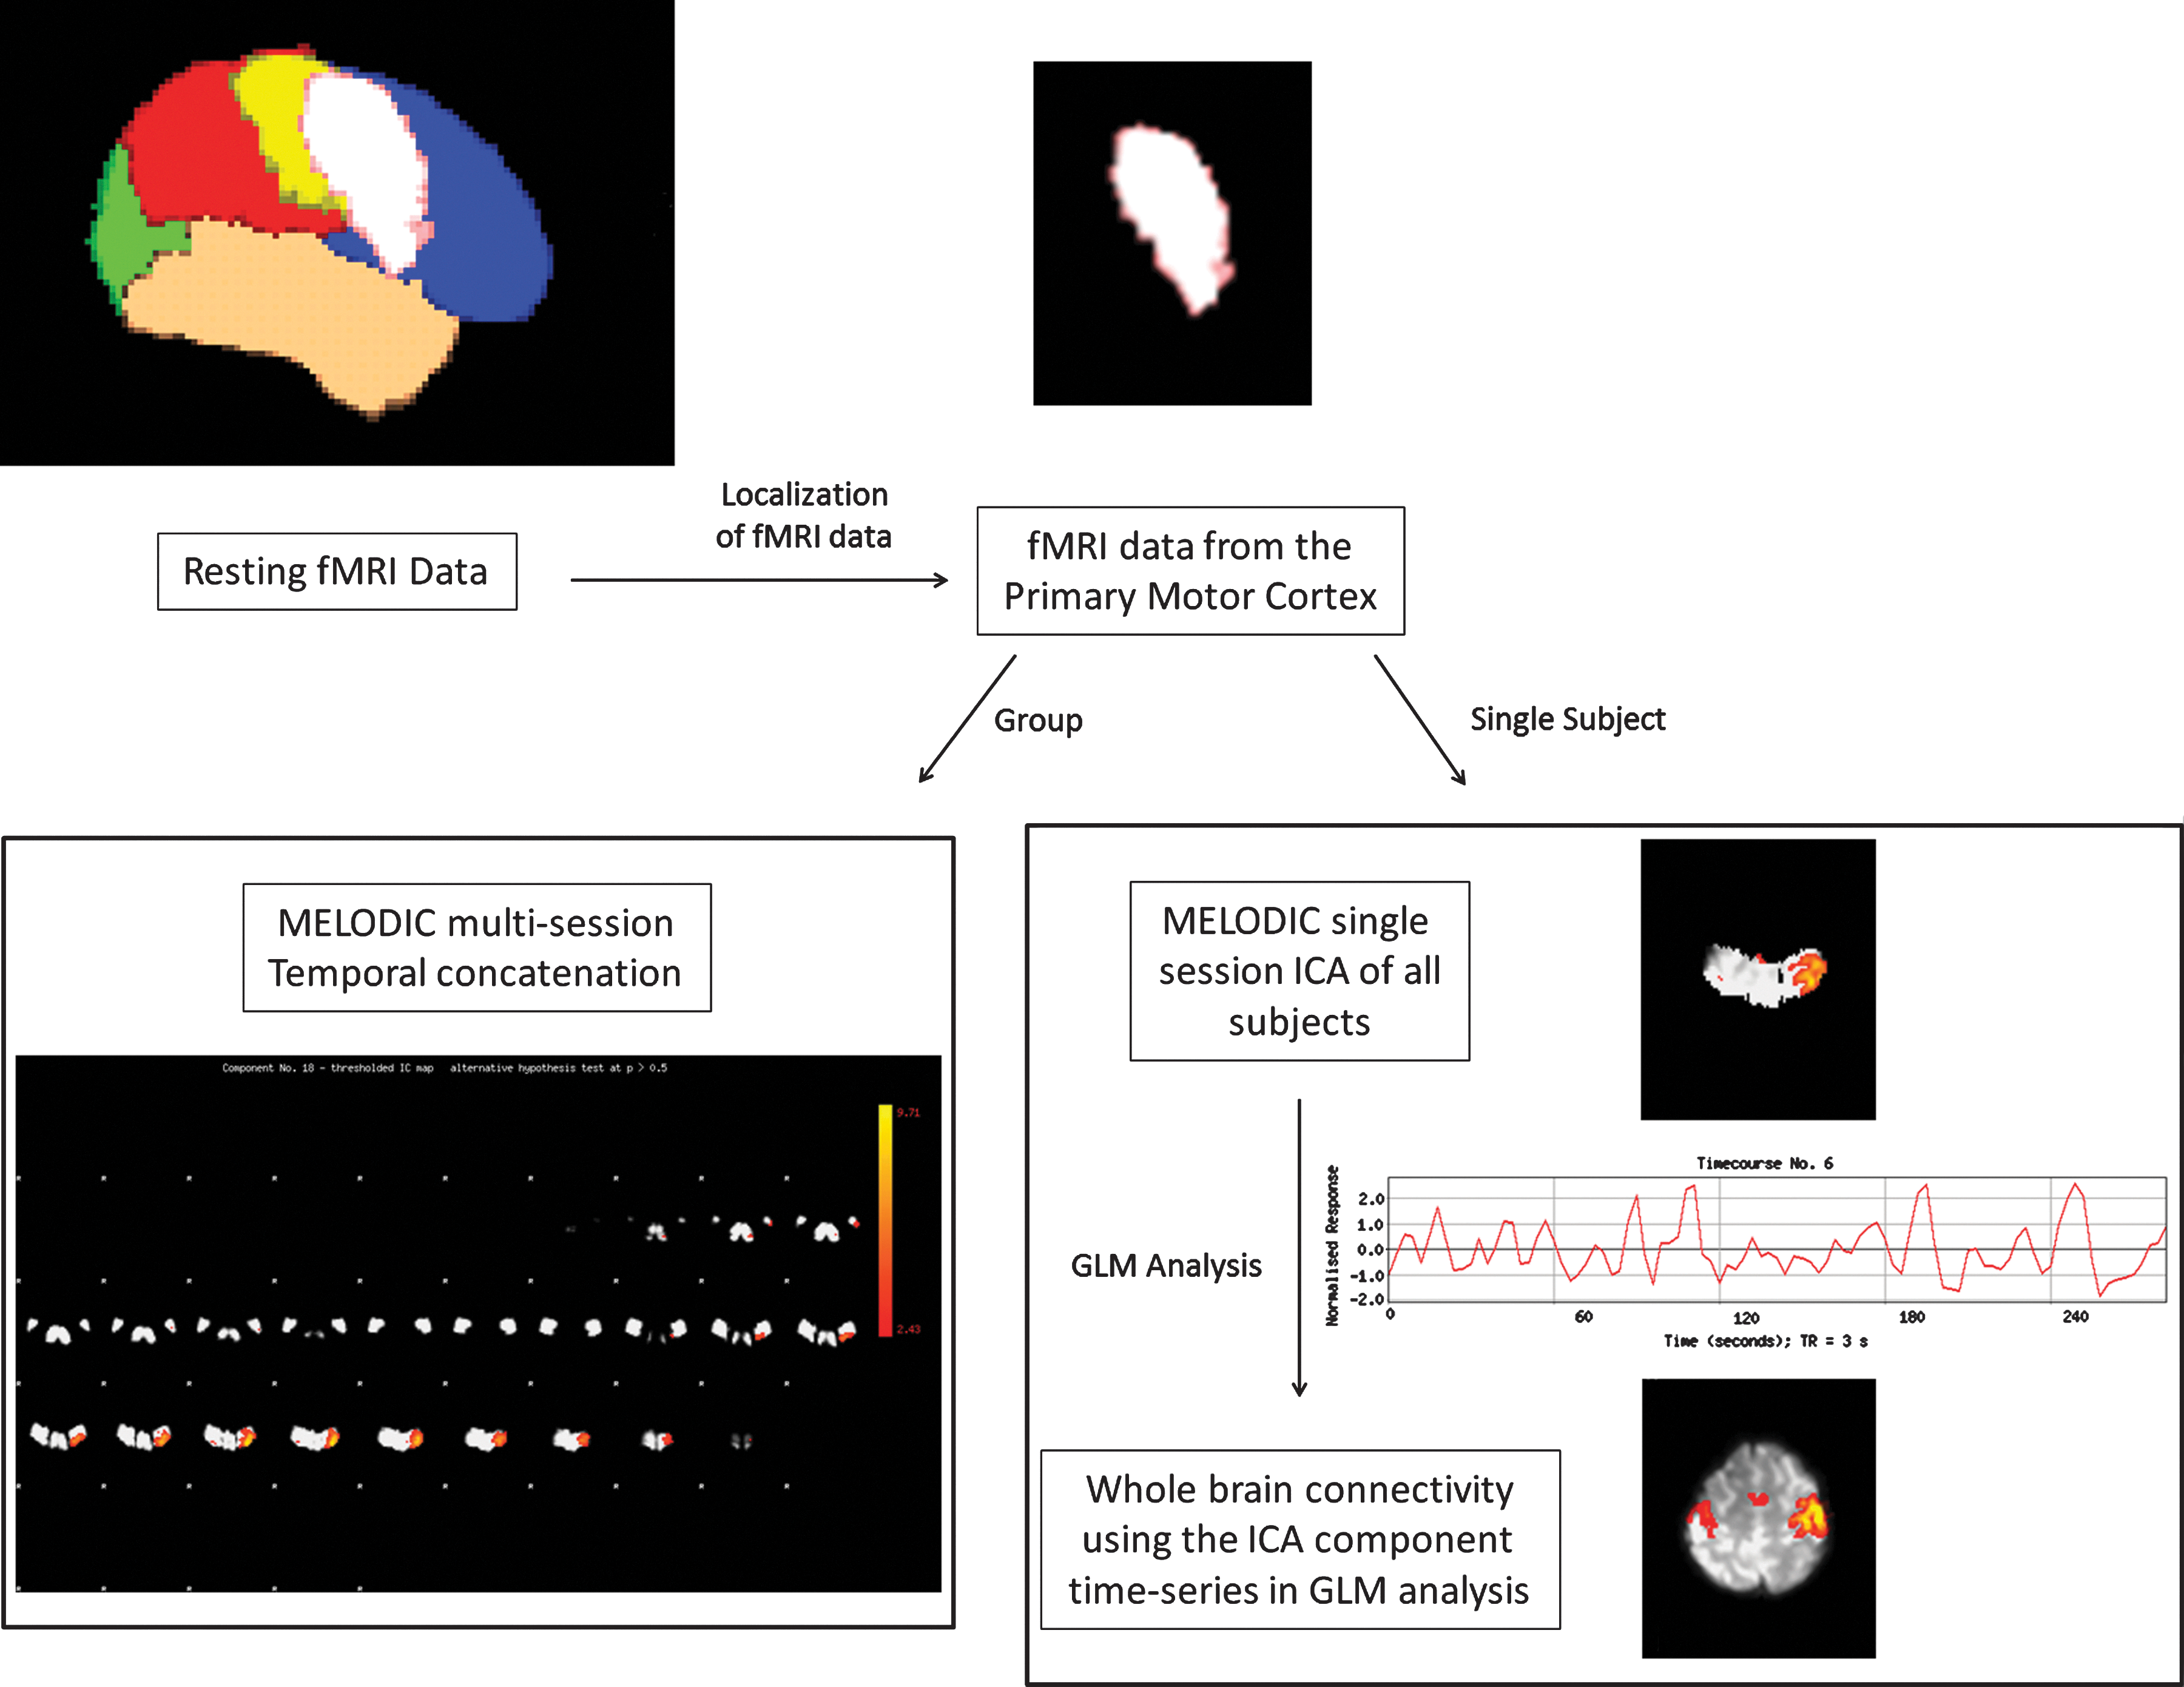
Flow chart of the localized independent component analysis (ICA) process. Data from a target-localized region of the brain is isolated. Multivariate exploratory linear optimized decomposition into independent components (MELODIC) multisession temporal concatenation is performed for group analysis. Single-subject data is processed using MELODIC single-session ICA. Correct representations of networks are confirmed using task ICA component as a model for resting-state general linear model (GLM) analysis.
Components were examined and compared against fMRI activation maps from previous literature to determine the associated function of each component. In particular, four commonly performed motor tasks were chosen to compare ICA components and activation maps (Lotze et al., 2000). These tasks were left and right finger tapping, ankle flexing, and lip pulsing. Talairach coordinates of the peak coordinates in each task were converted to MNI space using the tal2icbm_fsl transform algorithm (
To compare efficiency of localized ICA, regular ICA was performed using whole-brain data. High-order ICA is performed using 70 components and tested for reproducibility. Components that represent specific motor topographies are evaluated and compared with those from localized ICA components in the primary motor cortex.
Components that included the thalamus and motor cortex were also examined to determine the extent to which localized ICA could identify functional connectivity. The thalamus is of interest primarily because its functions include relaying motor signals to the cerebral cortex from the substantia nigra, globus pallidus, and cerebellum (Massion and Rispal-Padel, 1986; Percheron et al., 1996; Sommer, 2003). In addition to established structural connectivity, these two regions also showed functional resting-state connectivity (Fox and Raichle, 2007). To test whether localized ICA could identify components representing interregional connectivity, the analyzed data were expanded to include the thalamus. Components exhibiting connectivity between the thalamus and motor cortex were examined using a structural thalamic connectivity atlas (
To validate the localized ICA methodology for single-subject analysis, localized ICA and whole-brain ICA were performed for every subject using single-session ICA. Data were decomposed into 30 components based on localized data from the primary motor cortex and 70 components based on whole-brain data. Candidate components for the four motor tasks were noted. Time series from localized ICA components were then used as models for a general linear model (GLM) analysis and the functional connectivity of these components was mapped for the whole brain (min Z>2.3; cluster significance: p<0.05). GLM results were then visually compared with those of the whole-brain ICA analysis. To determine the effectiveness of each method, a success ratio was calculated according to number of subjects for which a method successfully showed a given motor subnetwork divided by the total number of subjects.
Results
Group-localized ICA results revealed possible components for (Fig. 2a–d) lip pulsing, left and right hand movement, and foot movement. These components were in the same region as the peak-activated coordinates in previous studies (Lotze et al., 2000). In addition to these components, localized ICA revealed components that may represent networks responsible for other unidentified motor functions (Fig. 2e–j). Group ICA of whole-brain data with 70 components revealed representative networks for lip and foot movement.

Group results of motor networks. Results are overlaid on a whole-brain background image. Shown are localized ICA components, which show high similarity to task-activated networks and components, which may represent a specific motor network.
When single-subject localized ICA components were used as models in GLM analysis of whole-brain data, actual representations of the specific motor functions were apparent in many, but not all subjects (Fig. 3). For the left hand, eight of 23 subjects showed accurate network representations with GLM whole-brain analysis. With the right hand, 12 out of 23 subjects showed accurate network representations. With the lips, 15 out of 23 subjects showed accurate network representations. Finally, the foot showed accurate representations in 11 out of 23 subjects. However, single-subject ICA analysis of whole-brain data using 70 components revealed less efficient results. For the left hand, five out of 23 subjects showed accurate network representations. For the right hand, eight out of 23 subjects showed accurate network representations. With the lips, 14 out of 23 subjects showed accurate network representations. Finally, for the foot, 10 out of 23 subjects showed accurate network representations (Fig. 4).
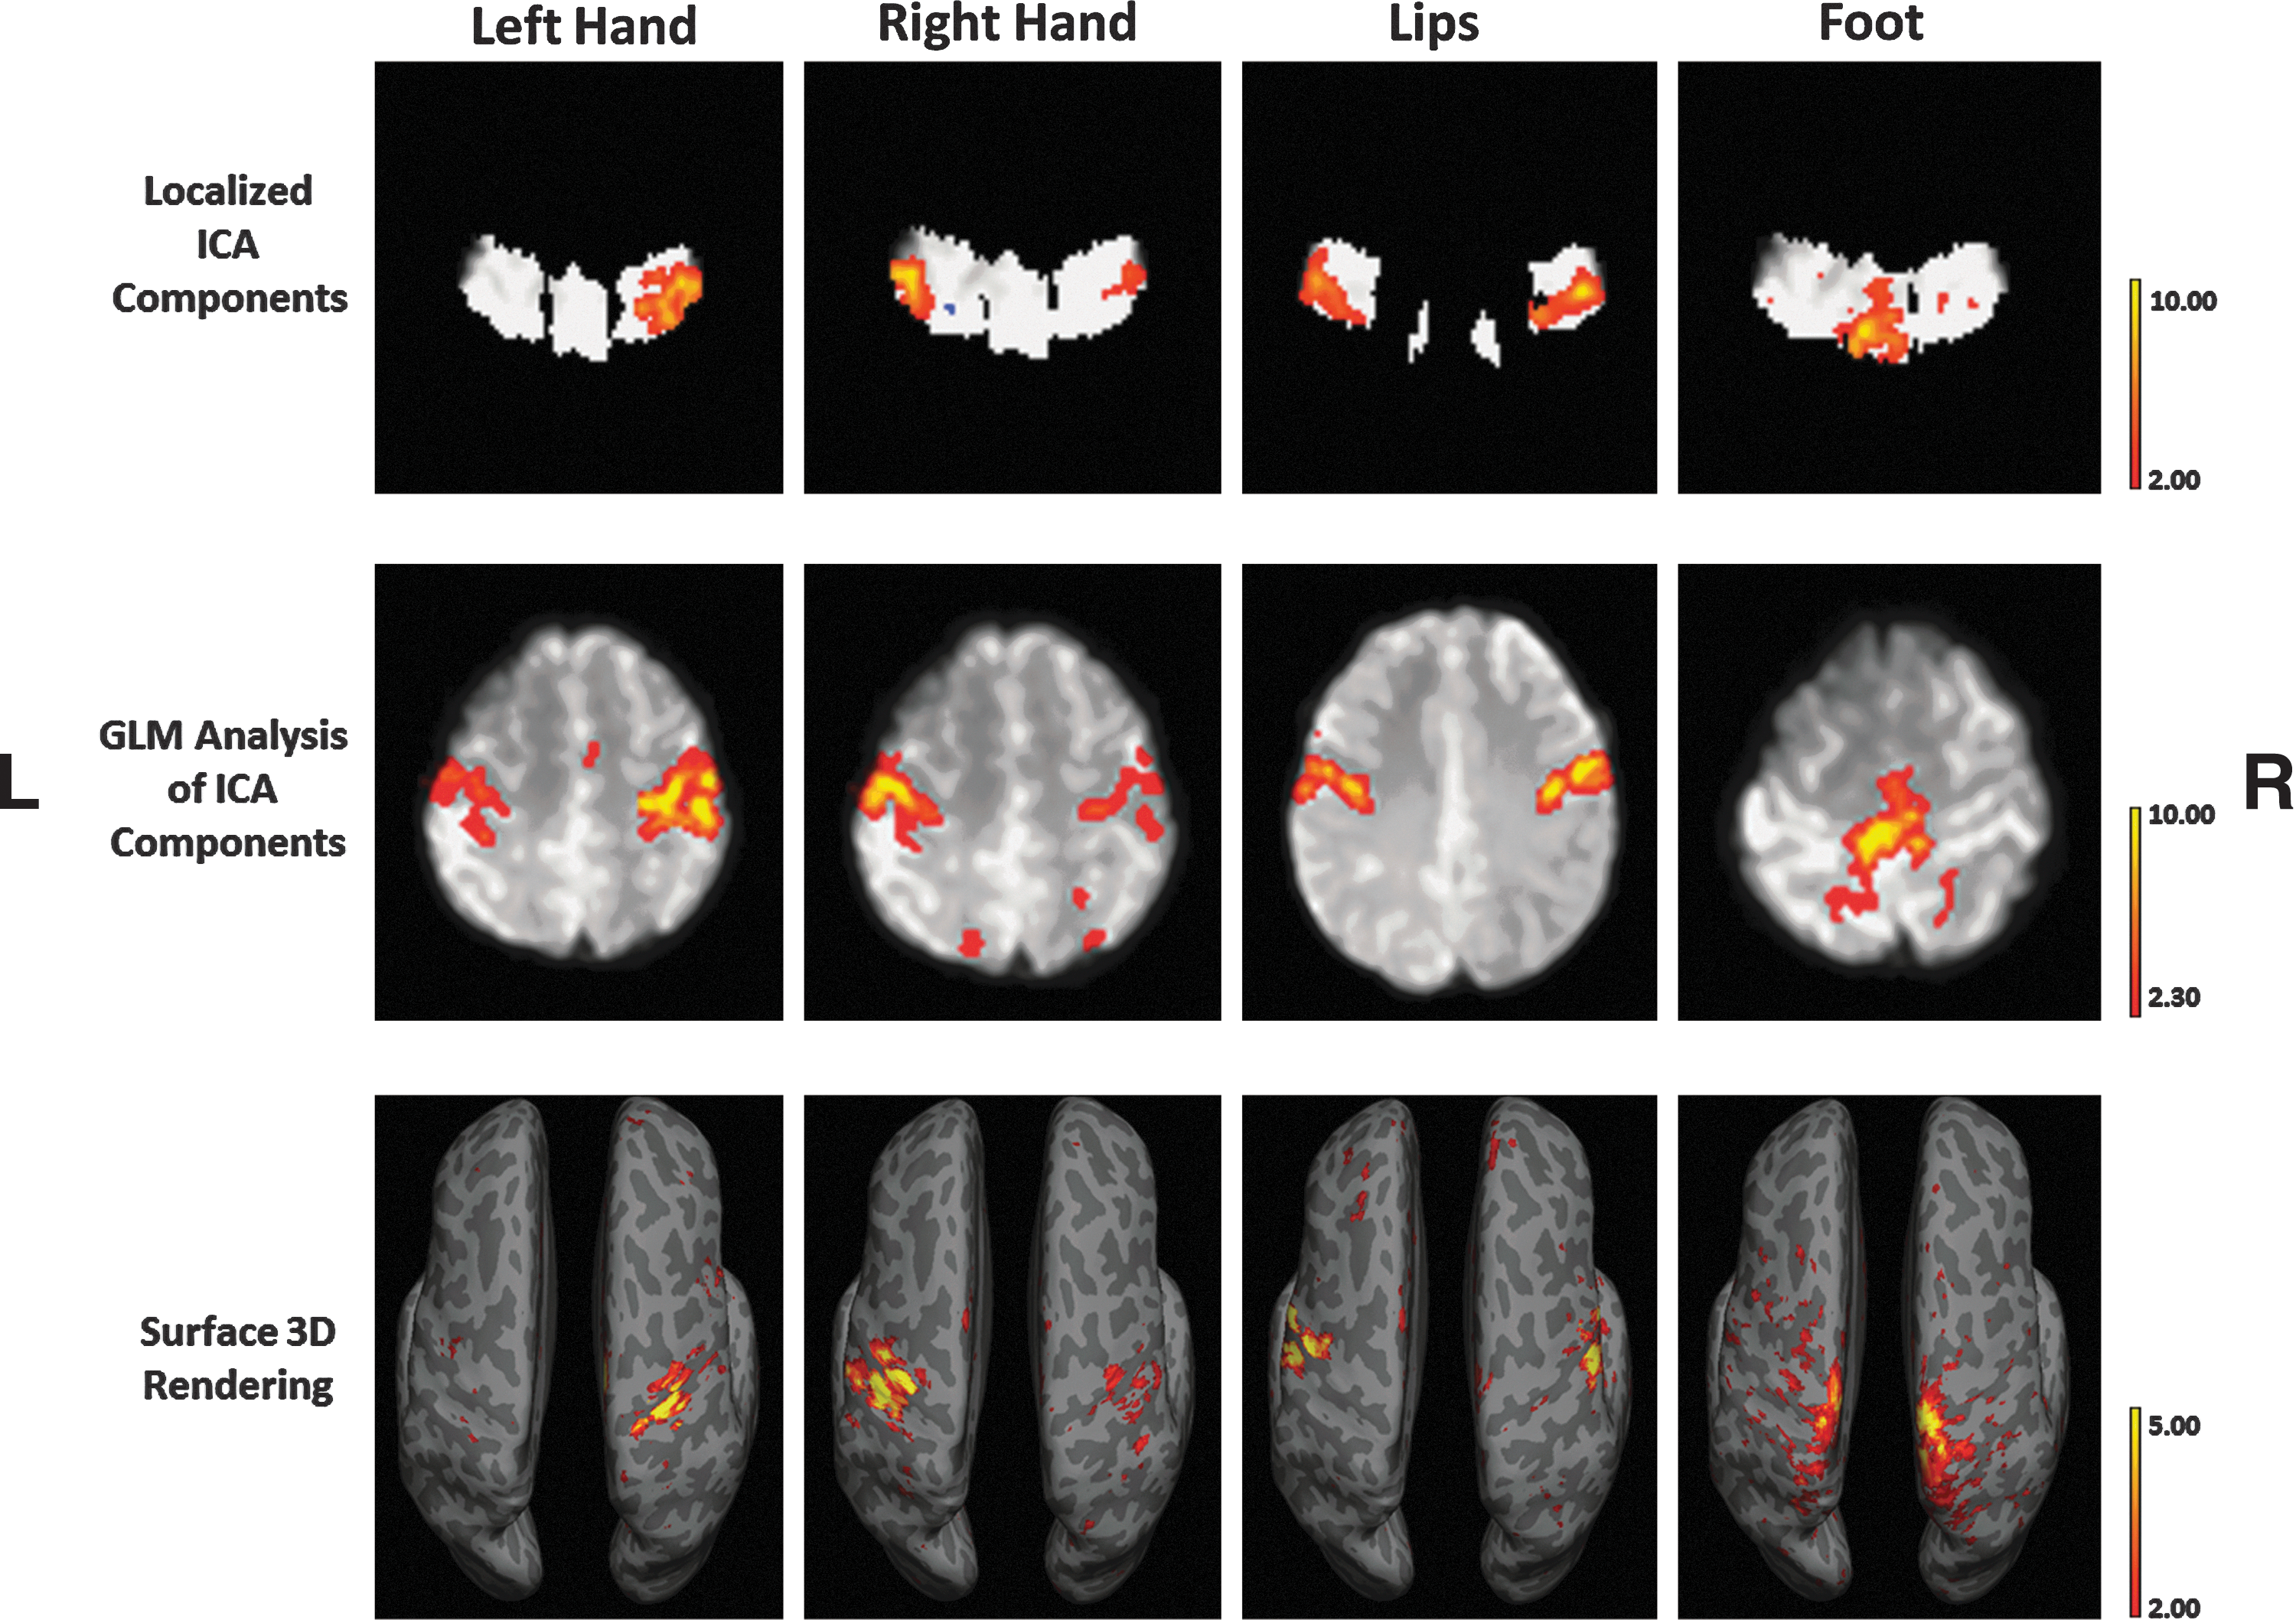
Single-subject results using localized ICA components as a model for GLM analysis. Localized ICA components were chosen, which resembled task-activated motor networks. The corresponding time series is used for GLM analysis for whole-brain connectivity for that component.

Comparison of results of localized ICA with normal whole- brain ICA. Results show similar if not higher success rate in isolating a target network in single-subject analysis.
Inclusion of the thalamus along with the primary motor cortex identified five components within the thalamus using localized ICA; however, only one component showed robust connectivity to the motor cortex (Fig. 5). This component shows connectivity with the ventral lateral (VL) and ventral anterior (VA) regions along with connectivity to the supplementary motor cortex. Thalamic structural connectivity using the coordinates (−14, −18, 4) identified the following three highest probable regions of connectivity: 0.44 to the premotor cortex, 0.38 to the primary motor cortex, and 0.22 to the sensory cortex. In the contralateral thalamus, the coordinates (14, −18, 4) resulted in the probable connectivity values: 0.70 to the premotor cortex, 0.40 to the primary motor cortex, and 0.22 to the prefrontal cortex.
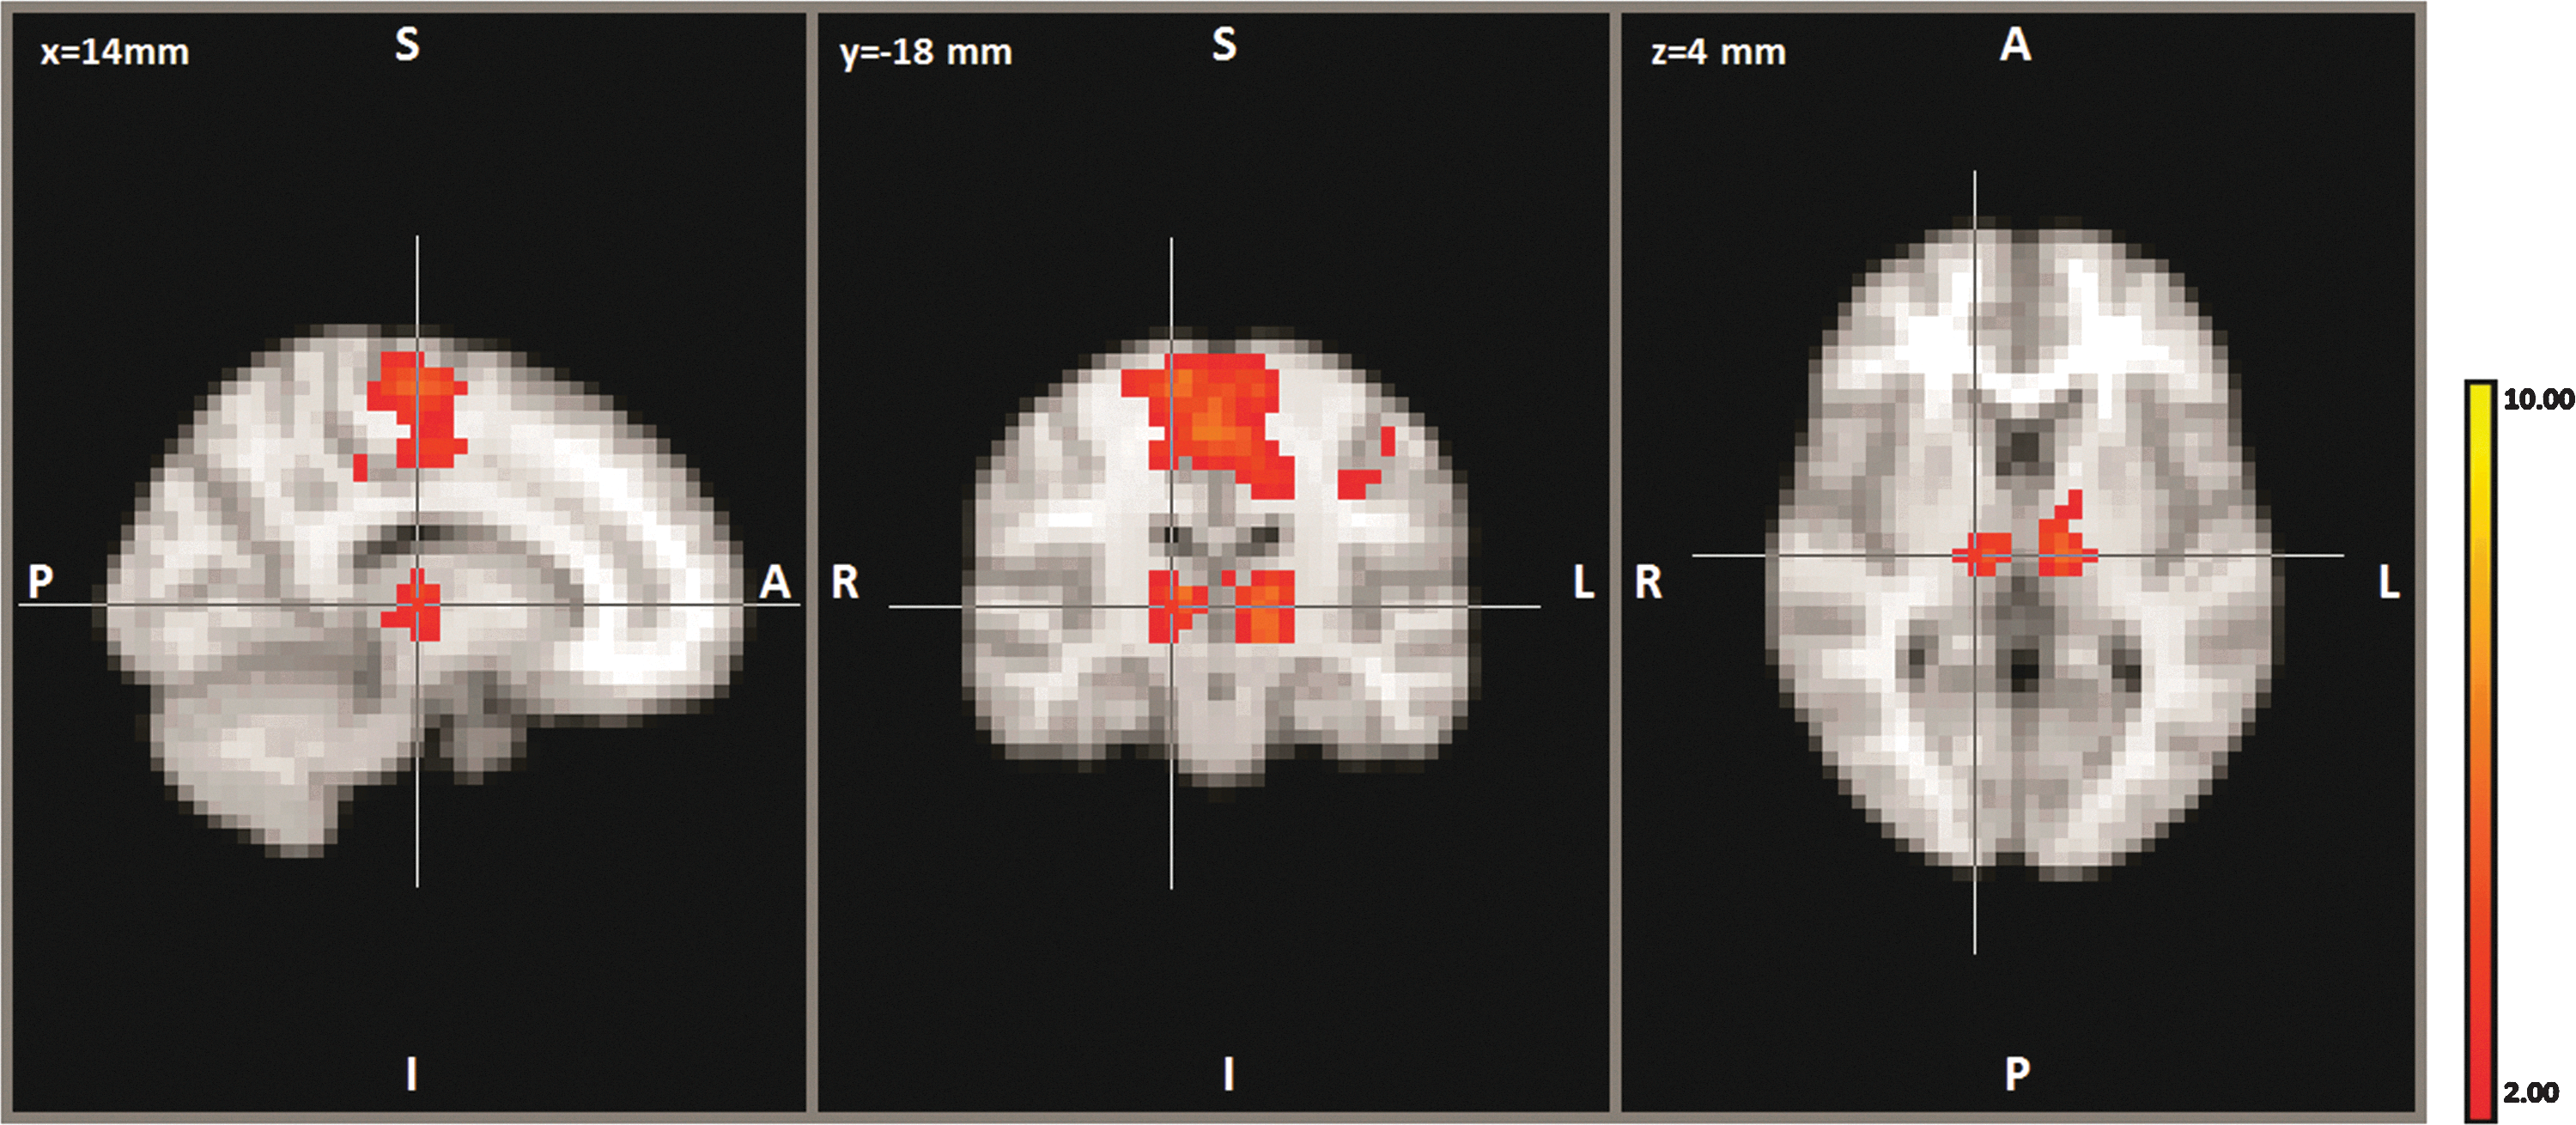
Representation of thalamic motor connectivity. Localized ICA component, which shows connectivity to the premotor regions of the cortex and ventral anterior and ventral lateral regions of the thalamus.
Discussion
Previous specific subnetwork topological brain mapping has predominately used task fMRI experiments and ROI seed-based analysis of resting-state data. While ICA provides a task and model-free approach to brain mapping, it has been limited to having been used only for major network mapping. However, the use of a more focused approach, localized ICA, enables the mapping of specific subnetworks without the limitations of task fMRI and ROI seed-based analysis.
The different components identified using localized ICA reflect a well-segmented somatic topography of the primary motor cortex. Many of these components coincide with regions that are known to be activated during specific motor task activation experiments (Fig. 2a–d). However, because movement within an MRI machine is limited, we lack the means to confirm, which motor task the other components are responsible for (Fig. 2e–j). Although we can speculate about their function based on their location relative to known networks and the motor homunculus, their exact function remains unclear in the absence of specific task activation maps to compare them. For example, because Figure 2i is located below the area known to correlate with the lip movement and because it shows bilateral correlation, we can try to predict its function by referring to at the human motor homunculus. Thus, Figure 2i may possibly represent swallowing or tongue or jaw movement.
Previous studies have used high-order ICA, which decomposes the data into a large number of components, to functionally segment the cortex (Abou Elseoud et al., 2011; Kiviniemi et al., 2009). However, these components vary depending on subject groups. Furthermore, it is not guaranteed that the desired networks will appear in the ICA analysis. As our results show, of the 70 components used for group level analysis, only the lip and foot components were isolated. On the other hand, using only 20 components, localized ICA showed all four chosen motor components. In essence, we can force the ICA algorithm to display our target networks by localizing the data to a specific region of the brain. Therefore, visualization of the four target motor components was possible even with fewer output components. Identification of these components was also facilitated by having fewer components to process.
One disadvantage of localized ICA is that it isolates components in a restricted region. Many connections within the brain extend beyond one area or one lobe. If a given network extends beyond the localized data region, this extra information is lost. However, this limitation can be overcome by using the target component as a time series model in GLM analysis. This allows the creation of a functional ROI seed region. These results may prove to be more accurate than those obtained via current methods for resting-state ROI seed analysis, because localized ICA allows for subject-specific ROIs to be generated. To validate this feature, we performed single-subject localized ICA followed by GLM analysis. Known motor task components were identified for every individual and used as time series GLM models for whole-brain analysis. The majority of subjects showed correlations for the specific function that were predominately in the target region (Fig. 3). This confirms the feasibility of using localized ICA to determine task-specific networks for single-subject analysis. Additionally, we compared the results obtained with whole-brain ICA with a large number of components and localized ICA to evaluate the performance of each method on single-subject analysis. We showed that localized ICA provides more efficient results than whole-brain ICA (Fig. 4). In particular, this approach produces better results with isolating right and left hand components, possibly because localized ICA allows us to choose the specific region in which the network exists rather than relying on the ICA algorithm to randomly isolate the desired component.
To identify the motor-specific corticothalamic network, we included the thalamus to M1 in localized ICA. Analysis of these regions revealed a connectivity map between the thalamus and the motor cortex (Fig. 5). Figure 5 shows a localized ICA component that demonstrates connectivity with the premotor cortex, and the VA and VL nuclei of the thalamus. These nuclei are known to be connected to the motor cortex (Jones et al., 1979; Morel et al., 1997; Niemann et al., 2000). Additionally, the online thalamic connectivity atlas (
The success isolating these specific motor subnetworks offers many possible applications in addition to resting-state network mapping. Localized ICA could offer many clinical applications such as providing valuable presurgical information. Additionally, targeting other or multiple regions, such as the somatosensory, auditory, or visual cortex, enables us to examine the functional segmentation of these regions along with functional connectivity between these regions. This can be further applied clinically to see how these inter/intraregional connectivity changes with disease progression.
Although localized ICA provides a powerful tool for the identification and mapping of specific sub-networks, it is not 100% effective in single-subject analysis (Fig. 4). In some cases, subjects did not show any well-defined motor topography. However, this may be is due to single-subject variability. Figure 4 shows that the two least successfully identified components were left and right hand movement. Our criteria for identifying these components were unilateral correlations within either the left or right hemisphere. However, some subjects may exhibit higher levels of bilateral correlation in these regions during the resting state. If this were the case, the ICA algorithm would treat two regions as one component, which would result in their being overlooked. Additionally, many components that appeared to represent motor networks in localized ICA were found to be parts of another larger network when using GLM analysis.
Conclusion
Localized ICA provides a novel method for mapping specific subnetworks that cannot be visualized via conventional ICA. Studies using ICA have been predominately used to distinguish major cognitive networks and visualization of smaller networks was done using ROI analysis, which requires an a priori hypothesis. Localized ICA determines statistical independence among relatively high correlated BOLD signals, thereby serving as a data-driven method that can be used to create functional ROIs and to examine whole-brain resting-state data. Additionally, since this method can target any region of the brain, it can be applied to functional segmentation of cortical and subcortical structures and be used to determine specific patterns of connectivity between target regions.
Footnotes
Acknowledgments
This research was supported by WCU (World Class University) program through the National Research Foundation of Korea funded by the Ministry of Education, Science and Technology (R32-2008-000-10218-0).
Author Disclosure Statement
No competing financial interests exist.