




Abstract
Parkinson's disease (PD) is a progressive neurologic disorder primarily characterized by an altered motor function. Lower extremity forced exercise (FE) has been shown to reduce motor symptoms in patients with PD. Recent functional magnetic resonance imaging (fMRI) studies have shown that FE and medication produce similar changes in brain activation patterns. Functional connectivity MRI (fcMRI) affords the ability to look at how strongly nodes of the motor circuit communicate with each other and can provide insight into the complementary effects of various therapies. Past work has demonstrated an abnormal motor connectivity in patients with PD compared to controls and subsequent normalization after treatment. Here we compare the effects of FE and medication using both resting and continuous visuomotor task fcMRI. Ten patients with mild to moderate PD completed three fMRI and fcMRI scanning sessions randomized under the following conditions: on PD medication, off PD medication, and FE+off medication. Blinded clinical ratings of motor function (a Unified Parkinson's Disease Rating Motor Scale-III exam) indicated that FE and medication resulted in 51% and 33% improvement in clinical ratings, respectively. In most nodes of the motor circuit, the observed changes in the functional connectivity produced by FE and medication were strongly positively correlated. These findings suggest that medication and FE likely use the same pathways to produce symptomatic relief in patients with PD. However, the connectivity changes, while consistent across therapy, were inconsistent in polarity for each patient. This finding may explain some past inconsistencies in connectivity changes after medication therapy.
Introduction
P
The mechanisms underlying both FE and PD medication therapy are not well understood. Functional imaging may provide an additional insight into these questions. Functional connectivity MRI (fcMRI) has been used to examine the resting connectivity between brain regions in patients with PD. Helmich and coworkers (2010) observed a decreased connectivity between the posterior putamen (PUT) and the inferior parietal lobule, but an increased connectivity between the anterior PUT and the inferior parietal lobule versus controls. Baudrexel and colleagues (2011) observed an increased connectivity between the subthalamic nucleus (STN) and cortical motor regions in patients with PD compared with control patients. When these investigators classified their study patients by the presence or absence of tremor, they observed that only nontremor patients had an increased connectivity between the STN and the supplementary motor area cortex (SMA). Studies incorporating the cerebellum (Appel-Cresswell et al., 2010; Palmer et al., 2010) have offered support for the theory that reduced dopaminergic regulation of the striatum impairs the striato-thalamo-cortical motor circuit and that this impairment is compensated for by the cerebello- thalamo-cortical circuit. Wu and coworkers (2010) observed an increased cortical motor connectivity but a decreased connectivity between the cortical motor and PUT in patients with PD compared with controls; this relationship was normalized in patients with PD after treatment with medication (Wu et al., 2009). However, Kwak and colleagues (2010) observed an enhanced cortico-striatal connectivity in patients with PD who were not taking medication versus controls, and this increased connectivity was normalized after medication therapy, especially in the motor regions. Honey and colleagues (2003) investigated the dopaminergic agonist and antagonist effects on the functional connectivity in healthy older controls and found that antidopaminergic medication increased the connectivity between the caudate, thalamus (THAL), and ventral midbrain.
In the present study, we were interested in exploring whether fcMRI could provide novel information about the underlying mechanisms of PD therapies. Most fcMRI studies are performed while the patient is in the resting state (lying still in an MRI scanner while avoiding movement). Alternatively, the scan may be acquired during the continuous performance of a task, so long as the task being performed meets the following criteria: (1) the task does not have any energy below the temporal filter passband specific to the low-frequency BOLD fluctuations of the functional connectivity; and (2) the task does not change state during the MRI acquisition. Continuous performance fcMRI, when compared with resting-state fcMRI, can present a more controllable subject state and can induce task-dependent modulation of the connectivity between regions (Fair et al., 2007; Lowe et al., 2000). This technique allows a closer examination of the motor circuit while upregulated, and thus provided an additional, independent measure of the motor connectivity.
The primary aim of this study was to compare the acute effects of FE to the effects of medication on the pattern of fcMRI between the nodes of the motor circuit in patients with PD. Based on earlier findings (Ridgel et al., 2009), it was hypothesized that therapeutic medication and FE would produce similar changes in the central nervous system function, as demonstrated by the low-frequency coherence of endogenous BOLD MRI signals between the nodes of the brain motor circuit or functional connectivity. In three separate sessions (off medication, on medication, and post-FE while off medication), patients underwent fMRI and fcMRI while resting and while performing a continuous visuomotor feedback task. A continuous motor task connectivity scan is useful as it provides an independent measurement of the motor connectivity to compensate for the drawback of small sample sizes often encountered when studying disease populations with difficult MRI acquisitions. Here we report on the patterns of the functional connectivity changes in the motor circuit after two separate PD therapies.
Materials and Methods
Study population
A total of six male and four female patients (mean age, 60.6 years; range, 44–79 years) with mild to moderate PD participated in this study. Patients had been diagnosed with idiopathic PD 1 to 12 years (mean±standard deviation [SD], 4.3±3.2 years) before participation in the study and were examined by a trained neurologist specializing in movement disorders. All patients were taking clinically prescribed levodopa-equivalent medications as part of their clinical treatment. For all patients, the medication was the dopamine precursor (levodopa and carbidopa), the dopamine agonist (pramipexole, ropinirole, and bromocriptine), or a drug, that indirectly augments the dopamine levels (entacapone, tolcapone, selegiline, and rasagiline). All participants were prescreened with the American Heart Association/American College of Sports Medicine exercise preparticipation questionnaire before study enrollment. All study procedures were approved by the Cleveland Clinic Institutional Review Board, and all patients provided informed consent after receiving complete verbal and written descriptions of the study.
Data were collected in three separate sessions: when patients were off medication, on medication, and off medication plus post-FE (post-FE). The order of sessions was randomized across patients. For all sessions, patients reported to the laboratory in the practically defined off condition (i.e., at least 12 h since the last dose of medication). For the post-FE session, patients completed the FE session [described in detail in Alberts et al. (2011)] 1 h before clinical evaluation. For the on-medication session, patients took their regular dose of medication 1 h before clinical evaluation. The total time spent in the laboratory was approximately 5 h during the off- and on-medication sessions and 6 h during the FE session. The Unified Parkinson's Disease Rating Motor Scale (UPDRS-III) was used to assess the effectiveness of medication and FE relative to no medication. Patients were assessed and administered the UPDRS by a neurologist, blinded to condition, specializing in movement disorders before the start of each scanning session. The UPDRS-III (Motor Exam) for each patient and an analysis of the potential effect of differences in severity are given in the supplement. The baseline (off medication) UPDRS-III is given in Table 3. The mean±SD baseline UPDRS-III total scores were 45.3±9.5.
MRI data acquisition
Four scans were acquired in three separate sessions for each patient. The three scanning sessions were acquired in the off-medication, on-medication, or post-FE states, and the order of these was randomized. Data were acquired with a 12-channel receive-only head array on a Siemens Trio 3T scanner (Siemens Medical Solutions, Erlangen, Germany). All patients were fitted for a bite bar to restrict head motion during scanning. Each scan session consisted of the following scans.
Scan 1: anatomic 3D whole-brain T1 study
T1-weighted inversion recovery turboflash (MPRAGE); 176 axial slices; thickness, 1 mm; field of view (FOV), 256×256 mm; inversion time (TI)/echo time (TE)/repetition time (TR)/flip angle (FA), 1900 msec/1.71 msec/900 msec/8°.
Scan 2: complex finger tapping motor activation scan (tap)
Functional activation (fMRI) study: 160 repetitions of 31-4-mm-thick axial slices acquired using a pulse sequence based on the prospective motion-controlled, gradient-recalled echo, echoplanar acquisition of Thesen and colleagues (2000); TE/TR/FA, 29 msec/2800 msec/80°; matrix, 128×128; FOV, 256×256 mm; bandwidth, 250 kHz. Patients were instructed to perform the complex finger tapping pattern described below.
Scan 3: resting connectivity scan (rest)
Whole-brain low-frequency BOLD fluctuation fcMRI study: 132 repetitions of 31-4-mm thick axial slices; TE/TR, 29 msec/2800 msec; matrix, 128×128; FOV, 256×256 mm; receive bandwidth, 250 kHz. Patients were instructed to rest with their eyes closed and refrain from any voluntary motion. The modification of the echoplanar sequence used in scans 2 through 4 recorded the image data with the full 24-bit resolution of the acquisition analog-to-digital converters and performed prospective updating of the gradient system, but not the retrospective motion control.
Scan 4: continuous tracking connectivity scan (const)
The whole-brain low-frequency BOLD fluctuation fcMRI study using the same protocol as scan 3, but with the patient performing a biofeedback motor task with the most affected hand (MAH) during the entire scan. The continuous tracking task described below.
The relative order of the continuous task and resting connectivity scans (scans 3 and 4) was randomized so that in some scan sessions, the continuous task connectivity scan was first, and in others, the resting connectivity scan was first. As described above, the relative order of the patient condition was also randomized across scan sessions so that for some patients, the first scan session was acquired during the on-medication condition, while for another patient, the first scan session was acquired during the FE condition and so on across patients. Motor tasks were performed with the equipment described below. Physiologic signals were acquired with a pulse oximeter on the index finger of the less affected hand and with respiratory bellows around the chest for scans 3 and 4. Physiologic timing files were synchronized to scanner data acquisition according to a previously published method (Beall and Lowe, 2007).
Complex finger tapping equipment and task
The complex finger tapping task was performed using a pair of fiber optic data gloves (Fifth Dimension Technologies, Irvine, CA). These gloves use fiber optic strain gauges placed in each finger and thumb on both hands to monitor metacarpophalangeal joint flexion. A data acquisition system was designed in-house to synchronize the readout of these strain gauges to the start of MRI scanning and to monitor the output of the gauges with a temporal resolution of 20 msec (Lowe et al., 2008).
The bilateral complex finger tapping task was performed in a block paradigm, with an initial 60-sec rest block followed by four half blocks consisting of a 45-sec tapping period followed by a 45-sec rest period (Lowe et al., 2008). Start/stop commands were presented using an MRI-compatible audio presentation system (Avotec Inc., Stuart, FL). This task was performed during scan 2.
Fingertip force-tracking equipment and continuous tracking task
A customized pinch grip force system was used to collect force-tracking data during scan 4. The system includes a pressure transducer (M5100; Measurement Specialties, Inc., Fremont, CA), a pinch device (transfer pipette), and a nylon tubing (length, 9.14 m; diameter, 3 mm). The pressure transducer in the MRI control room was connected to the pinch device in the MRI scanning room by nylon tubing passed through a waveguide in the MRI RF shield. Both the nylon tubing and the pinch device were filled with distilled water. The pressure exerted by the patient's precision grip during force tracking was converted to force using a subject-specific prescan calibration of the pinch grip force system. Customized LabView routines (National Instruments, Austin, TX) running on a laptop that was connected to the visual system and trigger output of the scanner were used to acquire the force data at a sampling rate of 128 Hz. The LabView program was set up to track and record the pressure and to provide visual stimuli and feedback to an MRI-compatible video projector and display system (Avotec, Inc.) displaying on a screen inside the scanner. The patient was able to observe the display during each scan through the head coil-mounted mirror provided by the scanner vendor. The LabView program was set up to start when a TTL trigger pulse from the scanner was received.
Participants used a precision pinch grip (i.e., thumb and index finger only) to track a constant target force profile. These tasks were performed with MAH during scan 4. At a calibration session before this scan, but on the day of scanning, the maximum value of 3 maximum precision pinch grip efforts lasting 5 sec each (separated by 1-min rest periods between efforts) was used as the maximum voluntary contraction force. For the constant tracking task, the target line was set at 5% of each patient's measured maximum voluntary contraction. During scan 4, patients were given real-time feedback of their force relative to the target line. Participants were instructed to match their pinch grip force to the target force line as accurately as possible. Practice trials, which were identical to the task performed in the scanner, were performed before the scan sessions during calibration to ensure task comprehension and stable performance, thereby minimizing potential practice effects.
MRI task performance analysis
For the design of this study, tasks were chosen such that the tasks could be performed at similar levels of difficulty for each patient across all conditions. The purpose of monitoring a task performance was to establish minimum performance criteria for all patients included in the analysis. Correct and incorrect finger movements were defined as in Horenstein (2009). Each subject was trained to tap with the fingers of both hands (bimanual, so thumb=both left and right thumbs simultaneously) sequentially in the following order: thumb, middle, pinky, index, and ring finger. The task was self-paced, and subjects were instructed to continually repeat the sequence as fast as they felt they could, while not making mistakes. A final practice session with the gloves was recorded during observation before MRI so that the finger movements could be scored more accurately. The strain gauge signals were converted to amplitude of finger movements and scored for correct taps within the sequence above. The following metrics were produced from the data glove output during scan 2 (Lowe et al., 2008): 1. Accuracy: the number of correct taps (in the prescribed sequence) divided by the total number of finger taps. Accuracy for each finger was computed in a similar way. 2. Rate: the average and variance of the number of taps over a 45-sec time period. This was computed for each finger and for each hand.
Statistical distributions of the accuracy, rate, asymmetry, simultaneity, and rhythm measures from the patients' three scan sessions were used to establish task performance standards for the finger tapping task for each state. No data were excluded on the basis of performance measures more than 2 SDs away from the mean and SD of all patients' accuracy and rate. It is important to note that the complex finger tapping fMRI data is to be used for seed voxel localization in the separate connectivity scan data of scans 4 and 5 only. For this reason, task performance requirements are considerably much less stringent than they would be if we were comparing activation volumes or mean activation to the task. For connectivity localization, only the location of peak activation is used, and this is not affected as long as the subject is performing the task with similar accuracy and rate as all other subjects. All subjects were trained to perform the task in the same way, and to press in a deliberate down-up movement of each finger before moving to the next finger.
For the force-tracking task during scan 4, the performance was assessed using the percentage of the total scan time during which the patient was performing the task correctly. Each patient was considered to be performing the task only when maintaining a force that was within 25% of their individual target level for the duration of the scan. This threshold was set using pilot data and observations of patients using the device for durations similar to the scan time used here. Using these thresholds, the feedback pressure sensor data were converted into an on/off vector describing when the patient was performing the task. If the patient failed to perform within the thresholds for more than 5% of the force-tracking scan, then the data was excluded from analysis. To assess for group differences (on medication, off medication, and post-FE) in performance, 2-sample t tests were computed based on the percentage of time spent performing the task for each patient between groups (on-medication, off-medication, and post-FE) to assess for group differences in performance.
Image postprocessing
The fMRI data from scan 2 were corrected for volumetric head motion with retrospective motion correction using 3dvolreg from AFNI (Cox, 1996). In typical practice, the data would then be spatially filtered and analyzed for activation. However, in the PD population, stimulus-correlated motion is a much greater problem than in controls and most other populations, necessitating additional postprocessing to render the data usable. After volumetric head motion correction, the data were therefore corrected for voxel-by-voxel second-order motion effects (Bullmore et al., 1999), and then passed through a spatial Hamming filter to improve the functional contrast-to-noise ratio (Lowe and Sorenson, 1997).
The fcMRI data from scans 3 and 4 were corrected for motion, adaptive physiologic noise sources (Beall, 2010; Beall and Lowe, 2007), and second-order motion (Bullmore et al., 1999) and were then spatially filtered in the same fashion as the fMRI data.
Image motion analysis
The volumetric motion parameters for scans 2 through 4 were converted into an estimate of the average voxel displacement for each volume using the method of Jiang and coworkers (1995). The fMRI data from scan 2 were visually inspected for apparent motion corruption, as the fMRI analysis results were used solely to seed the connectivity analyses of scans 3 and 4. A substantial portion of the fMRI data were identified as motion corrupted, so a second-order motion-correction procedure was incorporated. After second-order motion correction, the fMRI data were re-evaluated visually for apparent motion, resulting in sufficient compensation for motion in all corrupted scans (see Supplementary Data and Supplementary Fig. S1; Supplementary Data are available online at
There is a known consequence of using a large number of regressors in data corrections; the primary effect is a reduction in the activation t-score of fMRI data (Beall, 2010). In this case, 15 regressors were used, which is not an unusually large number in light of the number of volumes acquired (160). The reduction in mean activation or the number of activated voxels in this analysis was of less concern in this study because we used the activation solely for seed voxel localization. For this reason, it was important to examine the effect of regression on the location of maximal activation. Therefore, the location of maximal activation in primary motor cortices was assessed before and after second-order motion correction. The deviations are shown in Supplementary Table S3 (see Supplementary Data). The activation was also averaged across all three scan conditions separately for each patient to produce more robust activation-based seeds.
Motion in the connectivity datasets was lower than in the fMRI datasets. A peak-to-peak motion displacement threshold of 1.2 mm was used to exclude the connectivity scans with excessive motion corruption. To compare the effects of exercise and medication, we required that a connectivity scan be good in all three scan states for a particular patient; otherwise, those data from that patient were not used. A two-sample t test was used to assess for group differences in mean motion parameters.
Image analysis
The fMRI data were analyzed using a least-squares fit of a boxcar reference function, representing the 45-sec off/45-sec on activation paradigm, to the time series data of each voxel (Lowe and Russell, 1999). The result was a whole-brain Student's t map that could be thresholded to determine regions of significant involvement in the tapping task. Regions of interest (ROIs) were defined by a trained image analyst using anatomic boundaries on a Talairach-transformed T1-weighed anatomic image for each patient. ROIs were chosen from regions known to be in the motor circuit (Delong et al., 1984) that showed considerable activation on motor tasks. For the cortical ROIs, the primary motor cortex of the hand area (M1) and SMA were drawn using activation and anatomy on the right and left sides. ROIs for left and right STN were drawn directly on the T2-weighted EPI base image for the continuous tracking connectivity scan and coregistered to the resting connectivity, while preserving the voxel count. An automated image segmentation program (freesurfer;
A cerebrospinal fluid (CSF) mask was generated from the presaturated images comprising the first four acquisitions of the connectivity datasets. Briefly, the signal decrease from the first acquisition to the second and later acquisitions is dependent on the T1 of the tissue being excited. At 3 Tesla, CSF has an approximate T1 of 4 sec; the T1 values of gray matter and white matter are roughly 1200–1400 and 800 msec, respectively. The average of the second through fourth images divided by the first images gives a simple estimate of the CSF content. A ratio of 75% or above reliably distinguishes CSF, while avoiding identification of the partial-volumed gray matter and white matter tissue. This mask was used in all fcMRI analyses to exclude CSF from the ROIs.
The fcMRI data were analyzed using a least-squares fit of seed voxel reference time series to every voxel in the dataset. The fMRI dataset was coregistered for a rigid-body displacement between scans to each fcMRI scan. This coregistration was applied to the ROIs and to the t map so that activation and anatomic locations could be used to identify a seed voxel in each ROI. The following procedure was performed for each ROI and separately for scans 3 and 4: 1. The activation to the fMRI task was averaged across all three scan sessions for each patient after coregistering. 2. The maximum activated voxel in the ROI was identified in the coregistered t map and ROI. For STN ROIs only, all voxels in the ROI were used, as the ROI size was generally less than or equal to 9 voxels. 3. A seed ROI consisting of the 9 in-plane voxels centered on this location was created. 4. Every voxel in the fcMRI dataset was temporally low-pass filtered below 0.08 Hz. 5. The voxel time series in the seed ROI for the fcMRI scan were averaged and detrended to create a reference seed time series. 6. The correlation between the reference seed time series and every voxel's time series in the image was calculated to create a connectivity correlation map ( 7. The connectivity values were corrected for global effects in an empirical z-transform by normalizing the distribution of connectivity values to have a mean of 0 and an SD of 1 (Lowe et al., 1998).
Effect of exercise and medication
For both fcMRI scans, a separate
Results
MRI task performance and motion analysis
No significant difference between states was observed in tapping rates and error rates for the bilateral tapping scan (Table 1). Additionally, no significant difference was observed between states in the percent of time spent performing the task for the continuous motor-tracking connectivity scan. One subject exceeded 5% of time not performing the task during the continuous motor-tracking connectivity scan in all three sessions and as such, their task connectivity data were excluded from analysis.
Averaged over group data of 10 subjects. No significant group difference observed between the three states. One subject did not meet performance criteria for the Force-Tracking task; this subject's data were excluded from analysis.
FE, forced exercise; SD, standard deviation.
Without the second-order motion-correction process, 18 fMRI t maps out of 30 were visually identified as motion corrupted. With the second-order motion-correction process, all 30 datasets appeared to present uncorrupted motor activation for connectivity localization (see Supplementary Fig. S1; uncorrected datasets shown in column 1, corrected datasets shown in column 2; the threshold used for display and visual assessment was determined based on the fit of the t statistics to a Gaussian distribution for each dataset so that the assessment would be more sensitive to the localization of maximal activation than a change in the false positive rate). The fMRI activation averaged across subjects in Montreal Neurologic Institute (MNI) stereotaxic space with and without the second-order motion correction is shown in Figure 1.
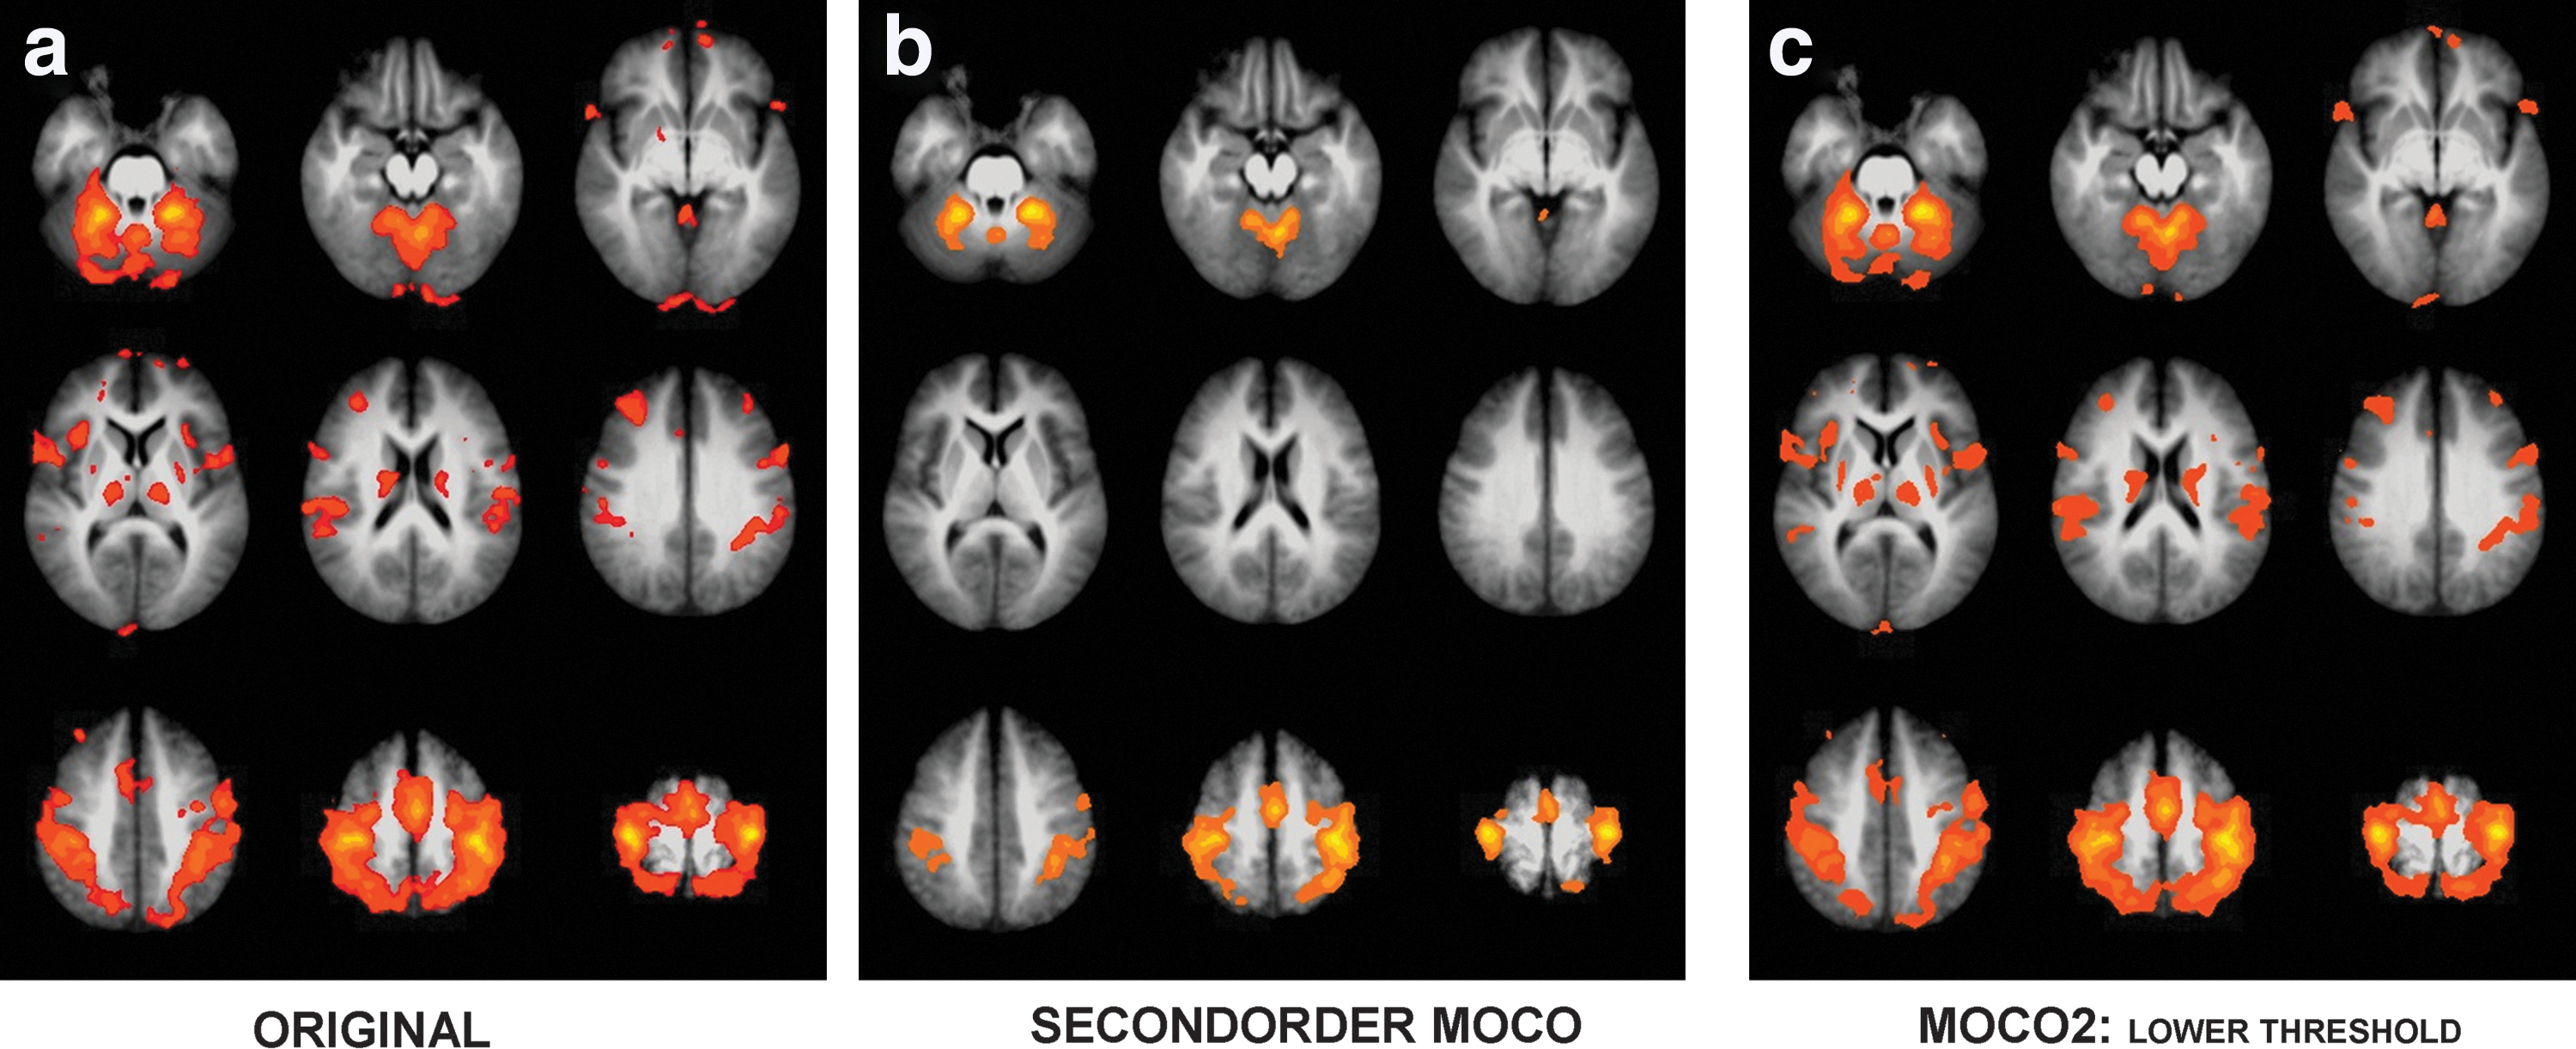
Group averages in MNI space of activation to complex finger tapping task in an fMRI scan with
The fcMRI mean voxel displacements averaged across patients for each state are reported in Table 2 and the maximum peak-to-peak motion parameters are histogrammed in Figure 2. The t tests of motion did not reveal any significant differences between resting fcMRI and continuous task fcMRI and between the three scan states. Finally, the voxel localization shift as a result of second-order motion correction for each activation-based seed is shown in Supplementary Table S3 (see Supplementary Data). Based on these results, all fMRI data were deemed suitable for use in connectivity localization.
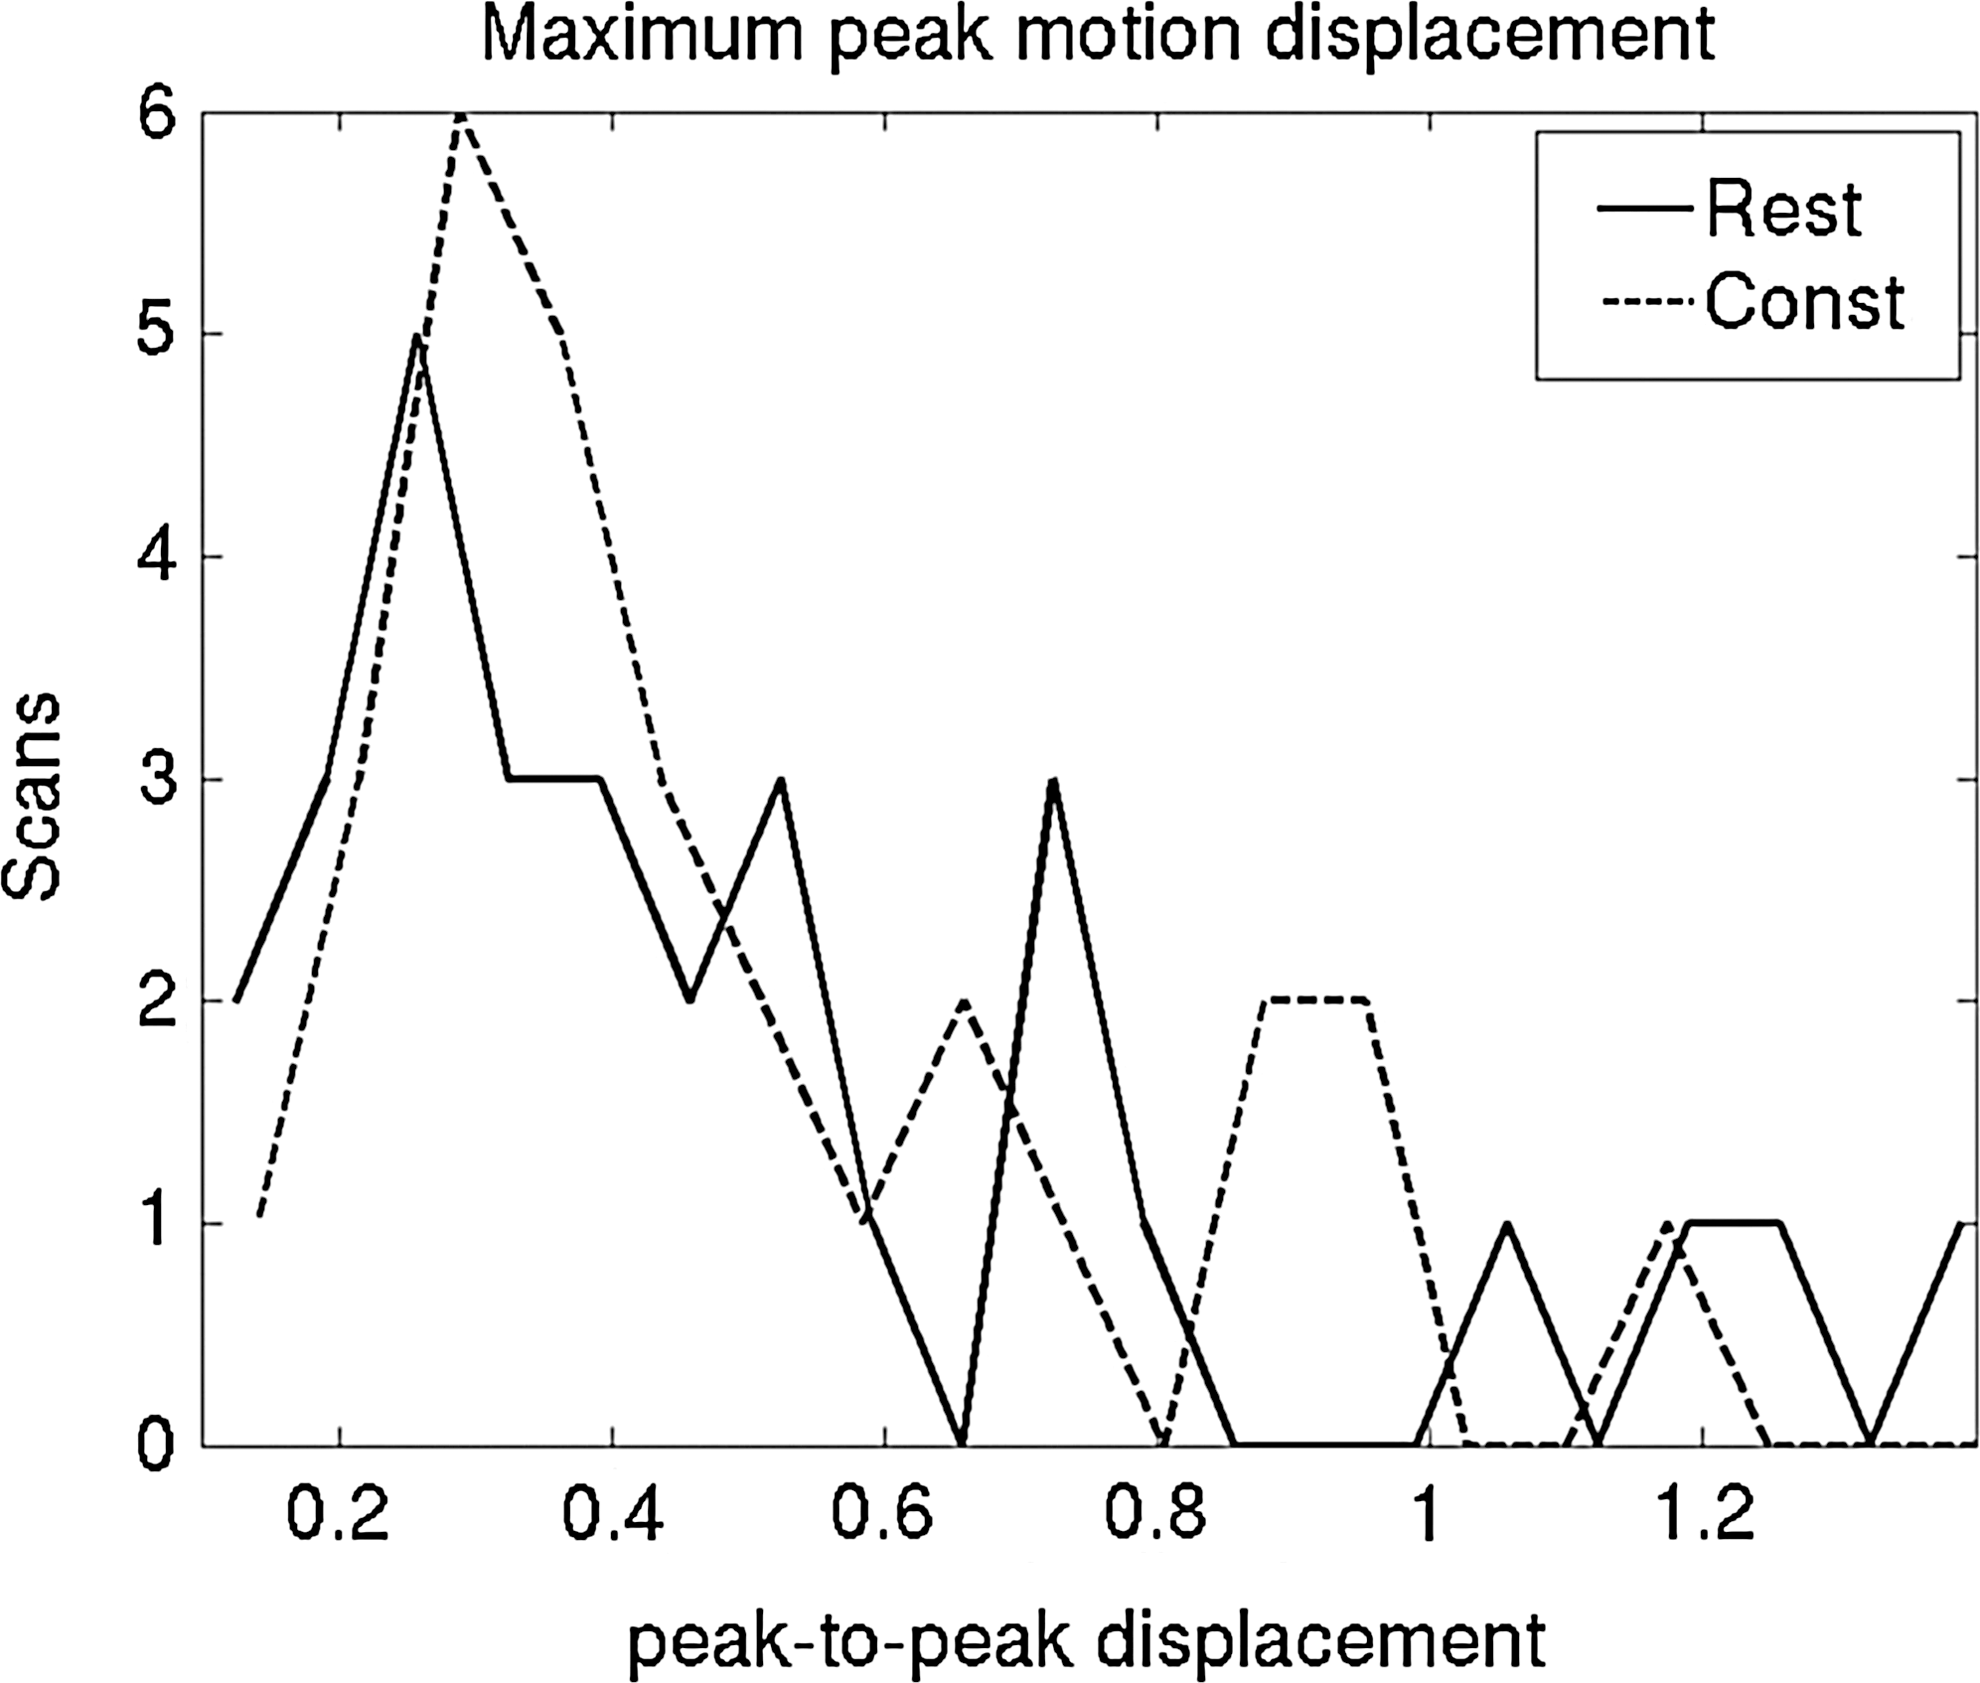
Histogram of maximum peak-to-peak motion parameters in scans 3 and 4.
No significant group difference observed between the three states.
Const, continuous tracking connectivity scan; FE, forced exercise; fcMRI, functional connectivity magnetic resonance imaging; fMRI, functional magnetic resonance imaging; rest, resting connectivity scan; tap, complex finger tapping motor activation scan.
Effect of forced-exercise and medication
Blinded UPDRS-III ratings improved 33% and 51% with medication and FE, respectively (patient demographics are given in Table 3 and Supplementary Tables S2 and S4). The mean

Scatterplots of and linear correlation between
MAH, most affected hand; DH, dominant hand; PDD, Parkinson disease duration; UPDRS, Unified Parkinson's Disease Rating Motor Scale.
Results were significant.
GP, globus pallidus; M1, motor cortex; PUT, putamen; ROI, region of interest; SMA, supplementary motor area; STN, subthalamic nucleus; THAL, thalamus.
The mean cortico-cortico, cortico-subcortico, and cortico-STN
Patient had inconsistent directionality of cortico-subcortical connectivity changes across therapies.
Patient 8's resting connectivity data were excluded.
Patient 9's continuous task connectivity data were excluded.
med, medication.
Discussion
This study demonstrated that FE and medication produced a similar level of symptomatic relief in patients with PD. The therapies also led to similar alterations in the pattern of the functional connectivity. These results suggest that these therapies, despite being very different in application, likely use similar pathways to produce symptomatic relief. There was no statistically significant difference in the change from baseline UPDRS between FE and medication (the two-sample t-test p=0.281), but a further exploration of this was outside the scope of this study and furthermore suffered from power limitations.
Based on past results (Baudrexel et al., 2011; Kwak et al., 2010; Wu et al., 2009), we expected to see an increased cortico-subcortical connectivity in patients with PD that would subsequently normalize after therapy. Although similar changes were consistently seen after FE and medication, the direction of connectivity changes varied among individuals. Some individuals had an increase in the cortico-subcortical connectivity, whereas others showed a decreased connectivity. The directionality of change in connectivity was largely preserved across the different therapies employed (apart from homologous M1 and SMA). The reason for the apparent differences among individual patients is unclear. It may reflect an underlying variability/heterogeneity in the expression of the disease. Clearly, additional study is necessary to understand the implication of this finding. This initial study was not powered to address this issue, but we are repeating this study in a larger group of patients. If further study confirms this relative heterogeneity among patients, this may explain the variations in study findings that have occurred when patients were classified by a subtype (Baudrexel et al., 2011). Further, this would suggest the need for careful interpretation of results averaged across many patients.
Exercise has a strong effect on baseline cerebral blood flow, with increases in the motor cortex of up to 20% up to 30 min after exercise (Smith et al., 2010). Concomitant changes in physiology (systolic and mean arterial blood pressure) showed evidence of normalization by 30 min after (Smith et al., 2010). It is unknown whether these cerebral blood flow changes persist after 1 or 2 h following exercise. Any change in global cerebral blood flow would bias the entire distribution of whole-brain correlation values. However, this effect is unlikely to be reflected in our connectivity changes, as we explicitly normalized the distribution of whole-brain correlations to have zero mean and unity SD (Lowe et al., 1998).
The inclusion of early PD patients with an initial diagnosis of PD within the past 1 to 2 years may be problematic due to potential misdiagnosis. Despite early studies concluding that initial diagnoses of PD by general neurologists were incorrect 24%–35% of the time, a later study showed that this is not the case when the diagnosis is made by movement disorder specialists (Jankovic et al., 2000). In a study of 800 patients diagnosed with early PD (mean duration 2.2 years) by a movement disorder specialist, it was shown that after an average of 6 years of follow-up, only 8.1% were incorrectly diagnosed (Jankovic et al., 2000). This indicates that movement disorder specialists are accurate at diagnosing even early PD (Jankovic, 2008). Furthermore, is has been shown that 90% of patients with early PD who are initially diagnosed with “Possible PD” would eventually qualify for the diagnosis of “Probable PD”(Gelb et al., 1999). For these reasons, we are confident we have likely been successful in including only PD within our study population.
It is expected that the plasma levels of the medications will fluctuate during the hours following administration, and due to this, it is possible that the patient symptoms will oscillate as well. However, plasma levels may be misleading, as patient symptoms appear to stabilize by the 1-h postmedication time point. Because the UPDRS scores were acquired essentially at the start of the peak efficacy and the MRI session is under 2 h, we expected that the on-medication MRI session was completed in a stable state. Nevertheless, we did not acquire a UPDRS before and after the on-medication MRI session, and this is a limitation of the study design.
Additionally, it is possible the effect of FE will persist through to the on-medication or off-medication scans, if those occurred after the FE session. In the data acquired here, the lower limit set on time since the FE session for on- and off-medication scans was simply 1 day, or 24 h. Within our data, the shortest time after the FE scan before one of the other sessions was 2 days. The length of time that the FE effect persists is not known and is currently being evaluated in a larger trial. In this study, both the post-FE scan and the on-medication scan were acquired 1 hr post-therapy for consistency, but future trials will incorporate newer data on the temporal evolution of the therapy as it becomes available.
Because the primary aim of this study was to compare two therapies for PD, we included only patients and no healthy controls. This limits our ability to understand the directionality of connectivity changes among individual patients with respect to the response in healthy controls. A further limitation is the relatively small sample size of the present study. Additionally, the moderate atrophy seen in many subjects (see Supplementary Fig. S1 in the Supplementary Data) makes it difficult to do any voxelwise analysis as brain regions will not line up accurately. For this reason, we used functionally localized ROIs, which we expect to capture the ROIs better than present voxelwise methods are capable of. Last, the study is limited as no attempt was made to stratify patients into subtypes of predominant PD symptoms. The patients included in the study had variable levels of tremor, bradykinesia, and rigidity. It is possible that the individual symptomatic variability may have accounted for some of the variability seen in connectivity and subsequent normalization after therapy.
Conclusion
Medication and FE are two very different therapies, which can improve symptoms in PD. This study suggests that despite their apparent differences, the changes these therapies induce in the brain connectivity are highly similar, and thus they likely share underlying mechanisms. Individual patients demonstrated variability in the directionality of their connectivity changes, which may account for some of the apparently contradictory findings of the previous functional connectivity studies evaluating the motor circuit in PD.
Footnotes
Acknowledgments
The authors wish to thank the staff of the Cleveland Clinic Mellen Center Magnetic Resonance Imaging Facility (Blessy Mathews, John Cowan, Katherine Koenig, Jian Lin, Katherine Murphy, and Derrek Tew) and the Neural Control Lab (Angela Ridgel) for assistance in carrying out this research. This work was supported by NIH R01NS073717-01 and the Davis Phinney Foundation.
Author Disclosure Statement
No competing financial interests exist.
References
Supplementary Material
Please find the following supplemental material available below.
For Open Access articles published under a Creative Commons License, all supplemental material carries the same license as the article it is associated with.
For non-Open Access articles published, all supplemental material carries a non-exclusive license, and permission requests for re-use of supplemental material or any part of supplemental material shall be sent directly to the copyright owner as specified in the copyright notice associated with the article.
