




Abstract
The child brain is a small-world network, which is hypothesized to change toward more ordered configurations with development. In graph theoretical studies, comparing network topologies under different conditions remains a critical point. Constructing a minimum spanning tree (MST) might present a solution, since it does not require setting a threshold and uses a fixed number of nodes and edges. In this study, the MST method is introduced to examine developmental changes in functional brain network topology in young children. Resting-state electroencephalography was recorded from 227 children twice at 5 and 7 years of age. Synchronization likelihood (SL) weighted matrices were calculated in three different frequency bands from which MSTs were constructed, which represent constructs of the most important routes for information flow in a network. From these trees, several parameters were calculated to characterize developmental change in network organization. The MST diameter and eccentricity significantly increased, while the leaf number and hierarchy significantly decreased in the alpha band with development. Boys showed significant higher leaf number, betweenness, degree and hierarchy and significant lower SL, diameter, and eccentricity than girls in the theta band. The developmental changes indicate a shift toward more decentralized line-like trees, which supports the previously hypothesized increase toward regularity of brain networks with development. Additionally, girls showed more line-like decentralized configurations, which is consistent with the view that girls are ahead of boys in brain development. MST provides an elegant method sensitive to capture subtle developmental changes in network organization without the bias of network comparison.
Introduction
T
At a macroscale, the development of brain network topology can be measured by using electroencephalography (EEG) and functional magnetic resonance imaging (fMRI) and diffusion tensor imaging. Such studies showed that the child brain first develops strong local connectivity, which shifts gradually toward stronger long-distance connectivity with maturation (Barry et al., 2004; Fair et al., 2009; Lebel et al., 2008; Power et al., 2010; Supekar et al., 2009; Thatcher, 1992; van Baal et al., 2001; Yap et al., 2011). From a graph theoretical perspective, the child brain has a small-world organization that combines optimal properties as the high clustering of an ordered network and the short path length of a random network (Boersma et al., 2011; Fair et al., 2009; Micheloyannis et al., 2009; Power et al., 2010; Supekar et al., 2009). In our previous EEG studies, we showed that with development from 5 to 7 years and to older ages, brain functional networks shift from more random toward a more ordered configuration (Boersma et al., 2011; Smit et al., 2010; Smit et al., 2012).
A critical point in graph theoretical studies remains the difficulty in comparing networks in different conditions and across groups. Comparison of graphs derived from brain networks requires a step of normalization, for instance, by comparing the observed network to randomized networks, or by setting a fixed average degree (K), or a fixed threshold, which often results in differences in K across conditions or differences in the sparsity of networks between groups (van Wijk et al., 2010). However, none of these approaches presents a unique and consistent solution to the problem of network comparison. A possible consistent solution to these problems might be to construct a so-called minimum spanning tree (MST). With this approach, a unique subgraph is constructed from a weighted network (Steen, 2010; Wang et al., 2008). It connects all the nodes of the network in such a way that the connection cost (sum of all connection distances) is minimized without forming cycles. In this way, networks are obtained with similar numbers of nodes n and edges n-1 facilitating the direct comparison of graph topology across conditions and groups. Extreme topologies of these MSTs are on the one hand a star-like or centralized configuration with one central node that has a short longest path (diameter) to connect all other nodes in the tree and, on the other hand a decentralized line-like tree with all nodes on a line resulting in the longest diameter. The star-like and line-like configurations might be translations of, respectively, random and ordered networks previously described. With the MST method, we might be able to capture the previously found developmental change from random to ordered without the bias of a normalization or comparison step.
So far, the MST method has been applied in only a few studies examining brain networks. A resting-state fMRI study in Alzheimer's disease (AD) used the MST method to examine connectivity of the default mode network (DMN). Although degree distributions of the MST did not differ between AD and controls, the AD patients did show higher segregation of the DMN (Ciftci, 2011). Furthermore, the MST method was applied to determine the critical nodes in an epileptic network reconstructed from corticographic recordings (Ortega et al., 2008). Other studies applying MST in brain networks, did not describe MST topology, instead they used the MST to construct connectivity matrices from which connectivity complexity or entropy was calculated in different conditions, such as for (childhood-onset) schizophrenia (Alexander-Bloch et al., 2010; Schoen et al., 2011), in epilepsy (Lee et al., 2006; Ortega et al., 2008), and for the effect of anesthesia (Lee et al., 2010).
The aim of the present study is to test the hypothesis of a transition from random to regular brain network topologies during maturation while correcting for the bias of network comparison. Resting-state EEG recordings in 5- and 7-year-old children were used to construct functionally connected networks. From these weighted networks, the MST was constructed and several parameters were calculated to extend our knowledge about developmental longitudinal changes and gender differences in functional brain networks
Material and Methods
Subjects
In this study, we explored a dataset that was previously collected in a study of genetic and environmental influences on neural development during childhood conducted in 209 twin pairs at 5 [mean age (SD)=5.2 (0.2) years, IQ=103.5 (0.9)] and 7 years of age [mean age (SD)=6.8 (0.2), IQ=102.9 (1.0)] (van Baal et al., 1996, 2001). Boys and girls did not differ in IQ at both 5 (t=−1.01, p=0.29) and 7 (t=−0.67, p=0.50) years. The twins were all registered at the Netherlands Twin Register (Boomsma et al., 1992, 2006). All participants were healthy, with normal IQ (Boomsma and van Baal, 1998) and normal or corrected to normal vision. Parents of the children gave written informed consent for their offspring to participate in the study. The study was approved by the Central Ethics Committee on Research Involving Human Subjects of the VU University Medical Center, Amsterdam (IRB number IRB-2991 under Federal wide Assurance 3703) and was in agreement with the Declaration of Helsinki.
As in our recent study on developmental changes in brain networks (Boersma et al., 2011), we only included children with both an EEG measurement at 5 years of age and a repeated measurement at 7 years of age. The resulting dataset contained 184 twin pairs and 5 single twins (373 children). From this selection, 146 children were excluded, since they did not meet the criterion of having at least four artifact-free epochs at both measurement occasions (exclusion criteria are described in the next section). The final study group consisted of 227 children (102 boys, 125 girls) from 143 families having measurements on both occasions at 5 (M=5.2 years, SD=0.2) and 7 years of age (M=6.8 years, SD=0.2), with a normal IQ at 5 years (mean IQ=103.1; SD=13.5) and at 7 years (mean IQ=102.9; SD=14.7).
EEG recordings
A detailed procedure of EEG data collection is described elsewhere (van Baal et al., 1996). In short, 3-min eyes-closed resting-state was recorded with an electro-cap with electrodes in the 10–20 system of Jasper (1958) on 14 scalp locations (Fp1, Fp2, F7, F3, F4, F8, C3, C4, P3, P4, O1, O2, T5, T6). Linked ears reference was used according to the method described by Pivik and associates (1993). All electrode impedances were kept below 10 KΩ. Time constants (t) were set to 5 sec [equivalent to 1/(2×πI×t)=0.003-Hz single-pass 6-dB filter], high-frequency cutoff was 35 Hz and sample frequency was 250 Hz. Signals were converted with a 12 bit AD converter. For further processing, the recordings were converted to ASCII files. For each subject, we (M.B.) selected four artifact-free epochs of 4,096 samples (16,384 sec) after visual inspection. Drowsiness, actual sleep, (eye-) movements, muscle contractions, bad channels, and clipping caused most typical artifacts.
Functional connectivity
Each epoch was digitally filtered offline in frequency bands of interest: theta 4–6 Hz, alpha 6–11 Hz, and beta 11–25 Hz. The choice of these frequency bands was based on the power spectra described in our previous study (Boersma et al., 2011). These spectra show that 5- and 7-year-old children have power spectra with an alpha peak frequency around 8 Hz. Using adult lower and upper alpha frequency bands would split up the alpha frequency at its peak, which could bias the results. Therefore, we chose to adjust the range of frequency bands to correctly capture all alpha-like frequencies in these children. The synchronization likelihood (SL) was calculated with BRAINWAVE software 9.54(CS,
Minimum spanning tree
The MST of an undirected weighted graph is a unique subgraph that connects all the nodes in such a way that the cost (the sum of all the link distances) is minimized without forming cycles. In our case, the distance per link was defined as the inverse of the weight of the link (link distance=1/SL). Consecutively, the tree that minimizes the sum of distances was searched, which was done with BRAINWAVE software 9.54 (CS,
From these MST graphs, several measures—degree, leaf number, betweenness centrality (BC), eccentricity, diameter, hierarchy (Th), and degree correlation (R)—give information about the topological properties of this tree (Fig. 1). As a measure for the degree of the total tree, we took the maximum degree. The leaf number (L) is the number of nodes on the tree with degree=1. The leaf number has a lower bound of 2 and an upper bound of m=n−1. The leaf number presents an upper bound to the diameter of the tree, which is the largest distance between any two nodes of the tree. The upper limit of the diameter is defined as d=m−L+2, implying that the largest possible diameter will decrease with the increasing leaf number. Eccentricity of a node is defined as the longest distance between that node and any other node of the tree and is low if this node is central in the tree. The BC of a node u is the number of shortest paths between any pair of nodes i and j that are running through u, divided by the total number of paths between i and j. Since BC is a fraction, its value ranges between 0 and 1. Leaf nodes have a BC of 0, while the central node in a star graph has a BC of 1. BC is a measure for the importance of a node within the network. The node with the highest BC has the highest load, that is, the highest number of shortest paths between any two nodes run through this node. Degree, eccentricity, and BC are different criteria for relative nodal importance and may point out the critical nodes in a tree.
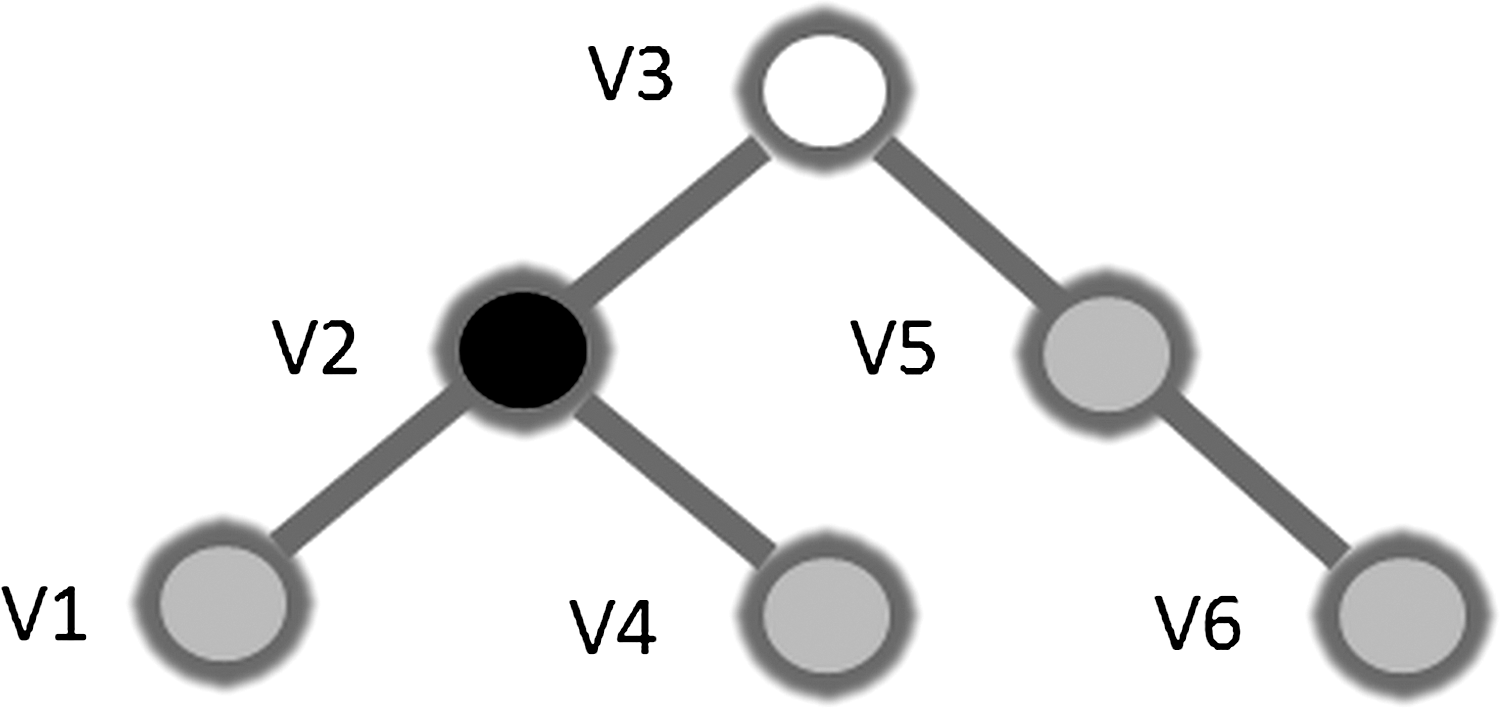
Example of a simple minimum spanning tree (MST) and its characteristics. Leaf nodes have a degree of 1, therefore nodes v1, v4, and v6 are leaf nodes. The diameter is the longest distance between any two nodes. In this tree, node v1 and v6 are most distant and the diameter has value 4. Node v2 has the highest degree since it is connected to three other nodes. Node v3 has the highest betweenness centrality (BC), that is, the highest number of shortest paths between any node pair run through v3. This is also the node with the lowest eccentricity, which is defined as the longest possible distance between a node and any other node in the tree.
What kind of tree topology would result in optimal performance of the network? The first criterion is efficient communication between all vertices that would require a small diameter, and thus, a star-like topology. However, in a star-like tree with a diameter 2, the central node might easily be overloaded, since it has a BC of 1. Therefore, the second criterion would be prevention from overloading hubs by setting a maximal BCmax for any of the tree nodes. The optimal tree should then reflect the best possible balance between both criteria. To this aim, a tree hierarchy measure Th was developed to show the balance between diameter reduction and overload prevention. It is defined as:
To assure TH ranges between 0 and 1, the denominator is multiplied by 2. If l=2, that is, a line-like topology, and m approaches infinity, TH approaches 0. If l=m, that is, a star-like topology, TH approaches 0.5. For leaf numbers between these two extreme situations, TH can have higher values. For instance, in a tree with a central node u1 that is connected to two other nodes u2 and u3 and all remaining nodes directly connected to either u2 or u3 that have similar degrees, in such a tree, the leaf number is m−3 and BCmax is 0.5 and the TH will be closer to 1 if m is increased.
Another measure is the degree correlation that is an index of whether the degree of a node is influenced by the degree of its neighboring vertices to which it is connected. Graphs with a positive degree correlation are called assortative; in the case of a negative degree correlation, a graph is called disassortative. Degree correlations can be quantified by computing the Pearson correlation coefficient of the degrees of pairs of vertices connected by an edge. Interestingly, most social networks tend to be assortative, while most technological and biological networks tend to be disassortative (Newman, 2003).
Illustrative test networks
To illustrate the topological characterization of MST graphs, we consider a number of simple example test trees. These include the two extreme configurations, namely, a linear tree that has only two leaf nodes and a star-like tree that has m leaf nodes and one central node, and a range of trees with a leaf number between 2 and m, with m=13 in our study (Fig. 2).
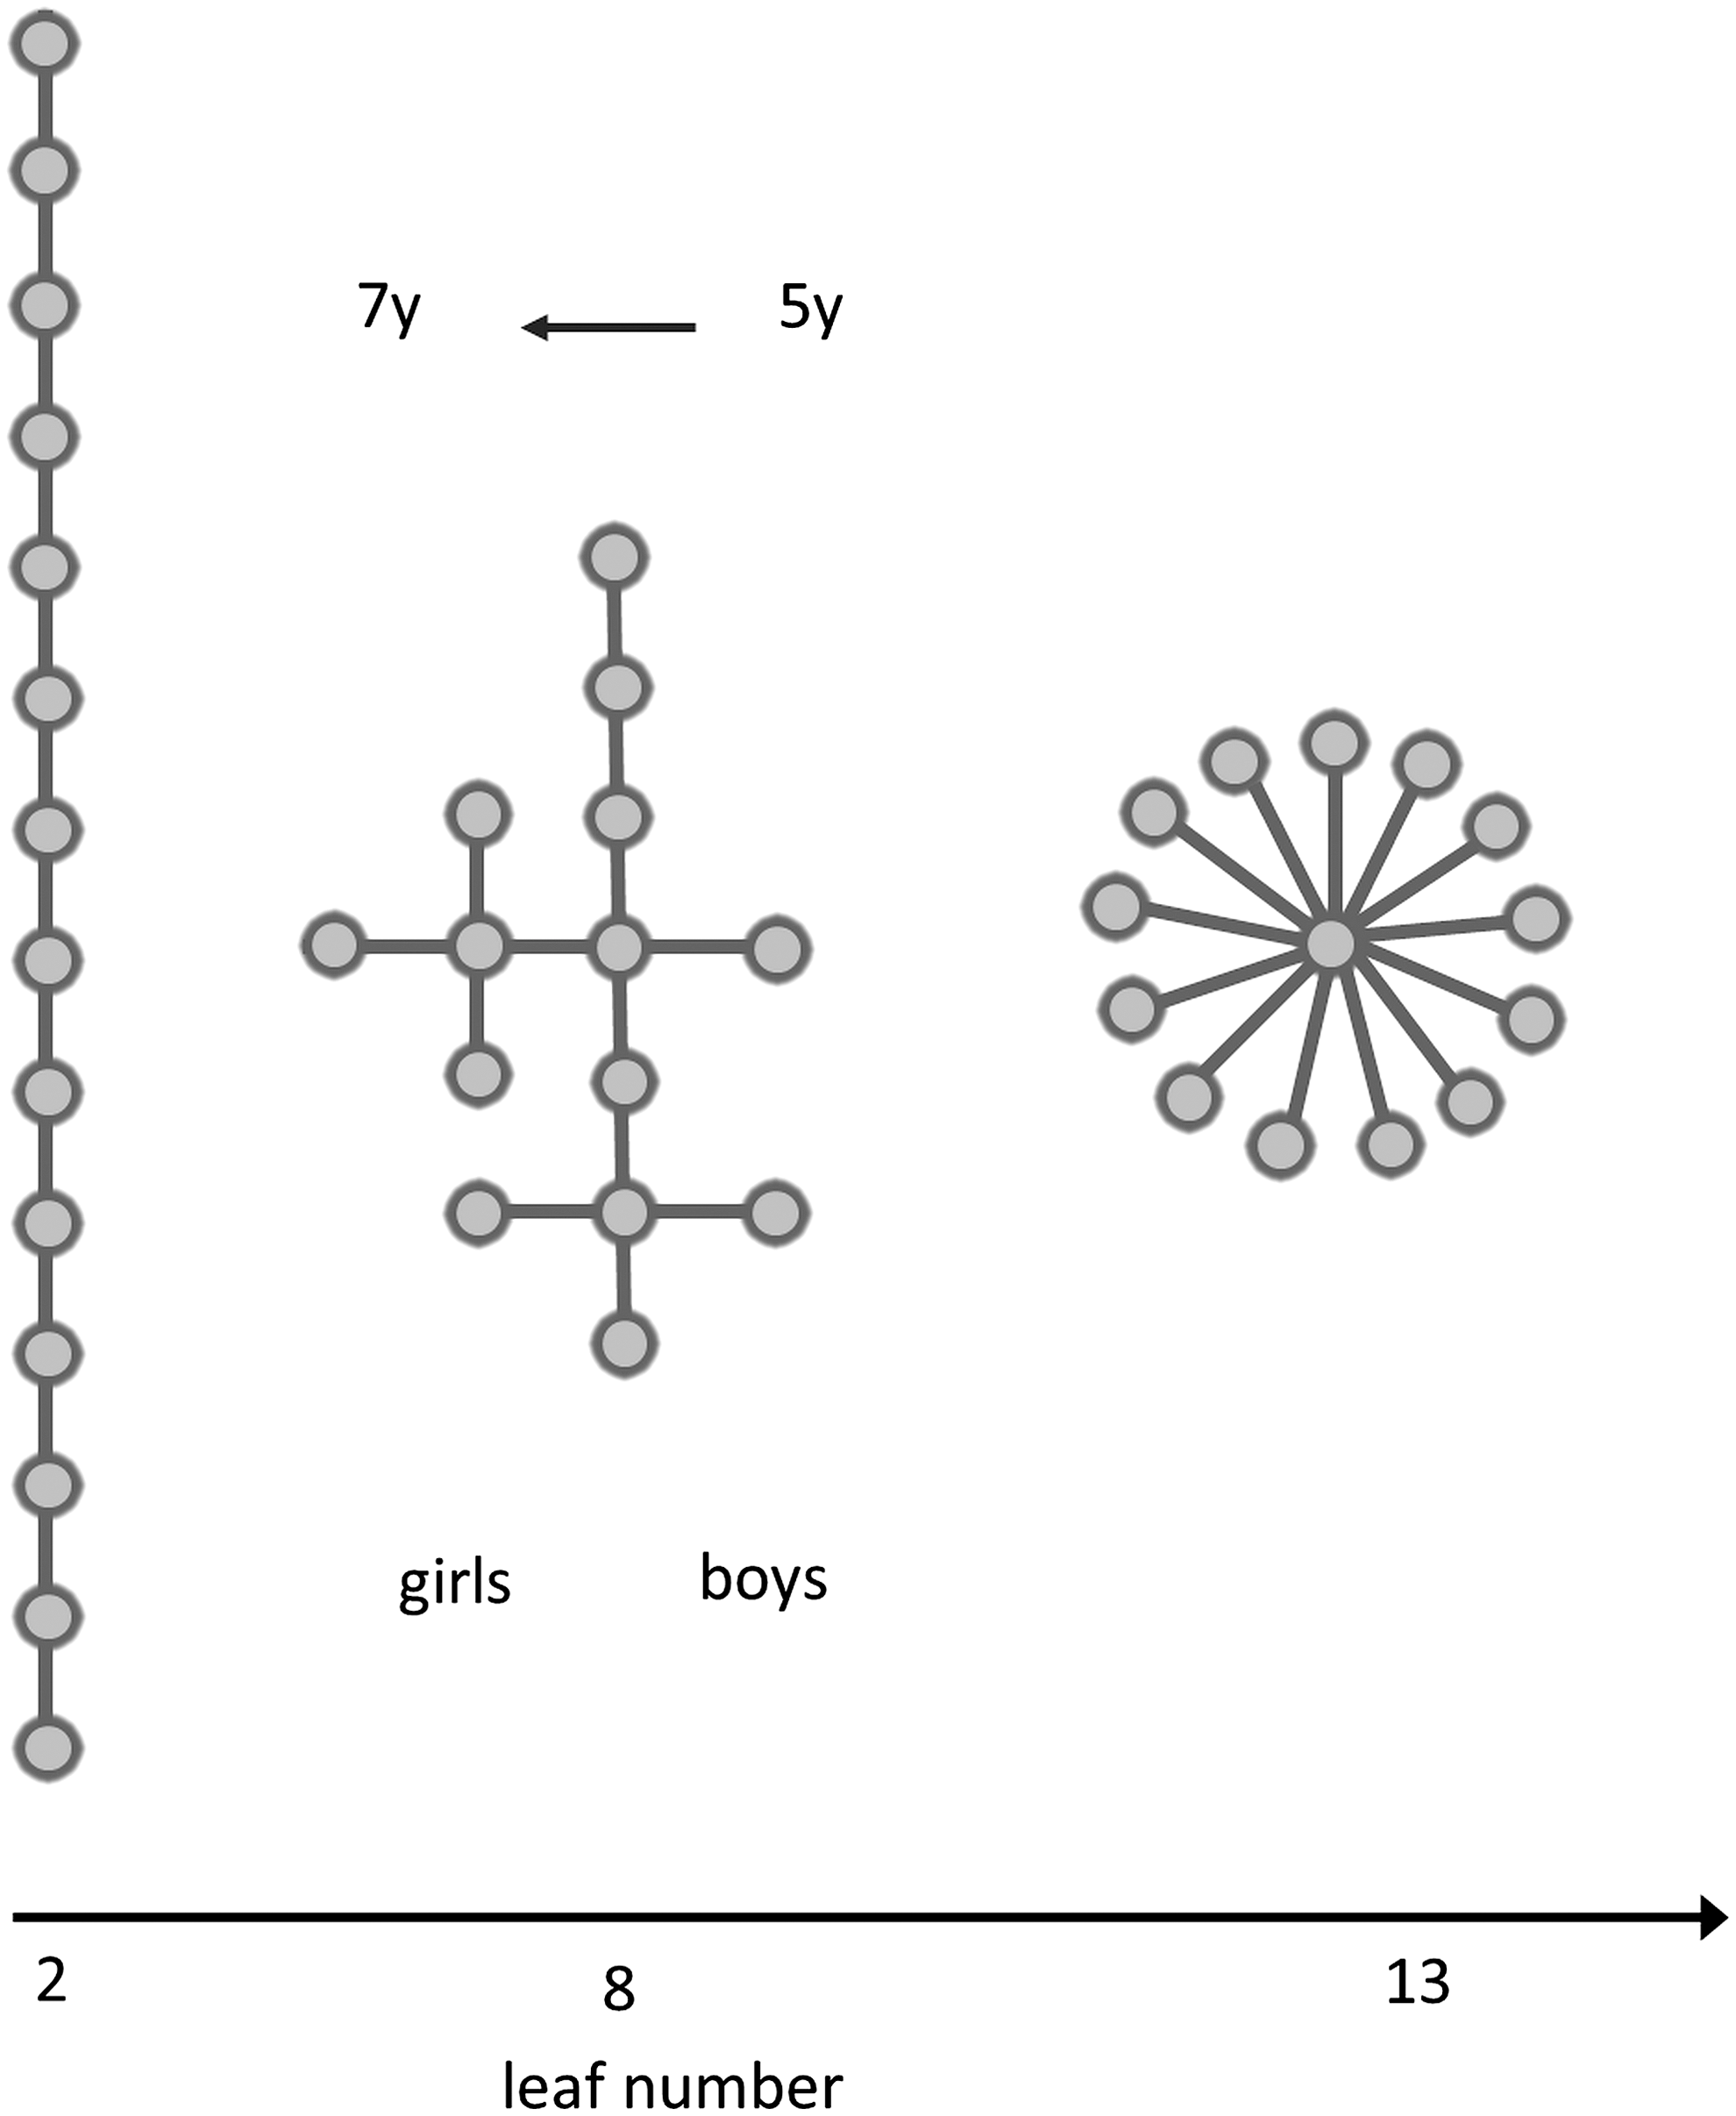
Examples of trees for increasing leaf number. Circles indicate vertices, lines edges. All trees have 14 vertices and 13 edges. On the left, the simplest possible tree with leaf number=2 is shown. On the right, a star-like tree with the highest possible leaf number (leaf number=number of edges) is shown, and in the middle, an example of a tree configuration with eight leaf nodes. Developmental change and differences between boys and girls are shown in text.
Since we examined 14 channel EEG data, we chose test-trees with n=14 and m=13. For each leaf number ranging from 2 to 13, different configurations were generated 10 times and for every tree, tree properties were calculated. Trees with intermediate leaf numbers were generated by starting with the line-like tree on the left, deleting one leaf node and its edge, and randomly attaching this edge to one of the remaining vertices, excluding the leaf nodes. The resulting tree parameters were averaged over these 10 possible trees for all leaf numbers. For leaf numbers close to 2 and 13 this leads to redundancies, since only one or few or a restricted number of configurations were possible.
Figure 3 shows the properties of trees as a function of increasing leaf number. With increasing leaf number, degreemax, betweennesmax, and hierarchy increase, while eccentricity and diameter decrease. For measures BC and degree, the maximum was taken and averaged for 10 trees, while for all other measures, the average per tree was used and averaged for 10 trees.
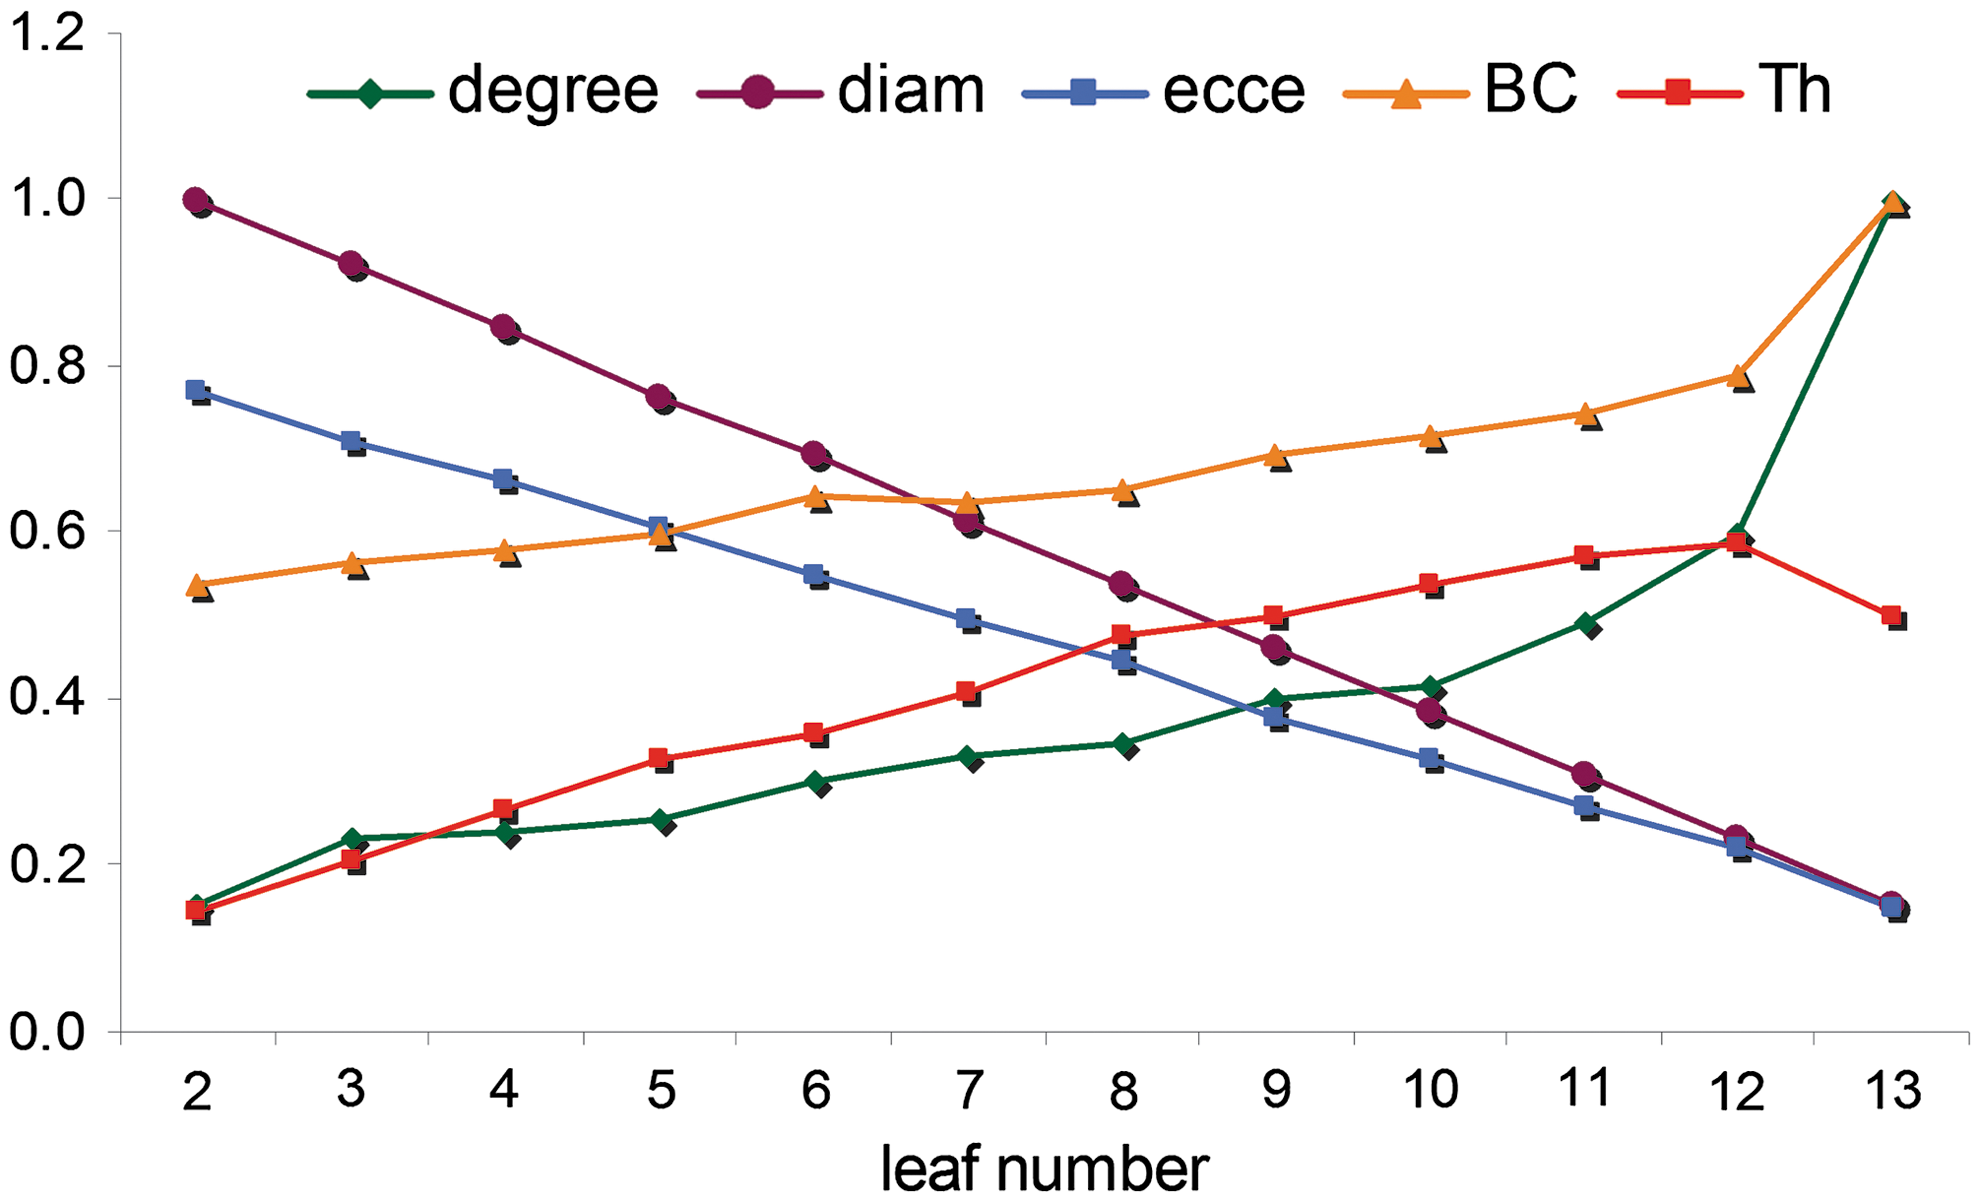
Properties of trees as a function of increasing leaf number. The number of edges is 13, the number of vertices 14. Random trees for leaf number between 2 and 13 are generated according to the procedure described in Fig. 2. Results are the average of 10 different networks for all leaf numbers between 2 and 13. Eccentricity is the mean eccentricity of all 14 vertices. BC and degree are the highest BC and degree of all 14 vertices. Hierarchy is the tree hierarchy computed with formula [1].
Statistics
Statistical analysis was done with SPSS version 15 for MS-Windows. Natural log transformation [y=ln(x)] was applied on SL and MST measures to obtain normal distributions of these measures. Note that for statistical testing, SL and MST measures were calculated per epoch and consecutively averaged per person. To test for age and gender effects on SL, an MST measures in three different frequency bands, a repeated measures analysis of variance was performed on log-transformed data with age as within the subject factor and gender as between the subject factor.
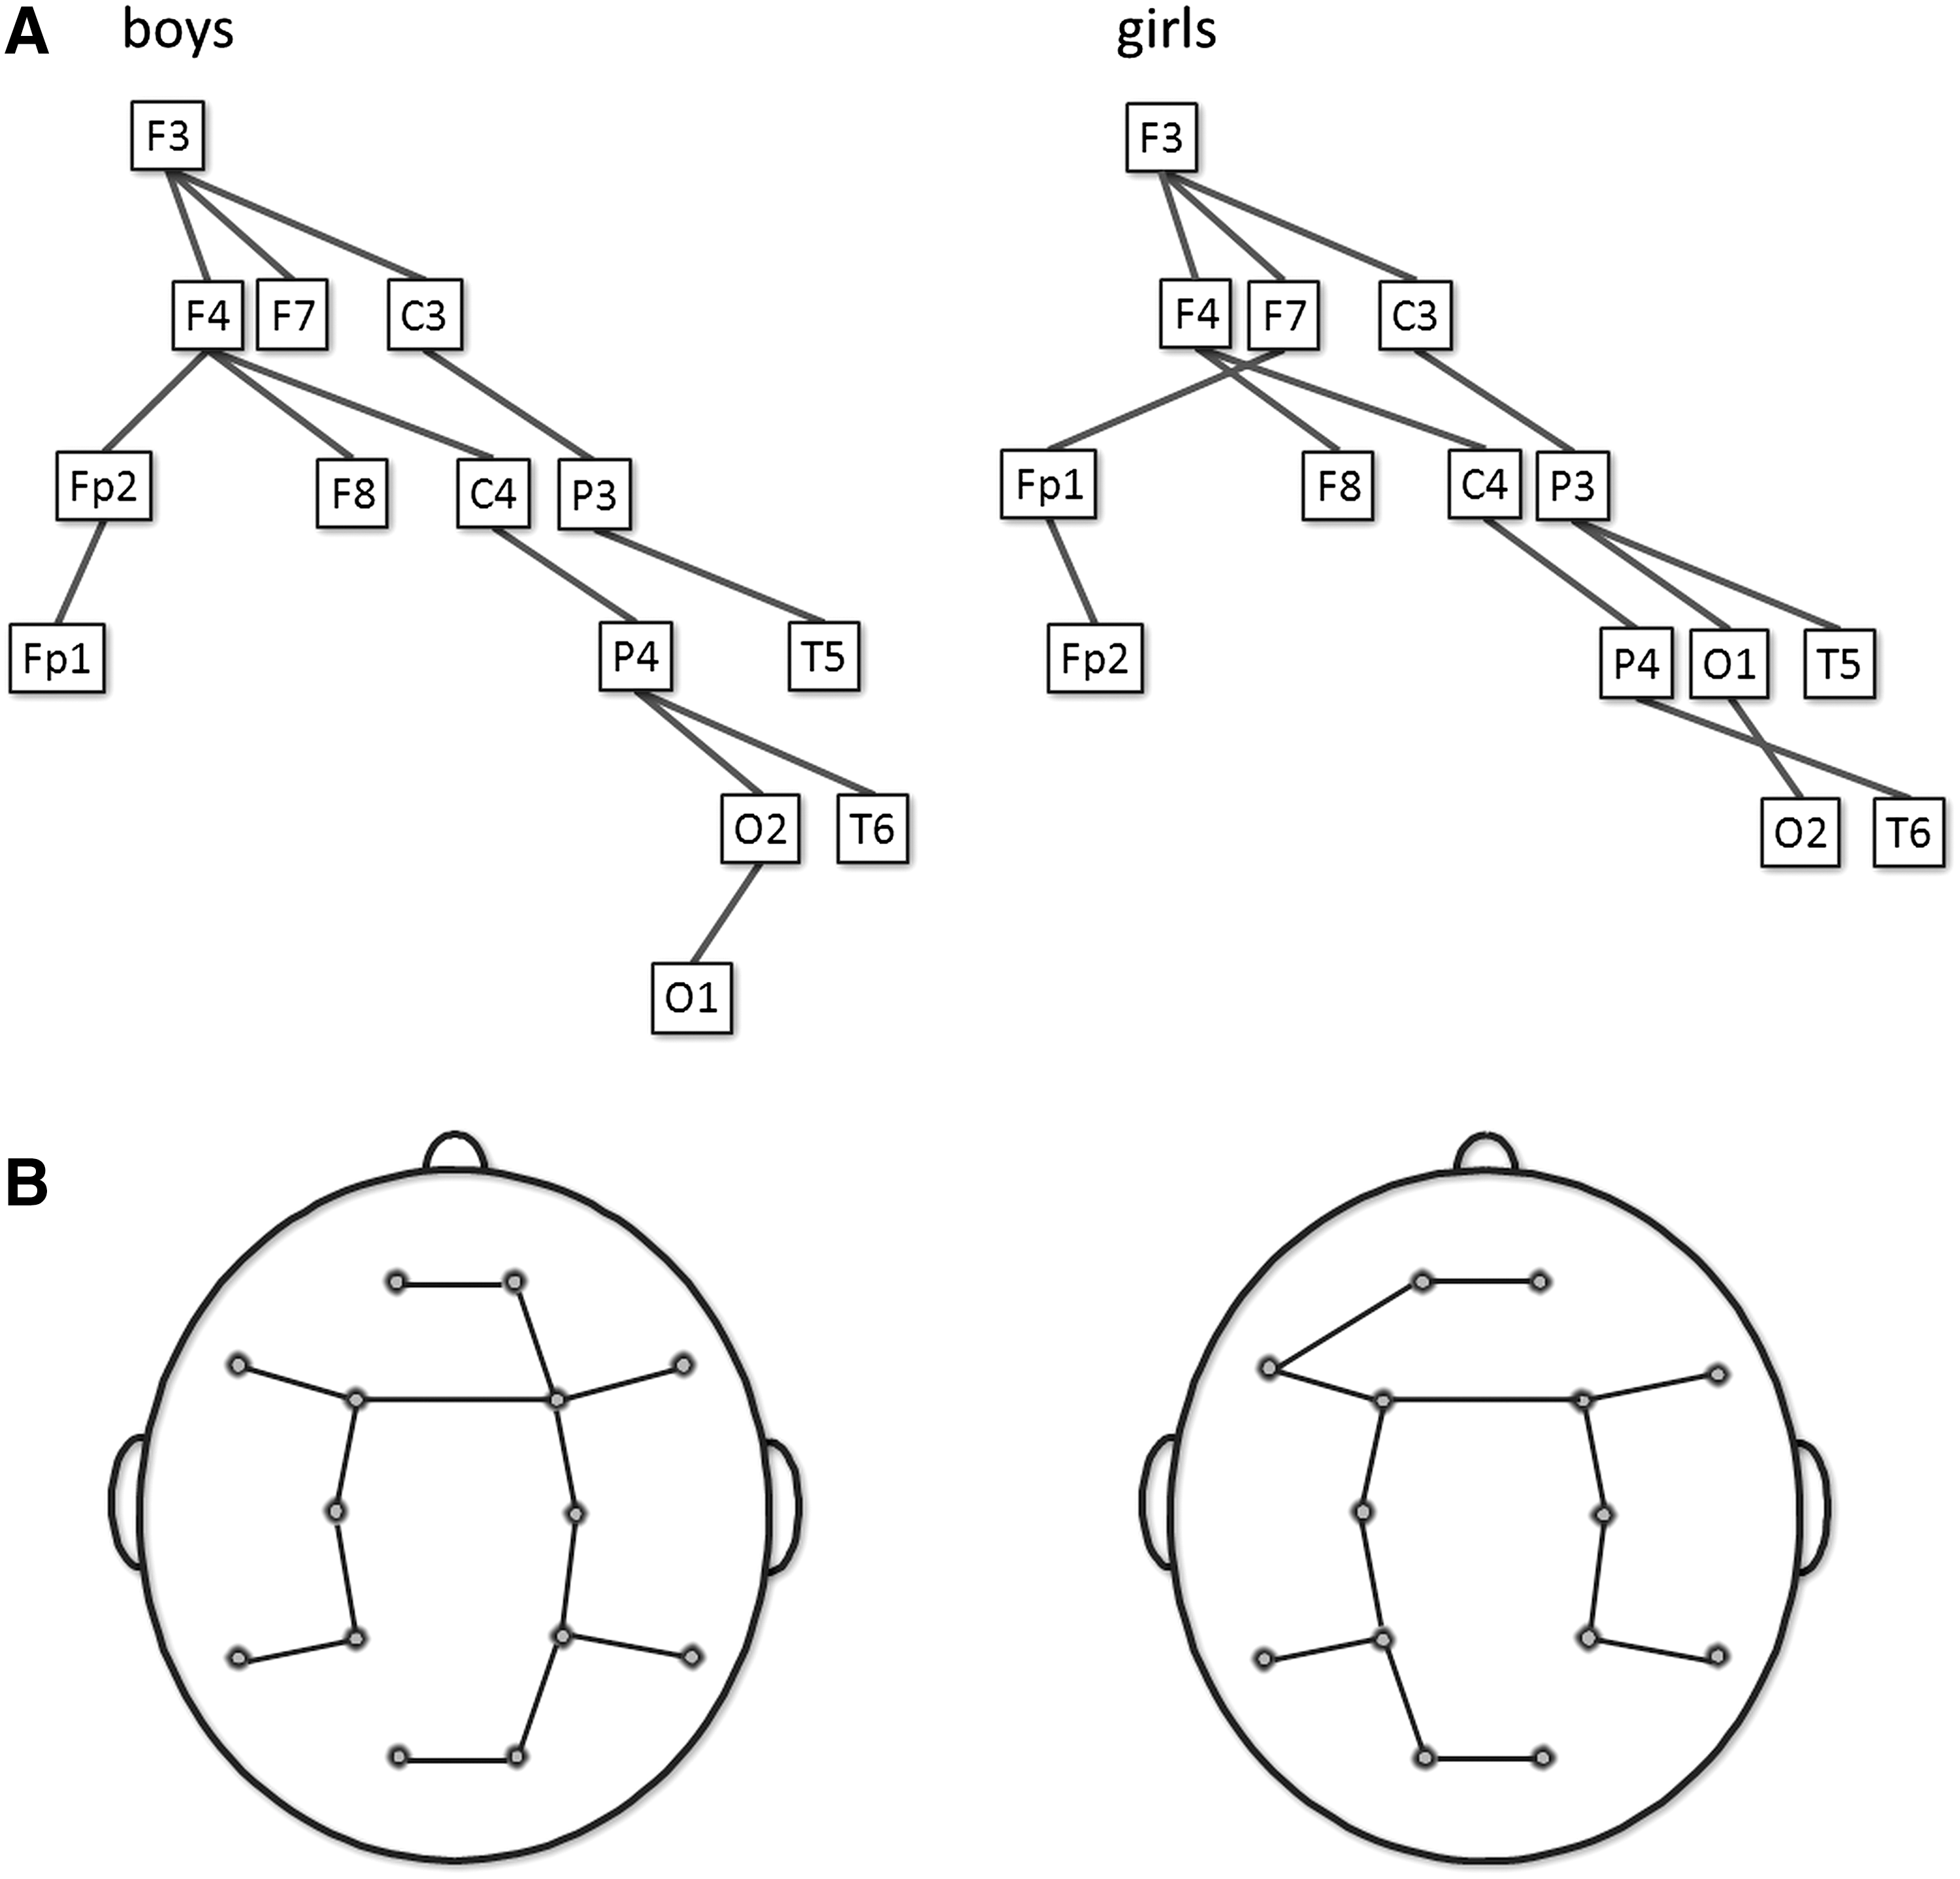
To illustrate MST topologies, a group averaged connectivity matrix was constructed at 5 and 7 years in the alpha band, and for boys and girls in the theta band. The MSTs of these mean matrices were visualized in Figure 4 and 5.
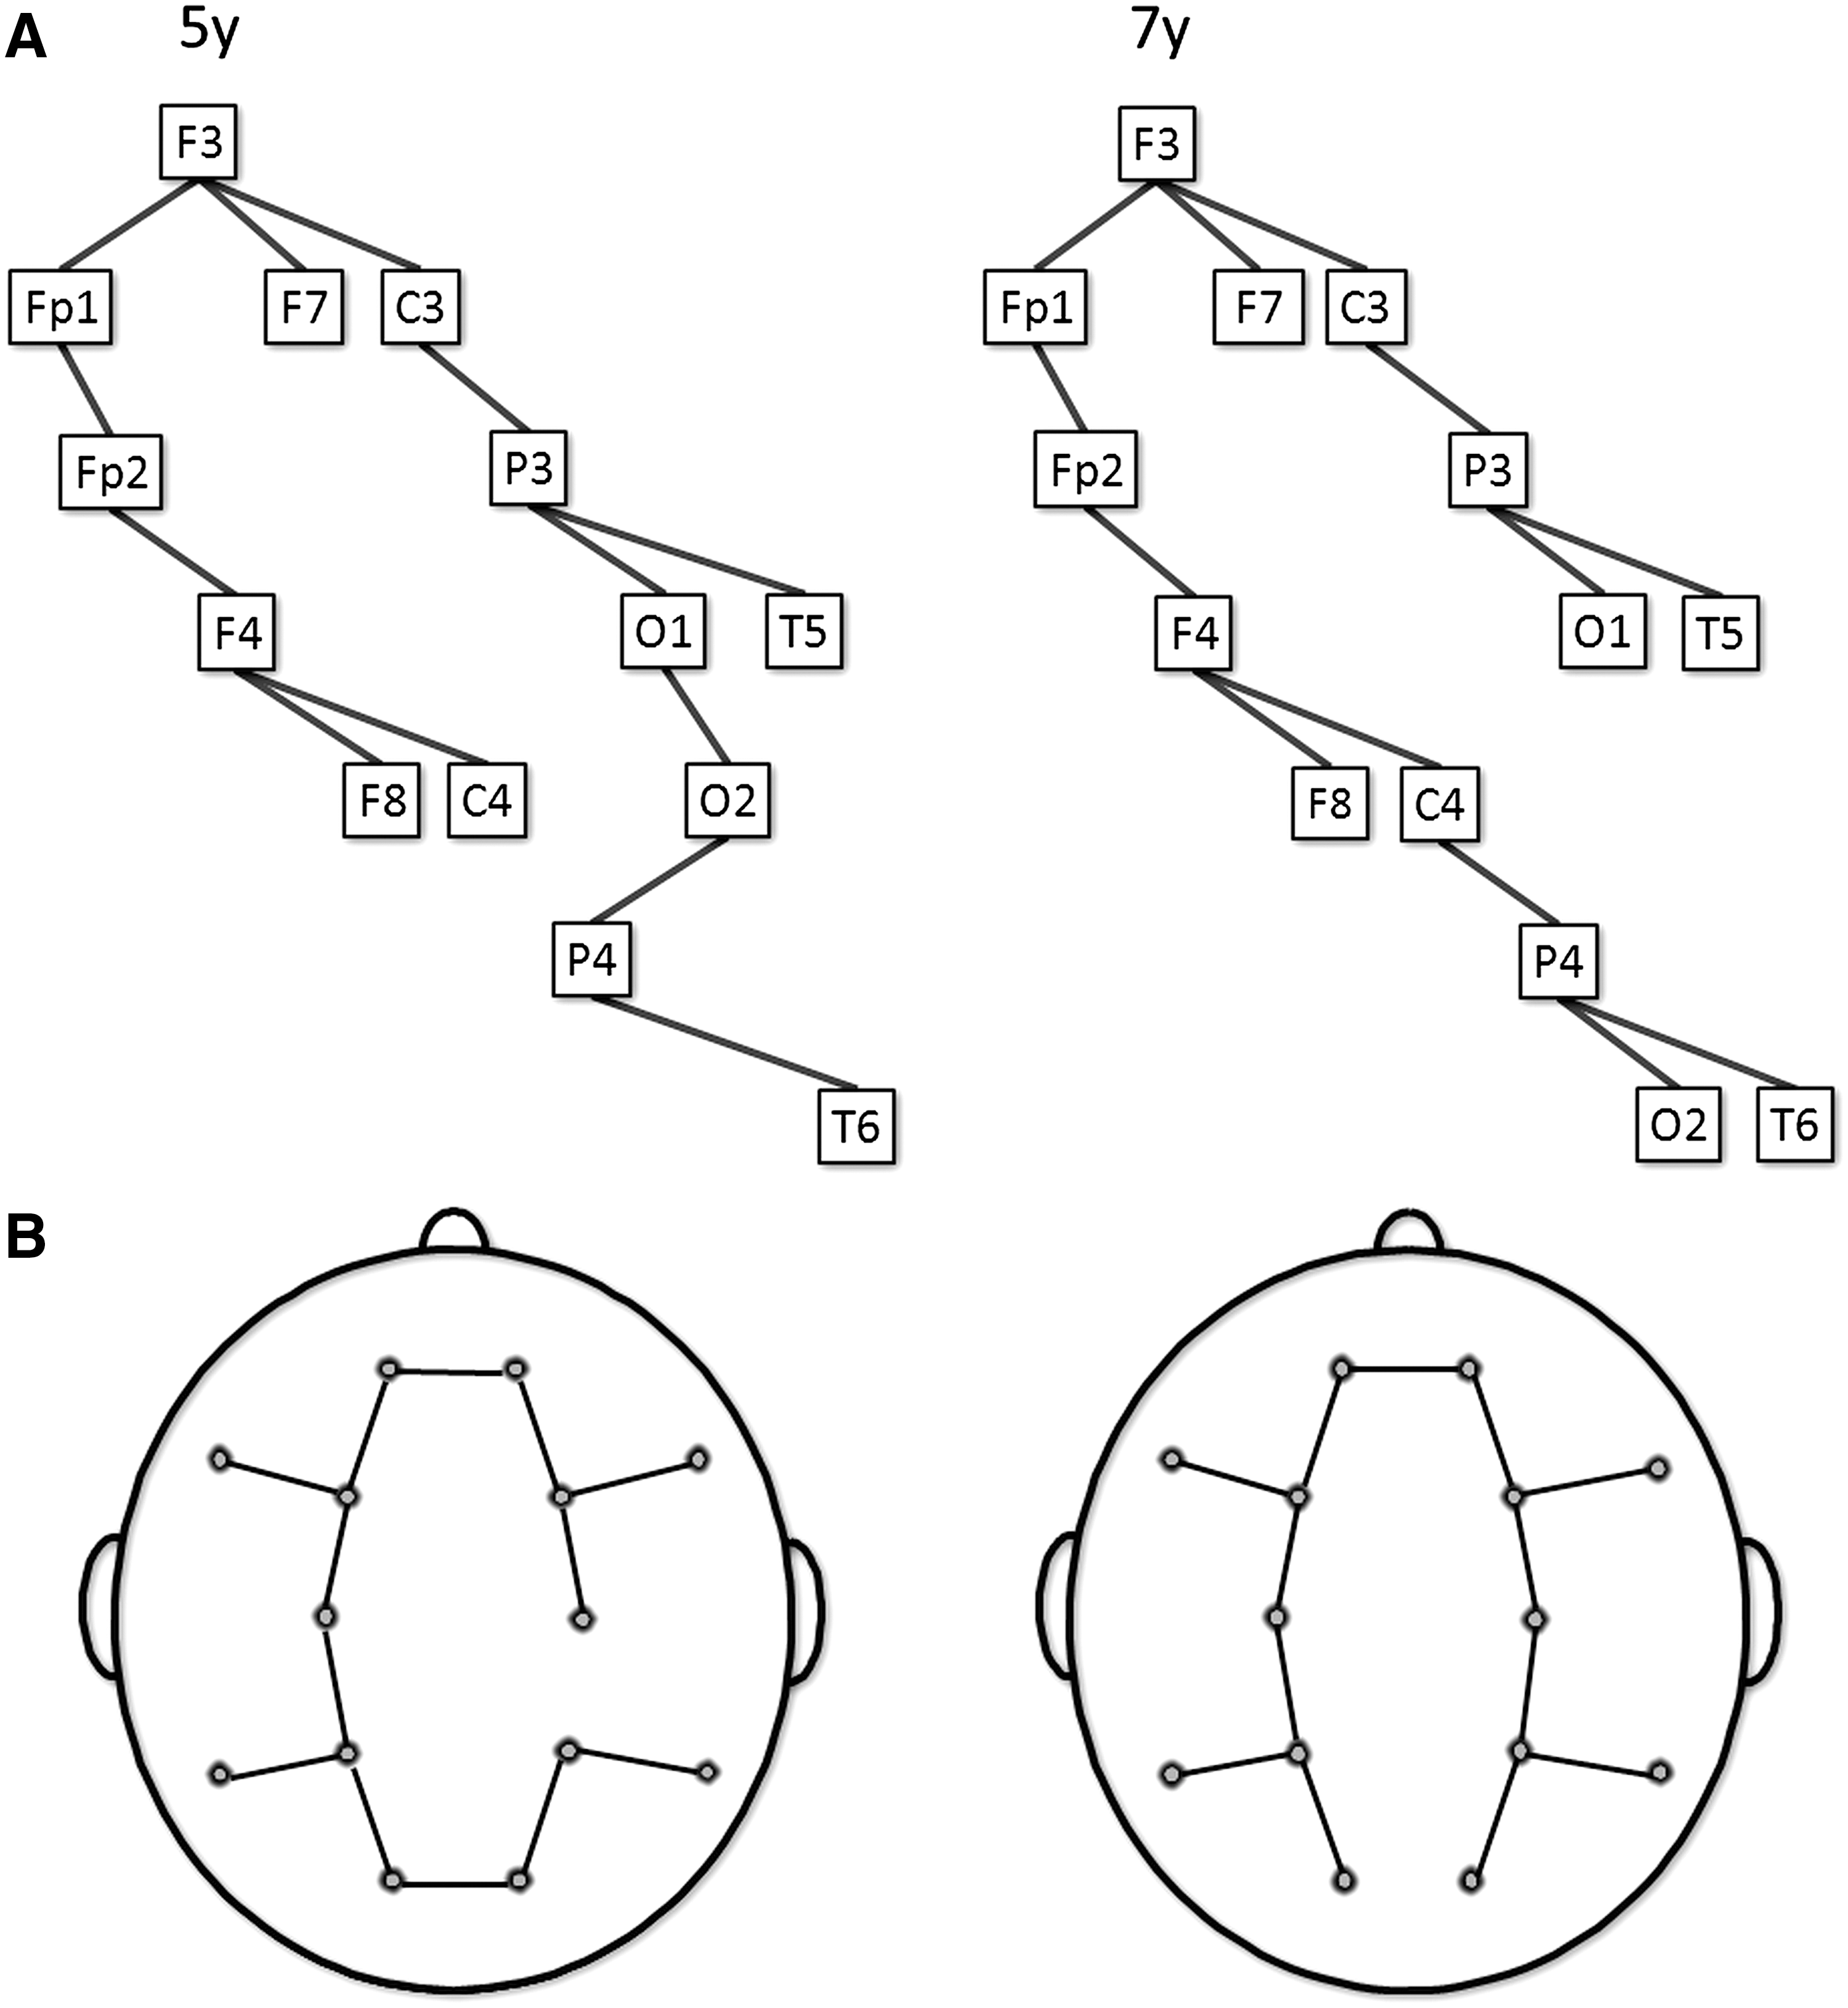
This figure shows the MSTs represented as a tree
This figure shows the MSTs represented as a tree
To point out the critical nodes in the MST, we ranked the nodes from highest BCmax to lowest BCmax, and for highest degreemax to lowest degreemax. Per node, we then calculated the percentage of children in which this node had the highest rank, based on BCmax and degreemax.
Results
As previously reported (Boersma et al., 2011), for all frequency bands, mean SL significantly decreased from 5 to 7 years (Table 1). Girls showed significantly higher SL than boys in all frequency bands.
Normalized MST parameters were analyzed for separated frequency bands. Mean and standard deviations are shown per MST parameter.
F-values and significance are shown for within- and between-subject factors. Bold text represents significant results; italic text represents results at trend level; ↑ indicates an increase over time; ↓ indicates a decrease over time; < indicates boys smaller than girls; > indicates boys larger than girls.
ANOVA, analysis of variance; MST, minimum spanning tree; SL, synchronization likelihood; BC, betweenness centrality.
The effect of time was mainly found in the alpha band. In this band, significant increases in diameter and eccentricity with age were found, while leaf number, degree, and hierarchy significantly decreased and BC and degree correlation were comparable at 5 and 7 years (Table 1). No significant changes over time were found in MST parameters in theta and beta bands. If we project the average MST values of the child EEG data upon the test networks (Fig. 3), the children seem to have intermediate configurations, that is, line-like trees with a few branches (on average 4 or 5 leafs), except for the maximum BC values, which suggest star-like trees with 10 or 11 leafs.
We found an effect of gender in the theta band. Boys showed a significantly higher degreemax, leaf number, BC and hierarchy, and a significantly lower diameter, eccentricity, and degree correlation than girls, suggesting that girls have more line-like MSTs. In the alpha and beta band, no effect of gender was found.
Furthermore, no significant interaction effect between time and gender in any of the frequency bands was found.
No significant difference in IQ was found between boys and girls, neither did we find significant correlations between IQ and network parameters.
Figure 4 illustrates averaged SL matrices at 5 and 7 years in the alpha band along with the associated trees. Note that the illustrated MST graph is constructed from averaged matrices at 5 and 7 years and does not reflect the results from our statistical tests for longitudinal changes. The topology is surprisingly consistent at 5 and 7 years. A few edges shift from local interhemispheric posterior connectivity toward connectivity along the anterior–posterior axis. Figure 5 shows averaged SL matrices in the theta band for boys and girls. Girls have the strongest connections in the left hemisphere and boys in the right hemisphere.
To explore the MST and find the critical nodes in the network, we first ranked the nodes from highest BC to lowest BC, and highest degree to lowest degree. Then, per node, the percentage of children in which this node had the highest rank based on BC and degree was calculated. At both 5 and 7 years, the nodes with the highest information load based on degree and BC, appear to be F3 and F4 and to a lesser extent P3 and P4 in the alpha band (Fig. 6A). In the theta band, P3 and P4, and to a lesser extent F3 and F4, appear to be the critical nodes in both boys and girls (Fig. 6B).
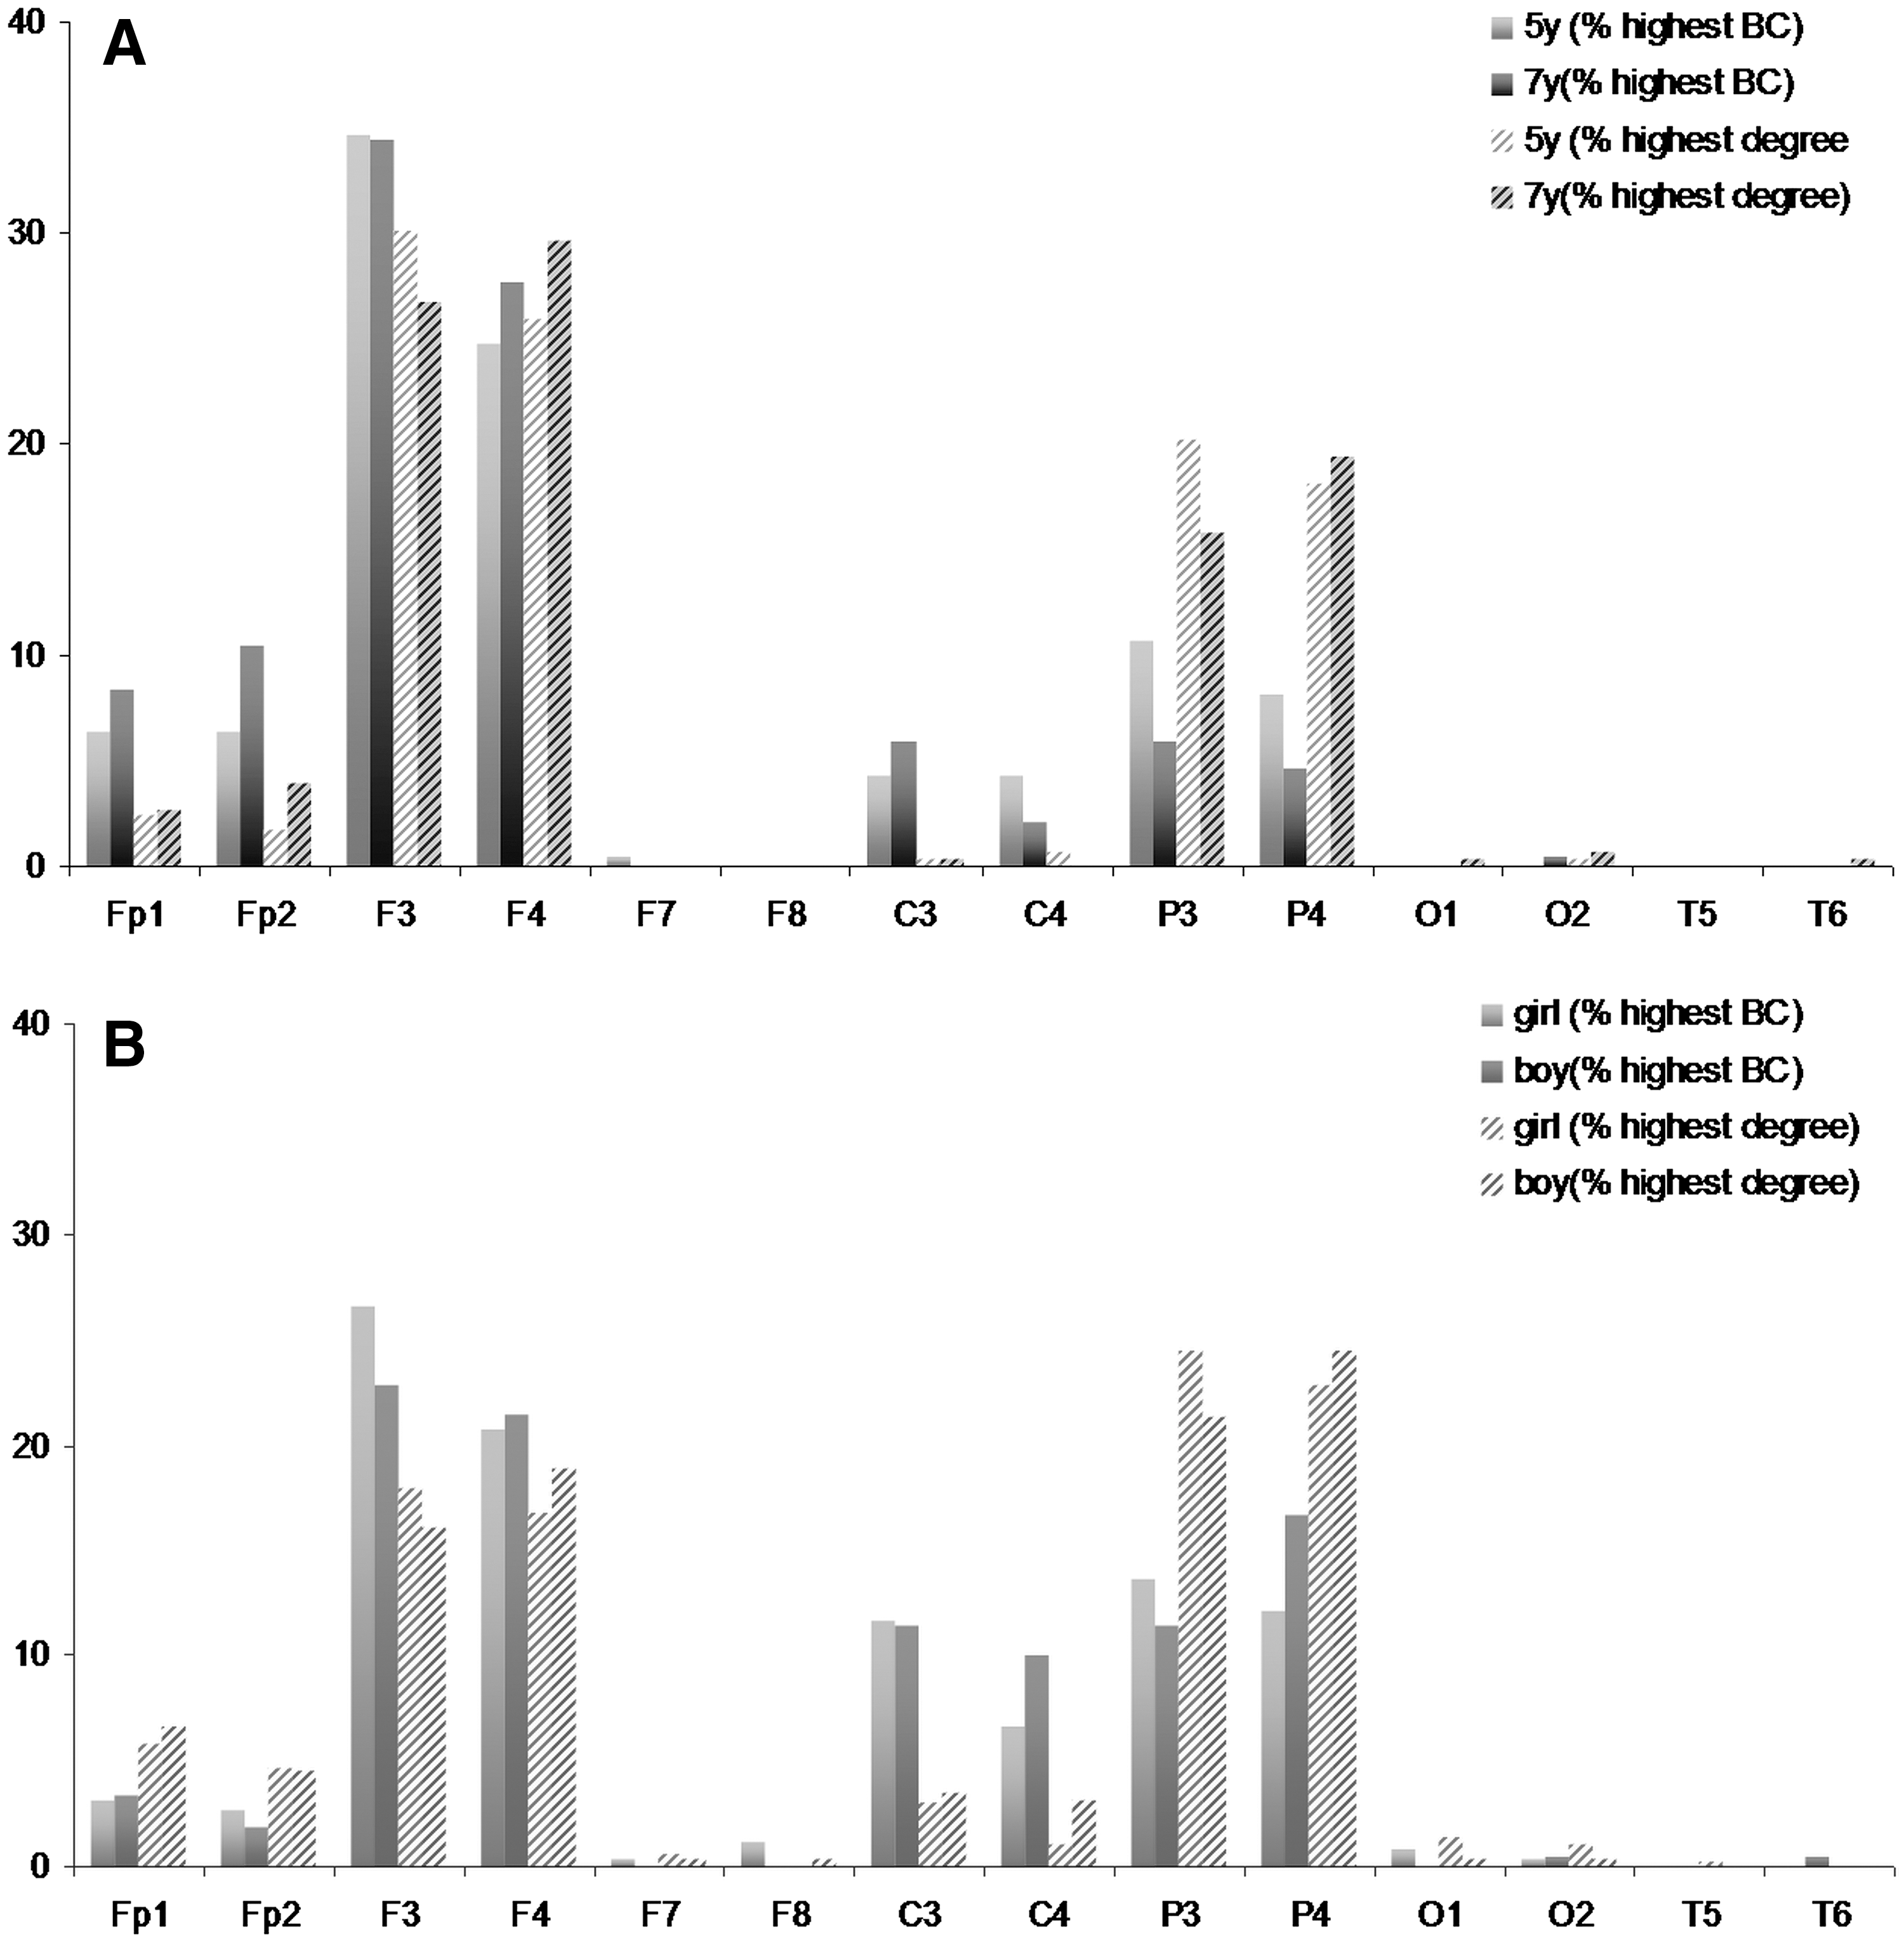
This figure shows the percentage of subjects in which a particular node had the highest BC and the highest degree of all 14 nodes,
Discussion
To test our hypothesis of increased regularity of brain networks with development, while correcting for network comparison bias, we applied the MST method to EEG-based functional brain networks. We showed that the organization of MSTs in children shifts toward a more line-like or decentralized organization (Fig. 2) with development from 5 to 7 years. Development significantly reduced the number of leaves, the maximum degree and the hierarchy of the trees, and increased the eccentricity and diameter. The maximum BC and degree correlation did not significantly change over time.
In our previous studies, we reported that functional brain networks in children shift from a more random toward a more ordered configuration with maturation, based on the findings that normalized clustering and path length increased over time in the alpha band (Boersma et al., 2011; Smit et al., 2012). The present study confirms that there is a consistent pattern of change in brain network topology in developing children in the alpha band. The MSTs at 7 years have a significantly lower leaf number, and thus, a longer diameter and increased eccentricity than at 5 years, which refers to the longer path length and the shift toward more ordered configurations we have described in our previous study (Boersma et al., 2011). The maximum BC did not change over time, which might indicate that the central or critical nodes remain at a central place in the tree over time. A constant BC and a decreased leaf number over time resulted in a decrease in the hierarchy of the trees over time.
The generally assumed pattern of typical development of structural and functional connectivity is the strengthening of distant and weakening of local connections (Barry et al., 2004; Gong et al., 2009; Thatcher, 1992; Thatcher et al., 2008). Thatcher and colleagues suggested that typical development is programmed in cycles with periods of decreases and increases in connectivity strength with different offsets in different regions (Thatcher et al., 2009; Thatcher, 1992). We speculate that the shift from star-like (centralized) toward line-like (de-centralized) in the present study reflects the weakening of both long-range and local posterior connectivity that is previously described in this dataset by Van Baal and colleagues (2001). These decreases in short- and long-range connections might have changed the order in which links are captured by the MST graph at 5 and 7 years. Additional tests show that the diameter of the MST is positively correlated with both clustering and path length, which were calculated in our previous study (see Supplementary Material; Supplementary Data are available online at
Another interesting finding of this study is the significant difference between boys and girls in the theta band. Girls showed a significantly lower leaf number, maximum nodal degree, BC and hierarchy, and a significantly longer diameter, eccentricity, and degree correlation than boys, indicating that girls are ahead of boys having more line-like decentralized trees than boys do. Since recent neuroimaging studies have shown a significant relation between network topological characteristics and intellectual performance (Li et al., 2009; Van den Heuvel et al., 2009), we tested if such associations could explain topological differences between boys and girls in the present study. No significant difference in IQ was found between boys and girls; neither did we find significant correlations between IQ and network parameters, suggesting that gender truly has an independent effect on network organization. In our previous study, we observed gender differences in connectivity strength and network parameters, with girls showing stronger connectivity and higher clustering and boys in several frequency bands (Boersma et al., 2011), suggesting that girls have stronger whole-brain connectivity and more ordered network topology than boys at this young age. Other EEG and magnetoencephalography (MEG) studies mainly investigated regional or interhemispheric connectivity with a restricted number of brain regions, showing different effects of gender on (local) functional connectivity in several frequency bands (Barry et al., 2004; Gootjes et al., 2006; Thatcher, 1992). The underlying biological mechanisms responsible for different brain connectivity patterns in girls and boys, is not well understood yet. On the one hand, girls as young as 5 years old might simply precede boys on the developmental trajectory. On the other hand, girls might wire up differently already very early in life due to different genetic and hormonal programming. The influence of sex steroids on magnetic resonance (MR)-based brain connectivity was reviewed by Peper and colleagues, suggesting a neuroprotective role of ovarian hormones that enhance cortico–cortico and subcortico–cortico connections in girls, whereas boys show increased connectivity between subcortical regions (Peper et al., 2011; Peper and Koolschijn, 2012). Moreover, gender differences in brain network topology were as well shown in clinical studies examining patients with multiple sclerose (Schoonheim et al., 2011) and migraine patients (Liu et al., 2011). In conclusion, gender seems to be an important factor influencing graph theoretical network measures and might impact the results of developmental and clinical studies.
In this study, we also explored and illustrated the MST topologies. In a real-world network like the developing child brain, we expected an intermediate topology that optimizes communication without overloading central nodes. Based on the mean MST parameter values found in the EEG-based networks in all frequency bands (Table 1), the trees show an intermediate configuration with four or five leafs (Fig. 3). We furthermore illustrated MST graphs of averaged connectivity matrices at 5 and 7 years in the alpha band (Fig. 4) and for boys and girls in the theta band (Fig. 5). Note that these are MST graphs based on the averaged matrices at 5 and 7 years for boys and girls, and do not represent the statistically significant longitudinal changes or effects of gender. Most edges seem to be constant within the topology at 5 and 7 years. A few edges shift from local posterior connectivity toward connectivity along the anterior–posterior axis. This reorganization probably reflects the weakening of long-range and local posterior connectivity that is previously found by Van Baal and associates in this dataset (van Baal et al., 2001).
In girls, the most important routes for information flow showed up in the left hemisphere and for boys in the right hemisphere (Fig. 5). Our findings agree with previous findings reporting greater right-sided lateralization of local connectivity in males and a left-sided lateralization of long-range connections in women (Gootjes et al., 2006; Tomasi and Volkow, 2011). Furthermore, an EEG study described that cortical networks develop earlier in the right hemisphere than in the left hemisphere and that this asymmetry in connectivity declines with aging (Gootjes et al., 2006; Zhu et al., 2011).
The high maximum BC of the child brain trees indicates a star-like centralized tree with 10 or 11 leafs and a configuration in which most information is routed via a central node with the highest betweenness. For both factors, for age or gender, the brain region underlying electrode F3, F4 and P3, P4 had on average the highest BC and degree, which might indicate that these are critical nodes through which most information is routed. Some studies regard alpha band EEG resting-state networks as the equivalent of fMRI DMN (Chen et al., 2008; Knyazev et al., 2011) and the frontal–parietal attention networks (Sadaghiani et al., 2012) involved in top–down modulation and regulation of attention. In this context, a developmental change in the alpha band MST might represent unfolding of the DMN and resting-state networks involved in a higher order cognitive function (Bie de et al., 2012; Fair et al., 2007; Supekar et al., 2010; Uddin et al., 2011).Interestingly, in our study, centrality of these nodes remained unchanged over time, which agrees with recent MR studies. Hagmann and colleagues demonstrated that in a structural network, the critical nodes (frontal and parietal areas among others) are in place by the age of 2 years (Hagmann et al., 2010). Additionally, they found that connectivity strength further increased between these hub nodes during development, which was confirmed by resting-state fMRI studies, suggesting a developmental shift from diffuse connectivity toward increased brain-wide integration and decreased local connectivity (Hwang et al., 2012; Uddin et al., 2010). These findings might point to a crucial role for hub nodes early in typical and atypical development, especially in neurodevelopmental disorders in which frontal (and parietal) areas are hypothesized to be affected, such as for instance in autism (Courchesne and Pierce, 2005; Just et al., 2012) and attention deficit/hyperactivity disorder (Tomasi and Volkow, 2012). Future studies might further investigate the role of these frontal and parietal areas and their relation to cognition.
This study has few limitations. Since it has been shown that graph measures are under genetic control (Smit et al., 2008), our results might have been partially influenced by this genetic dependence introduced by inclusion of complete twin pairs in our dataset. Additional tests on an independent dataset showed similar, though slightly less significant results (see supplementary information, Supplementary Table S2), indicating that child brains do develop toward more decentralized line-like configurations and that girls show more decentralized line-like configurations than boys did. Among others, the MST method is one of few that presents a theoretical underpinned approach to solve network comparison problems. However, the MST method has few limitations. In this method, not all connections are taken into account to prevent clustering, thereby obtaining a fixed network size and density to fixed density to enable network comparison (Joudaki et al., 2012; Van Wijk et al., 2010). As a consequence, the MST might have underestimated other interesting effects, such as the importance of low-weight connections and clustering for information processing in brain networks. Moreover, the network size was limited by the number of 14 electrodes, which is rather a gross sampling of the brain reflecting only the main lines of information flow in the child brain. Future high-density EEG and MEG studies should aim to obtain interpretable degree and betweenness distributions to further specify which nodes and paths play a critical role in network performance (Wang et al., 2008). Despite these suboptimal conditions, this study shows significant changes in brain MST topology with age, suggesting that healthy development leads to subtle topological changes in the main routes of information flow in the brain.
Another limiting factor in connectivity studies is the choice of the connectivity measure. SL was used to enable the comparison between recent and previous studies. Choosing SL as connectivity measure might have biased the results, since SL is sensitive to volume conduction effects, especially the strongest SL connections are most sensitive. Since the number of EEG channels was small in this study and inter-electrode distances were large (>7 cm), the chance of picking up highly correlating signals from a common source might be reduced in our study (Nunez et al., 1997). Future studies might aim on measures as the phase lag index (PLI) or the directional PLI (Stam and van Straaten 2012a) that are less sensitive to volume conduction (Stam et al., 2007; Stam et al., 2009).
In conclusion, the MST offers an elegant solution for current threshold and normalization problems in graph theoretical EEG, MEG, and magnetic resonance imaging studies. It provides a method to construct a unique structure that reflects the most important routes for information flow on the network. Without setting a threshold in advance, it facilitates the direct comparison of graph measures in different conditions. In addition, our study demonstrates that the MST method is sensitive to capture subtle developmental changes and differences between boys and girls and supports our previous findings. A topological change from more star-like centralization toward more line-like decentralization was found with development and girls showed more mature configurations than boys of the same age. We speculate that the change in brain network topology reflects maturational processes. Application of the MST method in future studies, might further facilitate capturing the complete space of complex brain networks in a simplified heuristic model, as recently proposed by Stam and Van Straaten (2012b).
Footnotes
Acknowledgments
This project was financially supported by the KNF-VU fonds, Amsterdam, The Netherlands, and by an educational grant from Pfizer, The Netherlands (Contract grant number: OZ06045001 SGA), and the Netherlands Organization for Scientific Research (NWO) (Contract grant numbers: 560-265-052, 575-25-006, 480-04-004), NWO VENI-451-08-026.
Author Disclosure Statement
No competing financial interests exist.
References
Supplementary Material
Please find the following supplemental material available below.
For Open Access articles published under a Creative Commons License, all supplemental material carries the same license as the article it is associated with.
For non-Open Access articles published, all supplemental material carries a non-exclusive license, and permission requests for re-use of supplemental material or any part of supplemental material shall be sent directly to the copyright owner as specified in the copyright notice associated with the article.
