
Abstract
Multiple sclerosis (MS) is a chronic inflammatory central nervous system disorder with a neurodegenerative component. While in the past, MS has been predominantly viewed as a white matter (WM) disease, gray matter (GM) pathology receives increasing attention in MS research. In this study, we tested hypothesis-free for a possible spatial relationship between cortical volume changes and disturbed integrity of projecting WM tracts. We used voxel-based morphometry (VBM), lesion probability maps (LPM), and probabilistic tractography to compare brain magnetic resonance imaging (MRI) scans obtained at 3 Tesla of 15 low disabled MS patients with 15 matched healthy controls (HCs). Areas of decreased cortical volume in the patients identified by VBM were used as seeds for tractography. Volume in two cortical areas in the left inferior frontal gyrus (IFG) and the left lateral occipital cortex (LOC) was reduced in patients compared to HCs. Starting from the IFG-region, tractography suggested impaired connections between left and right portions of the frontal lobe in the patients. Using the LOC as a seed, in patients, the left inferior longitudinal and fronto-occipital pathways appeared disintegrated compared to HCs. Swapping the seeds to homologous contralateral areas showed similar results for frontal, but different results for occipital brain areas. This at least partly could be explained by differential interference with WM lesions. These findings suggest a regional dependence between cortical GM and WM tract alterations in MS patients. While confirmation in larger and more heterogenic samples is needed, this study indicates that combining several MRI methods (VBM, LPM, and Probabilistic Tractography) may provide important insights into interacting processes related to the fiber tract and GM changes in MS.
Introduction
Multiple sclerosis (MS), a chronic inflammatory disease of the central nervous system (CNS) hallmarked by distinct structural changes of the brain, represents a major cause for neurological disability in young adults.
Magnetic resonance imaging (MRI) has greatly advanced the understanding of the disease (Fazekas et al., 1999) as it allows assessing MS-related tissue changes in many aspects, such as focal white matter (WM) lesions (Battaglini et al., 2009; Calabrese et al., 2012; Morgen et al., 2006), subtle changes of the normal appearing WM (Rovaris et al., 2005), and global brain volume loss (Pagani et al., 2005).
In the past, most MRI studies focused on WM pathology, yet the WM lesion load only partially correlates with clinical symptoms (Bobholz and Rao, 2003; Kincses et al., 2010). Beside this, other studies indicated that gray matter (GM) atrophy might more closely be associated with neurodegenerative processes, linked to persistent disability in MS (Calabrese et al., 2011a; Tedeschi et al., 2005). More recently, interest has thus shifted to GM pathology in MS, including cortical lesions, cortical atrophy, iron deposition in the basal ganglia, as well as subtle changes of cortical thickness (Calabrese et al., 2011b; Geurts and Barkhof, 2008; Khalil et al., 2009).
However, little is known so far regarding the relationship between cortical GM atrophy and associated WM tract changes. Preliminary findings investigating this issue are divergent, reporting low (Morgen et al., 2006), moderate (Sepulcre et al., 2009), or strong relationships (Bendfeldt et al., 2009). Morgen et al. (2006) used voxel-based morphometry (VBM) and did not find significant correlations between the GM volume loss and WM lesion load. Sepulcre and colleagues (2009) used VBM combined with lesion probability mapping (LPM), and noted a volume loss in the lateral geniculate nucleus that was related to the presence of WM lesions in the optic radiations. Bendfeldt and coworkers (2009) found WM lesion distribution in MS to be spatially related to GM volume reductions in the corpus callosum and optic radiations. Further evidence for the spatial relationship between low fractional anisotropy (FA) in WM tracts and GM abnormalities comes from Bodini and colleagues (2009). The authors found among others lower FA in bilateral corticospinal tracts, and a lower GM volume in sensory-motor cortices. Investigating the motor system in MS, Gorgoraptis and colleagues (2010) used a cortical segmentation tool and probabilistic tractography to study the relation of brain abnormalities. They reported that a lower connectivity in corticospinal tracts was related to increased paracentral cortical volumes (Gorgoraptis et al., 2010). Longitudinally, it has been found that regional GM atrophy was associated with progression on the global WM lesion load (Bendfeldt et al., 2009). Raz and associates (2010a, 2010b) found that WM damage was visible in the early stage of disease, and GM damage occurs later, suggesting a neural loss due to axonal damage. Others also revealed that that GM damage is an important and frequent feature of MS pathology, which can reach considerable magnitudes predominantly in chronic phases of MS (Bø et al., 2003, 2006).
Histopathology suggests dying-back axonopathy and inflammatory processes to be associated with neurodegeneration in MS, indicating possible sources of an interdependence between GM atrophy and WM damage (Filippi et al., 2012; Geurts and Barkhof, 2008; Lucchinetti et al., 2011; Magliozzi et al., 2007). Of particular note in this context, newer analytical approaches yielded the observation that cortical thinning occurs in MS (Calabrese et al., 2012), but the relationship between focal neocortical changes and WM changes, including insights from probabilistic tractography has rarely been studied so far.
Together, this prompted us to employ a combined approach using probabilistic tractography (to study WM tract integrity), VBM (to detect neocortical volume changes), and LPM (to assess the location of WM lesions), to more closely investigate the spatial relationship between these processes in MS, and compare these to healthy subjects. We focused on mild disabled MS patients, where such effects should be purer and less confounded by competing and parallel pathophysiologic events than in more advanced stages of disease with severe handicaps. Specifically, we investigated hypothesis-free, if the decreased regional cortical GM volume might be associated with alterations in connected WM tracts, consistent with the notion of dying back of neurons or projection fibers, that is, wallerian degeneration.
Materials and Methods
Subjects
Patients
We studied 15 right-handed (Oldfield, 1971) low disabled MS patients (5 males, 10 females), selected from a large ongoing prospective study, with a mean age of 29.5±9.6 years, a mean disease duration of 7.3±6.5 years, and a median Expanded Disability Status Scale (EDSS) of 2 (range: 0–3.5). Their mean time of education was 13.8±2.9 years. Patients had to have clinically definite MS (Polman et al., 2005), a relapsing-remitting disease course (Lublin and Reingold, 1996), no history of optic neuritis, and only mild to moderate disability. Among the 14 treated patients, 8 received interferon-beta, 3 glatiramer-acetate, and 3 natalizumab. A single experienced clinician did all the neurological assessments.
Healthy controls
Fifteen healthy right-handed subjects were recruited from the general community via word of mouth, and served as the control group (5 males, 10 females, mean age: 30.4±11.2 years, mean time of education: 15±3 years).
The local ethics committee approved the study and each participant provided written informed consent.
MRI data acquisition and analysis
All participants underwent imaging at a 3 Tesla MRI scanner (Tim Trio, Siemens Healthcare, Erlangen, Germany) using a 12 channel head coil. To minimize the head movement, subjects' heads were stabilized with foam cushions. We obtained a T1-weighted 3D Magnetization Prepared Rapid Gradient Echo (MPRAGE) sequence (repetition time [TR]/echo time [TE]/inversion time [TI]=1900 msec/2.19 msec/900 msec) with a 1-mm isotropic resolution (number of slices: 176, no gap), a fluid attenuated inversion recovery (FLAIR) sequence (TR/TE/TI=10,000 msec/70 msec/2500 msec, in plane resolution=0.9×0.9 mm2, slice thickness=3 mm, number of slices: 44, no gap), and diffusion tensor images with a diffusion weighted single shot Spin Echo-Echo Planar Imaging sequence (TR/TE/FA=6000 msec/92 msec/90°, in plane resolution=1.95×1.95 mm2, slice thickness=3 mm, number of slices: 39, no gap), where the diffusion sensitizing gradients were applied in 12 directions (b=1000 sec/mm2) and a reference scan was performed without diffusion weighting (b≈0 sec/mm2).
Lesion segmentation and LPM
T2-hyperintense WM lesions were identified by an experienced observer on FLAIR-images and segmented by a trained operator in each MS patient using a semiautomated region growing software (DispImage) (Plummer, 1992). FLAIR-images were registered to the MNI152 standard space using affine linear registration (FMRIB's Linear Image Registration Tool, part of FMRIB Software Library [FSL]). Binary lesion masks were registered to a template in MNI152 standard space (with 2×2×2 mm3 resolution) by tri-linear interpolation. Lesion probability masks were generated by averaging the individual lesion masks and subsequently thresholded at 10%, where a WM lesion appears if the specific voxel is occupied by lesions in at least 10% of the patient population.
Voxel-based morphometry and subcortical segmentation
Cortical tissue was analyzed using VBM as provided by FSL (Ashburner and Friston, 2000; Good et al., 2001). Brain extraction was done with the Brain Extraction Tool from FSL (Smith, 2002). For tissue-type segmentation, we used FMRIB's Automated Segmentation Tool, an automated segmentation tool from FSL. The GM volume images were nonlinearly registered to the MNI152 standard space (Andersson et al., 2007) and subsequently a study-specific template was created. The registered partial GM images were modulated using the Jacobian of the warp field. Data were smoothed by an isotropic Gaussian kernel of sigma=3 mm. For the group analyses, we used Randomise v2.1 from FSL using a permutation-based nonparametric testing (number of permutations=5000), and Threshold-Free-Cluster-Enhancement (TFCE). Group comparisons were done by a two-sample t-test within familywise; error correction for multiple comparisons across space and differences were defined as significant by p<0.05. On the basis of T1-weighted MPRAGE scans, automated segmentation of deep GM volumes (nucleus accumbens, amygdala, hippocampus, caudate nucleus, globus pallidus, putamen, and thalamus) was done for all subjects using FIRST from FSL. Then, mean volumes (in mm3) were computed for the two groups and between-group comparisons were made by two-sample tests.
Probabilistic tractography
Diffusion weighted data from each subject were corrected for distortion and head movements by affine registration to the reference scan without diffusion weighting. Corrected data served as input for probabilistic tractography using a Bayesian approach for the estimation of diffusion parameters (Behrens et al., 2007).
Using ProbtrackX from FSL, we analyzed the pathways starting from defined seed masks (binary masks of focal GM differences between MS and healthy control [HC] based on VBM), using a consistent parameter set (number of samples: 5000, curvature threshold: 0.2). For group comparisons, we merged individual pathways separated for groups. Then, we computed the mean pathways separately for HCs and patients. The number of voxels was computed for each tract. Statistical comparisons were made by between-subject t-tests. For the spatial comparison, we used permutation-based nonparametric testing (number of permutations=5000) and TFCE. Before randomizing, maps from the fiber tractography were overlaid to create the study-specific templates. Then, the mean map was thresholded by a minimum of 10 streamlines per voxel. After this, mean templates were smoothed by an isotropic Gaussian kernel of sigma=2 mm. Group differences were significant at p≤0.05 (uncorrected).
Plausibility analysis
As additional analysis, we followed the above procedure for the contralateral hemisphere. Seed masks were swapped from left to right. Starting from these seeds, new pathways were processed as described above.
Fractional anisotropy
FA data were computed using tract-based spatial statistics (TBSS) from FSL (Smith et al., 2006). In the preprocessing stage, FA images were created after they were corrected for movement. Brain extraction was done with BET. Then, all individual FA images were nonlinearly registered to a common space with a registration tool from FSL. After this, a mean FA skeleton was created for the whole group (patients and controls). For the group statistics, TBSS analysis was done using Randomise v2.1 (Threshold-Free Cluster Enhancement) with 5000 permutations and a corrected cluster significance level of p<0.05 (two-tailed).
Results
Lesion volume and LPM
MS patients had a mean WM T2-hyperintense lesion volume of 5.12±5.60 cm3 (range: 0.32–21.81 cm3). High probability of WM lesion occurrence was noted in periventricular regions around the anterior horns (including the bilateral anterior coronal radiations) and posterior horns (including the middle parts of the inferior fronto-occipital fascicles) of the lateral ventricles, as well as in WM regions comprising the right superior longitudinal fascicle, the superior coronal radiations of both hemispheres, and the bilateral posterior parts of the inferior fronto-occipital fascicles (Fig. 1). Comparing the two hemispheres, lesion probability appeared to be symmetrical for anterior regions. For posterior regions, the probability for lesion probability appeared slightly higher for the left than for the right hemisphere.
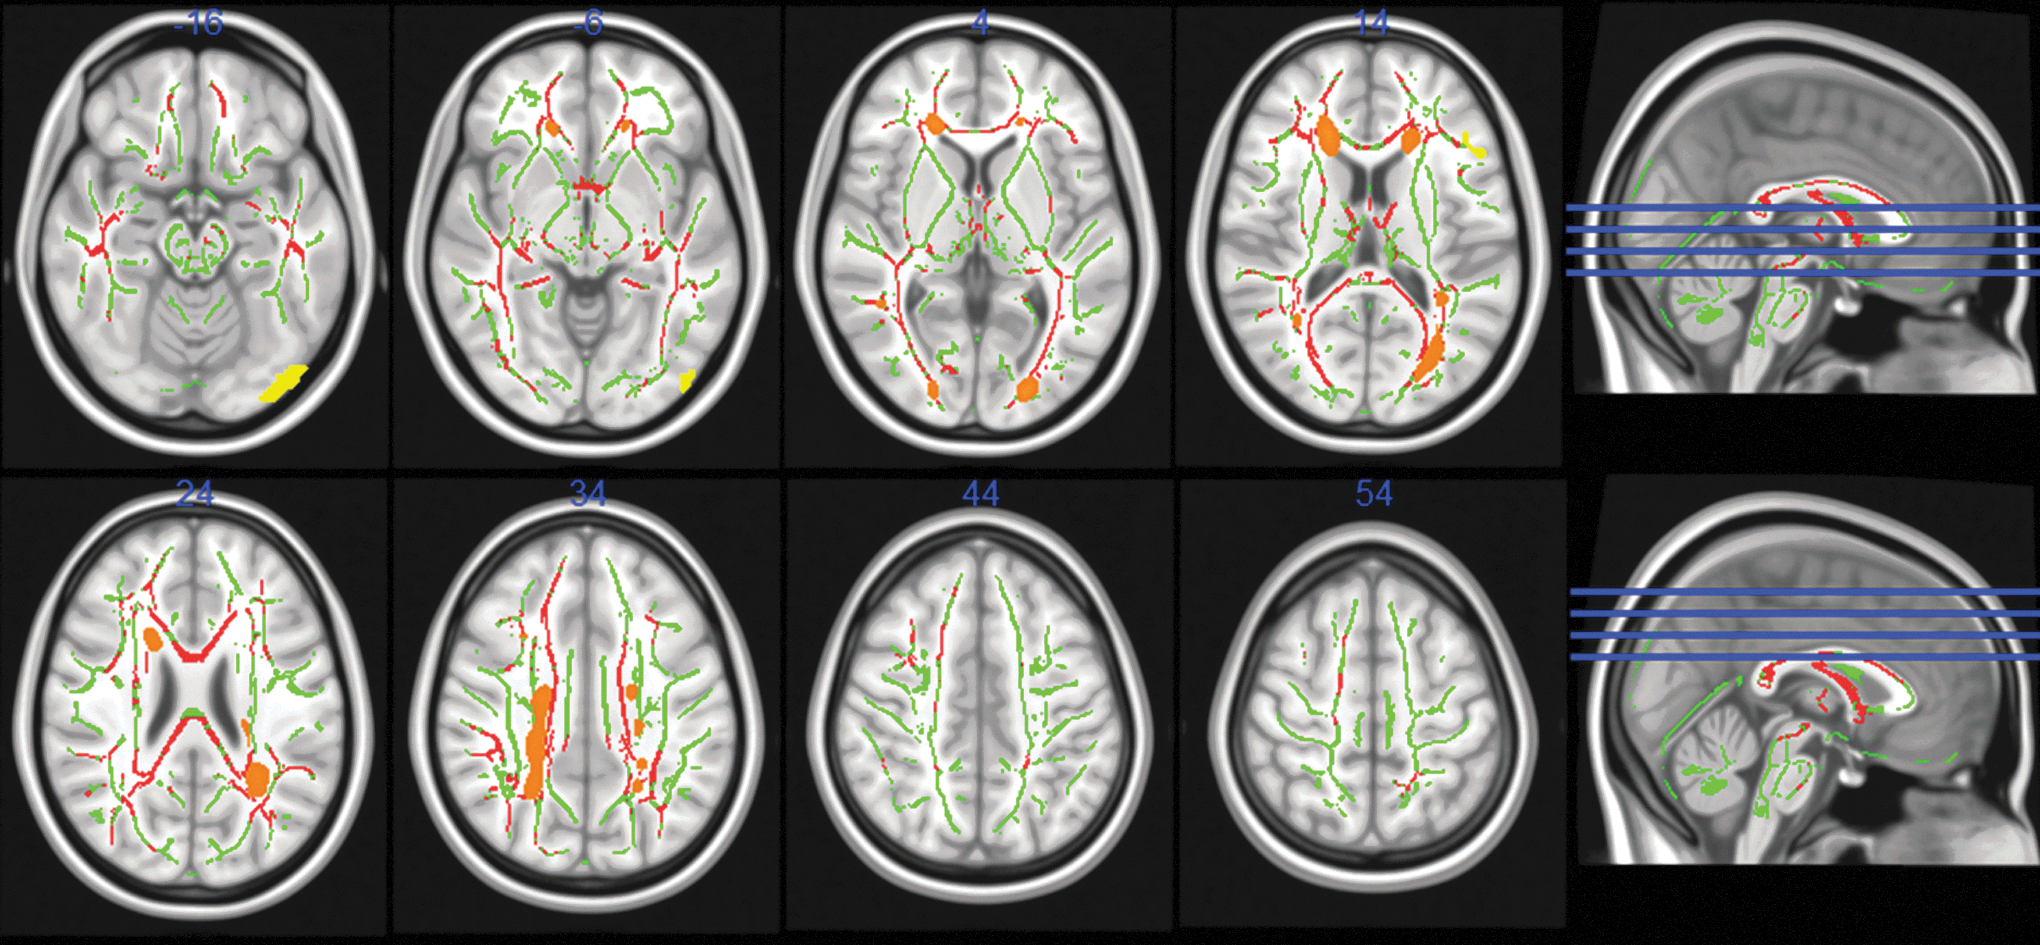
White matter lesion probability mapping (LPM), tract-based spatial statistics, and voxel-based morphometry. LPM was thresholded at 10%, in transversal views (radiological convention), on a standard (nonextracted) MNI152 brain (resolution: 1 mm). High white matter (WM) lesion occurrence (orange) was noted in anterior periventricular regions, and in WM areas comprising the right superior longitudinal fascicle, bilateral superior coronal radiations, bilateral posterior periventricular regions, and bilateral posterior inferior fronto-occipital WM tracts. Reduced fractional anisotropy (FA) was found for patients in bilateral inferior longitudinal fascicles, bilateral inferior fronto-occipital fascicles, genu, body and splenium of the corpus callosum, fornix, bilateral anterior and posterior coronal radiations, right superior coronal radiation, and bilateral superior longitudinal fascicles (red). Differences were significant at p≤0.05. Images are overlaid on a group-based FA skeleton (green). Significant reductions in gray matter (GM) were found in the left inferior frontal gyrus (IFG) and in the left lateral occipital cortex (LOC) for multiple sclerosis (MS) patients compared to healthy controls (HCs, yellow; radiological convention).
FA analysis
The group analysis for the FA showed that MS patients had reduced FA compared to controls in the following areas: bilateral inferior longitudinal fascicles, bilateral inferior fronto-occipital fascicles, genu, body and splenium of the corpus callosum, fornix, bilateral anterior and posterior coronal radiations, right superior coronal radiation, and bilateral superior longitudinal fascicles (Fig. 1).
VBM analysis and subcortical GM volumes
The comparison of cortical GM thickness yielded significant differences between patients and HCs in two cortical regions: (1) the left inferior frontal gyrus (IFG) and (2) the left lateral occipital cortex (LOC). The local maximum of the IFG region lay at x=−48 y=26 z=18 (in mm) and included 77 voxels (at the significance level of p<0.05). The local maximum for the LOC region was at x=−40 y=−88 z=−16, with a cluster size of 193 voxels (at p<0.05; Fig. 1). Comparing deep GM volumes, group differences were found, whereas patients had decreased volumes in the left caudate nucleus. Differences were also found for the bilateral putamen and the bilateral thalamus (Fig. 2 and Table 1).
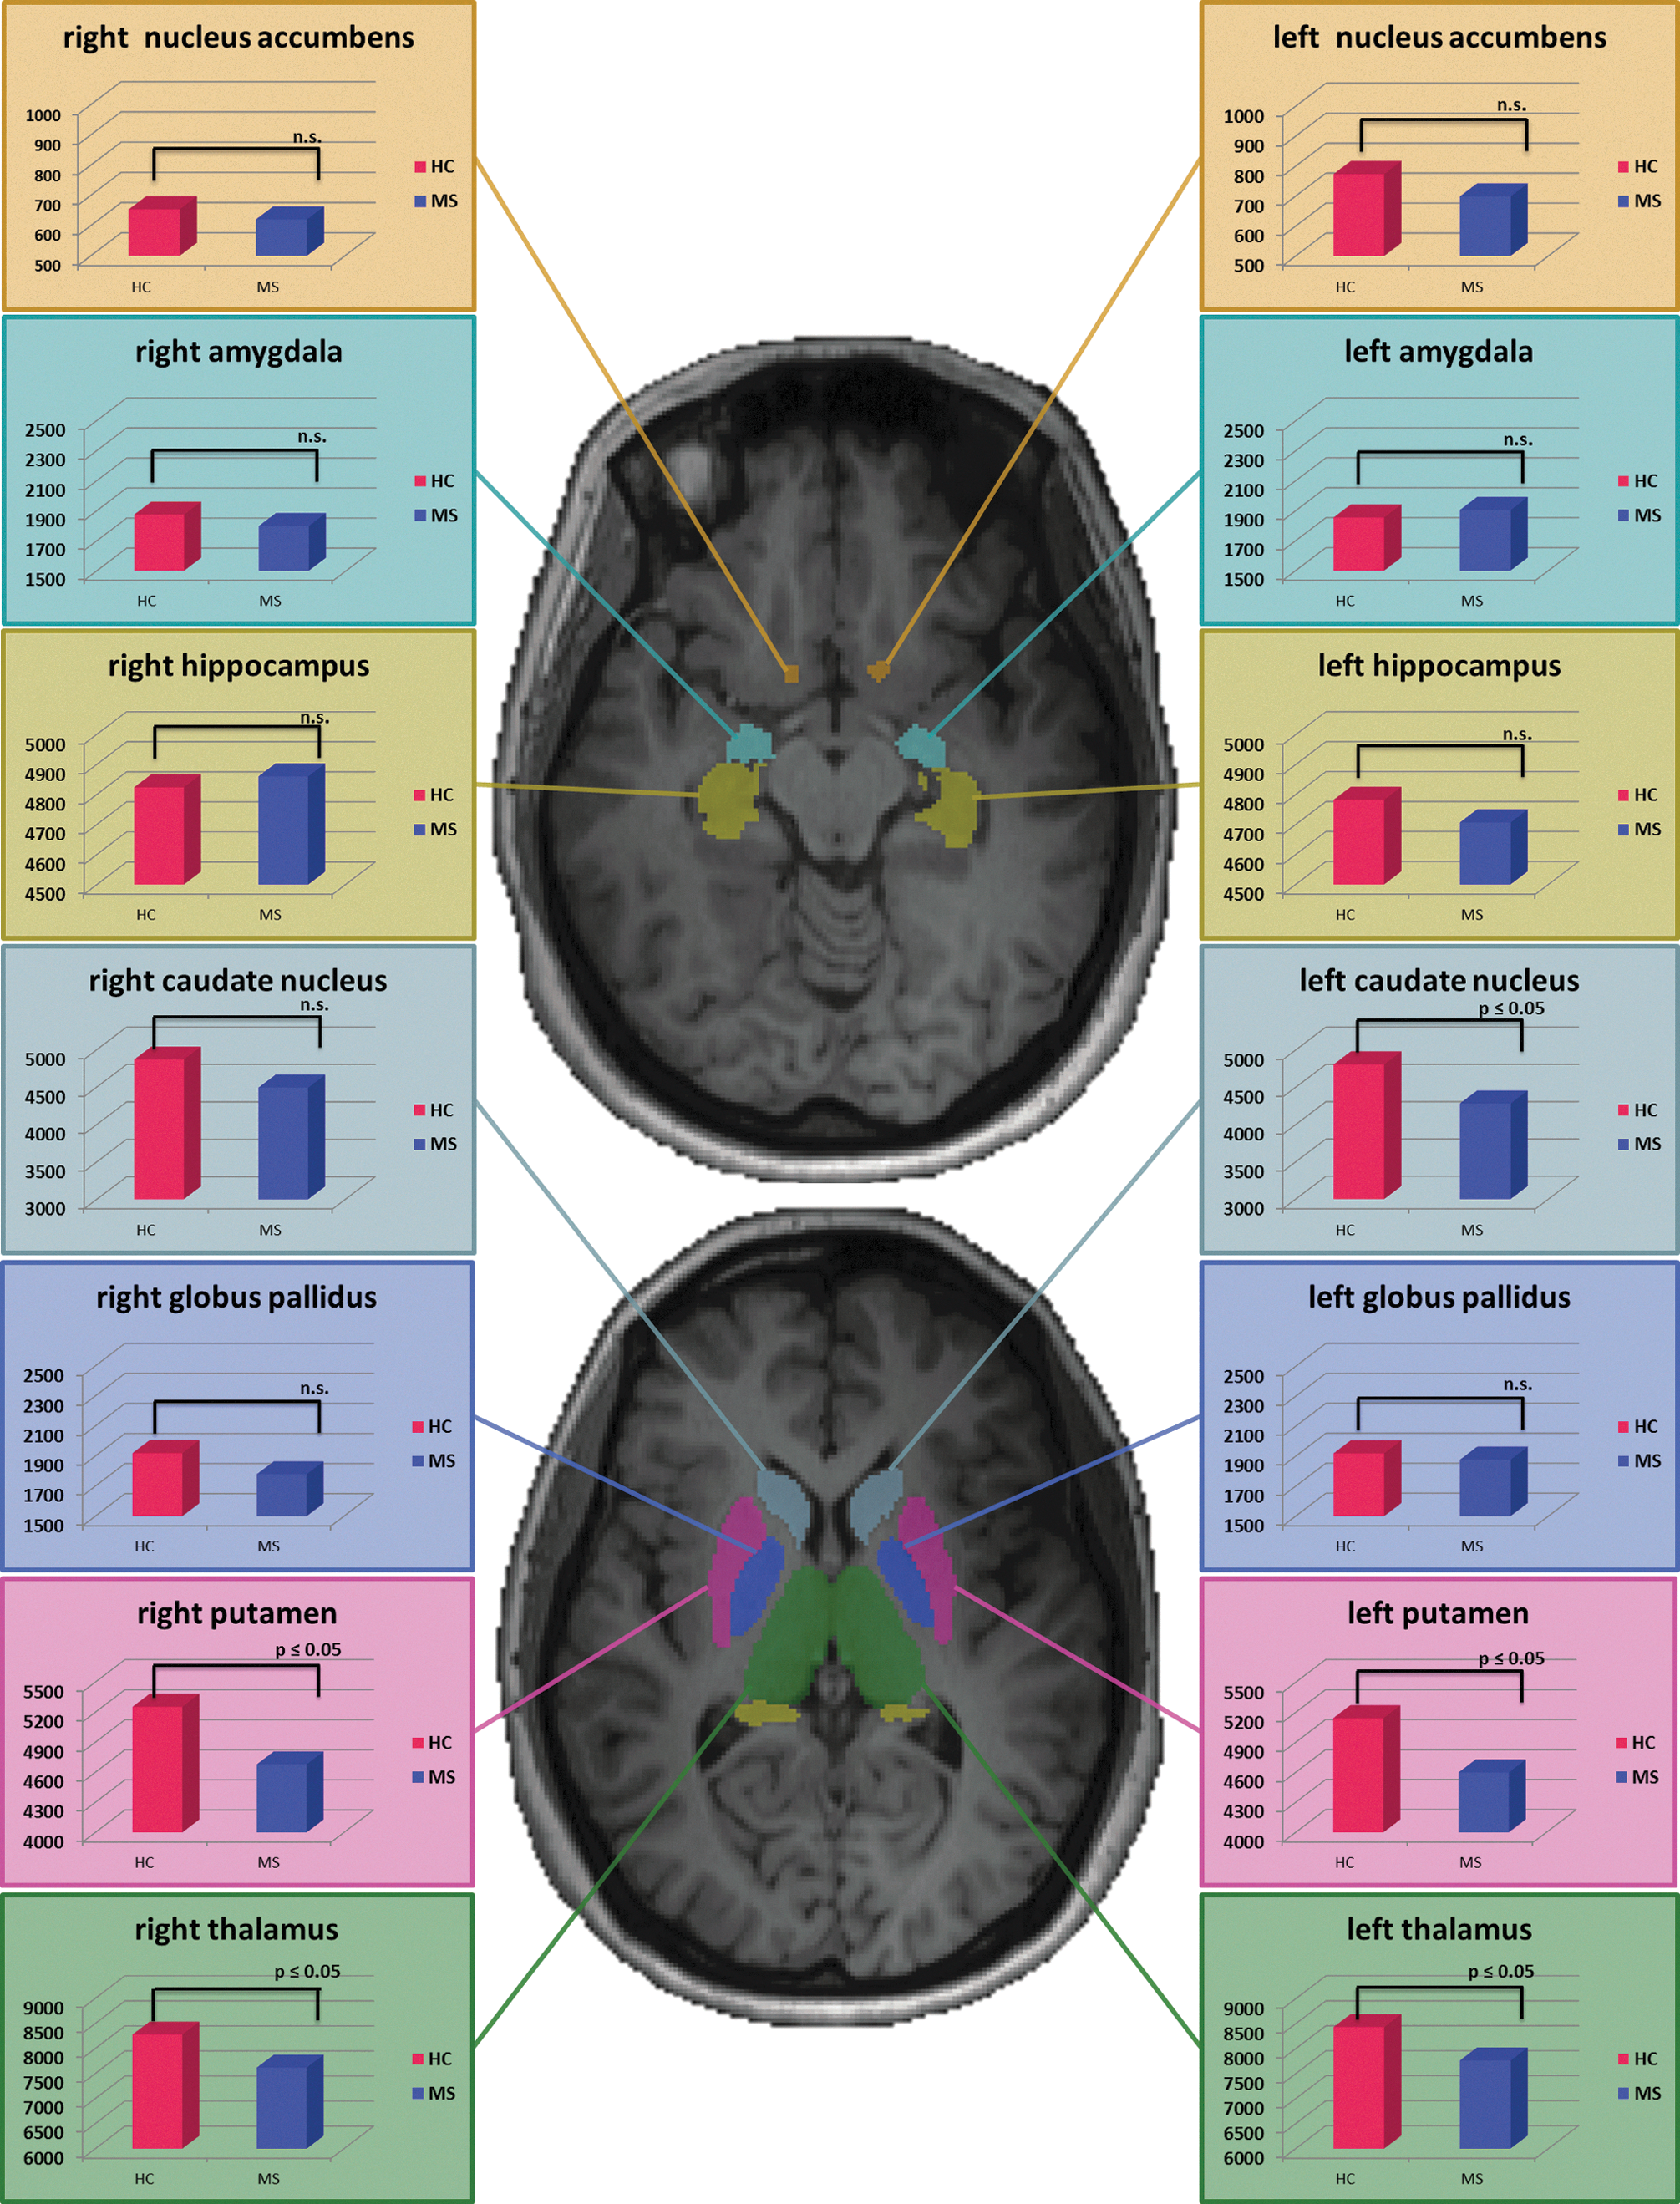
Segmented subcortical volumes (nucleus accumbens, amygdala, hippocampus, caudate nucleus, globus pallidus, putamen, and thalamus) were different between patients and controls for the left caudate nucleus, the bilateral putamen, and the bilateral thalamic nuclei. Red diagrams are displaying deep GM volumes for HCs. Blue diagrams representing the values for volumes for MS patients. All values are in mm3. Differences are significant at p≤0.05. Differences that were not significant (p>0.05) are marked as n.s. Results are shown on two transversal slides (upper slide: x=−16; lower slide: x=4) of an individual (nonextracted) T1-weighted scan from one healthy subject.
Gray Matter Volumes in mm3 for Healthy Controls and Multiple Sclerosis
sign. at p≤0.05
Data are given as mean and±SD. Group comparisons were done by a two-sample t-test (T=T-value, df=degrees of freedom, p=statistical significance).
MS, multiple sclerosis; HC, healthy control.
Tractography using the left IFG region as seed mask
For the tractography, including VBM results, we chose the region of the left IFG that demonstrated a regionally decreased volume in the patients. For this region, a mask was generated that served as starting point. The probabilistic tractography analysis identified the following probabilistic pathways both in HCs and patients: the genu of the corpus callosum; the anterior, middle, and posterior parts of the left coronal radiations; the left inferior fronto-occipital fascicle, and parts of the left internal and external capsules.
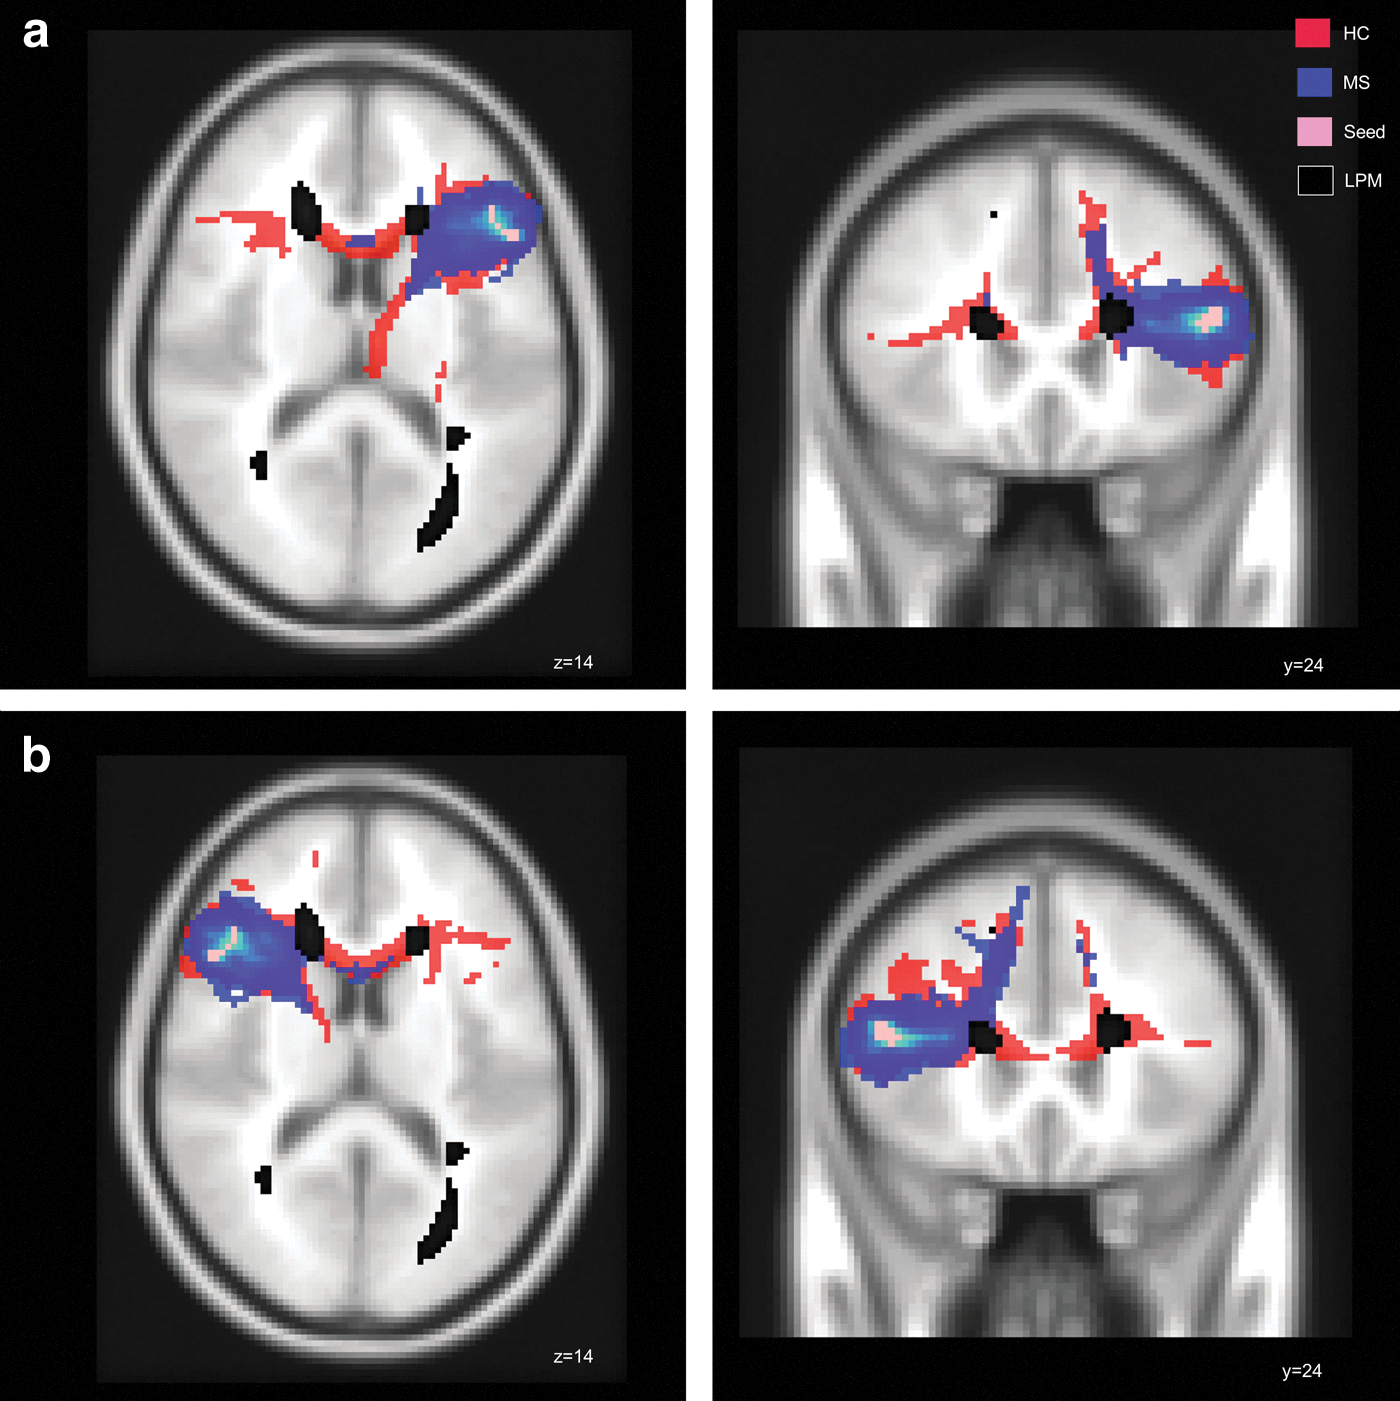
The comparison of total volume of pathways starting from the left frontal seed was not significantly different between groups. Spatially, MS patients demonstrated a lower probability for fiber bundles in the genu of the corpus callosum, connecting the left IFG region with contralateral frontal areas (Fig. 3a and Table 2). In addition, decreased WM integrity was observed in the bilateral inferior fronto-occipital fascicles, in the bilateral anterior thalamic radiations, and in the left superior longitudinal fascicle. (Supplementary Figure S1; Supplementary Data are available online at
Tractography.
Volumes of Pathways in mm3 for Healthy Controls and Multiple Sclerosis
sign. at p≤0.05
Data are given as mean and±SD. Group comparisons were done by a two-sample t-test (T=T-value, df=degrees of freedom, p=statistical significance).
IFG, inferior frontal gyrus; LOC, lateral occipital cortex.
Tractography using the left LOC region as seed mask
Using a similar approach, the region of the left LOC was defined as the seed region for the tractography. Starting from this region, pathways were identified traversing through the left and right inferior fronto-occipital fascicles, the left inferior longitudinal fascicle, and the splenium of the corpus callosum in all study participants.
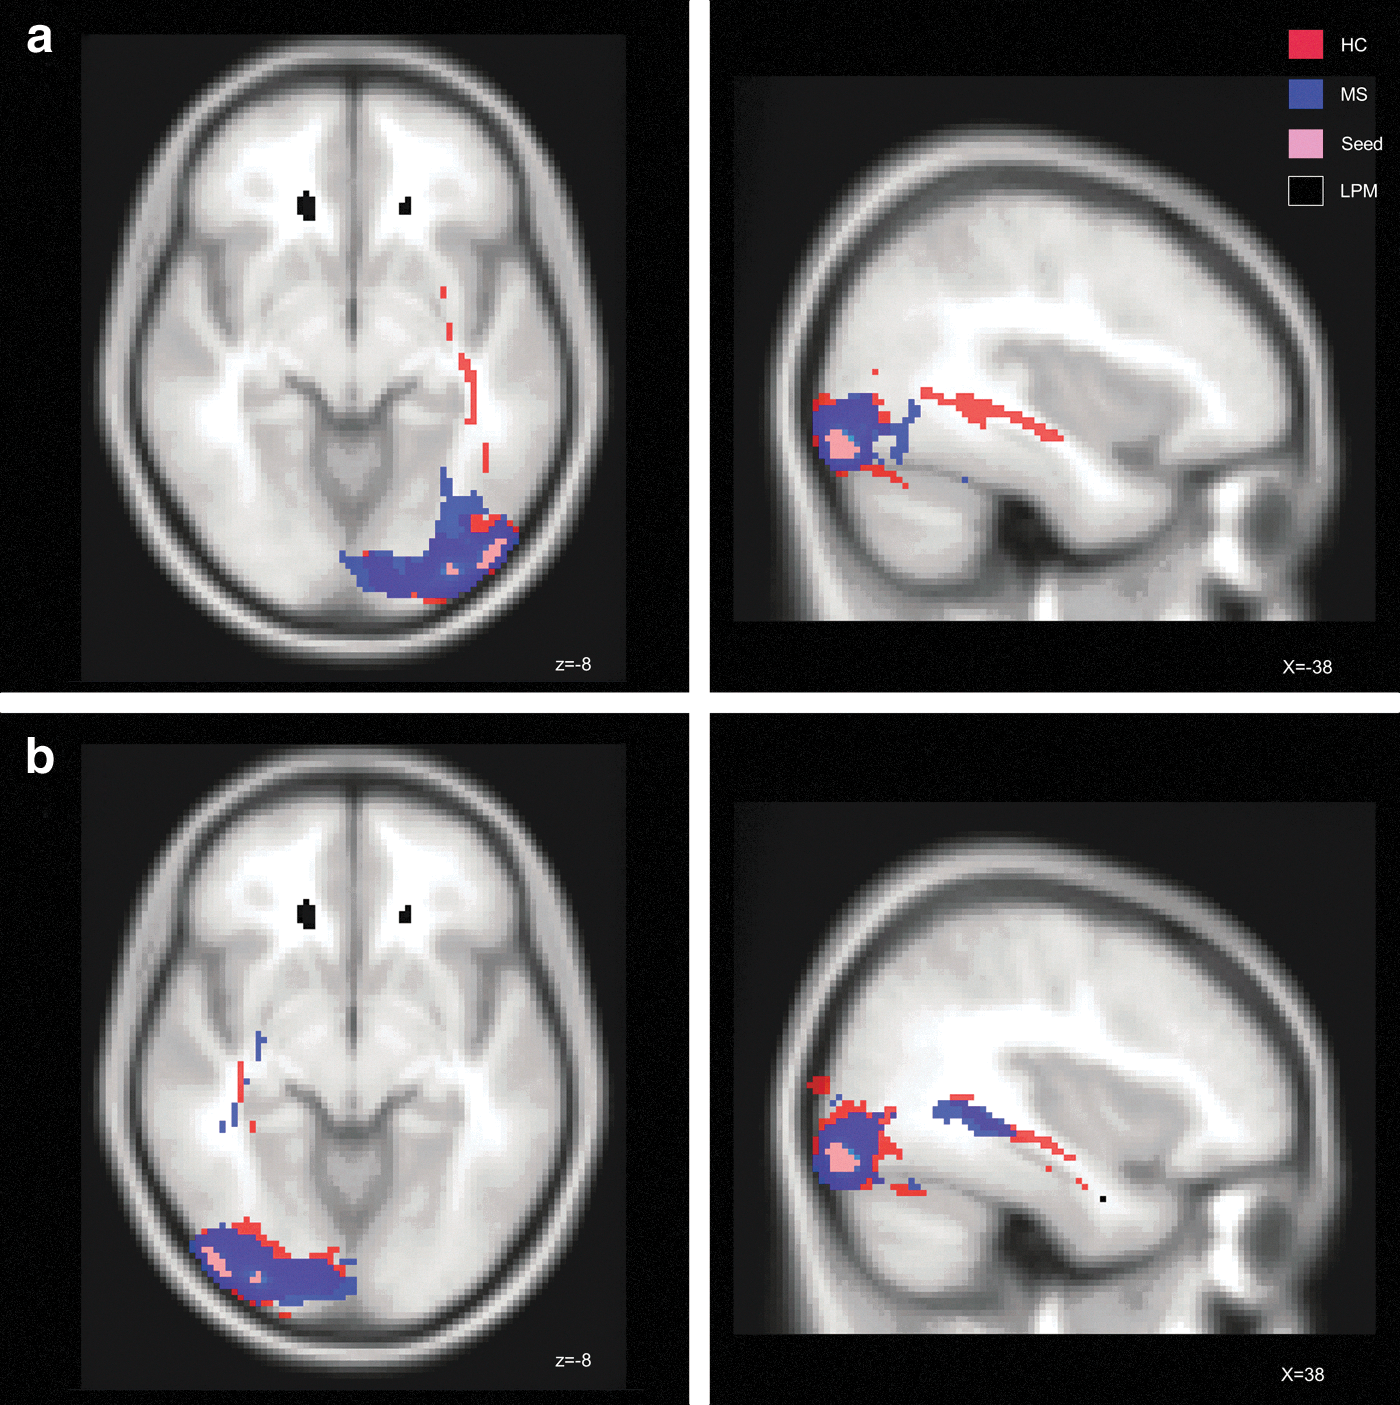
The comparison of total volume of pathways starting from the left occipital seed was not significantly different between groups. The spatial group comparisons demonstrated lower probability for pathways reaching from the LOC seed to the posterior–anterior direction of the left hemisphere in the patients. Differences were especially pronounced in the anterior and middle parts of the left inferior longitudinal fascicle, the anterior and middle parts of the left inferior fronto-occipital fascicle, the posterior part of the right inferior fronto-occipital bundle, and the splenium of the corpus callosum (Fig. 4a and Table 2; Supplementary Figure S2).
Tractography.
Plausibility analysis
To test if the results of the tractography, the VBM, and LPM were specifically regionally linked to each other in patients, we swapped the two seed regions to the homologous sides of the contralateral hemisphere, where VBM had not shown differences between patients and controls.
The results for the tractography with the right IFG as the starting region showed that the patients did not differ in the total volume of pathways. Spatially, patients had again a less connectivity in the genu of the corpus callosum, connecting bihemisperically the two inferior frontal gyri. Group differences between MS patients and HCs were also found in the bilateral anterior thalamic radiations, and in the right fronto-occipital fascicle (Fig. 3b and Table 2)
Swapping the LOC seed to the right side revealed that patients did not also differ in the absolute volume of pathways. Regarding spatial differences, the probability of fiber connections of the inferior fronto-occipital and longitudinal fiber pathways was not reduced (Fig. 4b and Table 2) for this hemisphere in patients, as it has been seen for the left hemisphere, where patients had focal cortical GM changes and increased occurrences of WM lesions.
Discussion
We here used VBM, probabilistic tractography, and LPM to test whether spatial relationships between MRI-detected cortical tissue changes and WM disintegration can be observed in MS in vivo. The results of our MRI analyses suggested that focal GM volume changes are related to disturbances in connected WM pathways in patients. The comparison of left with right hemispherical distribution of structural changes indicated that there might be spatial interdependence between cerebral disturbances evaluated with MRI. While this study sought to benefit from a combined application of these methods and was purely exploratory in nature, it was grounded on suggestions that dying back processes might exist, which either evoke GM atrophy through axonal transection (Sepulcre et al., 2009) or, alternatively, might result from cortical thinning leading to damage to axons and impaired connectivity within WM (Filippi et al., 2012). The results of this study indicate a complex relationship between decreased cortical volumes as evidenced by MRI, an increased T2-lesion load along tracts, and alterations in adjacent WM tracts.
Using VBM, we found two cortical regions in the left IFG and the left LOC, where patients showed reduced GM volume compared to controls in this specific sample of patients with low-disability MS. This extends insights from previous studies, which found that cortical damage was associated with (1) thalamic neuronal loss (Cifelli et al., 2002), (2) volume loss of the lateral geniculate nucleus and occipital areas (Sepulcre et al., 2009), (3) distributed cortical damage (Battaglini et al., 2009), or (4) overall cortical thinning (Calabrese et al., 2011a). Our study further adds to the complexity of these findings.
For subsequent probabilistic tractography, we defined the IFG and LOC regions as seed masks. Starting from the left IFG region, probabilistic tractography analysis identified fiber bundles running through the left inferior fronto-occipital fascicle, the left coronal radiation, parts of the internal and external capsule, and the corpus callosum. In MS patients, this connection system subserving frontal areas seemed to be disrupted, as there was probabilistic evidence for less fiber bundles across the inferior fronto-occipital fascicle compared to HCs. One might suggest that disruptions of pathways may result from WM lesion distribution. Indeed, inspection of overlaid LPM (Fig. 2a) indicated that streamlines partially traversed through T2-visible lesion clusters. Nonetheless, it cannot be ruled out that signal alterations caused by focal WM lesions might have influenced the probabilistic tractography algorithm.
Our tractography results are consistent with previous studies that confirmed that inferior and superior frontal areas of both hemispheres are interconnected by fibers of the rostrum and the genu of the corpus callosum (Gong et al., 2009; Schmahmann and Pandya, 2009). As disturbances in these fibers can lead to deficits in motor, perceptual, and cognitive functions (Bodini et al., 2009; Dineen et al., 2009; Engel et al., 2007; Glickstein and Berlucchi, 2008; Mesaros et al., 2009), future studies will therefore also need to relate such findings to behavioral performance in these domains.
A part of the LOC served as a second seed mask for our tractography analysis. In HCs, this region was connected with temporal areas within the inferior longitudinal fascicle (and optic radiations), in line with previous tractography studies (Catani et al., 2003; Catani and Thiebaut de Schotten, 2008). Furthermore, we found probabilistic connections, including the splenium of the corpus callosum to the contralateral side and the inferior fronto-occipital fascicle, which connects occipital to frontal regions. In contrast to HCs, MS patients demonstrated evidence of disturbed probabilistic connectivity to occipito-temporal and occipito-frontal pathways of the left hemisphere. This largely fits with findings of two recent studies using VBM and LPM (Bendfeldt et al., 2010; Sepulcre et al., 2009). These authors reported that focal cortical atrophy was partially associated with the WM lesion load in the corpus callosum and optic radiations. Given the fact that patients of our cohort had no clinical account or history of optic neuritis, the functional relevance of such alterations in optic radiations might need to be more closely explored further, for example, by means of ophthalmologic examinations, visually evoked potentials, or optic coherence tomography.
In an attempt to better understand and validate these observations, we spatially swapped the seed masks to the homologous areas of the contralateral right hemisphere (where no differences in cortical volumes have been noted between patients and controls). For the right IFG region, the probabilistic tractography analysis demonstrated that interhemispheric connections stopped for MS patients after passing the corpus callosum (Fig. 2b). We interpret these findings as caused by symmetrical bilateral frontal lesion occurrence adjacent to the anterior horns interfering with tractography deriving from the IFG on both sides. Swapping the LOC to the contralateral side, different tractography results were found between the left and the right hemisphere. Only the left fronto-occipital fascicle seemed to be disintegrated in patients, while the right fronto-occipital connectivity originating from the LOC did not show disturbances. This could at least partially be explained by larger lesion clusters in posterior parts of the fronto-occipital fascicle on the left hemisphere, but lacks a clear explanation. Generally, it appeared that MS-specific cortical GM and WM tissue changes were colocalized and lateralized to the left side in this cohort. However, it is important to note that MRI cannot serve as a specific probe of such complex tissue changes.
Histopathologically, there is converging evidence for a relevant role of GM damage in MS, and several studies suggested that the WM lesion load is related to the cortical volume loss in MS (Chard et al., 2002; Charil et al., 2007; Evangelou et al., 2000; Henry et al., 2009). Previous studies found, that MS patients had a reduced volume of the thalamic nuclei (Mesaros, 2008), which was also correlated with the NAA concentration (N-acetylaspartate) in the thalamus (Wylezinska et al., 2003) and related to a lower probability of fibers of the anterior thalamic radiations (Henry et al., 2009). MS patients in our study showed also reduced deep GM volumes in the thalamus bilaterally. Furthermore, reduced volumes in MS were also found for the bilateral putamen and the left caudate nucleus. The reasons for deep GM atrophy in MS patients in the earlier stages of disease are still unclear, but it can be speculated that both, GM and WM structures, are injured because of a common disease progress. Further investigations regarding the relationship between deep GM volumes and their projection fibers have to be done separately for each region in a bigger cohort of MS patients.
Mostly, previous studies compared FA between patients and healthy subjects to investigate disturbances in WM tracts in MS. Differences in FA were found in bilaterally distributed WM tracts (Bodini et al., 2009; Dineen et al., 2009; Raz et al., 2010a). This was also the case in our study. FA reductions were found in 21 WM locations (Mori et al., 2005), bilaterally distributed.
In conclusion, our study suggests a spatial interdependence between decreased focal cortical volumes, lesion location, and altered probabilistic fiber pathways. One might speculate on several possible explanations. First, axonal transection within MS lesions (Trapp et al., 1998) might cause wallerian degeneration, leading to retrograde GM atrophy. Indeed, the concept of a dying back process of the perikarya from damaged axons in MS plaques has been supported by recent VBM studies (Sepulcre et al., 2006, 2009). Furthermore, cortical thinning has been noted in the absence of cortical demyelination, and has been interpreted as a significant reduction in synaptic density with subsequent axonal loss and atrophy as well as impaired neuronal connectivity (Filippi et al., 2012; Wegner et al., 2006). Unfortunately, we have not obtained MRI data that would allow detecting focal cortical lesions such as double-inversion recovery sequences (Calabrese et al., 2011b).
Limitations
There are several other limitations that need to be considered when interpreting our results. First, MRI-visible and presumably also MRI-invisible MS lesions (Evangelou et al., 2000) could have methodologically impacted the VBM and probabilistic tractography analyses used in our study by variable sources, independent from genuine WM tract degeneration. However, this problem can hardly be addressed by currently available in vivo analysis methods. Second, with tractography, it is not possible to detect the true end points (synapses) of pathways (Jbabdi and Johansen-Berg, 2011), which decreases the accuracy of probabilistic tractography results. Notwithstanding the known methodological limitations of this technique (Ciccarelli et al., 2008), probabilistic tractography has greatly advanced our ability to visualize pathological abnormalities in WM tracts and cortical connectivity in CNS disorders. Furthermore, diffusion data were assessed with only 12 directions. Due to this, complex WM fiber bundles with crossing tracts could not be accurately separated. We suggest that, for the investigation of separated tracts in further studies, one should use more than 12 directions. Third, it is striking that differences between patients and controls were predominantly lateralized to the left hemisphere. While this most likely represents a chance finding (related to the small sample size and the specific peculiarities of this particular group of patients) as we are not aware of an hemispheric preponderance of MS pathology, this warrants further testing given records of interhemispheric differences in white and GM structures (Fabiano et al., 2005). Fourth and most importantly, because the investigation of focal cortical damage in MS is a relatively young topic, from the previous literature we cannot conclude, if the IFG and LOC regions are specifically vulnerable in MS, or, which is more likely, have been defined in our specific cohort. It is therefore important to note, that our observations reflect only minimal structural differences between MS and HC, derived from selected patients in early stages of the disease with only mild physical disability. Further studies (which perform tractography on side-by-side, without earlier knowledge of where abnormalities lie), are therefore needed to explore such structural changes in more heterogeneous and larger samples.
Conclusion
By the combination of relatively novel MR imaging methods (VBM, LPM, and probabilistic tractography), we were able to provide indirect evidence from neuroimaging that reduced GM thickness might at least partially be spatially related to lesion location and altered probabilistic WM fiber tracts in MS. This exploratory study could stimulate further investigations using such a combined imaging approach to further elucidate mechanisms implied in GM pathology in MS.
Footnotes
Acknowledgments
We thank Karin Brodtrager and Fritz Studencnik for technical support.
Author Disclosure Statement
No competing financial interests exist.
References
Supplementary Material
Please find the following supplemental material available below.
For Open Access articles published under a Creative Commons License, all supplemental material carries the same license as the article it is associated with.
For non-Open Access articles published, all supplemental material carries a non-exclusive license, and permission requests for re-use of supplemental material or any part of supplemental material shall be sent directly to the copyright owner as specified in the copyright notice associated with the article.