
Abstract
Graph-based brain anatomical network analysis models the brain as a graph whose nodes represent structural/functional regions, whereas the links between them represent nervous fiber connections. Initial studies of brain anatomical networks using this approach were devoted to describe the key organizational principles of the normal brain, while current trends seem to be more focused on detecting network alterations associated to specific brain disorders. Anatomical networks reconstructed using diffusion-weighed magnetic resonance-imaging techniques can be particularly useful in predicting abnormal brain states in which the white matter structure and, subsequently, the interconnections between gray matter regions are altered (e.g., due to the presence of diseases such as schizophrenia, stroke, multiple sclerosis, and dementia). This article offers an overview from early gross connectional anatomy explorations until more recent advances on anatomical brain network reconstruction approaches, with a specific focus on how the latter move toward the prediction of abnormal brain states. While anatomical graph-based predictor approaches are still at an early stage, they bear promising implications for individualized clinical diagnosis of neurological and psychiatric disorders, as well as for neurodevelopmental evaluations and subsequent assisted creation of educational strategies related to specific cognitive disorders.
Introduction
F
With the recent advent of graph-based brain anatomical network analyses (Hagmann et al., 2007; Iturria-Medina et al., 2007; Kaiser and Hilgetag, 2006; Sporns et al., 2000; Sporns and Zwi, 2004), it is possible to model and to characterize topologically, from a local to a global level, the structural bases that support the brain's functional behavior. Besides offering a deeper understanding of the key organizational principles of brain structural interconnections, anatomical network analyses have also contributed to the identification of structural changes associated with specific brain diseases, such as schizophrenia, stroke, multiple sclerosis (MS), Alzheimer's disease (AD), and dementia (for reviews, see Bassett and Bullmore, 2009; Bullmore and Sporns, 2009; Guye et al., 2010; Lo et al., 2011; Wen et al., 2011; Xia and He, 2011). Current graph-based theoretical analyses devoted to the study of abnormal brain states can be methodologically subdivided according to two different approaches: those that propose to identify statistical subpopulation differences associated with specific diseases and, more recently, those that propose explicit models to predict unknown individual brain health states based on intrinsic information contained in their connectivity patterns.
Predictive models have potentially strong implications for clinical applications and for our understanding of neurodevelopmental cognitive disorders. In this article, we provide an overview of recent graph-based anatomical brain network studies with a specific focus on those approaches devoted to the prediction of abnormal brain states. The article is organized in three primary sections. The first section offers an historical overview of anatomical brain connectivity mapping and more recent in vivo anatomical network reconstruction approaches based on diffusion-weighed magnetic resonance-imaging (DW-MRI) techniques. The second section reviews current advances on the prediction of abnormal brain states based on anatomical networks, as well as emphasizes the dissimilarities between frequently reported subpopulation differences and prediction models. The final section highlights important remaining questions and challenges in the reconstruction of anatomical brain networks and associated prediction models.
On the History of Anatomical Brain Networks
Invasive anatomical connectivity mapping
Attempts to understand and reveal the intricate structure of the brain have a long history, with memorable names such as Herophilus of Calcedon (335–280 BC), Erasistratus of Ceos (304–250 BC), and Galen of Pergamon (129–199 AC). As the etymological origin of the word anatomy indicates (from the Greek term anatomē, dissection), contributions of these revolutionary medics were mainly based on gross observation of dissected plants, animals, or humans. Gross dissection was the unique available instrument for structural brain explorations for centuries. The significant contributions of these early anatomical studies are undeniable. They formed the inspirational bases upon which the Renaissance marked a new discovery period with the outstanding role of Andreas Vesalius (1514–1564). The differentiation of the gray and white matters and the description of specific complex nervous structures (such as the corona radiate, the corpus callosum, and the internal and external capsules) were among the major legacies of Andreas Vesalius's works (Vesalius, 1544; see historical discussion by Morecraft et al. in Johansen-Berg and Behrens, 2009). The posterior development of microscopic anatomy, in part due to Marcello Malpighi (1628–1694), Robert Hooke (1635–1703), and Antonius van Leeuwenhoek (1632–1723), represented the end of the gross dissection era. From then, new anatomical discoveries were based not only on the limited visual inspection of the naked eye, but also on the information revealed by greatly magnified images that rapidly allowed for the identification of smaller brain units (e.g., cells, axons, and nervous fibers). As expected, the new era of microscopic units led to new challenges, from which an inevitable question emerged: how are these living units structurally and functionally inter-related?
More than three centuries after Marcello Malpighi's work, which formed the bases of the modern physiology and histology sciences, it is still unclear how the basic brain units are structurally and functionally inter-related. Perhaps, the only exception is the nematode Caenorhabditis elegans, the only living creature for whom its nervous system, relatively simple in comparison to mammals, has been mapped completely at a cellular level (White et al., 1986). During the last three centuries, however, an impressive number of techniques have arisen with the common purpose of decoding the brain's structural characteristics, with a specific focus on the organization of the white matter and subsequent influences on brain functioning. For instance, staining techniques (i.e., the application of stains to highlight structural properties under a microscope) were developed initially around the latter half of the 19th century by Carl Weigert (1845–1904) and Camilo Golgi (1843–1926). Among multiple other applications that are still used, staining techniques led to the final definition of the axon as a prolongation of the neuron's soma (see summary of Golgi's works presented by Fabene and Bentivoglio, 1998). They also allowed for the first time to trace axonal pathways between cortical regions, particularly in small-brain animals (Cajal, 1889a; Cajal, 1889b; Cajal, 1891; Cajal, 1892). Degeneration techniques use information provided by anterograde and retrograde processes related to lesions within specific brain regions, thereby allowing the inference of existing fiber pathways and corresponding connectivity patterns. Anterograde processes, also known as Wallerian degeneration (Waller, 1850), consist in the degeneration of distal parts of axons connecting an injured brain region with other cortical regions; retrograde processes, on the other hand, consist in the degenerative spreading from the most distal parts of the axons to the cell bodies (Gudden, 1870). Invasive tract tracer techniques, perhaps the most multifaceted of all these methods, are based on axonal flow mechanisms as basic vehicles to transport detectable substances and to elucidate in this way long-fiber connections. Anterograde and retrograde tracing techniques are also used in a great variety of applications, especially when are combined with other methods (e.g., immunohistochemical, electron microscopy, or electrophysiological approaches; see Köbbert et al., 2000).
Polarized light imaging (PLI) is a new promising technique to explore the postmortem brain fiber architecture by passing linearly polarized light through brain tissue and measuring local changes in the polarization of light (Axer and Keyserlingk, 2000; Axer et al., 2001; Axer et al., 2008; Axer et al., 2011; Brosseau, 1998; Scheuner and Hutschenreiter, 1972). Recently, Axer and colleagues proposed the 3D-PLI method as a new tool to map the three-dimensional course of fiber tracts in the postmortem human brain with an ultrahigh resolution (i.e., voxel sizes around 100 μm isotropic; Axer et al., 2011). Besides contributing to a deeper understanding of the brain's anatomical connectivity, results obtained with this approach may finally constitute the appropriate gold standard to evaluate the accuracy of current and future in vivo tract-mapping techniques (e.g., DW-MRI experiments).
Noninvasive anatomical connectivity mapping
Much of the current knowledge about connectional neuroanatomy was discovered through the use of histological staining, degeneration methods, and tract-tracing techniques (for reviews, see Schmahmann and Pandya, 2006; Morecraft et al. in Johansen-Berg and Behrens, 2009). However, their invasive nature makes their application to the living human brain impossible. Consequently, even until almost the end of the 20th century, most of our understanding of neuroanatomical connectivity of the human brain was based on an insufficient number of postmortem studies and readapted concepts from the more explored connectional neuroanatomy of other species, especially from nonhuman primates.
The introduction of DW-MRI techniques for the structural exploration of biological tissues (Basser et al., 1994; Chenevert et al., 1990; Le Bihan and Breton, 1985; Le Bihan et al., 1986) resulted in a tremendous impulse to study in vivo brain anatomy and, in particular, the white matter structure. Basically, DW-MRI techniques quantify the motion of water molecules in tissues, which is known to be highly anisotropic in certain white matter regions (e.g., with a preferential movement along the nervous fibers). The formalism of the diffusion tensor model (DTI) (Basser et al., 1994) allows the anisotropic process characterization of biological tissues based on DW-MRI information, under the approximation of a symmetric tensor that describes water molecular mobility along different coordinate axes and that can be geometrically represented by an ellipsoid. The diffusion tensor ellipsoid, or more precisely its main axis, was initially assumed to indicate local main fiber orientations on white matter tissues and was ingeniously used to trace long axonal pathways using deterministic algorithms (Basser et al., 2000; Conturo et al., 1999; Jones et al., 1999; Mori et al., 1999). For the first time, it was thus possible to use a noninvasive method to map connectional neuroanatomic circuits in the living human brain. However, further validation analyses revealed that, at least at the typical spatial resolution acquired in humans (e.g., with image voxel size of around 2×2×2 mm3), fiber tractography approaches based on diffusion tensor's main axis have a low capacity to deal with complex intravoxel fiber configurations, such as fiber crossings and fanning. They were also shown to be highly sensitive to the influence of MR signal noise.
High-angular-resolution diffusion imaging (HARDI; Tuch et al., 2002a) and probabilistic fiber tractography algorithms were subsequently proposed to overcome the limitations of the diffusion tensor model and traditional deterministic fiber tractography. HARDI consists in the acquisition of DW-MRI images for a larger number of diffusion gradient directions than typically required for the diffusion tensor model estimation. This allowed for a more detailed mapping of multiple, complex intravoxel fiber orientations, for which different reconstruction approaches have been proposed, such as qball imaging (Canales-Rodríguez et al., 2009; Tuch, 2002b; Tuch, 2004), diffusion spectrum imaging (DSI; Wedeen et al., 2005), diffusion orientation transform (Canales-Rodríguez et al., 2010a; Özarslan et al., 2006), spherical deconvolution (Canales-Rodríguez et al., 2010b; Dell'Acqua et al., 2007; Tournier et al., 2004; Tournier et al., 2007), and 3D curve inference (Savadjiev et al., 2006; Savadjiev et al., 2008). Probabilistic tractography uses uncertainty of the estimation of nervous fiber orientations to compute a large number of possible paths from the seed point (Behrens et al., 2003a; Behrens et al., 2007; Parker and Alexander, 2003; Parker et al., 2003); anatomical connection probability among seed and target points is evaluated as the frequent relation between number of connecting paths and the number of generated paths. Alternatively, global tractography algorithms explore through the wide spectrum of possible fiber trajectories to select as final candidates those trajectories that maximize a global goodness-of-fit criterion (Iturria-Medina et al., 2007; Jbabdi et al., 2007; Sherbondy et al., 2008, 2009; Tuch, 2002b). For a recent review on DW-MRI fiber tractography, see Jbabdi and Johansen-Berg (2011).
Connectional anatomy by the structural brain network approach
One possible way of understanding the current explosion of brain network studies (with an impressive increase in the number of reports about anatomical, morphometrical, and functional networks) is the striking similarity between graph representations and our most common intuitive mental representation of the brain. At each possible scale, the brain can be imagined as a set of equivalent units (e.g., neurons, neuronal subpopulations, and functionally/anatomically segregated regions) interacting dynamically among them (via dendrites or axonal prolongations). In principle, to define a graph, we only need a set of elements and some knowledge about their interrelations. In addition to allowing organization and visualization of data, the graph theory also offers topological quantitative measures that, correctly applied, may help to characterize each network in terms of its local and global capacities to deal with the information flow. However, as Olaf Sporns mentioned in a recent review (Sporns, 2011a), around 20 years ago (until the early 1990s) almost no one in neuroscience was interested in graph theory. From this affirmation rises an interesting question: what happened in these two decades that motivated the increasing interest of the neuroscience community for graph theoretical analysis? This subsection attempts to answer this question (see Table 1 for a brief description of graph theoretical concepts employed throughout the text, including associated tentative physiological interpretations within the context of anatomical brain networks).
For detailed mathematical expressions, please refer to the corresponding referenced articles and the review led by Rubinov and Sporns (2010). DW-MRI, diffusion-weighed magnetic resonance imaging.
Early studies that collected neuroanatomical information about gross cortical–cortical connections in some mammalian species (i.e., rat, cat, and macaque monkey) evidenced the difficulty of understanding the organizational principles of such complex systems. A high number of connections and nontrivial patterns are common across long-range connectional matrices collected for the macaque monkey (Felleman and Van Essen, 1991; Hilgetag et al., 2000; Stephan et al., 2000; Young, 1993), the cat (Hilgetag et al., 2000; Kötter and Sommer, 2000; Scannell et al., 1995; Scannell et al., 1999) and the rat (Burns et al., 2000). The exciting complexity of these primary connection datasets inspired the emergence of optimization techniques and hierarchical analysis that demonstrated the not entirely random, nor entirely regular organization of cortical–cortical connectivity networks (Felleman and Van Essen, 1991; Scannell et al., 1995; Young, 1992; Young, 1993). Significant progress on graph theoretical analysis, mainly applied to the study of social networks (Milgram, 1967; Travers and Milgram, 1969), and in particular the publication of a landmark article (Watts and Strogatz, 1998), captured the attention of neuroscientists. The methodologies devoted to the study of brain connectivity patterns were then oriented in a new direction. Previous gross cortical–cortical connections were reanalyzed using graph theoretical elements. Importantly, small-world connectional attributes, as well as the existence of highly connected/central hub regions, were found for all species (Table 1; Hilgetag and Kaiser, 2007; Kaiser and Hilgetag, 2006; Sporns et al., 2000; Sporns and Zwi, 2004; Sporns et al., 2007). Additional analysis of structural and functional motif compositions (Table 1) supported the idea that while brain networks maximize both the number and the diversity of functional motifs, the repertoire of structural motifs is relatively small (Sporns and Kötter, 2004). These results were in line with the findings of a set of remarkable studies that previously combined graph elements with information theory principles to analyze brain integration, complexity, matching, and degeneracy processes (Sporns et al., 2000; Tononi et al., 1992; Tononi et al., 1994; Tononi et al., 1996; Tononi et al., 1999). Results showed that the anatomical organization of the brain responds to an environmentally driven demand for highly complex neural activity, reflecting a high structural potentiality to support functional specialization and integration simultaneously (Sporns et al., 2000; Sporns, 2011a).
The graph framework then began to play a fundamental role, not only in the exploration of animal neuroanatomical connectional information, but also to discover the principles of functional brain interactions in humans. Several studies analyzed the functional brain networks reconstructed under a considerable heterogeneity of connectivity models and temporal datasets, including functional MRI, electroencephalography, magnetoencephalography, and multielectrode arrays (Achard et al., 2006; Achard et al., 2008; Bassett et al., 2006; Eguíluz et al., 2005; Ferrarini et al., 2008; Salvador et al., 2005; Schwarz et al., 2008; Stam, 2004; Yu et al., 2008). Results showed short characteristic path lengths, a high inherent tendency to cluster nodes into strictly connected neighborhoods, economic small-world attributes at many frequency intervals, existence of hub regions, scale-free distributions, and stable modular community structures (Table 1; for related reviews, see Bassett and Bullmore, 2009; Bullmore and Sporns, 2009; Guye et al., 2010; Sporns, 2010). Additionally, these results highlighted the potential of the graph framework to analyze organizational principles of functional interactions and inter-regional connectional anatomy, as well as its relevance for the understanding of neurophysiological integration processes.
However, due to the prominent lack of detailed region–region connectional anatomy information for the human brain, its structural graph-based representation and analysis arose considerably later than earlier studies of other animal species (i.e., rat, cat, and monkey) and even later than human brain functional network studies. To our knowledge, by the end of 2005, only three unpublished academic studies had considered the problem of constructing region–region human brain connectivity matrices using DW-MRI fiber tractography techniques. In his PhD thesis, Tuch (2002b) presented a connectivity matrix between 25 distant points in the cortex, each point representing a different anatomical region, running from the inferior aspect of occipital cortex to the crown of the superior frontal gyrus. Moreover, the anatomical connection strengths between 13 distant gray matter regions were evaluated by means of a connectivity measure designed to avoid undesirable distance effects on probabilistic tractography results (Iturria-Medina, 2004, college diploma thesis). This approach was later applied to the formulation of neural mass models and electroencephalogram generation with anatomically constrained coupling (Sotero et al., 2005; Sotero et al., 2007). Hagmann in his PhD thesis (2005) went further than creating an anatomical connectivity matrix, now between small regions covering all the gray matter of a healthy subject, and proposed studying the topology of the resultant network by means of graph theoretical measures. For the first time, the small-world attribute and hierarchical organization of the anatomical human brain network were reported. In addition, Hagmann introduced the connectome concept in agreement with the simultaneous definition of Sporns and colleagues (2005) related to the mapping of structural interconnections between neural elements at different scales.
In 2007, Iturria-Medina and colleagues proposed a graph-based DW-MRI tractography algorithm that expressed the tractography in terms of shorter path search in an anatomical weighed graph (Iturria-Medina et al., 2007). This formalism allowed a straightforward definition of anatomical connectivity measures (e.g., strength, density, and probability) between the regions of interest, which were used in a subsequent study devoted to the reconstruction and characterization of whole-brain anatomical weighed networks of 20 healthy human subjects (Iturria-Medina et al., 2008). The study reported robust small-world attributes and broad-scale degree distributions (Table 1) for the analyzed networks of 90 cortical and subcortical gray matter structures (Anatomical Automatic Labeling [AAL] parcellation scheme; Mazziotta et al., 1995), with the presence of hub central nodes (e.g., precuneus, insula, superior parietal, and superior frontal cortex) and structural motif compositions similar to those identified in connectional matrices derived from anatomical tract tracing in the cat and macaque cortex (Sporns and Kötter, 2004). Hagmann and colleagues (2007, 2008) considered the advantages of using DSI tractography (Hagmann et al., 2005; Wedeen et al., 2008) to reconstruct the anatomical brain networks of healthy human subjects. In the first study (Hagmann et al., 2007) was reported one-scale degree distribution and small-world attributes of networks with 500 to 4000 nodes, covering all the cortical gray matter regions and the thalamus of 2 subjects. In the second study (Hagmann et al., 2008), anatomical networks with a spatial resolution of 998 nodes and a lower resolution of 66 nodes, covering all the cortical gray matter regions of 5 healthy subjects, were analyzed. This work reported the consistent presence of a structural core (with internal regions sharing high degree, strength, and centrality) within the posterior medial and parietal cerebral cortex, as well as the presence of several distinct temporal and frontal modules. Moreover, a high correspondence between anatomical connectivity and resting-state functional connectivity patterns within the same subjects was found.
Several other studies have reconstructed anatomical networks for the healthy human brain using DW-MRI tractography techniques (Fig. 1 illustrates key steps involved in network reconstruction). The influence of node selection on anatomical network properties was analyzed by Zalesky and colleagues (2010a), who found a considerable network dependency on the choice of parcellation schemes (we comment more about this issue in the Current Limitations and Future Directions section). Analysis of age and gender effects on the network properties (Gong et al., 2009) revealed an age-related reduction of overall cortical connectivity and local efficiency, with a shift of regional efficiency from the parietal and occipital to frontal and temporal neocortex in older brains. Moreover, women presented greater overall cortical connectivity than men, and the underlying organization of their cortical networks was also found more efficient, both locally and globally. Bassett and coworkers (2010a) investigated the conservation of network architectural properties across various methodologies, as well as the reproducibility of results across multiple scanning sessions. They found consistent basic connectivity properties and reproducible graph metrics for different intravoxel fiber orientation models (i.e., DTI and DSI). This group also reported (Bassett et al., 2010b) that human anatomical and morphological brain networks obey Rent's Rule, an isometric scaling relationship between the number of processing elements and the number of connections commonly observed for large-scale integrated computer circuits (Landman and Russo, 1971). Interestingly, these authors found that estimated Rent exponents of both anatomical and morphological human brain networks can explain the allometric scaling relations between the gray and white matter volumes across a wide range of mammalian species, from the mouse opossum to the sea lion. In another multispecies study, Iturria-Medina and colleagues (2011a) reported consistent connectional asymmetry patterns across human right-handed subjects and a macaque monkey subject, suggesting that general organizational asymmetries are broadly similar between these primate species (i.e., the right hemisphere is significantly more interconnected and efficient, whereas the left hemisphere has more central or indispensable regions for the whole-brain anatomical network).
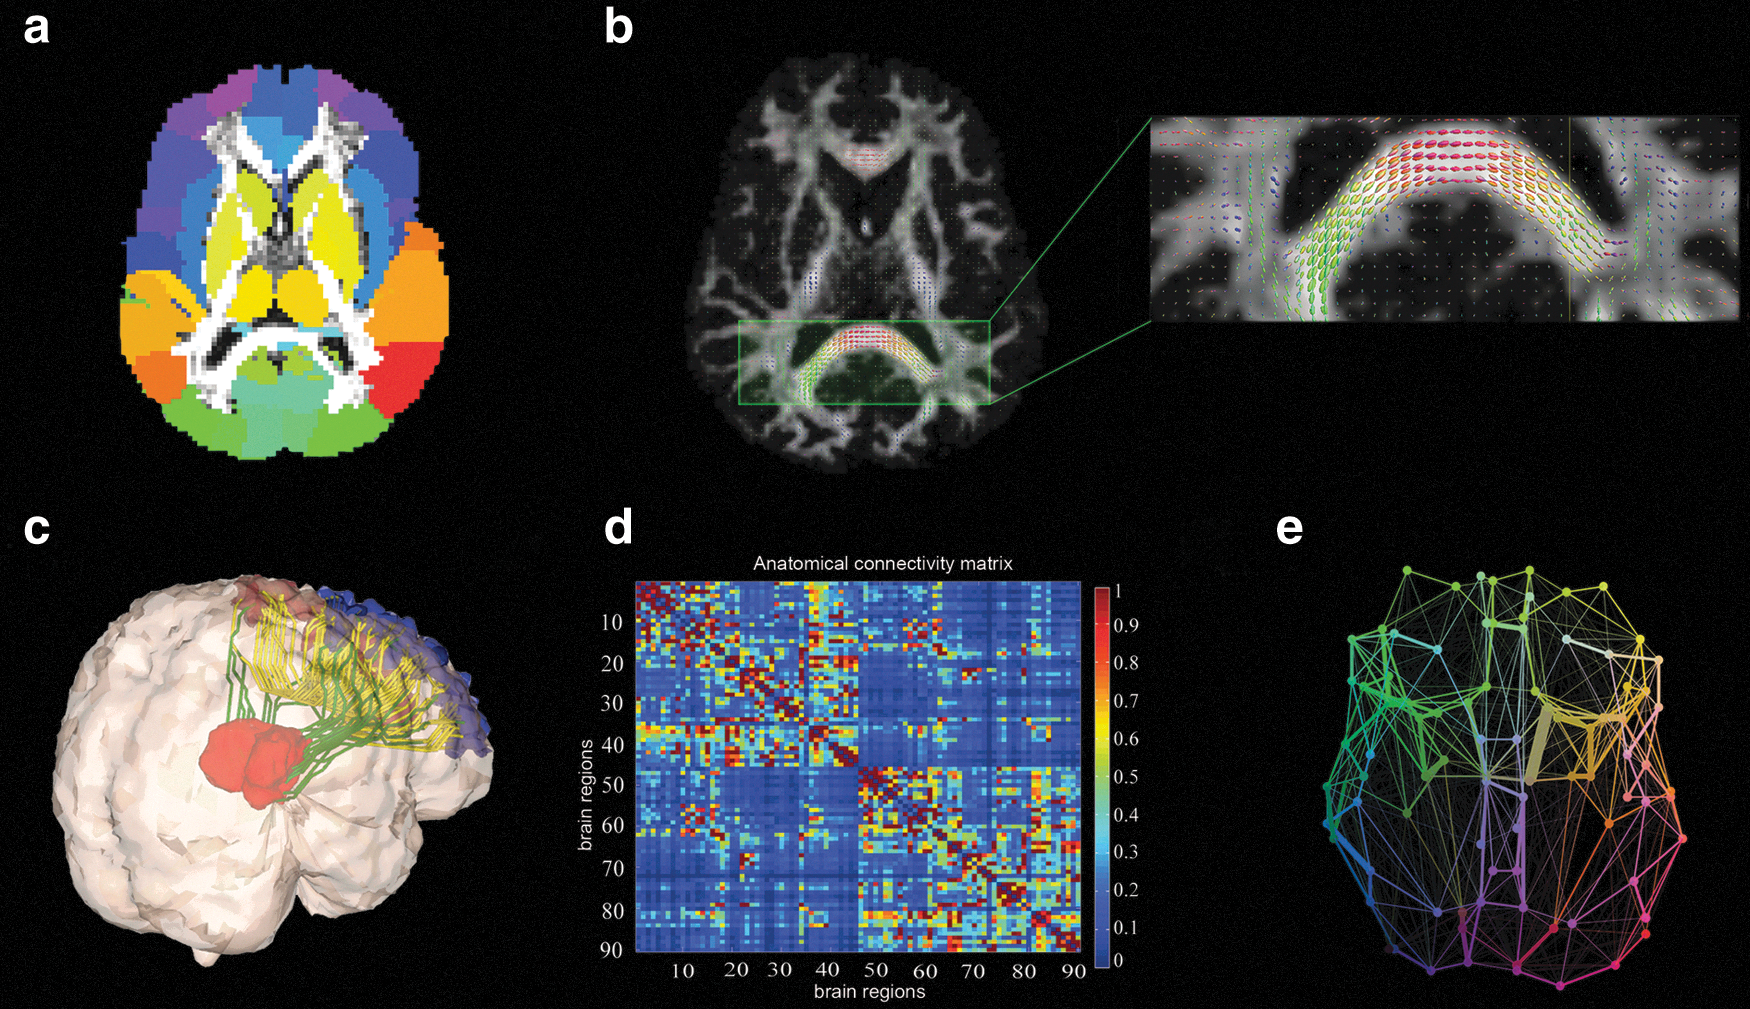
Key steps involved in the reconstruction of anatomical brain networks using connectional information extracted from diffusion-weighed magnetic resonance-imaging (DW-MRI) data.
This latter study (Iturria-Medina et al., 2011a) emphasized the use of three different probabilistic tractography algorithms that provided more stable results in comparison to those obtained separately for each tracking algorithm. As a consequence, the final results were less influenced by the initial choice of a tracking algorithm that is potentially a significant source of bias. More recently, Bastiani and coworkers (2012) analyzed the effects of using different fiber tractography algorithms, intravoxel fiber orientation models, and tractography parameters on the final properties of the derived anatomical networks. The authors found a large effect of tractography algorithm and parameter selection on the network connectional density and topological properties. These results are of particular importance to the researcher planning a new brain network analysis using the DW-MRI data, since it provides crucial comparative results based on more frequently used anatomical network reconstruction approaches. Similarly, Duarte-Carvajalino and coworkers (2012) provided crucial methodological information related to the influence of different region–region arc weight normalization procedures on the characterization of individual anatomical network properties. Their results illustrate how different arc weight normalizations induce considerable differences on classification accuracies related to sex and kinship, as well as on corresponding intergroup network topological comparisons.
From the Macroscale Connectome to the Prediction of Abnormal Brain States
The last 5 years have seen an increase in the number of publications addressing the identification of morphometrical, anatomical, and functional alterations associated with abnormal brain states by means of brain network theoretical approaches (for recent reviews, see Bassett and Bullmore, 2009; Bullmore and Sporns, 2009; Guye et al., 2010; Lo et al., 2011; Wen et al., 2011; Xia and He, 2011). In particular, anatomical brain networks reconstructed using DW-MRI techniques have been applied to the study of diseases such as schizophrenia (Skudlarski et al., 2010; van den Hevel et al., 2010; Wang et al., 2012; Zalesky et al., 2011), MS (Shu et al., 2011), AD (Lo et al., 2011), epilepsy (Zhang et al., 2011), and amyotrophic lateral sclerosis (Verstraete et al., 2011). These studies have contributed to the recognition of anatomical alterations and related abnormal pathophysiological mechanisms, mainly based on the finding of modified network topological properties (e.g., clustering, characteristic path length, and small-worldness indices) and the detection of disconnected subnetworks (Zalesky et al., 2010b; Zalesky et al., 2012). In both cases, these findings emerged from statistical comparison between subpopulations (i.e., typically a patient group and an age- and gender-matched control group).
Graph-based theoretical analyses comparing statistically different subpopulations are often considered as potential tools for the identification of biomarkers for clinical diagnosis (i.e., indicators of the severity or presence of some pathophysiological state, with the capacity of quantifying individual normal/abnormal process or pharmacologic responses to therapeutic interventions). However, it is important to note that a given methodology proposed as a potential biomarker should not only demonstrate its capacity to identify subpopulation differences, but also show a predictive power for each new individual. This issue has caused several recent misinterpretations. While the identification of significant differences between subpopulations satisfies the purpose of identifying dissimilar group tendencies (for a given anatomical, morphometrical, and/or functional brain property), a more complex predictive analysis is required to distinguish to which group new individuals belong.
In other words, the finding of statistically significant differences between subpopulations does not necessarily imply an accurate prediction for each new individual, and logically, they have different conceptual interpretations. The former (the finding of statistically significant differences between subpopulations) occurs when the probability of observing the effect of interest by chance is negligible, given the currently analyzed dataset. The latter (the accurate prediction for new individuals) depends on the capability of the method to classify or to predict new instances of individual datasets. It is common to obtain low prediction accuracy after ensuring that the features used for the prediction are statistically different between subpopulations. Consequently, when pursuing prediction accuracy, the report of test errors is a mandatory procedure (Bishop, 2006).
As a particular example of the previous issue, it is not the same to identifying group differences related to age (Gong et al., 2009) than to predict the age of a given subject to quantitatively investigate if abnormal structural/functional maturity properties are present compared to its chronological age (Dosenbach et al., 2010; Duarte-Carvajalino et al., 2012; Robinson et al., 2010). The former can provide evidence about the transformations related to the aging process, and in some cases can contribute to a better understanding of the pathophysiological mechanisms underlying behavioral differences between compared groups. The latter (i.e., the prediction of individual brain maturity states) represents an attempt to understanding the age–behavior relationship of a subject, given specific structural/functional brain properties. This approach is more closely related to the individual requirements of clinical diagnosis (in the simplest definition, the identification of the phenomenon causing specific clinical symptoms in a patient). It is also more useful for individual neurodevelopmental evaluation, something with a possible outcome on the assisted creation of educational strategies for subjects with cognitive disorders. For these reasons, and as mentioned in the Introduction section, this article is not intended to examine studies in which the main purpose was only to recognize statistical subpopulation differences in the anatomical networks associated with specific brain diseases (for a review more focused on this kind of analysis, see Xia and He, 2011). Rather, by focusing on the exigent requirements of clinical applications and, specifically, of individual clinical diagnosis, the following subsections are devoted to the description and analysis of recently published graph-based theoretical studies in which anatomical brain networks have been applied to the prediction of abnormal brain states.
Secondary degeneration after stroke and spectral clustering of anatomical communicability networks
Anterograde or retrograde axon degeneration process and adaptive anatomical changes are some of the structural changes after a stroke (i.e., a sudden blockage or rupture of a blood vessel in the brain that can be clinically silent and have the potential to provoke a wide variety of damages, such as loss of speech, weakness on one side of the body, or dementia later on in life; Biernaskie and Cobett, 2001; Dancause et al., 2005). In 2009, Crofts and Higham proposed to use a new weighed anatomical network communicability measure to distinguish local and global differences between patients with stroke and controls. This network measure extended the previous concept of network communicability (Estrada and Hatano, 2008) to the case of weighed networks, thereby addressing the issue that the existence of a direct edge does not necessarily capture the degree of connectedness between a given pair of nodes if they can be joined through a long chain of edges.
In the context of anatomical brain networks, communicability should be understood as a measure of how easily information can flow between network nodes (anatomical or functional regions), using direct and indirect fiber path connections (Crofts and Higham, 2009). In this study, anatomical and communicability networks for 9 patients with stroke (at least 6 months after the first, left hemisphere, subcortical stroke) and 10 age-matched controls were defined using the Harvard-Oxford cortical and subcortical structural atlases, as implemented in FSL Software with 56 anatomically distinct gray matter regions (Smith et al., 2004), and estimating fiber pathways by means of a probabilistic tractography algorithm (Behrens et al., 2003a). To explore how accurately the reconstructed networks can represent the known stroke/control groupings, unsupervised spectral clustering based on singular-value decomposition (SVD) was then performed over the set of all region–region connectivity or communicability values. Spectral clustering algorithms based on SVD consider the eigenvalues and eigenvectors of the Graph-Laplacian matrices (Table 1) corresponding to the studied networks (Higham et al., 2007); therefore, within the framework of anatomical/communicability brain networks, this clustering procedure evaluates intrinsically the robustness and hierarchical organization of each individual network, as well as the dynamics of the potential functional interactions. The results indicated a perfect classification between patients with stroke and controls (i.e., a correct separation/distinction in all cases between pathological and healthy subjects) for the communicability networks, whereas classification based on the purely anatomical networks or their normalized version had not successfully dealt with the separation issue.
A second, related study (Crofts et al., 2011) focused on finding structural evidence related to secondary degeneration of nervous fibers after a stroke, which supposedly occurs in the remote regions connected directly or indirectly with the infarct zone. In line with the preceding study, connectivity and communicability hemispheric subnetworks were reconstructed for 9 patients with chronic stroke and 18 age-matched controls. Interestingly, the unsupervised spectral clustering of reconstructed subnetworks correctly separated patients from controls based not only on the information related to the damaged left hemisphere, but also on the data from the contralesional right hemisphere (see Fig. 2). Results based on the communicability network measure again provided better prediction accuracy than those obtained using direct anatomical connectivity or even using the anatomical and communicability degrees of the considered regions.
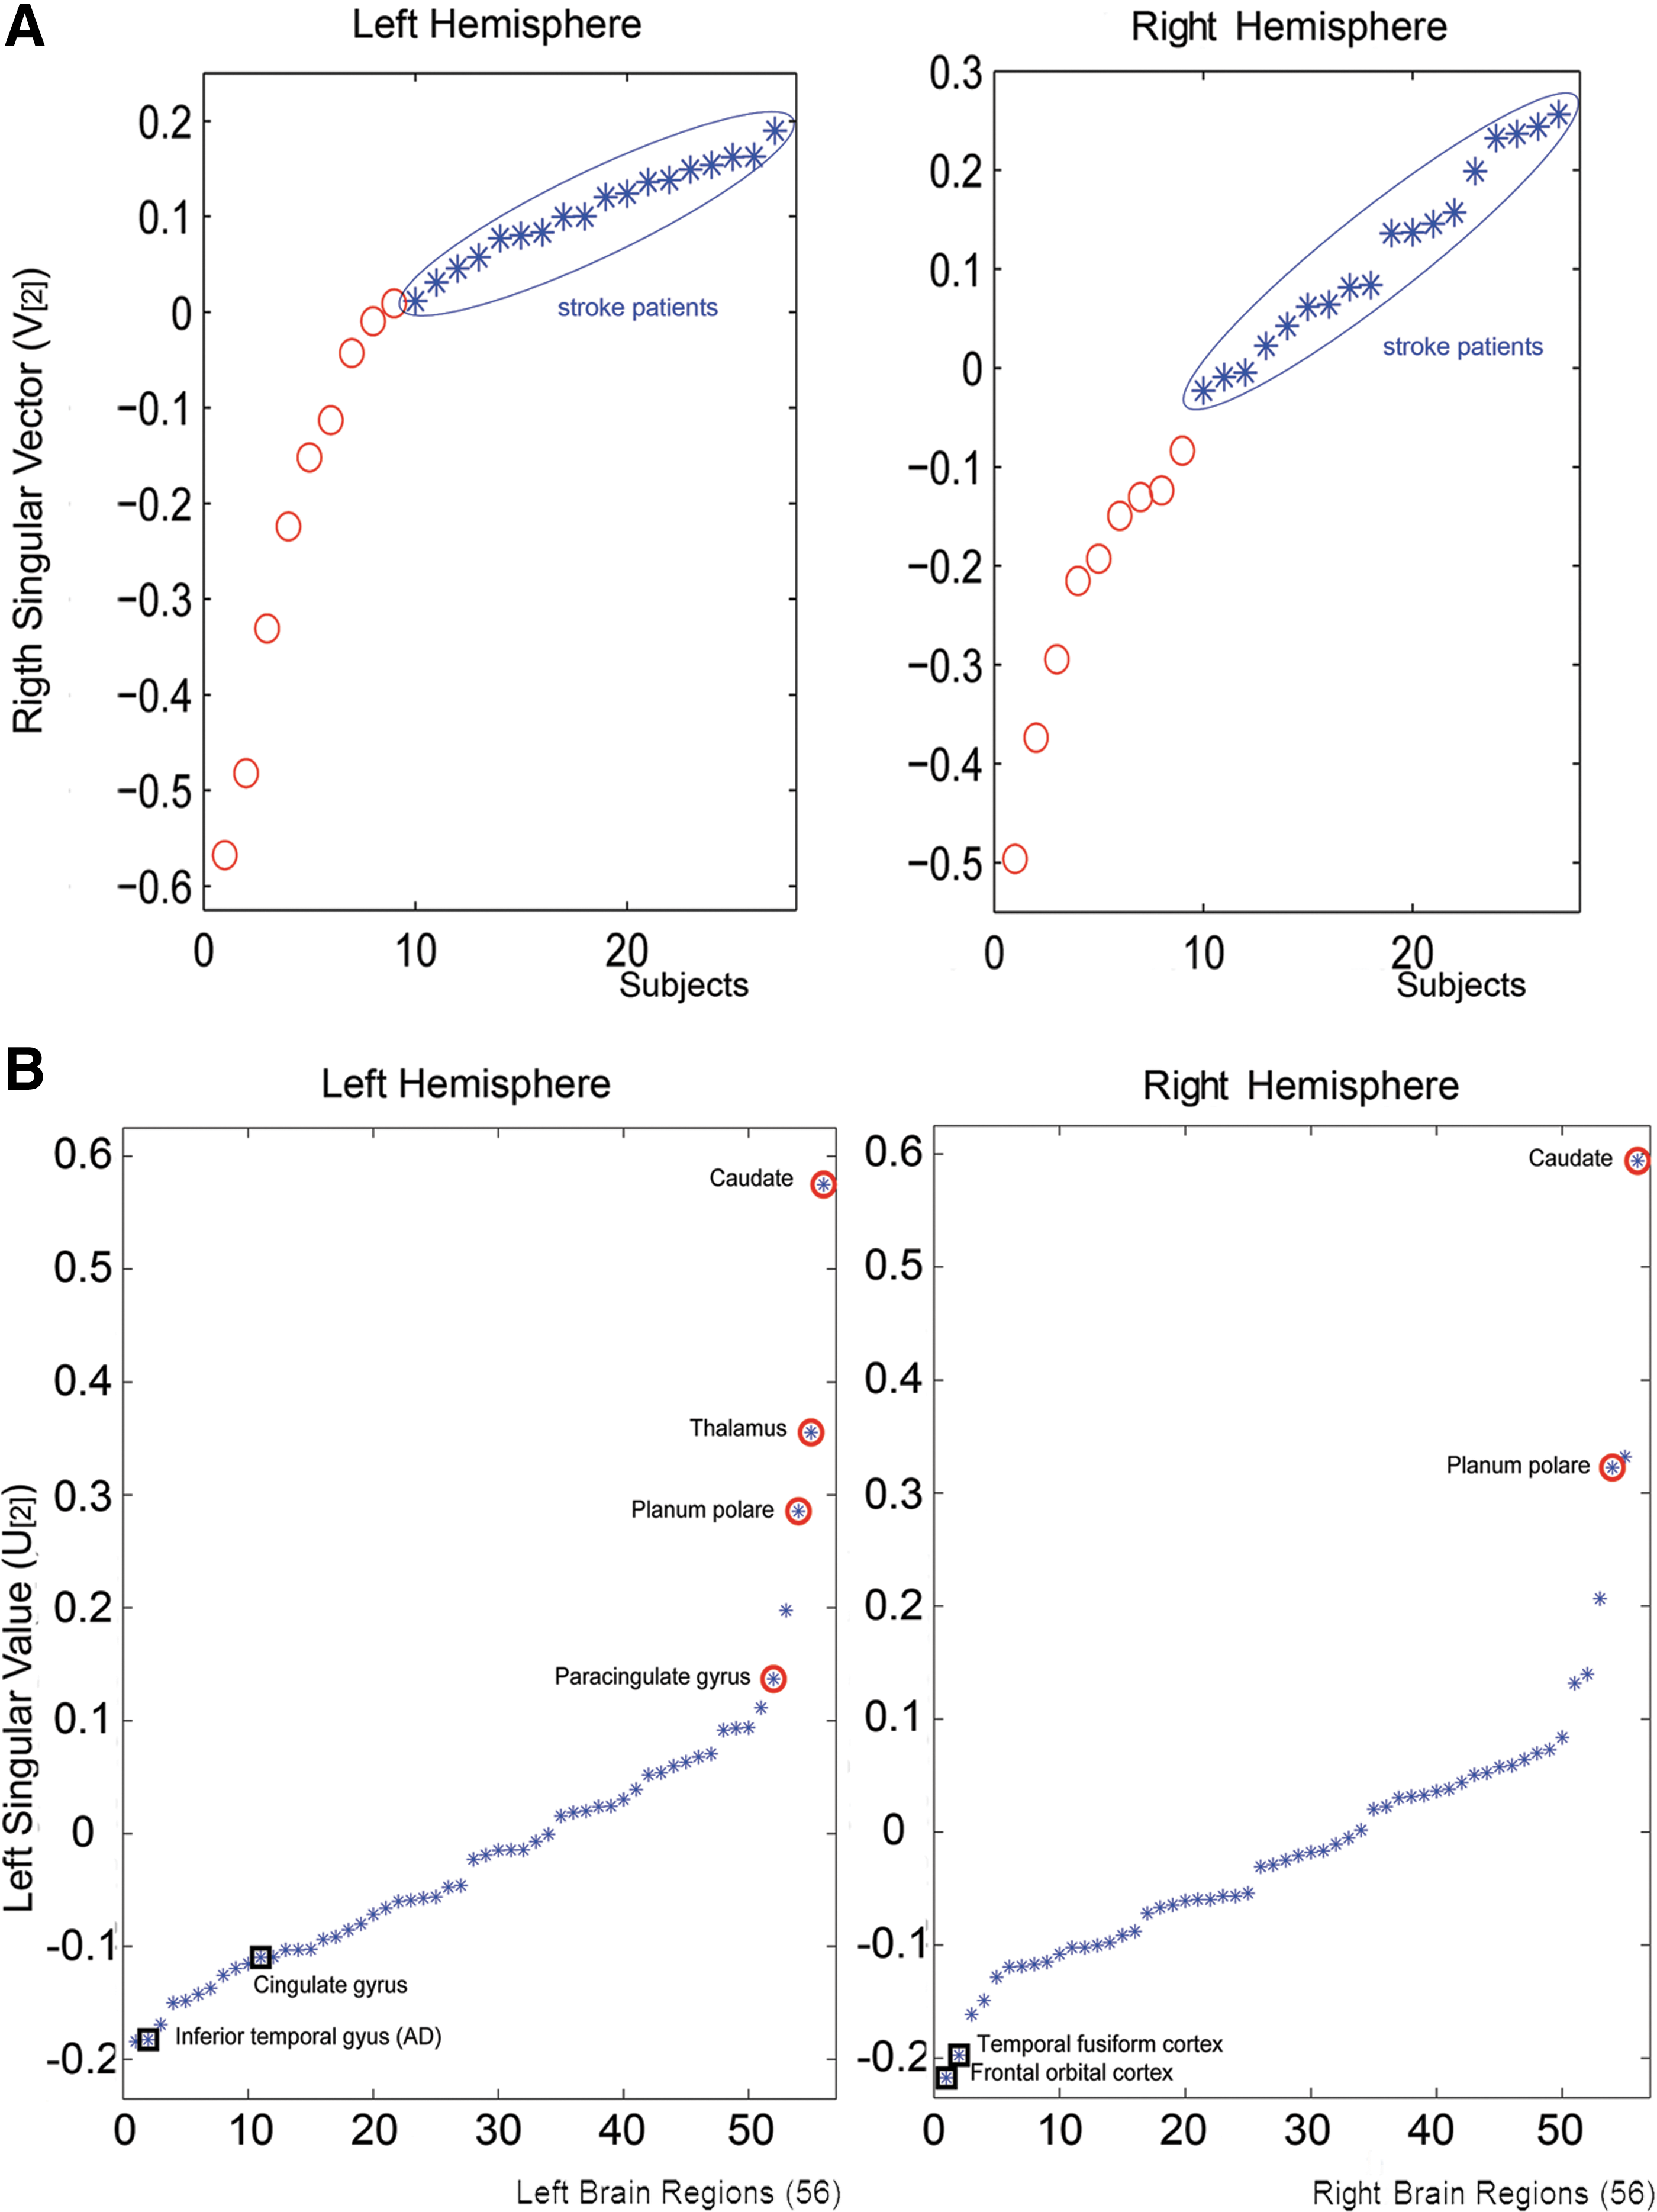
Unsupervised spectral clustering results for communicability hemispheric subnetworks.
In a next step, the authors then tried to identify the brain regions that drove the separation between groups. To this aim, they used the same SVD results (Higham et al., 2007), but also taking into account the spectral information corresponding to the network nodes (i.e., the left singular value u[2] consisting of 56 components corresponding to the same number of hemispheric brain regions). Figure 2b shows the obtained u[2] components, where the extreme values (most positive or most negative) correspond to the regions whose communicability patterns can be assumed to be responsible for the correct separation between subjects. Note, for example, the extreme values of homologous regions such as the left/right caudate nucleus and the left/right planum temporale, which were also found with a significantly reduced communicability degree. In general, all areas with reduced communicability tended to be structurally located around the stroke lesions in the left hemisphere (i.e., the internal capsule and the basal ganglia) or around the homologous regions in the contralesional hemisphere, which can be interpreted as consistent evidence of secondary degeneration of nervous fibers. These effects on the contralesional hemisphere's white matter integrity have not been observed consistently in other studies using more conventional measures, such as fractional anisotropy (FA; Liang et al., 2007; Bosnell et al., submitted for publication), which reflects the increased sensibility of communicability networks to subtle changes in the brain. Additionally, as a tentative sign of adaptive and plastic poststroke changes, patients showed significant increased communicability compared with controls in some regions. This observation is in line with described anatomical and functional plasticity in patients with stroke (Johansen-Berg et al., 2002; Lotze et al., 2006; Schaechter et al., 2009). However, preliminary correlation analyses between the communicability degree of each region and the Fugl-Meyer scores, the stroke volumes, and the times poststroke revealed nonsignificant linear relationships. Thus, the hypothesis of an increased communicability reflecting adaptive and plastic poststroke changes should be considered with care and requires further validation.
Dysmyelination/demyelination process and network-measure spatial representations
Animal models have traditionally been a key element in the design and validation of therapeutic interventions. For instance, the shiverer mouse is a mutant model relevant to the study of myelin-related diseases, since it is characterized by a deletion of the gene encoding myelin basic protein, resembling the white matter dysmyelination and demyelination process that takes place in humans due to inflammatory processes, as in patients affected by MS (Filippi and Agosta, 2010; Ormerod et al., 1987; Tyszka et al., 2006) and acute disseminated encephalomyelitis (ADE) (Almendinger et al., 2010; Jones, 2003). On the other hand, both MS and ADE have a wide variety of clinical and radiological phenotypes, with atypical cases that confound accurate diagnoses. Traditional image interpretation requires expert intervention, which is commonly based on subjective tuning parameters. For example, the McDonald criteria for MS require around nine visible T2 lesions (McDonald et al., 2001).
Motivated by limitations of conventional MR diagnostic tools for myelin-related diseases such as MS and ADE, Iturria-Medina and coworkers (2011b) investigated whether possible changes on the anatomical brain networks in the shiverer mutant mouse model reflect individual dysmyelination/demyelination process, allowing for the automatic discrimination of myelin-affected subjects. The study used a super-resolution DW-MRI dataset (with 80-μm isotropic voxel size) for six shiverer (C3Fe.SWV Mbpshi/Mbpshi) and six background control (C3HeB.FeJ) mice (this dataset is available as a part of the Biomedical Informatics Research Network initiative).
For each mouse, whole-brain axonal trajectories were reconstructed using three different fiber tractography algorithms: traditional streamline (Mori et al., 1999), tensor line (Weinstein et al., 1999), and tensor deflection (Lazar et al., 2003). Then, three individually weighed networks were reconstructed, in which each node corresponded to an anatomic brain region (150 gray matter regions in total); arcs connecting nodes corresponded to hypothetical white matter links; and arc weights were assigned according to the degree of DW-MRI evidence, supporting the existence of white matter connections between regions. In fact, arc weights between any two nodes were defined as the number of connecting fiber trajectories relative to the superficial area of the nodes, where each fiber path was quantified according to the mean of the inverse of its mean diffusivity values (i.e., (1/N)Σi(1/MDi), where MDi is the mean of the diffusion tensor's three eigenvalues on each voxel i=1.N belonging to the path). The selection of MD as an indirect measure of changes in potential fiber pathway efficacy in the mouse brain was motivated by the fact that MD is a measure of the local average molecular motion, independently of tissue directionality, which is expected to reflect the cellular size and, consequently, fiber integrity (Basser et al., 1994; Cercignani et al., 2001; Pierpaoli et al., 1996). Importantly, significant decreases of MD have been reported for many regions of pathological brains characterized by myelin deficiency, whereas only small variations (practically not informative) of other diffusion tensor-invariant scalars such as FA were found (Bar-Shir et al., 2009; Tyszka et al., 2006). Finally, for the whole-brain anatomical networks, six different topological properties were evaluated: clustering, characteristic path length, modularity, global efficiency, local efficiency, and small-worldness (Table 1).
Before testing the discrimination power of the evaluated six topological properties (each one recalculated for each network produced by the different fiber tracking algorithms), subject data were graphically represented to organize and interpret intuitively the results. For each network measure, its characteristic representation space was defined, in which subjects were represented by unique points in a 3D space attending to its resulting topological properties (coordinates corresponding to different tracking algorithm outcomes; Table 1). Figure 3 shows locations of shiverer and control mice in the 3D Euclidian spaces corresponding to the created network measure representation spaces. In each representation space, subjects are graphically represented and determined by a unique spatial point, with length, width, and depth coordinates assigned according to network values obtained from three different fiber-tracking algorithms. Note the clear spatial subdivisions between control and shiverer mice for almost all the network measures, suggesting that there might exist specific network subspaces corresponding to specific brain disorders, at least at the super-resolution imaging considered. Linear discriminant analysis (LDA) was then used (Bishop, 2006) to assess the between-group discriminative reliability of these anatomical network topological features. For each network measure, the mean boundary hyperplane that best separated the original representation space into two subspaces was obtained, with subjects who presented similar spatial positions (anatomical network attributes). In addition, for each network measure and for their overall combination, the individuals' conditional probabilities of belonging to the control group (i.e., the individualized probabilistic evidence supporting a normal connectional anatomy) were obtained by means of the LDA, as an anatomical index of the likelihood of being a healthy subject.
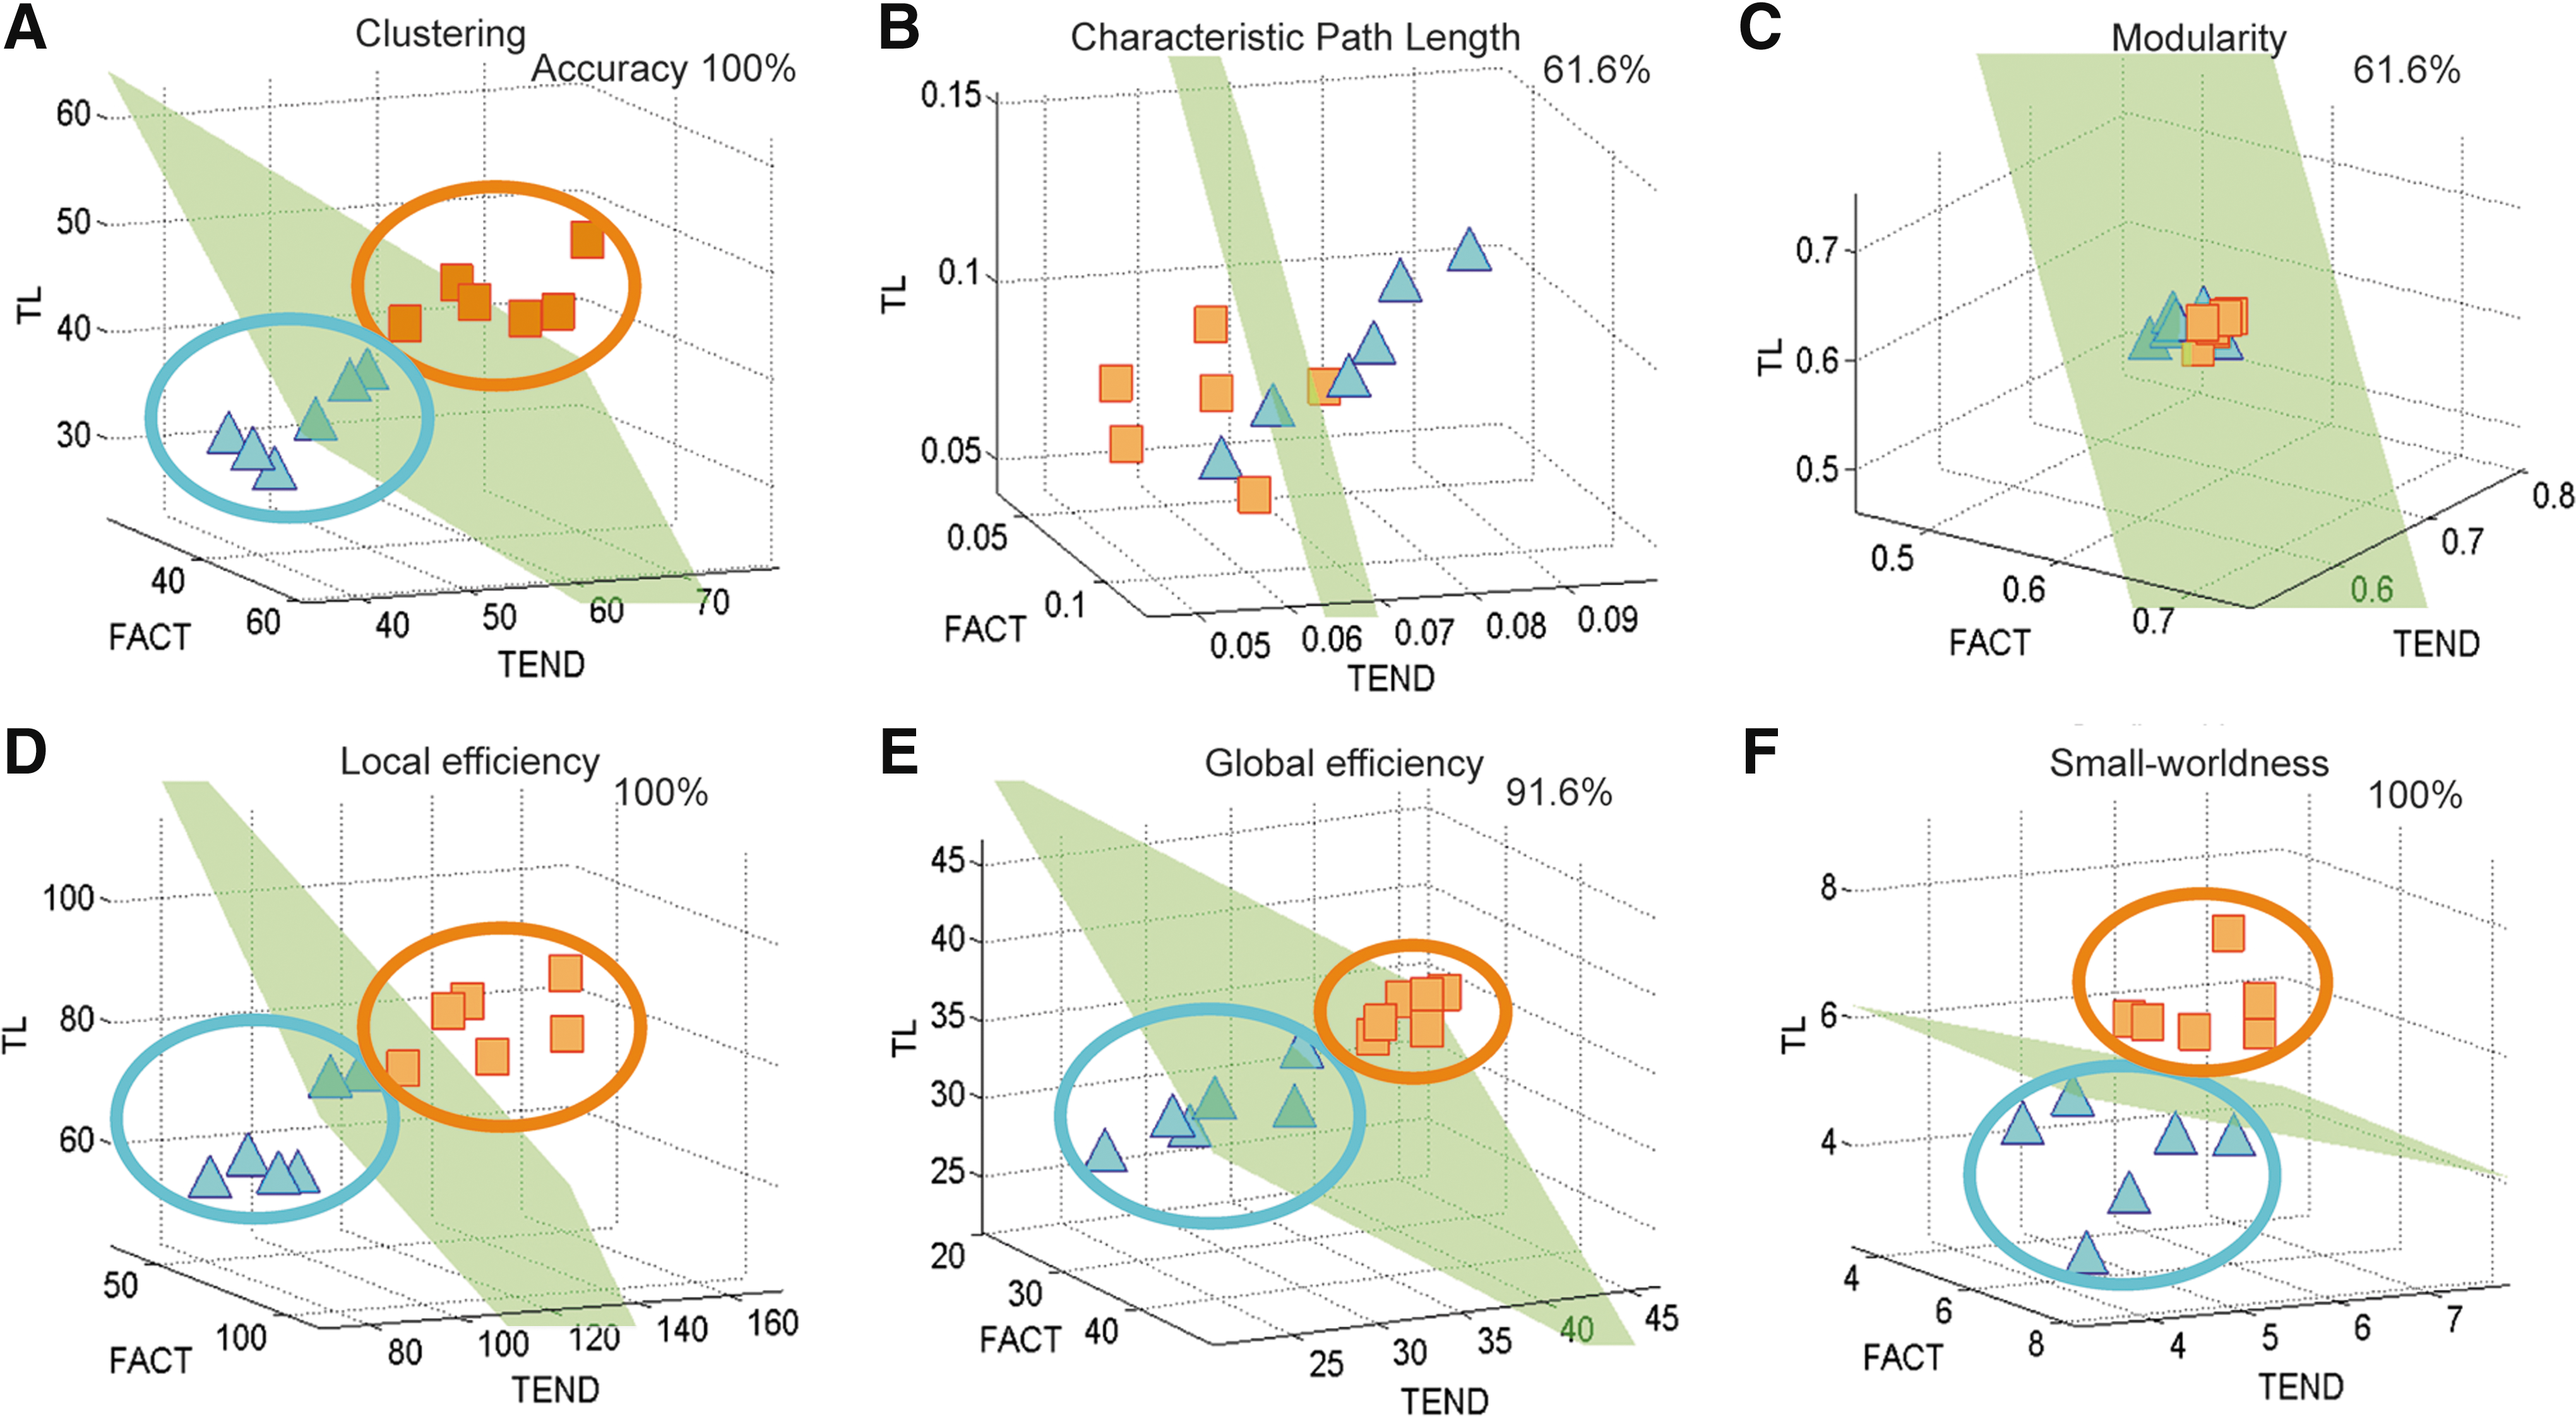
Three-dimensional brain network measure representation space for
The high accuracy of predictions (e.g., in the range 91.6%–100% correct for four of the six topological network measures) and clear spatial subdivisions between control and shiverer mice (see Fig. 3a, 3d, 3e, and 3f) supported the point of view that complex brain network analyses are promising tools for finding interpretable imaging biomarkers. In addition, the introduced network measure representation space concept is a good alternative to summarize and visualize the network topological properties estimated by different methodologies (e.g., different fiber-tracking algorithms or even different network extraction modalities, such as DW-MRI, electroencelography, magnetoencelography, and functional MRI). However, before reliable clinical applications can be considered, further studies need to explore the following issues. First, the reliability of the proposed prediction procedure to reflect different levels of lesion profiles and disease states should be tested (all shiverer mice employed were theoretically at the same disorder state and genetically equivalent, so that it was impossible to analyze other factors such as temporal progressions or different white matter lesion affectations). Second, the reproducibility in human data that present different properties due to image resolution and contrast should be further explored.
A remarkable result of this study was the finding that the combination of the network properties produced by various fiber-tracking algorithms provided a greater consistency in the prediction results compared to those obtained using the network properties produced by only one fiber-tracking algorithm (e.g., a final mean prediction accuracy across all considered network measures increased in the range 3.58%–13.09% compared to the single fiber-tracking algorithm-based prediction cases). This finding is related to the fact that the used fiber-tracking algorithms have been designed differently to take into account the intrinsic limitations of the DW-MRI datasets (Lazar et al., 2003; Mori et al., 1999; Weinstein et al., 1999). As reported by Jing Li and colleagues (2005), each of these fiber-tracking algorithms presents advantages and limitations compared to the others, so that it is realistic to expect a better description of the brain's structural complexities based on the complementary combination of their results.
Enriched white matter connectivity networks and resting-state functional MRI networks for the identification of patients with mild cognitive impairment
Mild cognitive impairment (MCI) is often a transition phase between normal state and AD. Although the early detection of MCI is of critical importance for early diagnosis and intervention in AD, the apparently irrelevant symptoms of MCI often make it difficult to diagnose. Wee and colleagues (2011) proposed a solution to discriminate MCI subjects from normal controls based on a network-based multivariate classification algorithm that uses several measures derived from white matter connectivity networks. They first created an enriched description version of white matter connections utilizing six tentative parameters of fiber physiology, that is, tractographic fiber pathway counts, mean FA, mean MD, and mean principal diffusivities (λ1, λ2, and λ3) along each connection trajectory. This resulted in six individual networks that accounted for the connection topology and the biophysical properties of patients with MCI and age-matched controls. Then, a leave-one-out cross-validation support vector machine (SVM) procedure was used, in which each subject was finally classified as patient with MCI or normal control after reducing the initial set of topological and biophysical features by means of a Pearson correlation-based feature ranking and an SVM-based feature selection. In line with previous studies aimed to the identification of regional abnormalities in MCI subjects (Davatzikos et al., 2008; Davatzikos et al., 2011; Fan et al., 2008; Misra et al., 2009), the most discriminant regions selected for individual classification were the rectus gyrus, insula, and precuneus. Classification results indicated a 88.9% discrimination accuracy between patients with MCI and normal controls, and an area of 0.929 under the receiver-operating-characteristic (ROC) curve, with an increase of at least 14.8% from discrimination accuracies obtained using any single physiological parameter (i.e., tractographic fiber pathway count, FA, MD, λ1, λ2, or λ3).
Subsequently, the authors improved their own method, incorporating for the first time both physiological and functional network measurements simultaneously in the construction of discrimination tools (Wee et al., 2012). In addition to the enriched description version of white matter connections, functional brain networks were reconstructed using resting-state functional MRI data. Pairwise Pearson correlation coefficients between temporal signals of pair of regions were computed as functional connectivity measures, for five equally divided frequency sub-bands. A multiple-kernel SVM was then introduced to integrate features coming both from anatomical and functional connectional information. Testing with the same groups of MCI and control subjects, classification accuracy based on the multimodality approach increased at least from 7.4% compared to the single modality-based classification. Thus, the diagnostic power was excellent with a final 96.3% of discrimination accuracy and an area of 0.953 under the ROC curve. Even when discrimination analyses were performed using a small sample size (i.e., 10 patients with MCI and 17 age-matched controls), the excellent multimodality classification results obtained in this study support the idea that anatomical and functional brain networks contain complementary information that, when correctly combined, allows for considerable improvements of the sensibility and specificity of current clinical diagnostic tools.
Disease progression in dementia and network diffusion propagation models
Like infectious prionopathies, many noninfectious neurodegenerative diseases, such as AD and frontotemporal dementia (FTD), are associated with the accumulation of fibrillar aggregates of proteins [e.g., tau and amyloid-β (Aβ) and α-synuclein; Frost and Diamond, 2010]. Due to the similarity with prion diseases, analogous prion-like disease agent transmission mechanisms along neuronal pathways have been proposed to explain the underlying process of noninfectious neurodegenerative diseases (Frost and Diamond, 2010). Inspired by this hypothesis, Raj and colleagues (2012) recently proposed a landmark approach in which prion-like transmission progression mechanisms in dementia are mathematically expressed by a Network Diffusion Model mediated by the brain's connectional anatomy.
According to the introduced diffusive spread model (Raj et al., 2012), the increase over time of the number of diseased afferents from a region R2 to any region R1 depends upon the disease concentration factor in both regions and upon the anatomical connection strength between them. Moreover, temporal atrophy of a given cortical region is assumed to result from the accumulation of its diseased concentration factor, whereas total brain cortical atrophy at any moment in time can be evaluated as the sum of the atrophy damage over all individual regions. Importantly, the authors solved the set of differential equations, guaranteeing the preceding assumptions for all pairs of possible gray matter regions, and they obtained simplified temporal expressions for both local and global cortical atrophy patterns, which resulted in the linear combination of eigenmodes of the anatomical brain network's graph-Laplacian (H) (Table 1). In spite of the relative complexity of this model compared to more commonly used graph–theoretical analysis, its evaluation is almost reduced to the precomputation of a set of elementary transformations over the anatomical brain network. This allows obtaining the graph-Laplacian H, and the subsequent introduction of H's eigenmodes/eigenvalues in a simple temporal cortical atrophy expression with a deterministic time-dependent exponential component and a case-dependent random component, determined by the initial configuration of the disease. Due to the exponential dependence of the temporal cortical atrophy expression with H's eigenmodes/eigenvalues, the eigenmodes with large eigenvalues have a quick decay, thereby only contributing to the final expression the eigenmodes with small eigenvalues, subsequently denoted as persistent modes (i.e., the lower the decay rate of a given persistent mode, the more widespread and severe the associated cortical damage). Finally and again based on the observation of the temporal cortical atrophy expression, the authors hypothesized that H's persistent modes should be homologous to known patterns of atrophy in several degenerative dementias. By contrast, the corresponding eigenvalues should reflect the associated population-wide prevalence rates.
To explore the performance of the model with real data, whole-brain anatomical networks were reconstructed for 14 healthy young subjects using HARDI datasets and the 90 cortical and subcortical structures of the AAL gray matter parcellation scheme (Mazziotta et al., 1995). For each of these subjects, intravoxel fiber orientation distribution functions were estimated using the qball reconstruction approach (Tuch, 2002b; Tuch, 2004). Region–region axonal connectivity values were estimated via a probabilistic fiber tractography algorithm (Behrens et al., 2007), and final individual network extraction was based on previously described methodologies (Iturria-Medina et al., 2008; Raj and Chen, 2011). In addition, T1-weighed MR scans of 18 AD subjects, 18 subjects with the frontal behavioral variant of FTD (bvFTD), and 19 age-matched controls were used to estimate mean cortical atrophy for each diseased group and AAL region (i.e., cortical atrophy for a given region was measured as the normalized deviation of the mean group volume compared to the mean volume of the age-matched control group).
Consistent with the theoretical predictions, Raj et al. (2012) found that the second and third eigenmodes of H (i.e., the graph-Laplacian of the mean anatomical network of the healthy young subjects) were in visual correspondence and significantly correlated with the atrophy patterns observed in the AD and bvFTD groups. The fourth eigenmode showed atrophy patterns common to Huntington's disease (HD) and to other corticobasal pathological process occurring less frequently. Also, the inverse value of the second, third, and fourth eigenvalues strongly reflected previous population prevalence rates published for AD, bvFTD, and HD, respectively (see Fig. 4a). Figure 4b shows the match between the published relative prevalence of AD and bvFTD as a function of age and the prevalence curves predicted by the theoretical model.
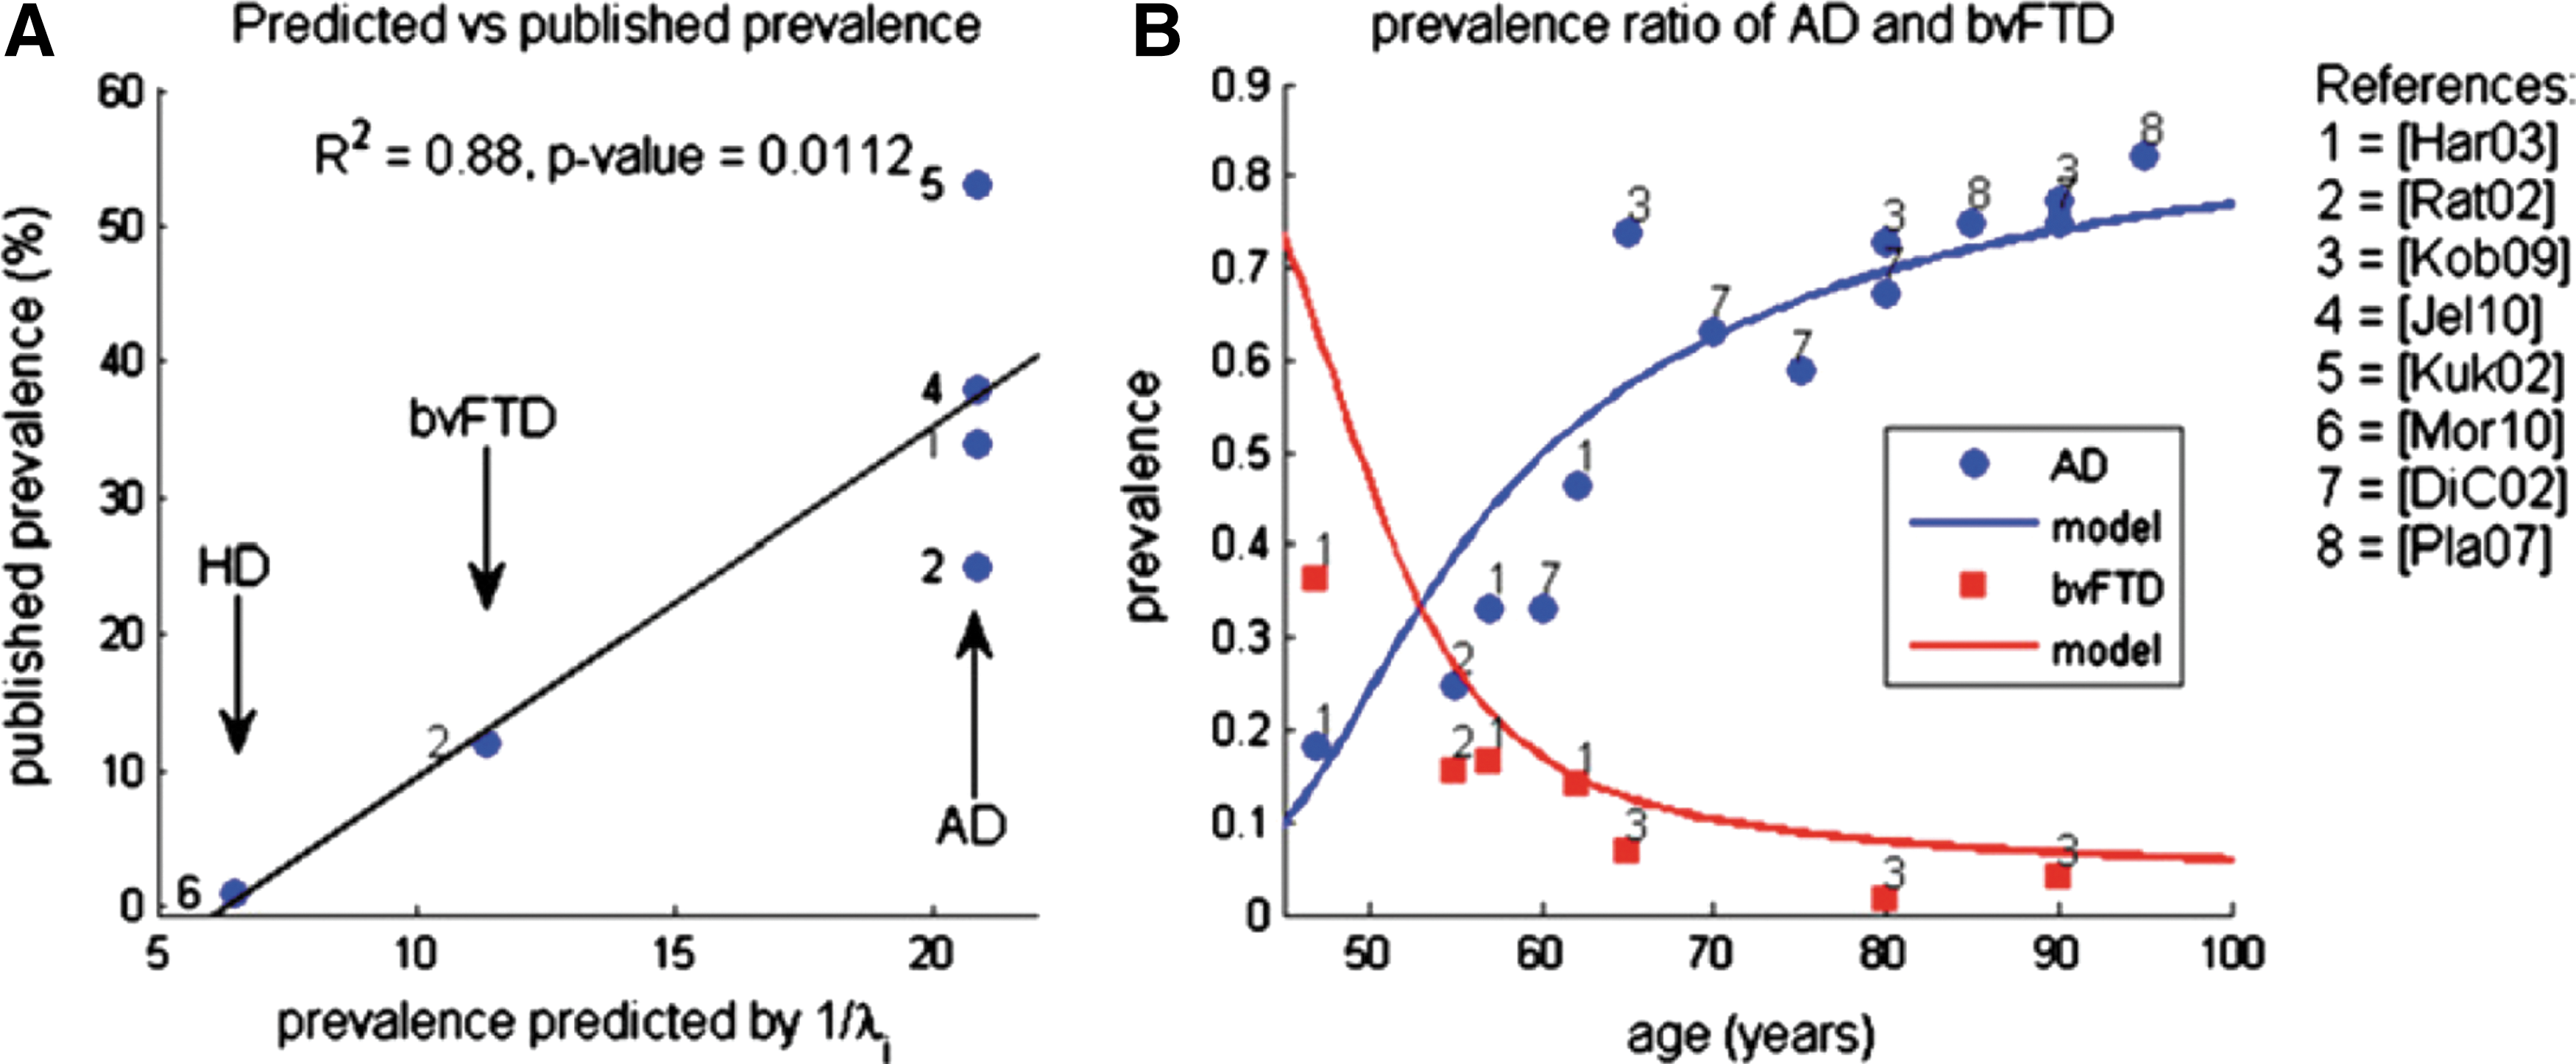
Prevalence rate of various dementias as percentage of all dementias.
Although the Network Diffusion Model proposed by Raj et al. (2012) requires further validation (e.g., the use of longitudinal data to test prediction accuracy on cortical atrophy changes over time), it represents a novel and promising approach with several clinical and diagnostic potential applications, such as differential diagnosis and prediction of individual cognitive declines based on the estimation of future cortical atrophy patterns using baseline MRI datasets.
Current Limitations and Future Directions
How realistic are the reconstructed anatomical brain networks?
Any brain graph-based network representation requires two crucial steps: node definition and characterization of the arcs linking the nodes. Considering node definition, there is a general consensus that commonly used gray matter parcellation schemes to define nodes (e.g., Brodmann, 1909; Mazziotta et al., 1995) respond in different and incomplete ways to the requirements of an ideal parcellation (i.e., a fine-scale representation of common anatomical and functional architectures; see Toga et al., 2006). The decision to use a particular gray matter parcellation scheme implies the outcome of network properties and, subsequently, of prediction results that could change considerably with the selection of any other parcellation alternative (Zalesky et al., 2010a). While some authors present their analysis using different parcellation schemes as an option to explore parcellation effects (Hagmann et al., 2007; Hagmann et al., 2008; Iturria-Medina et al., 2011a; Li et al., 2009; Raj et al., 2012), recent automatic parcellation approaches propose to use detailed information contained in functional and/or structural profiles (Behrens et al., 2003b; Behrens et al., 2004; Jbabdi et al., 2009; Li et al., 2010; Tuch, 2002b; Zhang et al., 2011; Zhu et al., 2011a; Zhu et al., 2011b; Zhu et al., 2012). For instance, recent work by Zhu et al. (2012) found 358 cortical landmarks that were consistent and reproducible across 143 brains, based on DW-MRI fiber tractography profiles. In comparison with traditionally used gray matter parcellation schemes (e.g., Brodmann, 1909; Mazziotta et al., 1995), the use of automatic parcellation methods based on structural/functional connectivity patterns may offer finer granularity, better functional homogeneity, and more accurate functional localization (Zhu et al., 2012). This has potentially strong implications for the realistic reconstruction and across- subjects' matching of anatomical brain networks.
Considering arcs linking nodes, their characterization is typically based on the empirical information about estimated fiber trajectories connecting the regions of interest. As a consequence of using indirect measures of a connective anatomical architecture, based on water molecule's restricted diffusion processes and not on real axon routes, DW-MRI fiber tractography techniques still require a major improvement for data acquisition and for associated reconstruction algorithms (see Jbabdi and Johansen-Berg, 2011). More relevant limitations include the complexity to deal with fiber crossing, merging, and fanning configurations. Different and original solutions are often proposed to these problems (Canales-Rodríguez et al., 2009; Canales-Rodríguez et al., 2010a; Canales-Rodríguez et al., 2010b; Dell'Acqua et al., 2007; Özarslan et al., 2006; Savadjiev et al., 2006; Savadjiev et al., 2008; Sotiropoulos et al., 2012; Tournier et al., 2004; Tournier et al., 2007; Tuch, 2004; Wedeen et al., 2005). Additionally, the impossibility to discriminate between afferent and efferent connections and the not less-important issue of defining interpretable and accurate fiber pathway integrity measures are major problems (Jones et al., 2012). The recent introduction of microstructure indices such as axonal diameter and density distributions (Alexander et al., 2010; Assaf et al., 2008) or neurite orientation dispersion and density distributions (Zhang et al., 2012) can play a fundamental role in solving these issues. Unfortunately, it is currently impossible to know if an estimated fiber trajectory corresponds to a real anatomical connection route or not. Even if some approaches aimed at testing the statistical relevance of specific connections (Gigandet et al., 2008; Hinne et al., 2012; Jbabdi et al., 2007; Morris et al., 2008; Raj and Chen, 2011), determining the nonexistence of real connections continues to be a key unsolved problem that needs further attention. When considering past and present brain anatomical network studies and their methodological limitations, it is important to keep in mind that brain networks created using DW-MRI datasets and associated reconstruction techniques are still imperfect representations of the real brain connective neuroanatomy. Consequently, the neuroscience community expecting to work with them should see these only as initial attempts to overcome a major challenge.
At first view, the limited realism of current anatomical brain network construction methodologies seems to stand in contradiction with the optimistic predictive results reviewed in the last section. In our opinion, however, although current parcellation schemes and fiber tractography algorithms require improvement, the reconstructed networks can still be of great value to summarize local and global individual anatomical profiles and to reflect brain structural (in)alterations. In other words, even if the estimated networks are the consequence of only partially correct brain anatomy representations, the outcome results support the idea that appropriate analysis of their intrinsic information can contribute to detect and predict abnormal brain states.
Which prediction models and discrimination algorithms should be used?
Brain diseases do not follow identical routes across subjects, with the possible exception of animal models created with a genetic protocol and placed in identical environmental conditions. Although a carefully selected group of individuals can have very similar clinical symptoms caused by a specific brain abnormality, the time course of structural and functional impairments on each individual can differ depending upon several factors, such as genetic predispositions (see Fornito and Bullmore, 2012), environmental conditions, and lifestyle. Increased pathologic heterogeneity within patients adds to potential mismatches on individual progression states. It is therefore difficult to acquire large amounts of data and to create associated statistical models that accurately predict specific abnormal brain states.
Intuitively, any ideal abnormal brain-state predictor based on anatomical profiles should be capable of offering quantitative individualized information about (natural or induced) structural alterations. More importantly, the proximity/distance between these modifications and specific abnormal states associated with known adverse clinical symptoms should be specified. In this sense, traditional discrimination between healthy and nonhealthy classes can be of considerable help, but it would only be an insufficient achievement if it does not offer individual information about the proximity to intermediate or future states. In the study discriminating shiverer mutants (Iturria-Medina et al., 2011b), each individual final classification was based on the conditional probability of being a healthy control subject, which can be interpreted as a continuous anatomical index of structural (in)alterations in a given range. Similarly, the spectral clustering representation of communicability networks in patients with stroke (Crofts et al., 2009, 2011) could allow quantifying the individual distance from healthy baseline, something with a possible outcome on the quantitative evaluation of individual damage states. By contrast, different disease progression models have been recently proposed (Fonteijn et al., 2012; Raj et al., 2012; Zhou et al., 2012), in which each individual state is considered as a progressive/temporal variable in the prediction model. These approaches may offer a more straightforward choice to evaluate brain alterations on a continuous scale.
It is important, however, to note that the individual indices obtained from discrimination/clustering analyses as well as the predictors based on disease progression models still require deeper validations and the necessary comparison with pre-existing biomarkers (e.g., McDonald et al., 2001). In addition, exploring the transition from one specific abnormal state to another (e.g., the analysis of different brain diseases) requires tentatively different prediction models. A deep analysis of the underlying biophysical mechanisms that provoke a specific disease is of great importance for the selection of the correct prediction model. In this sense, for example, the proposed network diffusion model of prion-like disease progression (Raj et al., 2012) can possibly be inappropriate for the analysis of the white matter dysmyelination/demyelination process. In this example case, the prediction based on fiber integrity measures (Iturria-Medina et al., 2011b; Wee et al., 2011, 2012) or network communicability measures (Crofts et al. 2009, 2011) may be more appropriate alternatives.
Conclusions
An important aspect of clinical diagnostic investigation is the anatomic discrimination between normal and pathological states. Similarly, neurodevelopment evaluations require the precise analysis of individual anatomical properties and their relationship with behavioral data. Accumulated evidence supports the view that anatomical brain networks contain invaluable information for predicting abnormal brain states in which the complex neuronal interconnection system supported by the white matter is modified. Current advances should be considered with care, however, especially in pursuing the creation and establishment of biomarkers. The next mandatory issue will be the improvement of brain connectional anatomy descriptions, including brain parcellation schemes, diffusion MRI data acquisition, intravoxel anisotropy characterization, and associated fiber tractography methods. It will be crucial to consolidate the sensibility and specificity of predictive models, guaranteeing high prediction accuracy for multiple white matter abnormalities (e.g., brain diseases or neurodevelopmental disorders of cognition) in humans and across different species.
Footnotes
Acknowledgments
I am grateful to Mireille Besson, Philip J. Monahan, Alejandro Pérez Fernández, María Antonieta Bobes, Eduardo Gonzalez Alemañy, Mitchell Valdés Sosa, and the anonymous reviewers for their helpful suggestions and comments on the manuscript. I would also like to thank Jonathan Crofts and Ashish Raj, who kindly collaborated on the presentation of Figures 2 and ![]() , respectively.
, respectively.
Author Disclosure Statement
No competing financial interests exist.