
Abstract
Some individuals with balance impairment have hypersensitivity of the motion-sensitive visual cortices (hMT+) compared to healthy controls. Previous work showed that electrical tongue stimulation can reduce the exaggerated postural sway induced by optic flow in this subject population and decrease the hypersensitive response of hMT+. Additionally, a region within the brainstem (BS), likely containing the vestibular and trigeminal nuclei, showed increased optic flow-induced activity after tongue stimulation. The aim of this study was to understand how the modulation induced by tongue stimulation affects the balance-processing network as a whole and how modulation of BS structures can influence cortical activity. Four volumes of interest, discovered in a general linear model analysis, constitute major contributors to the balance-processing network. These regions were entered into a dynamic causal modeling analysis to map the network and measure any connection or topology changes due to the stimulation. Balance-impaired individuals had downregulated response of the primary visual cortex (V1) to visual stimuli but upregulated modulation of the connection between V1 and hMT+ by visual motion compared to healthy controls (p≤1E–5). This upregulation was decreased to near-normal levels after stimulation. Additionally, the region within the BS showed increased response to visual motion after stimulation compared to both prestimulation and controls. Stimulation to the tongue enters the central nervous system at the BS but likely propagates to the cortex through supramodal information transfer. We present a model to explain these brain responses that utilizes an anatomically present, but functionally dormant pathway of information flow within the processing network.
Introduction
T
Cortical processing of motion in the visual field begins with the primary visual cortex (V1), located along the medial occipital lobes (Angelucci et al., 2002; Previc et al., 2000). Partially processed information is passed to the extrastriate visual cortices, including the motion-sensitive visual cortex (hMT+) (Dieterich et al., 2003; Kikuchi et al., 2009; Ohlendorf et al., 2008; Sunaert et al., 1999). If these cortical regions determine that the visual data might contain information pertinent to maintaining balance, other brain regions, including the parieto-insular vestibular cortex (PIVC), the vestibular nuclei, and cerebellar structures, may be recruited to further process and integrate the information (Angelaki and Cullen, 2008; Bense et al., 2005; Bense et al., 2006; Dieterich and Brandt, 2000; Guerraz and Bronstein, 2008; Kovacs et al., 2008; Redfern et al., 2001). The PIVC, located at the parietal-insular junction of the nondominant hemisphere, is one of the least understood regions within this network. It is thought to be a multimodal sensory cortex that integrates visual, vestibular, and proprioceptive information (Brandt and Dieterich, 1999; Eickhoff et al., 2006; Suzuki et al., 2001).
These additional structures work closely with the visual processing network to help maintain balance. Individuals with damage to the sensory inputs and/or neural structures within this network can have deficits of balance and gait, and often experience severe dizziness, nausea, vertigo, and hypersensitive postural responses to motion in their visual field (Baloh and Honrubia, 1990; Borel et al., 2008; Dieterich, 2007; Redfern and Furman, 1994). Multiple imaging studies have investigated abnormal neural processing in this population (Dieterich et al., 2007; Dieterich and Brandt, 2008; Wildenberg et al., 2010). One finding of particular interest is the increased activation of hMT+ bilaterally in some balance-impaired individuals compared to healthy controls (Dieterich et al., 2007). This increased activation may partially explain the increased postural perturbations and subjective hypersensitivity associated with visual motion—especially stimuli that mimic ego-motion (Borel et al., 2008; Redfern and Furman, 1994; Slobounov et al., 2006).
A recent study showed that information-free stimulation to the tongue, termed cranial nerve noninvasive neuromodulation (CN-NINM), can produce sustained reductions in this hypersensitivity to motion in the visual field as measured both behaviorally and through functional magnetic resonance imaging (fMRI) activation (Wildenberg et al., 2010). After the stimulation, balance-impaired individuals displayed improved performance on multiple balance metrics while neuroimaging revealed normalization (compared to healthy controls) of the response of hMT+ to optic flow. The results of that study built on much pre-existing work showing that the tongue can be successfully used as an alternative input for vestibular information by the theories of sensory substitution (Danilov and Tyler, 2005; Danilov et al., 2006; Ptito et al., 2005; Sampaio et al., 2001; Vuillerme and Cuisinier, 2009). The sustained effects discovered in those studies hinted that the stimulation may be inducing plasticity within the network that processes stimuli pertinent to maintaining balance. Activation-based fMRI analysis was able to show that this stimulation likely caused sustained modulation of neural processing within the brainstem (BS) (Wildenberg et al., 2011a). The anatomy of the dorsal medulla/pons supports these findings as the trigeminal nuclei, which receive afferents from the tongue, are located adjacent to the vestibular nuclei.
Those studies, however, were not able to elucidate how modulation of activity within the BS propagates to cortical structures such as the hMT+. Understanding this interaction between brain regions requires a more complex, multivariate analysis that can map information flow through multiple brain regions simultaneously. Effective connectivity methods such as dynamic causal modeling (DCM), structural equation modeling, and Granger causality are common tools to analyze fMRI data in such a way that these complex interactions between brain regions can be mapped (de Marco et al., 2009; Friston et al., 2003; Roebroeck et al., 2005; Schumacker and Lomax, 1996).
The advantages of DCM include the ability to model not only network connections, but also how external perturbations can both drive neural responses in specific regions, and affect connections between these regions. Three different types of interactions are modeled: interconnections between brain regions, activating effects of tasks, and modulation of interconnections by those tasks. DCM also provides a statistical measure to compare models and specific connections between groups (Kasess et al., 2010; Penny et al., 2004; Penny et al., 2010). The purpose of utilizing DCM applied to our previously collected fMRI data was to understand how modulation of structures within the BS due to CN-NINM can cause global plasticity of the balance-processing network, and better define the potential uses and limitations of this technique in the field of neurorehabilitation.
Methods
Subjects
Twelve subjects selected by common symptoms of chronic balance dysfunction (M/F: 6/6, mean age 52.2±10.3 years) and nine healthy controls (M/F: 5/4, mean age 50.4±12.8 years) participated in this study. Inclusion criteria for the balance-impaired subjects were very broad and included anyone with a clinically defined chronic, stable balance dysfunction that encompassed deficits of balance, posture, and gait (Table 1). Balance-impaired subjects were recruited primarily through referral from clinicians aware of ongoing studies within our research group. These balance-impaired subjects lived throughout the United States and traveled to our facility for participation in the study. Controls were recruited from the general population around Madison, Wisconsin. The University of Wisconsin–Madison Health Sciences Institutional Review Board approved all aspects of this study, and all subjects signed the consent form before participating.
The clinical diagnosis provided by the referring physician was assumed correct without further testing.
Visual stimuli and display
Two visual stimuli were designed to activate brain regions involved in processing visual information. A static alternating black-and-white checkerboard was used to measure the neural response to any strong visual stimulus. To measure the response to motion in the visual field, subjects were also shown a video that produced the sensation of ego-motion through optic flow. Two-dimensional optic flow was produced by varying the size of the squares at 0.2 Hz in a sinusoidal pattern (apparent in/out motion) and rotating the image about the central point. This rotation was produced using the superposition of two sinusoids (0.2 and 0.35 Hz) after preliminary results indicated that prediction of the rotation produced by a single sinusoid reduced the sensation of ego-motion. The stimuli were displayed for 12 sec alternated with 6 sec of fixation to reduce the contamination of the response from one stimulus into the next.
Subjects were shown the visual stimuli in a randomized block-design paradigm with the requirement that each visual stimulus be displayed 14 times over the course of a functional run. Subjects viewed the visual stimuli on MRI-compatible display goggles (Resonance Technology, Northridge, CA) and were instructed to fixate on the center of the image. The goggles produce an 800×600 pixel display with a 30° horizontal and 22° vertical field of view in each eye.
MRI data collection
MRI data were acquired with the University of Wisconsin–Madison Department of Radiology's 3T clinical MRI scanner (GE Healthcare, Waukesha, WI). T1-weighted anatomical images were collected using a spoiled gradient recalled (3D-SPGR) pulse sequence. Two functional scans were acquired with a T2*-weighted gradient-echo echo-planer imaging sequence (TR=2000 ms, echo time=30 ms, flip angle=75 degrees) to acquire BOLD signal over a 64×64 matrix and 28 axial slices (3.75×3.75×5 mm). The first three volumes of each functional scan (252 total volumes) were discarded to allow T1 saturation. Balance subjects underwent two scanning sessions: one before and one after the stimulation regimen. Normal controls underwent one scanning session.
Tongue stimulation
Stimulation to the tongue was delivered via a small electrode array placed on the anterior portion of the tongue and held in place by pressure of the tongue to the roof of the mouth (Kaczmarek, 2011; Tyler et al., 2003). The sensation produced by the array is similar to the feeling of drinking a carbonated beverage. To prevent possible disease transmission, the electrode array was sterilized using gluteraldehyde between subjects and additionally cleaned with 91% isopropyl alcohol between every stimulation session.
CN-NINM stimulation consists of three-square-pulse bursts with an intraburst frequency of 200 Hz and an interburst frequency of 50 Hz that does not vary throughout the duration of the stimulation session. The signal was not coupled to any sensor and therefore did not provide any useful exogenous information to the subject (cf. Danilov et al., 2007, and Danilov et al., 2006, which did provide such feedback).
Procedure
On the day of the first visit (day 0, Pre-CN-NINM and Normal), all subjects underwent behavioral tests and an MRI scan to collect neural responses to the visual stimuli. During the two functional scans, No tongue stimulation was given during the fMRI tests.
CN-NINM stimulation was delivered to the balance subjects over 9 stimulation sessions (two on days 1–4 and one on day 5). During a stimulation session, subjects received continuous stimulation for 20 min, wherein the subject stood as still as possible with their eyes closed. A physical therapist was always present to prevent falls.
After the completion of the ninth stimulation session, balance subjects repeated the fMRI scan. The procedures for the scan on day 5 (Post-CN-NINM) were identical to those completed on day 0. The post-CN-NINM scan was completed between 3 and 6 h after the final stimulation session.
Data preprocessing
MRI data were preprocessed using the AFNI software suite (Cox, 1996). This processing included corrections for slice-time errors and subject motion. No temporal smoothing was performed as DCM utilizes all temporal information to estimate the connectivity between brain regions. An equivalent of spatial smoothing was performed during the DCM time-series extraction step for the regions of interest (below).
The general linear model (GLM) was performed using SPM8 followed by normalization to MNI space for group analysis. Determining the specific effect of visual motion independent of the effect of any visual stimulus would normally be performed using a contrast between the static and dynamic checkerboard tasks (Wildenberg et al., 2010). DCM, however, does not allow contrasts to be used as tasks in the models; therefore, the effect of visual motion had to be explicitly described. To do this, the GLM was organized such that both visual stimuli were combined to measure the effects of any strong visual stimulus (Photic), while only the dynamic stimulus was used to measure the effects of motion in the visual field (Motion). This grouping separated neural responses due to all visual stimuli (Photic) from those that are selective for visual motion without the need for post-hoc contrasts (Penny et al., 2004).
The DCM analysis, performed with SPM8, required multiple procedures beyond the standard GLM approach (Friston et al., 2003). Four clusters, identified by the GLM as responding strongly to the visual stimuli or differing between groups (p<0.05, family-wise error corrected), were selected to be functional volumes of interest (VOIs) for use in the DCM analysis (Fig. 1 and Table 2). These regions included the primary visual cortex (V1), the right motion-sensitive visual cortex hMT+, the right PIVC, and a region within the dorsal pons of the BS. Only significant voxels (p<0.001, uncorrected) were included in the VOIs. We expected the right and left hemispheres to behave similarly; therefore, the VOI for hMT+ was limited to the right hemisphere (the location of the PIVC) to simplify model analysis and interpretation. The VOI for V1 included voxels from both hemispheres as the cluster produced by the GLM crossed the midline and would have had to be arbitrarily split (Fig. 1). Although defined functionally, it is likely that the BS VOI contains both the vestibular nuclei as well as the trigeminal nuclei—the suspected site of the sustained neuromodulation induced by CN-NINM (Wildenberg et al., 2011a).
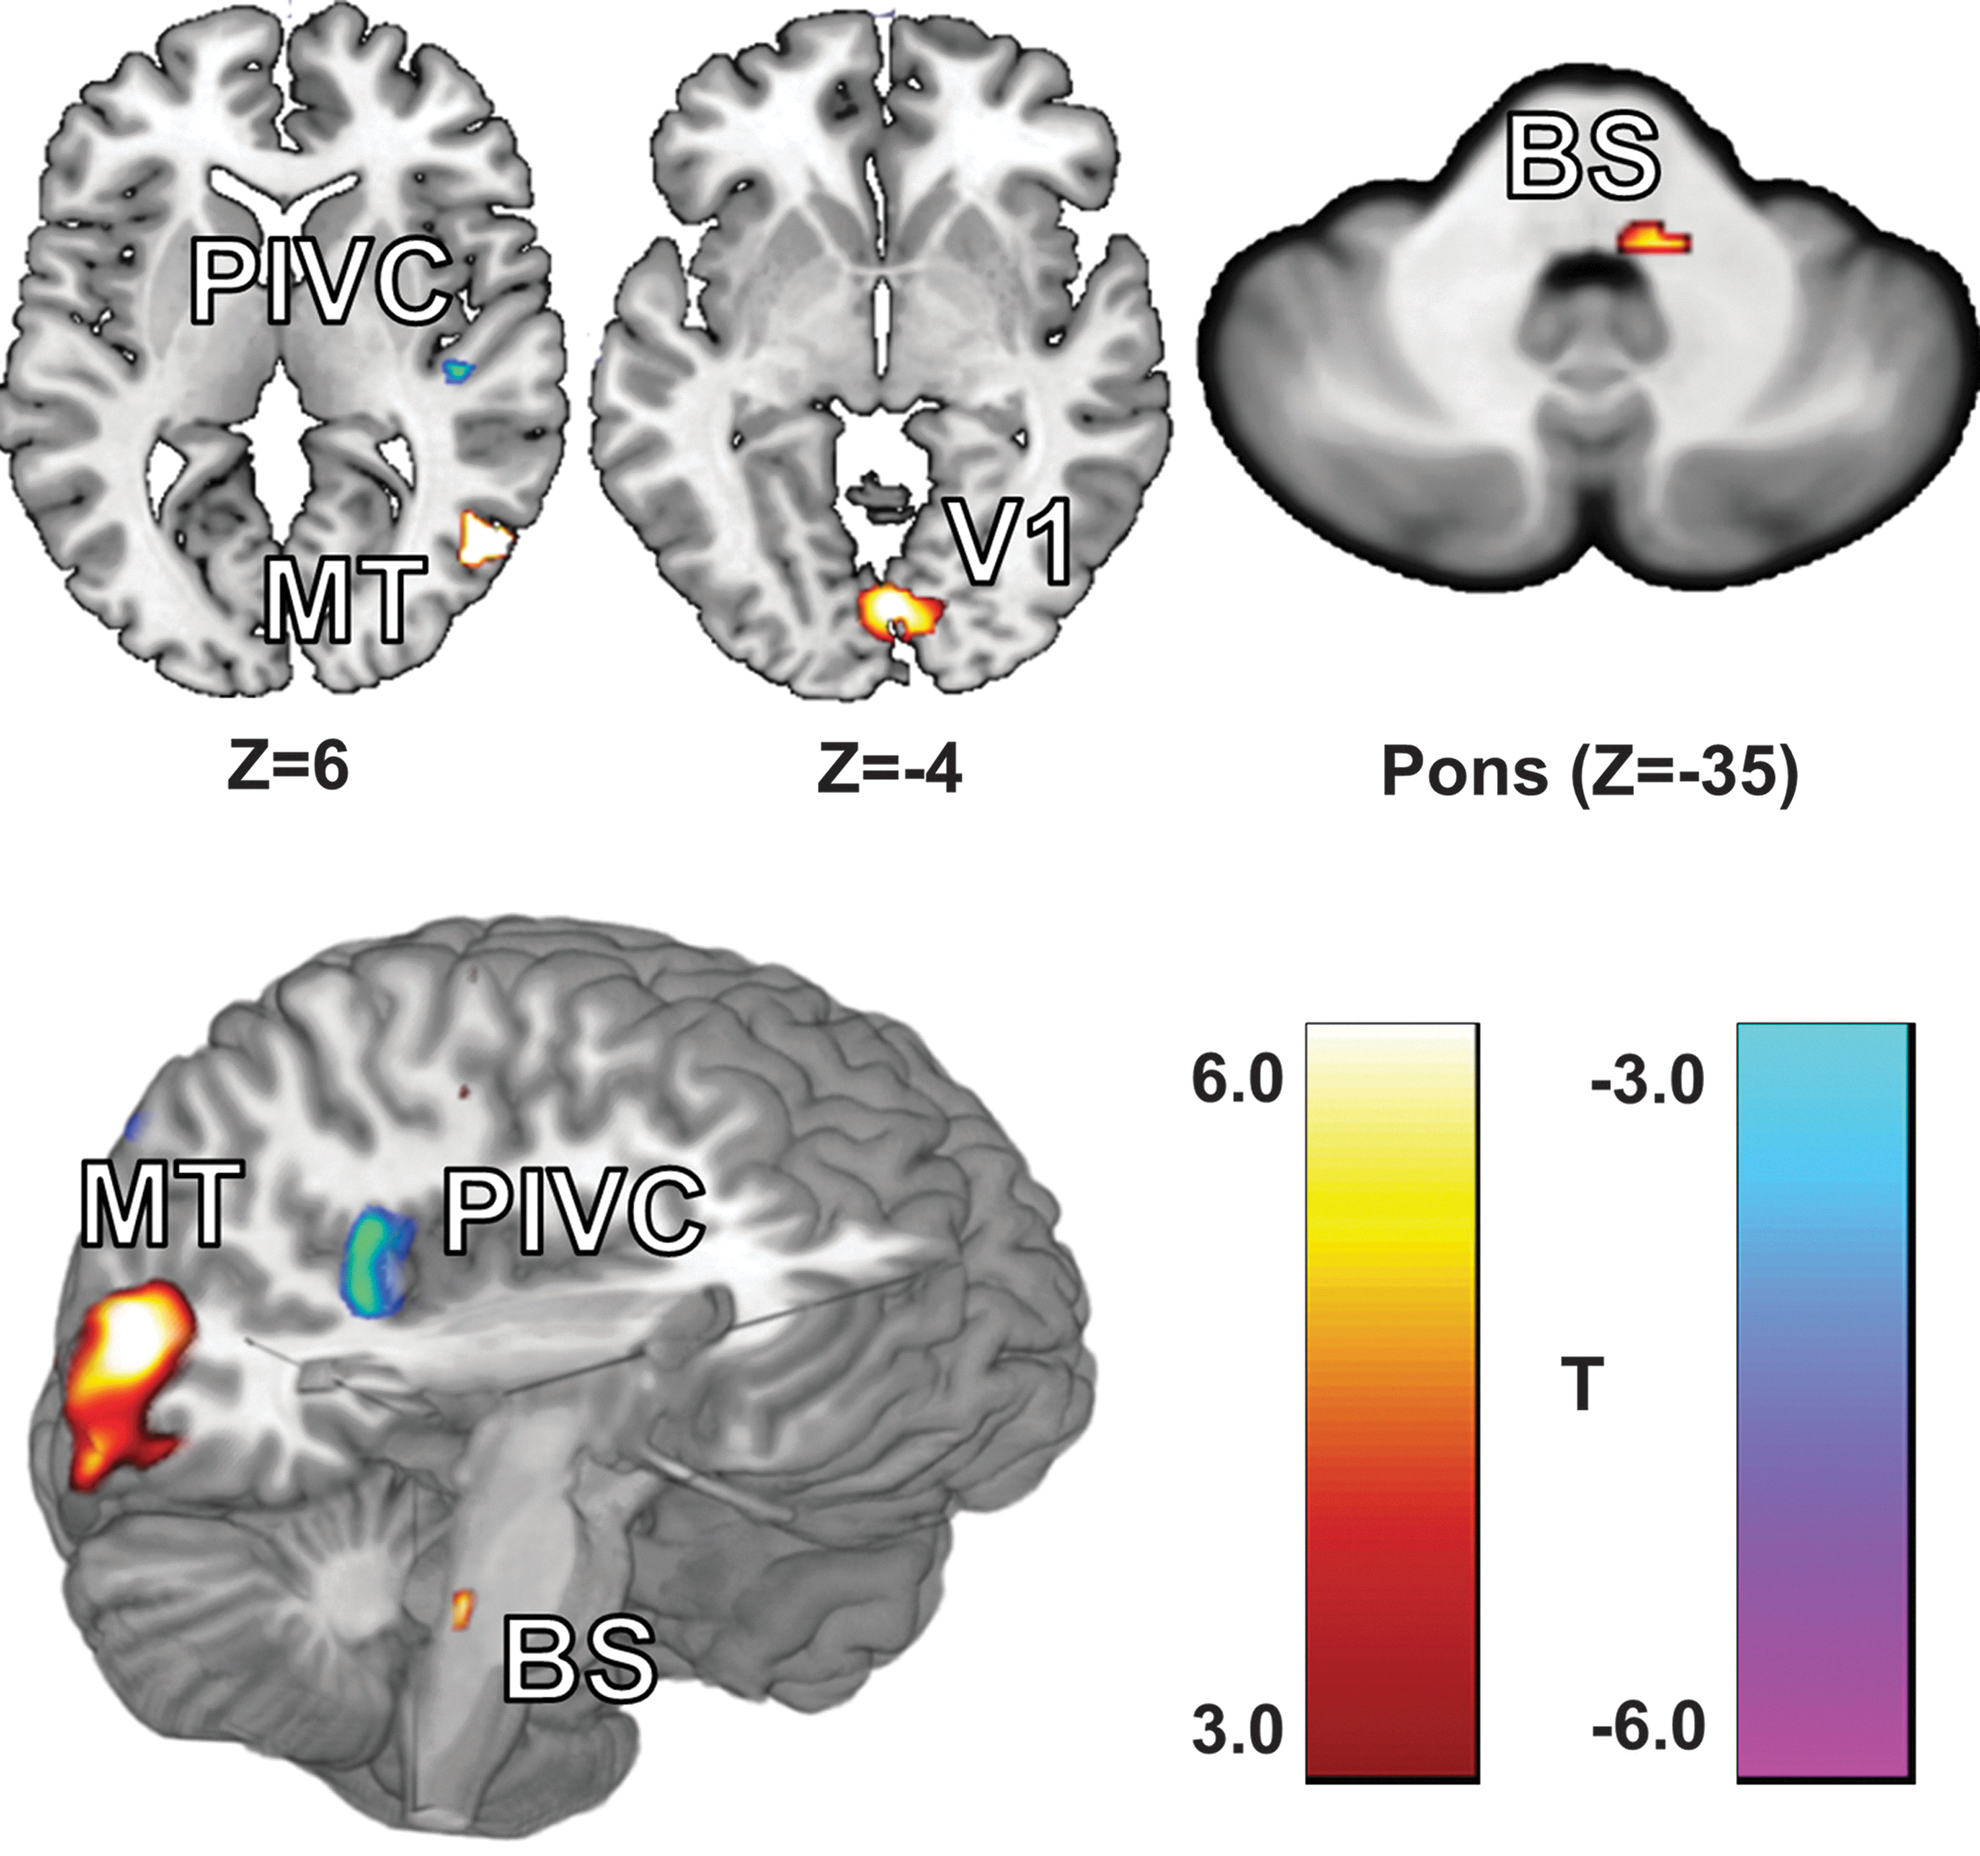
The locations of the four volumes of interest (VOIs) identified by the group general linear model (GLM) analysis. These four regions showed a strong response to optic flow. Slice locations are given in MNI coordinates and exact center of mass coordinates and volumes are listed in Table 1.
The coordinates are the center of mass reported in MNI space before reverse normalization. Each VOI is a significant cluster (p<0.05, family-wise error corrected) derived from the specified contrast in the GLM analysis.
VOI, volumes of interest; DCM, dynamic causal modeling; GLM, general linear model; V1, primary visual cortex; hMT+, motion-sensitive visual cortex; PIVC, parieto-insular vestibular cortex; BS, brainstem; CN-NINM, Cranial Nerve Non-Invasive Neuromodulation.
Extraction of a representative time-course from each VOI across all subjects required two steps. First, a subject-specific mask of each region (sVOI) had to be produced. These subject-specific masks were created by inverting the subject's normalization transformation matrix (reverse normalization) and applying it to the group VOI masks in MNI space. This step was performed as activation clusters representing the PIVC, and BS regions, corrected for multiple comparisons, were not significant in every subject independently. Only voxels within these sVOIs, in subject space, were considered. Second, principal component analysis (PCA) performed across all voxels in the mask identified the first eigenvariate time-series. These single time-series were used as inputs for the DCM analysis.
DCM model specification
DCM allows three types of influential interactions: interconnections, driving inputs, and modulatory effects. The interconnections describe how separate brain regions influence each other directly. Driving inputs allow tasks to activate brain regions. Finally, modulatory effects allow tasks to affect interconnections. Previous work allowed us to narrow the search space of possible models to estimate. Multiple imaging modalities have shown interconnections between V1 and hMT+ (Greenlee and Tse, 2008; Lanyon et al., 2009). Similarly, previous studies using DCM, as well as knowledge about the function of V1, have implicated visual stimuli as a driving input to V1 (Penny et al., 2004). Therefore, all models included bidirectional interconnections between V1 and hMT+ and a driving input of Photic on V1. All models also include at least one interconnection between hMT+ and the PIVC, as much data have indicated that these structures communicate (Brandt et al., 1998; Cardin and Smith, 2010).
Using this information, we estimated 50 models that all included the four VOIs and above connections but differed in the remaining interconnections, driving inputs, and modulatory effects. Five of these models included nonlinear interactions, allowing a brain region to modulate an interconnection directly (Stephan et al., 2008). To keep track of all of the possibilities, models were grouped into families defined by the interconnections between regions. The families were first identified by the number of interconnections and then separated based on the specific connectivity of the BS and cortex (Table 3 and Fig. 2A). The models within each of these families differed primarily in the effect of Motion within the network. Motion was allowed to be a driving input, a modulatory effect, or both. These fifty models were calculated across all subjects and functional runs to produce estimations of the connection strengths.
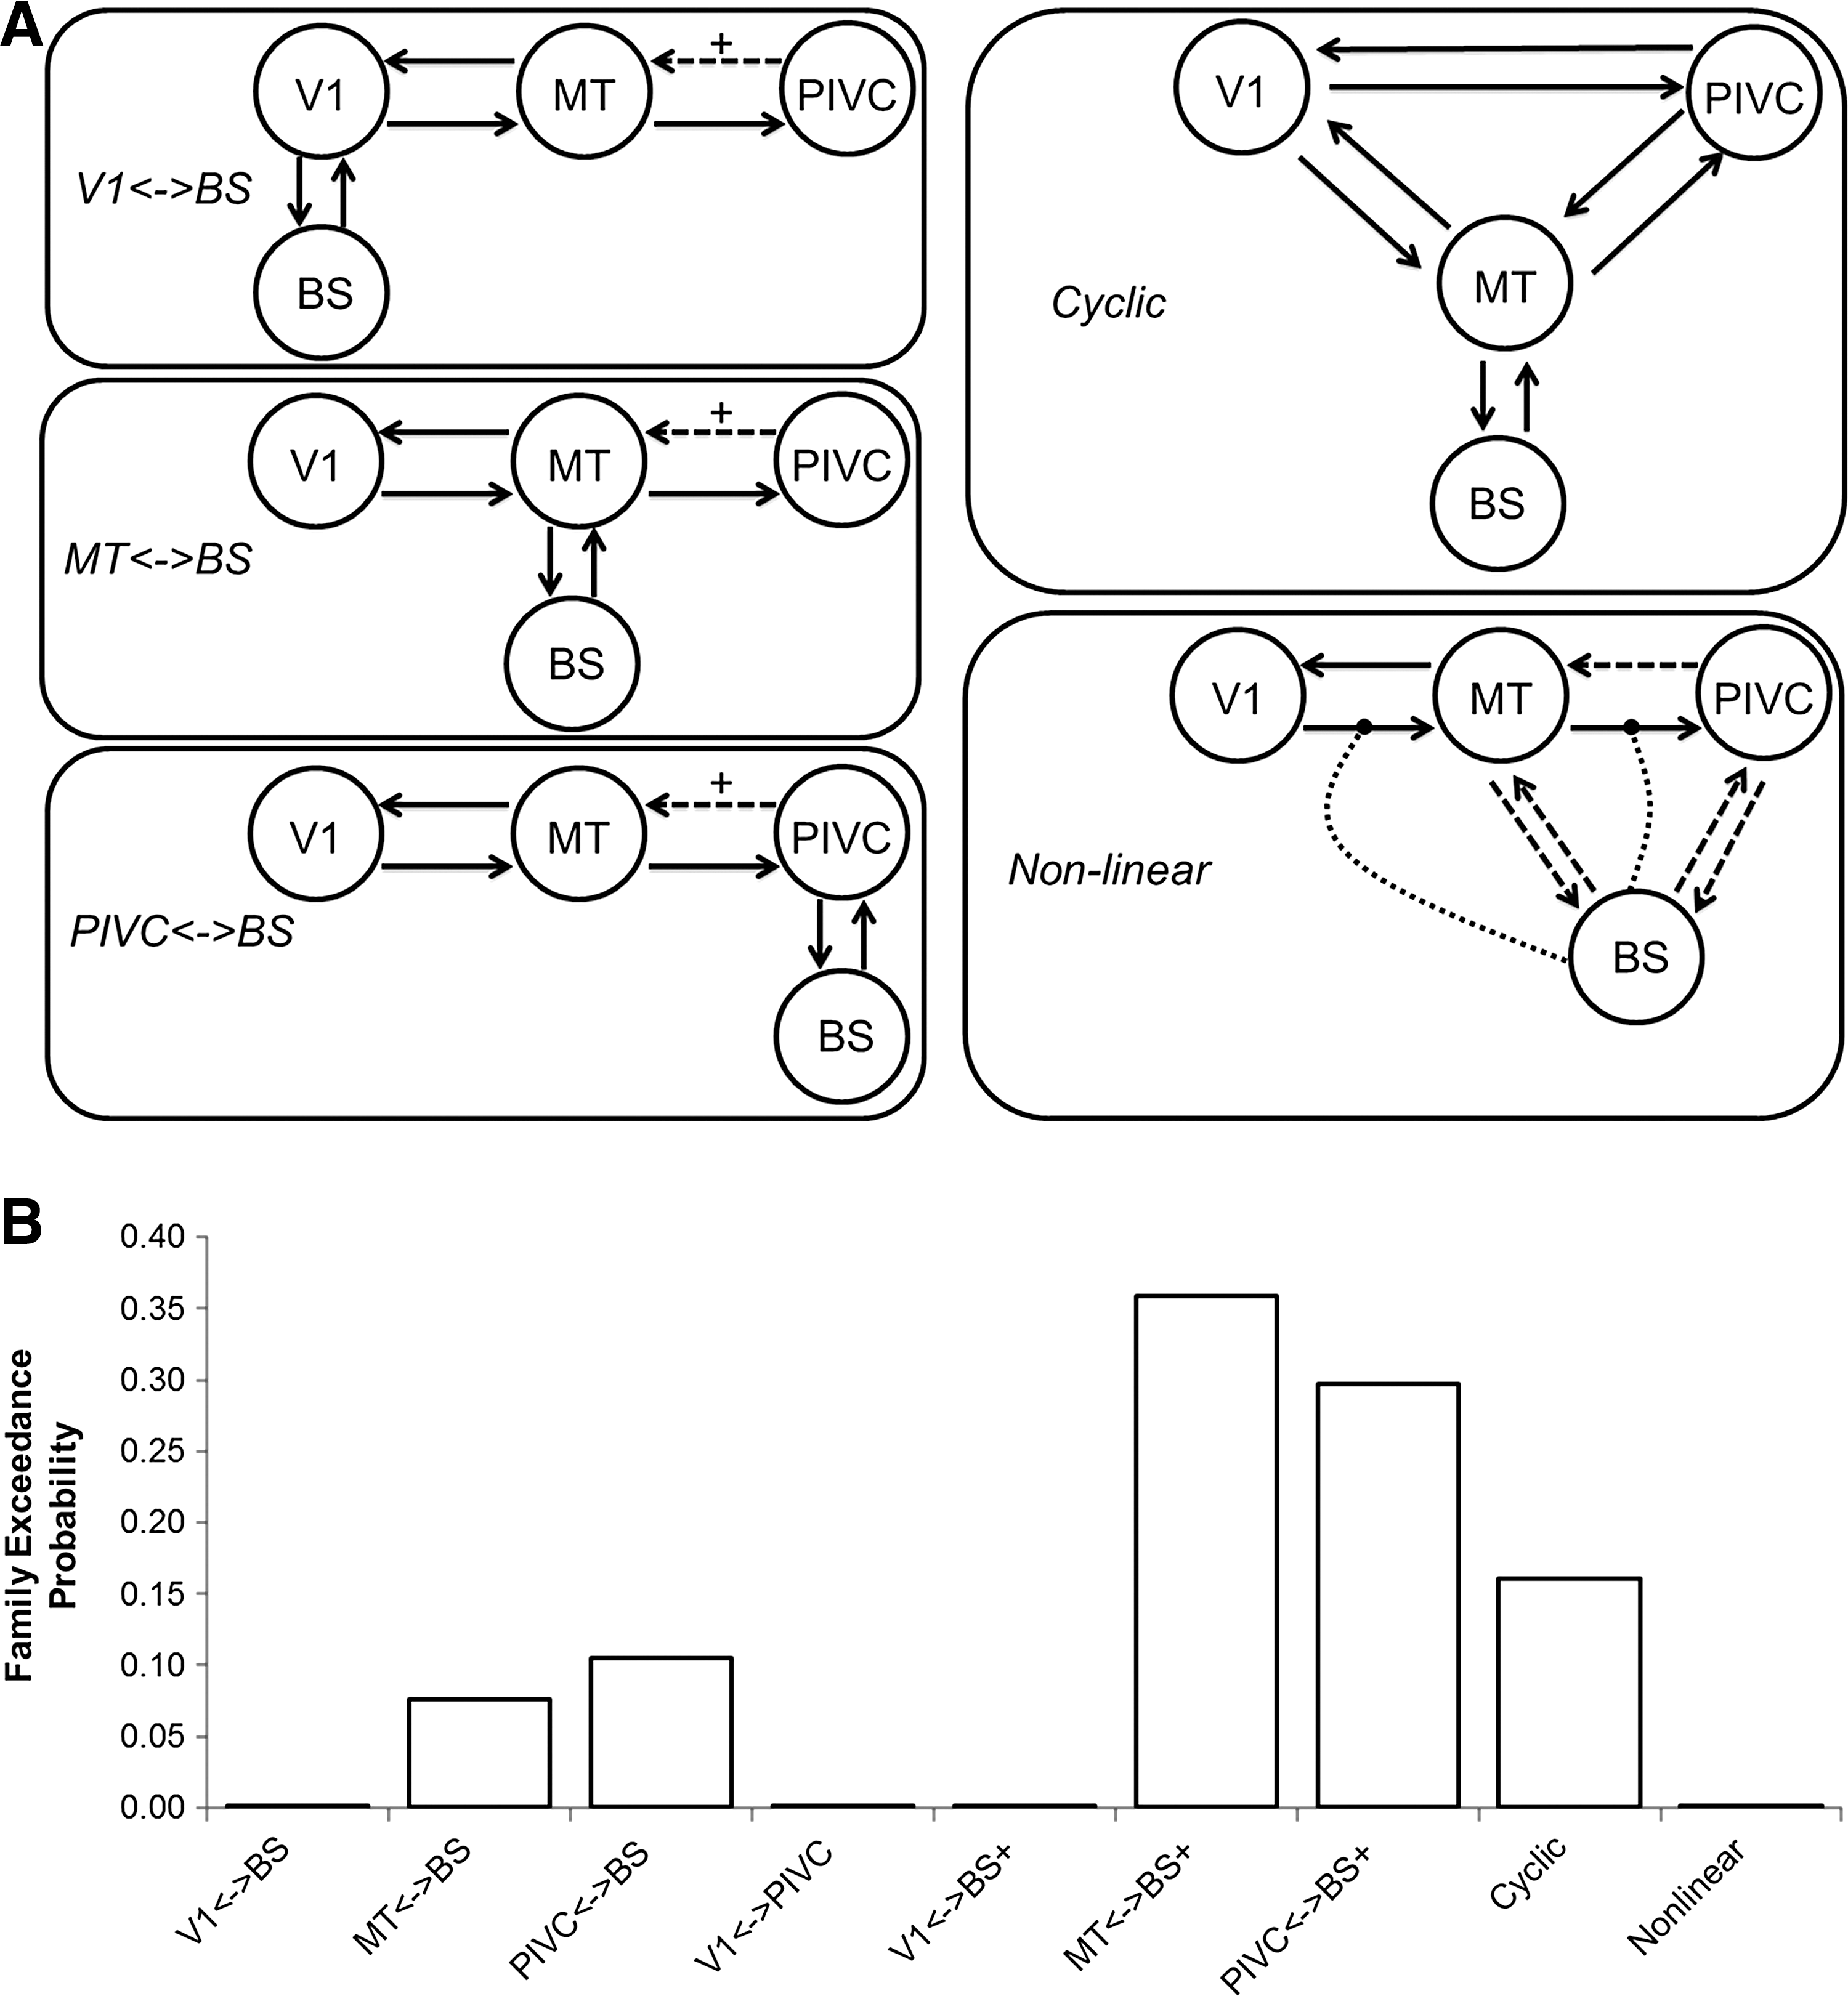
Families were grouped based on the number of connections as the DCM Bayesian model selection penalizes models with increasing complexity. The groups were further divided by the connection between the brainstem and cortex.
Model selection and averaging
Random-effects Bayesian Model Selection was performed across all models (Penny et al., 2004; Stephan et al., 2009). These calculations produce an estimate of the relative free energy that rewards models for accuracy but penalizes them for increased complexity. Bayesian family inference was also performed to compare the relative strengths of the families (Penny et al., 2010).
The Bayesian family inference suggested that two families of models had the most likely topology (see results). Models from these families were entered into random effects Bayesian Model Averaging (BMA to weigh the strength of each interaction by its relative probability derived from the models which include that interaction) (Kasess et al., 2010; Penny et al., 2010). This procedure uses a Markov chain Monte Carlo technique implemented using a Gibbs sampling algorithm to produce an estimation of the conditional distribution for each interaction weight (Chumbley et al., 2007; DuBois Bowman et al., 2008). The distributions were calculated across all subjects and separately for each group.
To statistically test the distributions for each interaction, one- and two-sample bootstrapping of the mean was performed using all 10,000 samples generated by the Gibbs sampling (Lockhart et al., 2007). Sampling with replacement was performed for 100,000 iterations per connection and group. Each iteration calculated the difference in the means of the resamples to build the distribution for that statistic (Fig. 3). Note that each iteration is not a statistical test by itself, but combine to form the distribution used for statistical testing. The p-value was calculated directly by determining the fraction of the resample distribution greater than the measured difference (Hesterberg et al., 2008). The method is more flexible than a simple t-test as it does not require normality of the distributions or equal variances. However, Gibbs sampling mixes models and subjects, prohibiting a paired comparison of the pre-CN-NINM and post-CN-NINM groups as would normally be performed. To correct for multiple comparisons across the 68 independent tests, only effects with a p≤0.05/68 ∼ 0.0008 are considered significant.
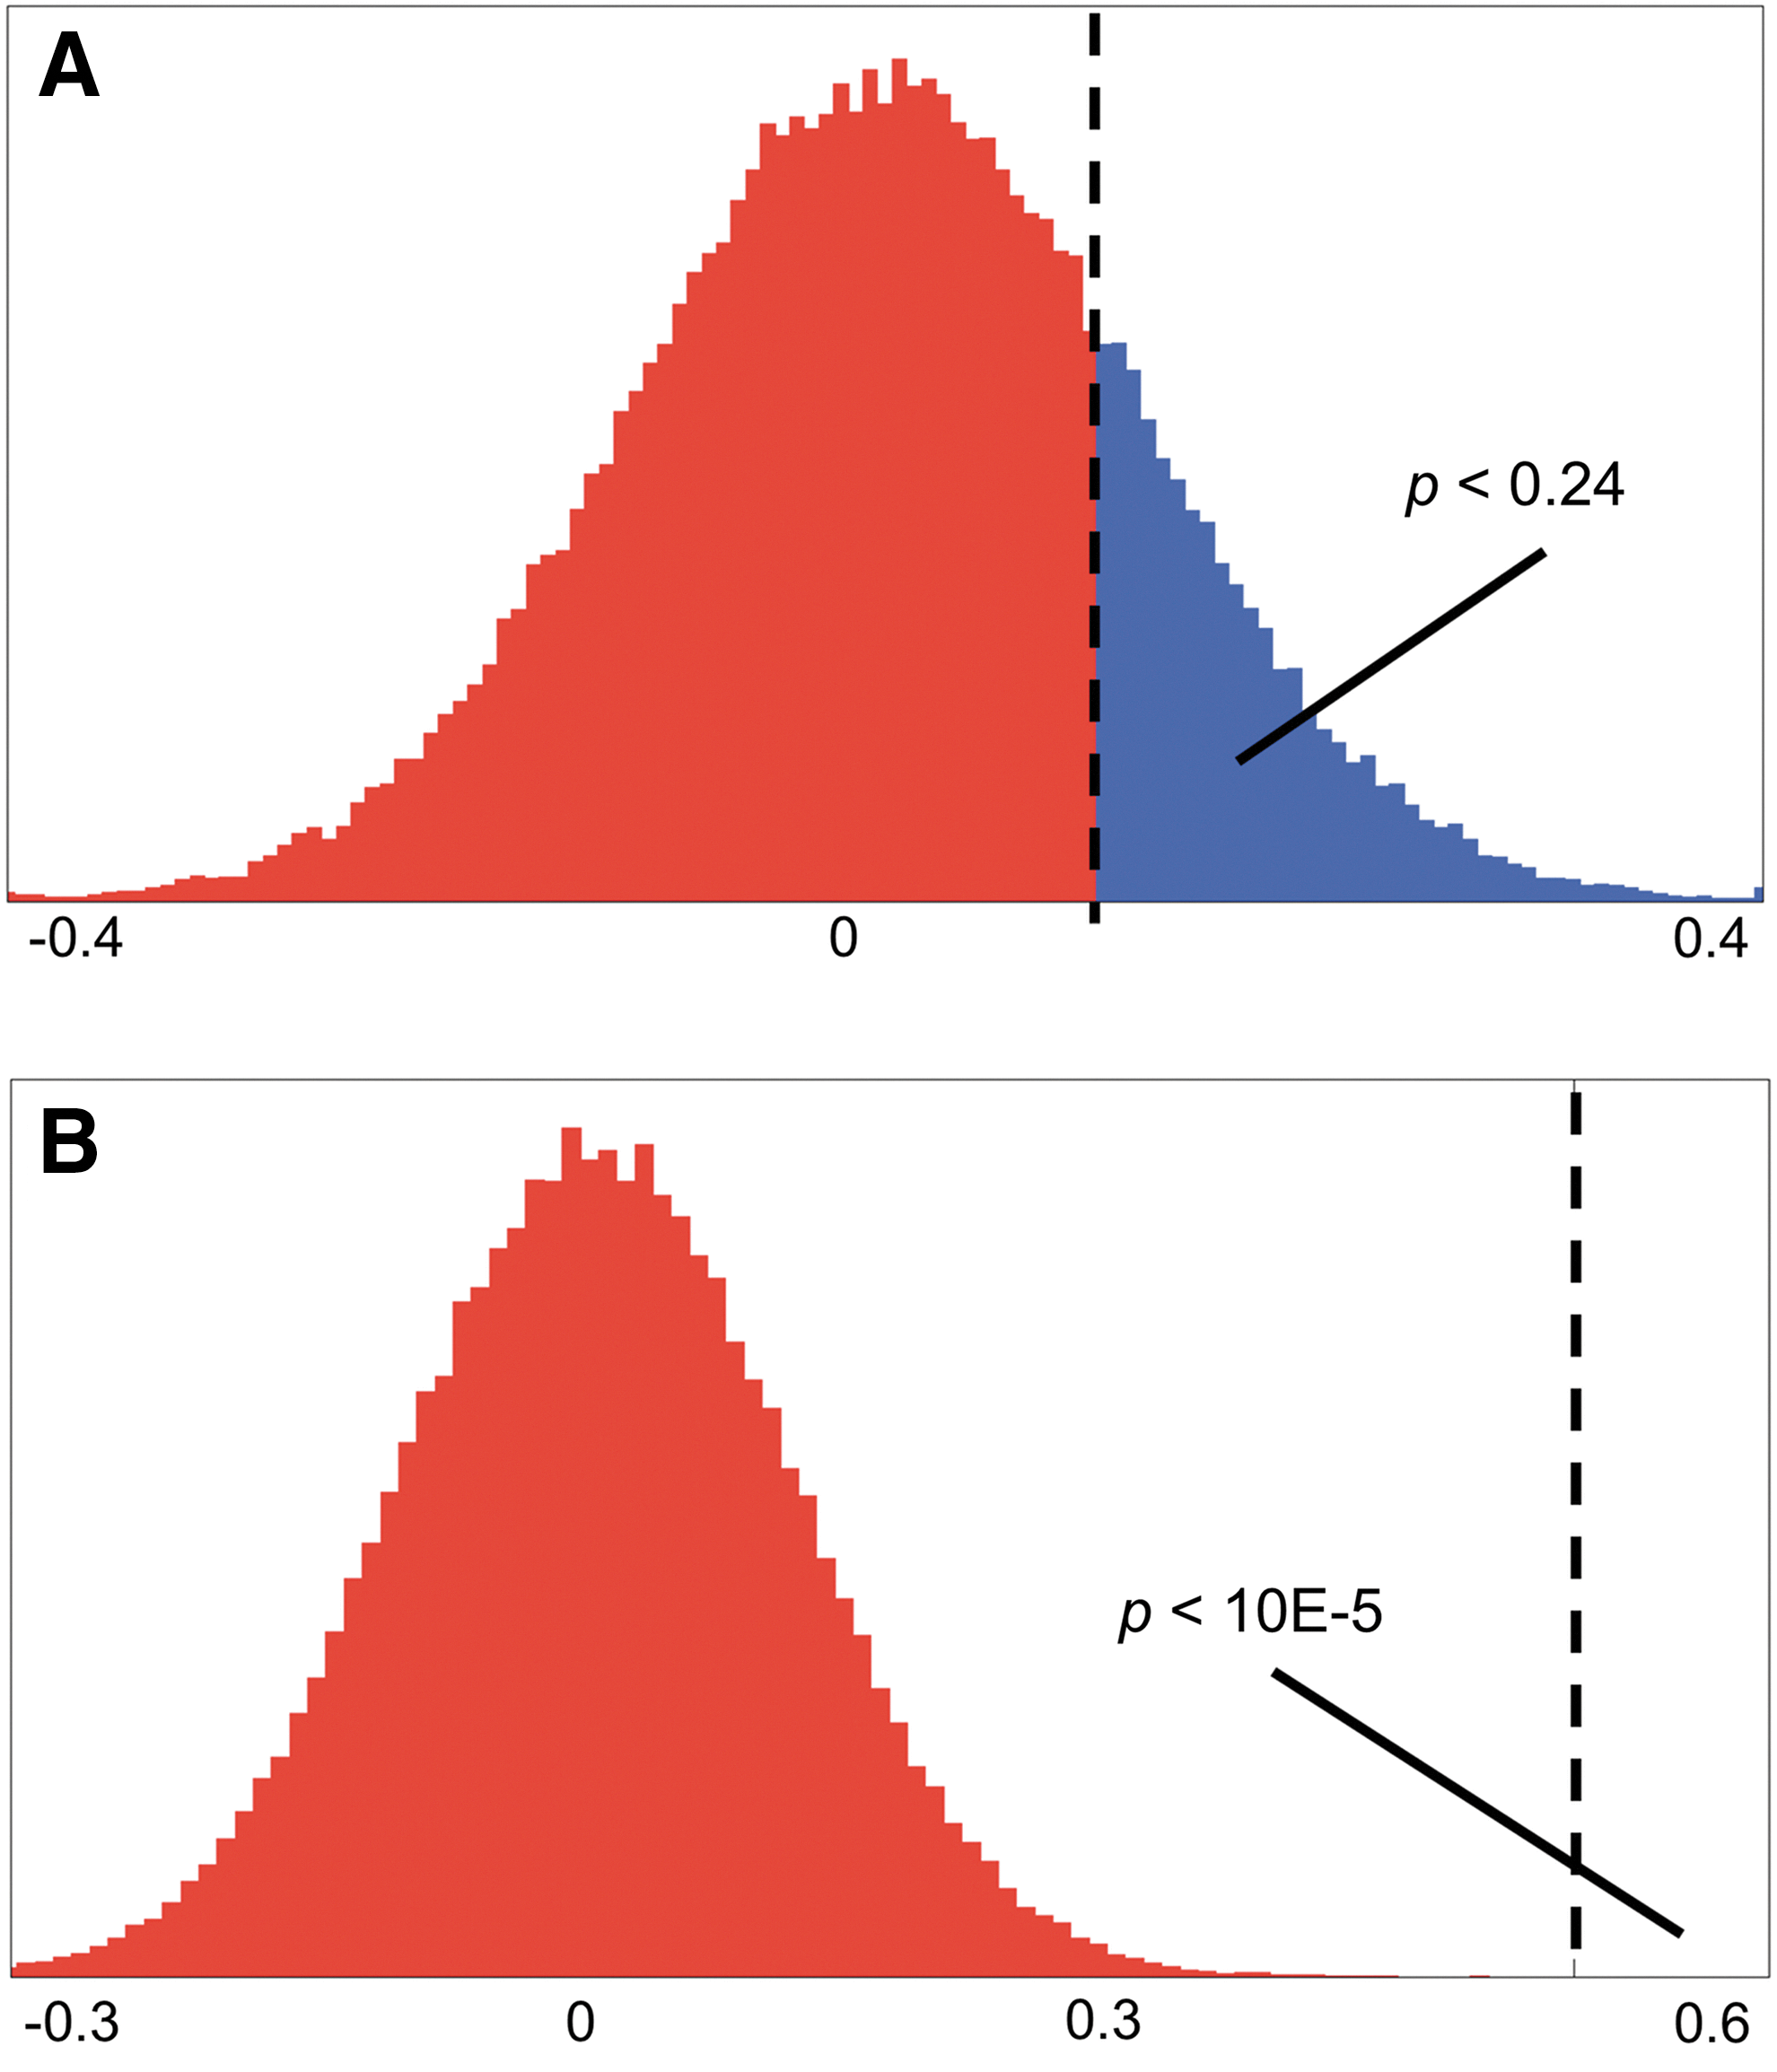
Example calculation of p-values from the bootstrapping procedure.
Results
The GLM analysis produced activation clusters at similar locations to those found by our previous analysis (Fig. 1 and Table 2). The preprocessing performed in this study did not include spatial smoothing. Therefore, the locations of the center of mass and the reported volumes differ slightly from the results reported previously (Wildenberg et al., 2010).
Bayesian model selection
Random effects analysis of the 50 models did not produce a single best-fit model across all subjects. Relative probabilities of the model families identified two similar families as being the most likely (Fig. 2B). The 12 models in these two families—MT↔BS+ and PIVC↔BS+—were selected for input into BMA. Note that the next most likely family, cyclic, includes models that are simply combinations of the two families above and are therefore not included in the BMA to reduce redundancy in the calculation.
Bayesian model averaging
Bootstrapping of the samples generated by the BMA revealed multiple significant connections common to all subjects (Table 4). Four interconnections survived corrections for multiple comparisons. V1 →hMT+, hMT+→V1, hMT+→PIVC, and hMT+→BS. Both the direct driving effects of Photic→V1 and Motion→BS were also significant. Finally, the modulatory effect of Motion→ (V1→hMT+) was significant.
Only connections with p≤0.0008 are significant after correction for multiple comparisons. Only connections that survived the correction for multiple comparisons across all subjects are included in the final model (Fig. 5). Pre, before CN-NINM stimulation; Post, after CN-NINM stimulation; Norm, healthy controls; M, motion; P, photic; μ, mean; * p≤1E–5.
Bootstrapping to look for differences between groups revealed that balance subjects both before and after stimulation had a smaller driving effect of Photic on V1 compared to healthy controls (Fig. 4 and Table 4). The prestimulation balance-impaired group had a stronger modulatory effect of Motion compared to healthy controls. The strength of this modulation decreased after stimulation resulting in no difference between the balance-impaired individuals post-CN-NINM compared to controls. Last, balance subjects post-CN-NINM had a stronger driving effect of Motion on BS compared to pre-CN-NINM and controls.
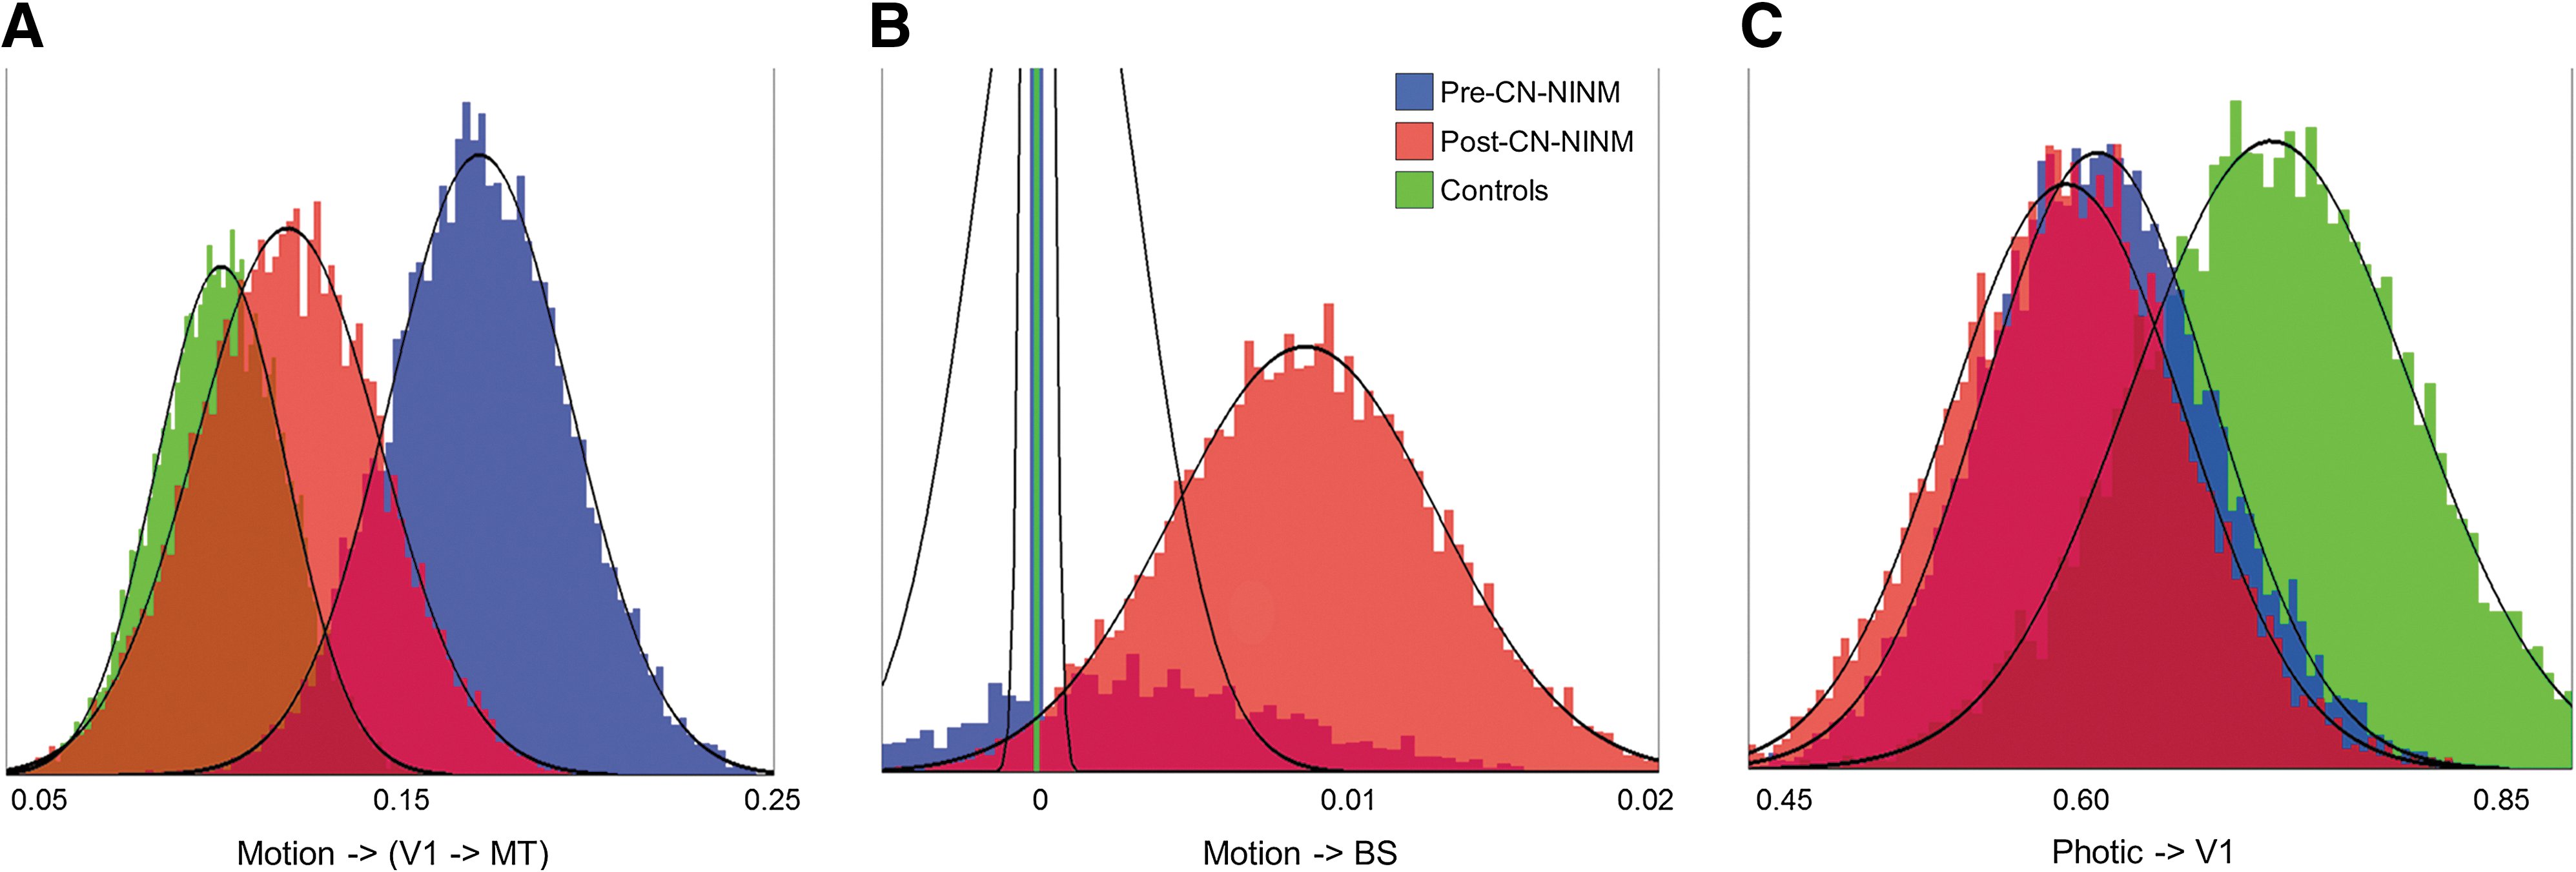
Histograms of the Gibbs-sampled distributions for the three connections that showed significant group differences in the two-sample bootstrapping (Table 3). It is these distributions that are used in the bootstrapping procedure to determine significance (Fig. 3).
Discussion
The baseline interconnections found in this study matched well with what is known about information flow through the network that processes information pertinent to balance (Albright and Stoner, 1995; Angelucci et al., 2002; McKeefry et al., 2009). Previous studies utilizing DCM to analyze visual processing have identified bilateral connections between V1 and hMT+ (Acs and Greenlee, 2008; Penny et al., 2004). The connection from hMT+ to the PIVC was negative, which matches the simultaneous activation of hMT+ and deactivation of the PIVC found by many studies using optic flow (Cardin and Smith, 2010; Eickhoff et al., 2006; Indovina et al., 2005). The deactivation of the PIVC is only present in the contrast of visual motion to static visual imagery. One interpretation of this finding is a dynamic sensory re-weighting between the visual and vestibular systems that occurs with significant visual motion. This, along with the opposite effect seen with pure vestibular activation, is consistent with the reciprocal inhibitory interaction between these two structures proposed by Brandt and colleagues (1998, 2002). While we did not find an inhibitory connection from the PIVC to hMT+, this is likely due to not including a direct vestibular stimulus (caloric or galvanic) in our experimental paradigm. Finally, there is evidence for direct projections from hMT+ to subcortical structures including the posterior thalamus and pontine nuclei, supporting our finding of a descending connection from hMT+ to the BS (Fries, 1990; Wall et al., 1982).
The direct driving effect of Photic and the modulatory effect of Motion on the connection from V1 to hMT+ have been shown previously using DCM (Penny et al., 2004). These effects are expected, given the hierarchical nature of normal visual processing (Acs and Greenlee, 2008; Cardin and Smith, 2010; Fetsch et al., 2009). The topography of the network in this study (Fig. 5) is consistent with previous investigations into how this network processes sensory stimuli pertinent to maintaining balance (Bense et al., 2006; Brandt et al., 1998; Dieterich and Brandt, 2000; Kikuchi et al., 2009).
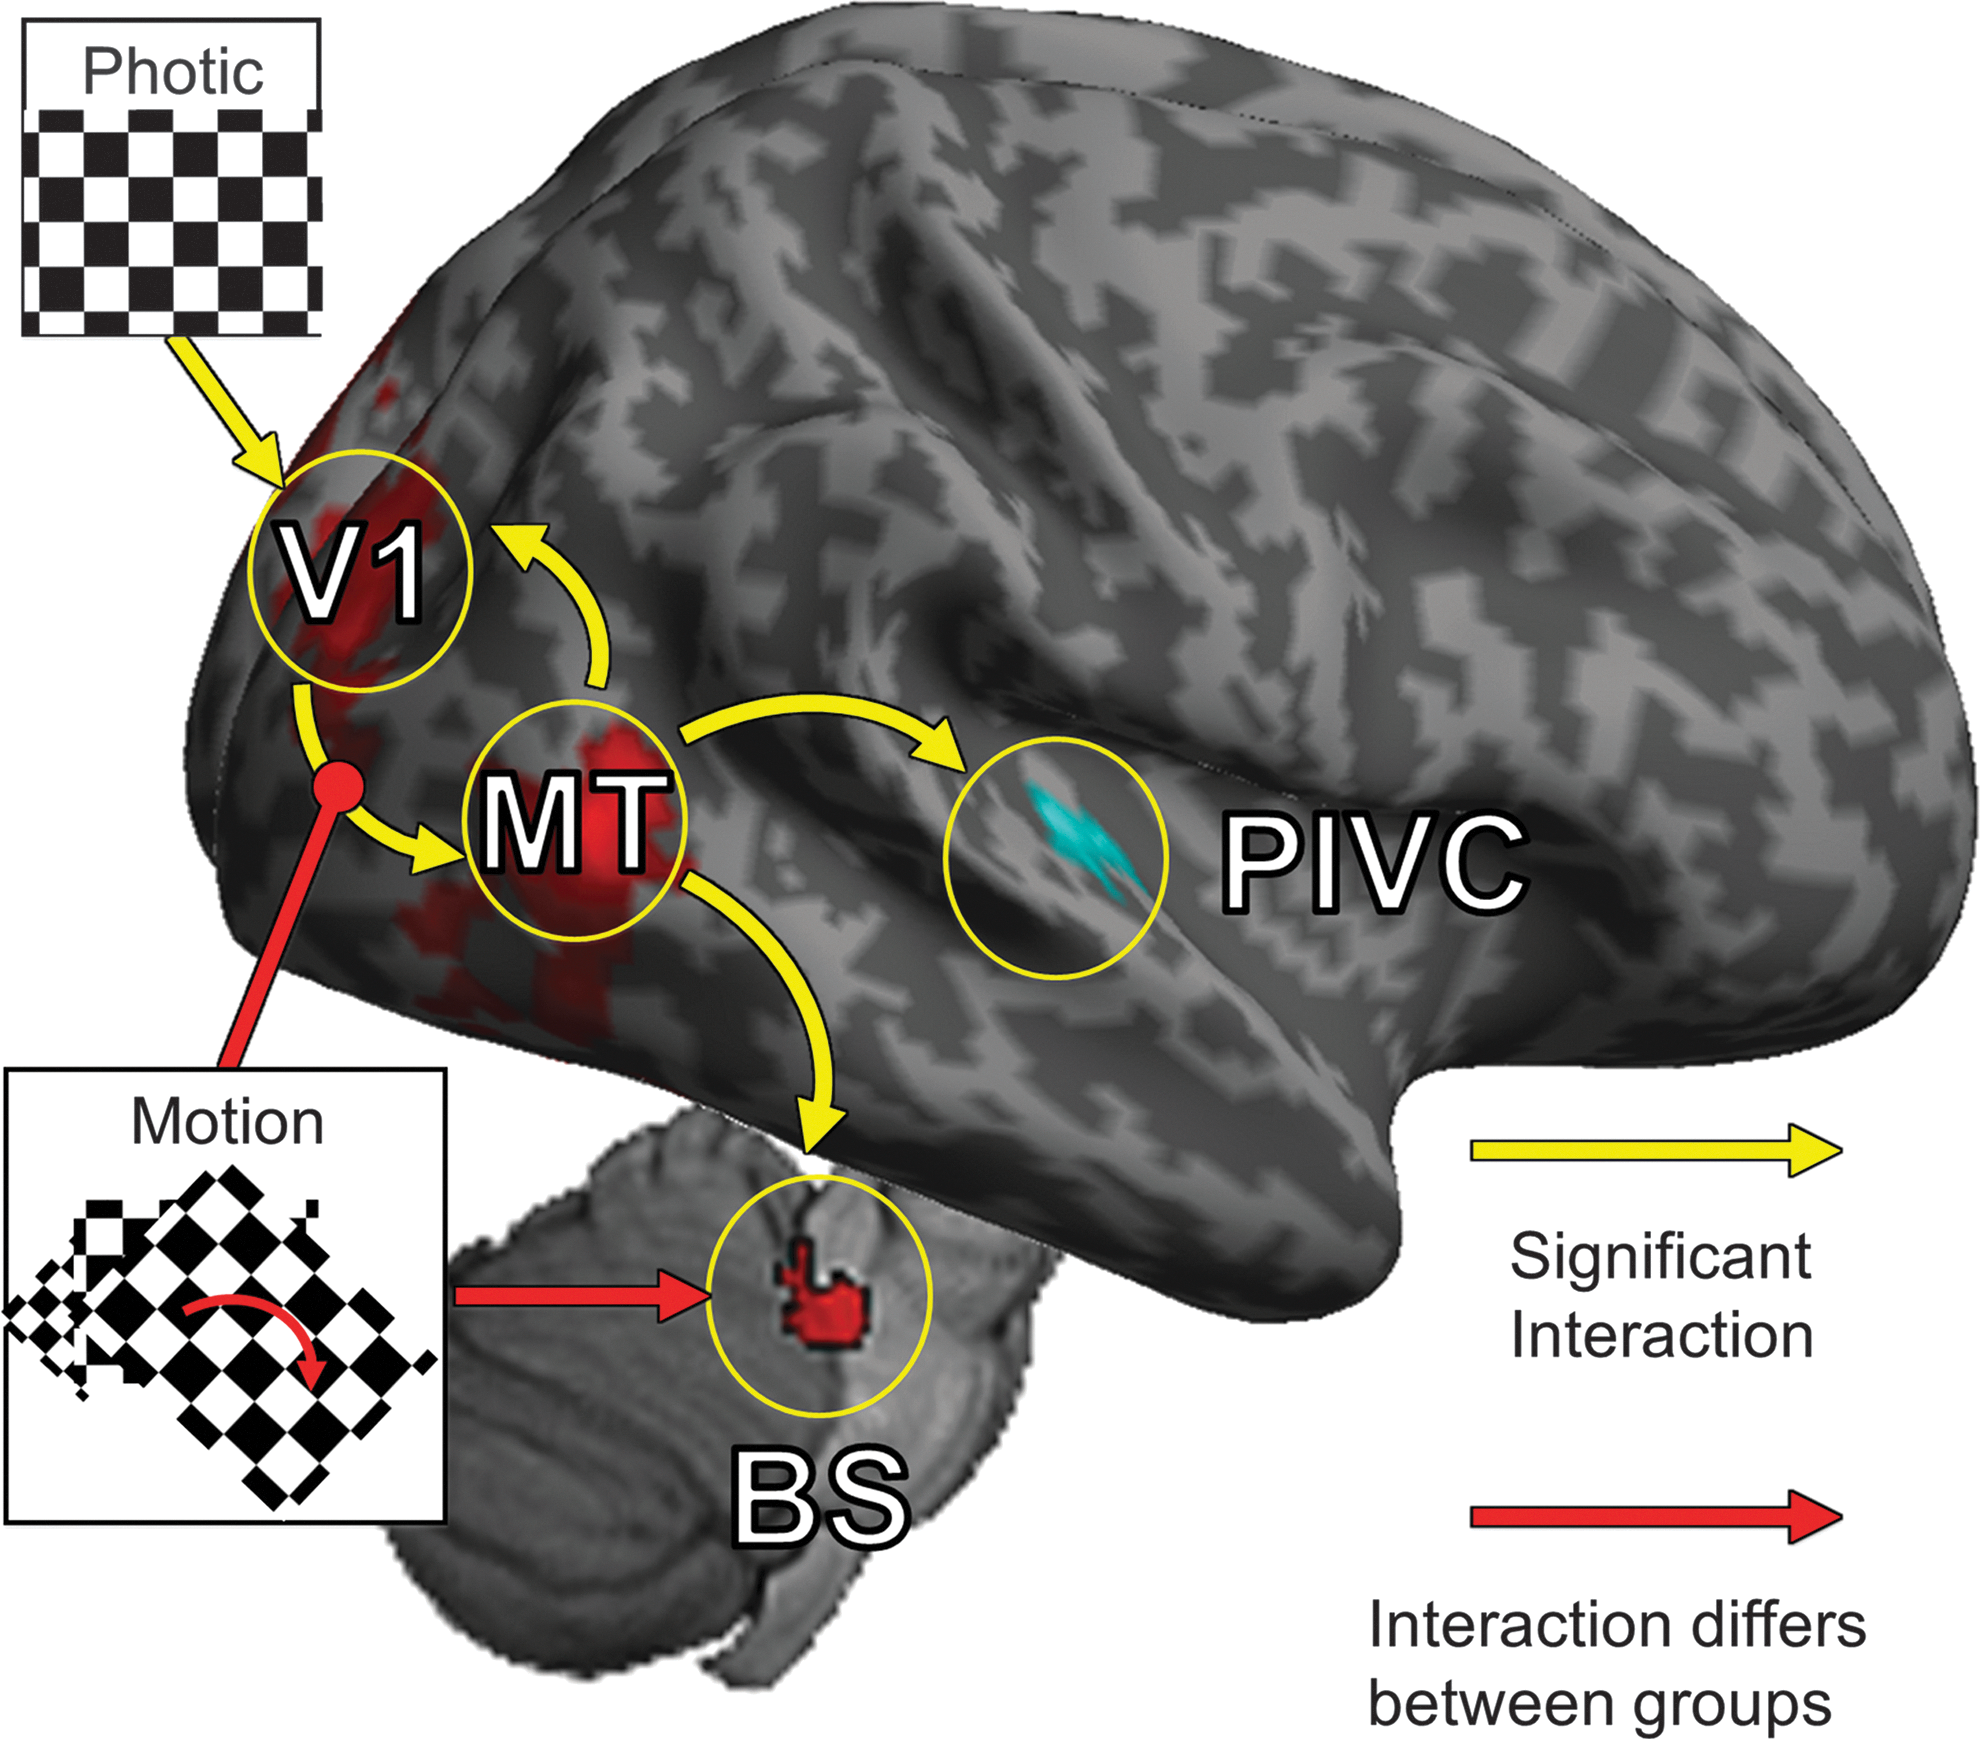
Diagram of the significant network connections found in this study. Yellow arrows represent connections that were significant but did not differ between groups. Red arrows represent connections in which there was a significant difference between groups. The strengths of all connections are listed in Table 4.
In this study, we found that the modulatory effect of Motion on the connection from V1 to hMT+ is upregulated in individuals with balance impairment compared to healthy controls. GLM-based fMRI studies have found increased activation of hMT+ in these subjects in response to optic flow, consistent with the idea that sensory loss in one modality can produce a compensatory increase in the sensitivity of another (Curthoys and Halmagyi, 1995; Dieterich et al., 2007; Wildenberg et al., 2010, 2011b). These connectivity findings support the hypothesis that the motion-sensitive visual cortices are hypersensitive to information arriving from the primary visual cortex.
After CN-NINM stimulation, these same balance-impaired individuals no longer had an upregulated modulatory effect of Motion on the network. This change can be considered a decrease in the weighting of visual motion input to the balance-processing network, consistent with other analyses of this data that showed reduced activation of hMT+ after CN-NINM (Wildenberg et al., 2011b). In particular, this change will result in less PIVC deactivation in response to motion—no longer do strong visual stimuli suppress processing of other sensory modalities (Dieterich and Brandt, 2000; Fetsch et al., 2009; Mahboobin et al., 2005). It is unclear why the direct driving effect of Photic on V1 is decreased in balance dysfunction compared to controls. This effect could represent an attempt to decrease the sensitivity of the entire visual system to compensate for the increased sensitivity to motion.
The results from this study do not indicate exactly how these modulations of cortical neural activity occur; however, they are likely related to the increased driving effect of Motion within the dorsal pons. A high-resolution fMRI study using the same stimulation paradigm and similar subject population presented here suggests that this new response to Motion within the BS is occurring in the trigeminal nuclei, which receive somatosensory afferents from the tongue (Wildenberg et al., 2011a). It is known that there are descending pathways from the superior colliculus to the vestibular nuclei that allow visual-motion information to activate the vestibular complex (Beraneck and Cullen, 2007; Blazquez and Highstein, 2007). Bidirectional connections between the vestibular and trigeminal nuclei have been found using tracer studies, while functional studies have shown that stimulation of one nucleus can modify activity within the other (Anker et al., 2003; Buisseret-Delmas et al., 1999; Herrick and Keifer, 2000; Marano et al., 2005; Satoh et al., 2009). This provides a cellular mechanism by which visual-motion information can reach the trigeminal nuclei. We hypothesize that CN-NINM directly stimulates the trigeminal nuclei and may sensitize them to this incoming information, explaining the stronger response to visual motion poststimulation (Bolognini et al., 2009).
There are several reports showing that the cortical visual-motion center hMT+ can receive and process motion information acquired via extra-visual modalities, the so-called supramodal sensory flow (Bicchi et al., 2008; Lewis et al., 2000; Matteau et al., 2010; Ricciardi et al., 2007; Sathian, 2005). In particular, studies using a similar tongue stimulation device as used in this study have found activation of hMT+ due to tactile motion on the tongue (Matteau et al., 2010; Ptito et al., 2005). Furthermore, there are data to suggest that this information may not pass through the normal visual pathway, but travel instead directly from the BS, through the thalamus, to hMT+ (Berman and Wurtz, 2010; Lopez and Blanke, 2011; Schoenfeld et al., 2002; Sincich et al., 2004). Although we did not model the thalamic nuclei in this study, it is expected that the thalamus is acting as an intermediate between the BS and cortex. Additional processing by or external effects on the thalamus could explain why the direct connection from the BS to hMT+ was not significant. Future work needs to include this structure, either defined functionally or anatomically, to more accurately model the entire network.
The information from the BS may also affect the cortex through nonlinear interactions. Unlike interconnections, these interactions allow activity within one brain region to modulate the connection between two other regions. It has already been shown that attention to motion in the visual field may exhibit nonlinear modulation of information flow through the visual processing stream (Friston and Buchel, 2000; Stephan et al., 2008). Some of the models included in this study modeled these nonlinear interactions; however, it is possible that, if present, these effects may exist at the level of the thalamus that was not modeled in this study and should be included in more complete models.
These individual pieces of data allow us to hypothesize about the underlying neurobiological mechanism of CN-NINM (Fig. 6). Information about visual motion normally descends to the vestibular nuclei from the thalamus and/or superior colliculus. Stimulation of the tongue induces neuroplasticity in the trigeminal nuclei such that they now respond to this information from the vestibular nuclei. Without passing through V1, this information ascends to the thalamus and then on to hMT+. Activation of this new pathway, even without concurrent stimulation, leads to normalization of activity within hMT+. This sustained alteration of balance processing within the network could explain the reduced postural sway and improvements on functional tests seen in balance subjects after CN-NINM.
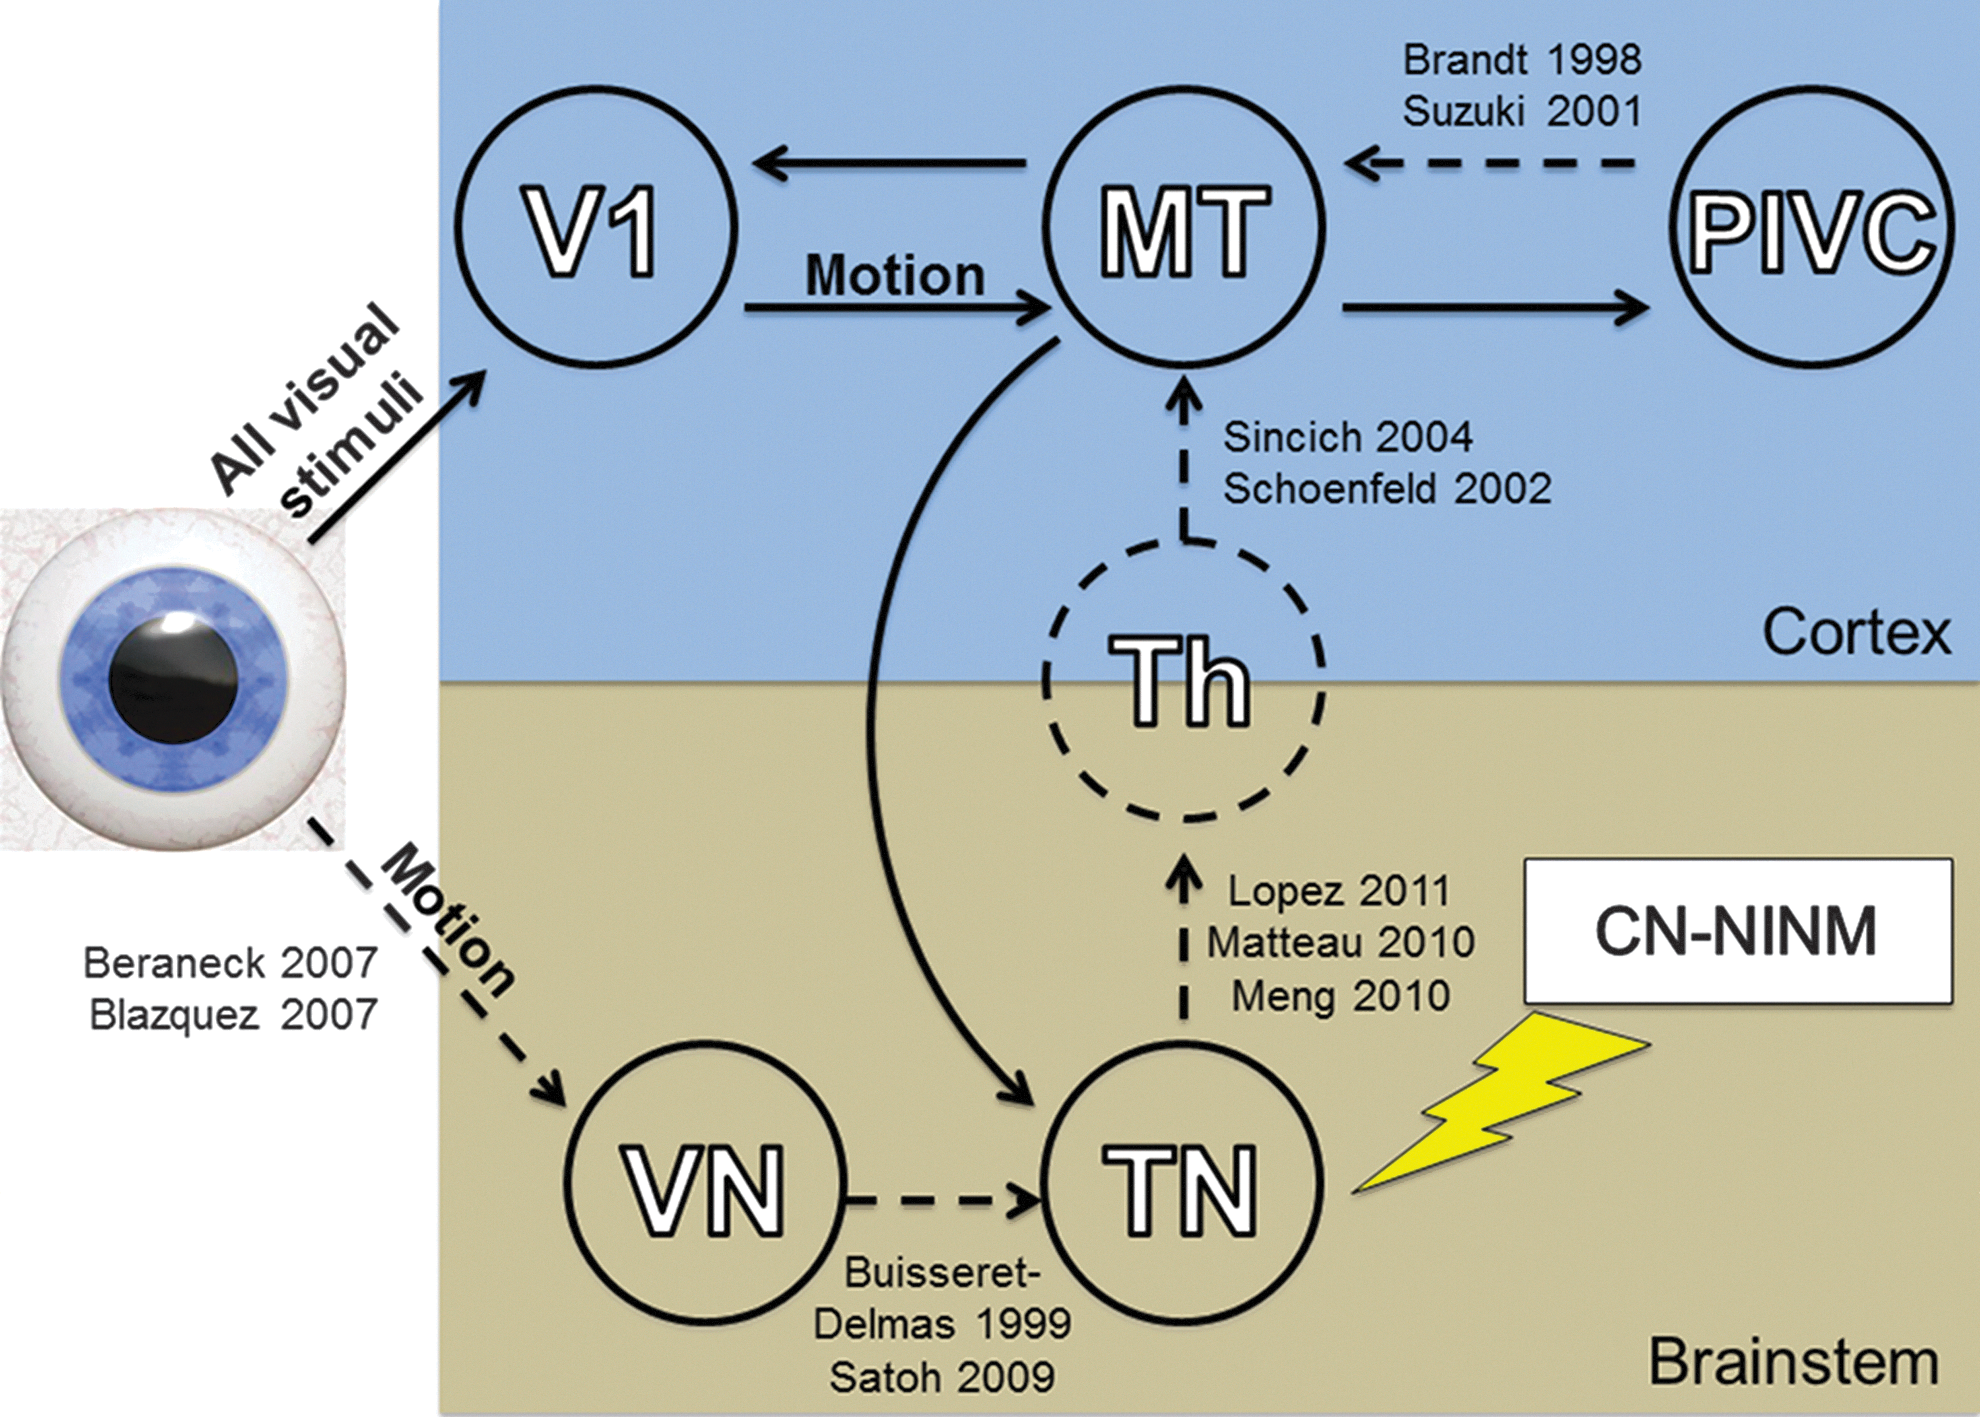
Diagram of the proposed circuit explaining how CN-NINM stimulation can modify cortical processing of visual motion. Solid lines indicate connections suggested by this study. Dashed lines indicate connections discovered or proposed by the studies listed next to the connection. Proximal structures including the retina, lateral geniculate nucleus, and superior colliculus are not shown. Note that in this study a connection between hMT+ and a functional brainstem region was found, but the difference between the trigeminal and vestibular nuclei could not be resolved. Therefore, this arrow is not included in the proposed circuit. V1, primary visual cortex; hMT+, motion-sensitive visual cortex; VN, vestibular nuclei; TN, trigeminal nuclei; Th, thalamic nuclei.
The data from the original study and thus the analysis presented here were limited by a lack of control subjects who did not receive CN-NINM stimulation. The time-intensive stimulation procedures prevented recruitment of subjects willing to be assigned to a placebo, while the noticeable sensation of the stimulation on the tongue further reduced the ability to create a true placebo effect. We believe that the chronic nature of the impairments in the included subjects makes spontaneous recovery unlikely. It is possible that some of the observed changes between the first and second scan for the balance-impaired subjects could have been due to increased comfort in the scanner, or other variables such as sleep or caffeine use. We believe that these effects are minimal as all balance-impaired subjects had undergone one (or multiple) clinical MRIs in the course of the workup for their disorder, and it is unlikely that individual factors (sleep, caffeine, etc.) would present at the group level. We also believe the 5-day separation between the pre- and post-fMRI scans eliminated the possibility of habituation to the visual stimuli as exposure to optic flow is common in everyday life. Future studies are needed to verify that the changes seen in the pattern of neural activity in response to optic flow are indeed due to the stimulation alone.
The results from this study suggest that a cortico-pontine circuit may be responsible for the cortical neuromodulation seen after information-free tongue stimulation. Future directions include connectivity studies that focus on the BS, allowing a differentiation of the different BS nuclei and how balance-pertinent information flows between these nuclei. Subsequent studies also need to include the thalamus that is almost universally involved in communication between cortical and subcortical structures. In addition, a study that incorporates both visual and vestibular stimuli could allow more complete mapping of the dynamic interaction between these two sensory systems.
Conclusion
The network that processes visual motion includes multiple regions and overlaps significantly with the balance-processing network. These many regions must interact properly to process the multiple modalities that provide information pertinent to maintaining balance. Here we have used DCM to map some of the connections between the primary visual cortex (V1), the motion-sensitive visual cortex (hMT+), the PIVC, and a region within the BS that is modulated by CN-NINM tongue stimulation. The results of the analysis confirm previous imaging studies showing hypersensitive responses of hMT+ to visual motion in balance-impaired individuals compared to normal controls. This hypersensitivity is reduced after CN-NINM, and this reduction is likely related to the sustained neuromodulation within the BS. This analysis begins to elucidate how the tongue can be a gateway to the central nervous system (Mandonnet et al., 2010). Finally, we propose a functional neuroanatomical circuit that may explain how electrical stimulation, applied to the tongue, can influence cortical processing of visual motion.
Footnotes
Acknowledgments
The authors gratefully acknowledge Kelsey Hawkins for clinical coordination and Dana Tudorascu for statistical consultation in this study. They also thank Sterling Johnson for use of the goggle display system. This study was supported by grant numbers T90DK070079 and R90DK071515 from the National Institute of Diabetes and Digestive and Kidney Diseases, 1UL1RR025011 from the Clinical and Translational Science Award (CTSA) program of the National Center for Research Resources, National Institutes of Health, and UW-Madison Industrial & Economic Development Research funding.
Author Disclosure Statement
Joseph Wildenberg reported no financial or potential conflicts of interest. Authors Danilov, Kaczmarek, and Tyler have an ownership interest in Advanced Neurorehabilitation, LLC, which has intellectual property rights in the field of research reported in this publication. Mary Meyerand reported no financial or potential conflicts of interest.
The content is solely the responsibility of the authors and does not necessarily represent the official views of the National Institute of Diabetes and Digestive and Kidney Diseases or the National Institutes of Health.