
Abstract
The neurophysiological mechanism underlying sedation, especially in school-aged children, remains largely unknown. The recently emerged resting-state functional magnetic resonance imaging (rsfMRI) technique, capable of delineating brain's functional interaction pattern among distributed brain areas, proves to be a unique and powerful tool to study sedation-induced brain reorganization. Based on a relatively large school-aged children population (n=28, 10.3±2.6 years, range 7–15 years) and leveraging rsfMRI and graph theoretical analysis, this study aims to delineate sedation-induced changes in brain's information transferring property from a whole brain system perspective. Our results show a global deterioration in brain's efficiency properties (p=0.0085 and 0.0018, for global and local efficiency, respectively) with a locally graded distribution featuring significant disruptions of key consciousness-related regions. Moreover, our results also indicate a redistribution of brain's information-processing hubs characterized by a right and posterior shift as consistent with the reduced level of consciousness during sedation. Overall, our findings inform a sedation-induced functional reorganization pattern in school-aged children that greatly improve our understanding of sedation's effect in children and may potentially serve as reference for future sedation-related experimental studies and clinical applications.
Introduction
L
Recently, pediatric procedural sedation, or non-operating-room anesthesia for children, has increased exponentially in the last years, in part due to the widespread availability of sophisticated diagnostic and neuroimaging techniques (Lalwani, 2006). However, most previous studies focus on adult population leaving the effect of sedation in children largely unstudied despite of the abundant evidence for the developmental changes in brain's functional organization (Fair et al., 2008, 2009; Gao et al., 2009, 2011, 2012; Supekar et al., 2009). Therefore, systematic investigation of the neurophysiological mechanism of sedation in children will have both high scientific and clinical significance. In this study, we aim to provide a detailed delineation of sedation's effect in school-aged children based on rsfMRI (Biswal et al., 1995) and graph theoretical analysis (Rubinov and Sporns, 2010). By monitoring different brain regions as nodes and their functional interactions as edges, graph theoretical analysis provides a unique tool for the examination of brain's information transferring properties and has been widely applied in brain development (Gao et al., 2011; Supekar et al., 2009), aging (Achard and Bullmore, 2007; Zhu et al., 2012), and diseases (Wang et al., 2012; Xia and He, 2011; Zhang et al., 2011). Such analysis, capable of delineating brain's information-processing efficiency at both global and local levels (Achard and Bullmore, 2007; Latora and Marchiori, 2001; Rubinov and Sporns, 2010), may serve as an excellent choice to investigate the effect of sedation on the whole brain functional system. Specifically, we recruited a relatively large healthy children population (n=28, 20 boys, aged 10.3±2.6 years) and used chloral hydrate (CH) to modulate consciousness to achieve a pediatric sedation score of 5 (asleep, easily arousable) (Saint-Maurice et al., 1986). RsfMRI data during both awake resting state and sedation-induced sleeping state were acquired. Based on graph theory analysis, brain's global efficiency, local efficiency, and betweenness centrality (i.e., brain's functional “hubs”) were examined and compared between the two brain states. Given the evidence that effective information sharing and integration among the whole brain system is essential for a conscious brain state (Alkire et al., 2008; Schrouff et al., 2011), we hypothesize that the sedation-induced lower level of consciousness in children will be accompanied by a global deterioration of brain's global and local efficiency and a redistribution of brain's hubs due to the potentially regional inhomogeneous sedation effect.
Materials and Methods
Participants
All participants were recruited from Hunan Children Hospital following a flyer posted in the hospital. Exclusion criteria include history of head trauma or surgery, mental disorders, respiratory neuromuscular disorders, asthma, drug addiction, motion sickness, or allergy to CH. After exclusion, all subjects were short in stature, but only those showing normal pituitary structure and growth hormone based on MRI examination and blood test, respectively, were considered for participation. Finally, 28 children (aged 10.3±2.6 years, range 7–15 years; 20 boys; body weight 26.8±6.4 kg) were included. All of them were right-handed. Written parental consent was obtained for all participants. All participants received financial compensation for inconvenience and time lost during the experiment. The ethical committee of the Hunan Children Hospital approved the study protocol.
Imaging acquisition
All scans were performed on a Siemens Sonata 1.5-T scanner (Siemens AG, Erlangen, Germany) equipped with a 12-channel phased-array head coil at the Hunan Children Hospital. For each subject, 180 resting-state functional images were acquired with a single-shot echo-planar imaging sequence [repetition time (TR)=2000 ms, echo time (TE)=28 ms, matrix=64×64, field of view (FOV)=192 mm×192 mm, 5-mm slice thickness, 22 axial slices, 0.5-mm gap, flip angle=90°]. All subjects were instructed to relax, stay awake, lie still, keep their eyes closed, and not to think of anything in particular. A high-resolution T1-weighted anatomical image for each subject was also acquired, using a sequence with 160 sagittal contiguous slices (TR=1900 ms; TE=3.4 ms; flip angle=15°; FOV=240 mm×240 mm; matrix=256×256; slice thickness=1.0 mm, no gap). After the initial awake resting acquisition, subjects were sedated and scanned again under sedation.
Sedation protocol
Each participant received 50 mg/kg oral CH guided by a radiology nurse, trained and certified to administer sedation, following guidelines and protocols established by the radiology sedation committee at the hospital. The sedative effect of CH was assessed using a pediatric sedation scoring system (Saint-Maurice et al., 1986). This score is in the range 1–6: 1 (awake, anxious, jittery, or crying), 2 (awake, alert, normal), 3 (awake, still, quiet), 4 (light sleepiness, decreased reactivity), 5 (asleep, easily arousable), and 6 (deep sleep, hardly arousable). After the administration of CH, participants laid in bed in a quiet place until a sedation score of 5 was achieved. Subsequently, the participants were carried to the scanner bed where another evaluation was done and we waited until a sedation score of 5 was reached before we started the scanning. During the scan, our technicians visually monitored all subjects. Besides, a radiology nurse was inside the scanner room monitoring the subject during the scan. No wake-up or apparent movement was reported for any included subject during the scanning session. The administration of CH was never repeated. Blood pressure, heart rate, and respiratory rate were continuously monitored by the radiology nurse for 4 h after scan.
Data preprocessing
Functional data were preprocessed using FMRIB's Software Libraries (FSL, v 4.1.9) (Smith et al., 2004). The preprocessing steps included discarding the first 10 volumes, slice timing correction, motion correction, spatial smoothing with a Gaussian kernel (full width at half maximum=6 mm), and high-pass (>0.01 Hz) and low-pass filtering (<0.08 Hz). Mean signal from white matter, cerebrospinal fluid, global brain signal, and six motion parameters estimated in the motion correction step were removed using linear regression. To test the effect of global signal regression on our results, the efficiency changes (as described below) were also examined without the step of global signal regression. To further reduce the effect of motion on functional connectivity measures, the global measure of signal change (root mean square variance of the derivative time series over voxels [DVARS]) and frame-wise displacement (FD) were controlled to be <0.5% blood oxygen level dependent signal and 0.5 mm, respectively, as proposed by Power et al. (2012). Moreover, to test whether there is a significant difference in movement parameters between states, we performed a paired t-test on the average FD (defined as the sum of the absolute displacements between consecutive volumes; rotations are converted to translations considering the corresponding translation on the surface of a sphere of radius 50 mm) between awake and sedation (Table S1; Supplementary Data are available online at
Data analysis
For each subject, 90 mean time series were extracted, one for each cerebral region defined in the automated anatomical labeling template (Tzourio-Mazoyer et al., 2002). The Pearson's correlation coefficients for each pair of regions were obtained to form a correlation matrix for each individual subject. After Fisher's Z transform, average matrix was obtained and two-tailed t-test was applied to identify significant interactions for each state at p<0.05 after controlling for false discovery rate (FDR) <0.05 (Benjamini and Hochberg, 1995). Connection density (the number of significant positive connections over all possible ones) was calculated for each state separately and the collections of significant positive connections were compared between the two states using two-sample t-test to detect potential significant changes in the connection strength. The breakdown of the connection strength changes within and between different lobes (i.e., frontal, parietal, occipital, temporal, and subcortical; Table S2) was also conducted to delineate the lobe-wise distribution of such changes.
To calculate graph theoretical measures, a significant connection mask was defined for awake resting and sedation state separately and applied to each subject to extract individual functional connectivity matrices for calculation of efficiency measures. For each individual matrix, only positive values in the significant connection mask were included. To remove the potential bias of the different number of connections in the comparison, we applied a density normalization strategy. Briefly, for the paired matrices of each subject during the two states, the connections with the lowest values in the denser network were sequentially removed until the same connection density was achieved between the two states for the same subject. This procedure ensures that the detected differences in graph theoretical measures will only result from different magnitude/arrangement of connections rather than the number of connections. To validate the robustness of our findings regarding the selection of masks, five different approaches of defining masks were explored: (1) applying separate significant connection masks with the density normalization step (main result); (2) applying separate significant connection masks without the density normalization step; (3) applying the significant connection mask defined from awake state to both sets of data (awake and sedation); (4) applying a range of different costs (from 23.5% to 27.5% at a 0.5% step size, which is centered at the cost defined by the significance masks of the two states; see Fig. 1) and obtain the average graph theoretical measures; and (5) applying a full mask (i.e., including all positive values regardless of their significance) for both states. Considering the two preprocessing strategies (i.e., with and without global signal regression), this results in 5×2=10 different schemes to calculate the efficiency measures (Table S3).
Sedation-induced functional connectivity changes.
Brain's global and local efficiency measures estimate the ease with which brain regions share information with each other and were obtained using the brain connectivity toolbox implemented in Matlab (Rubinov and Sporns, 2010). The whole brain global efficiency is defined for weighted undirected networks as,
where n is the number of nodes, N the set of nodes within the whole brain system, dij
is the shortest path between nodes i and each other node j, and GEi
is the global efficiency for the node i (Rubinov and Sporns, 2010). The whole brain local efficiency uses similar formula:
where n is the number of nodes, N the set of nodes within the whole brain system, LEi is the local efficiency for the node i, Ni is the neighborhood regions of node i, djh (Ni ) is the shortest path between nodes j and each other node h within Ni , wij and wih are the connection weights between nodes i and j, and j and h respectively, and ki is the degree of node i (Rubinov and Sporns, 2010). After calculation, both the global and local efficiency values were compared between the two states using paired t-test at both whole brain and regional levels to detect statistically significant changes. At the regional level, significant changes were considered at p<0.05 after FDR correction. After that, the collections of significant positive connections (based on the group-mean correlation matrices) associated with the nodes showing significant changes were compared between the two states using two-sample t-test to detect potential significant changes in connection strength.
To further explore the regions showing important controls of information flow (i.e., hubs) (Rubinov and Sporns, 2010), the betweenness centrality was also calculated and compared. Betweenness centrality is defined for weighted undirected networks as,
where ρhj is the number of shortest paths between h and j, and ρhj (i) is the number of shortest paths between h and j that pass through the node i (Rubinov and Sporns, 2010). The top 10 hubs during each of the two states were presented to show the redistribution pattern of the most important hubs. Similarly, the collections of significant positive connections possessed by the two sets of hubs (based on the group-mean correlation matrices) were compared using two-sample t-test to delineate potential connection strength changes. All efficiency/betweenness measures were calculated based on the weighted undirected matrices.
Results
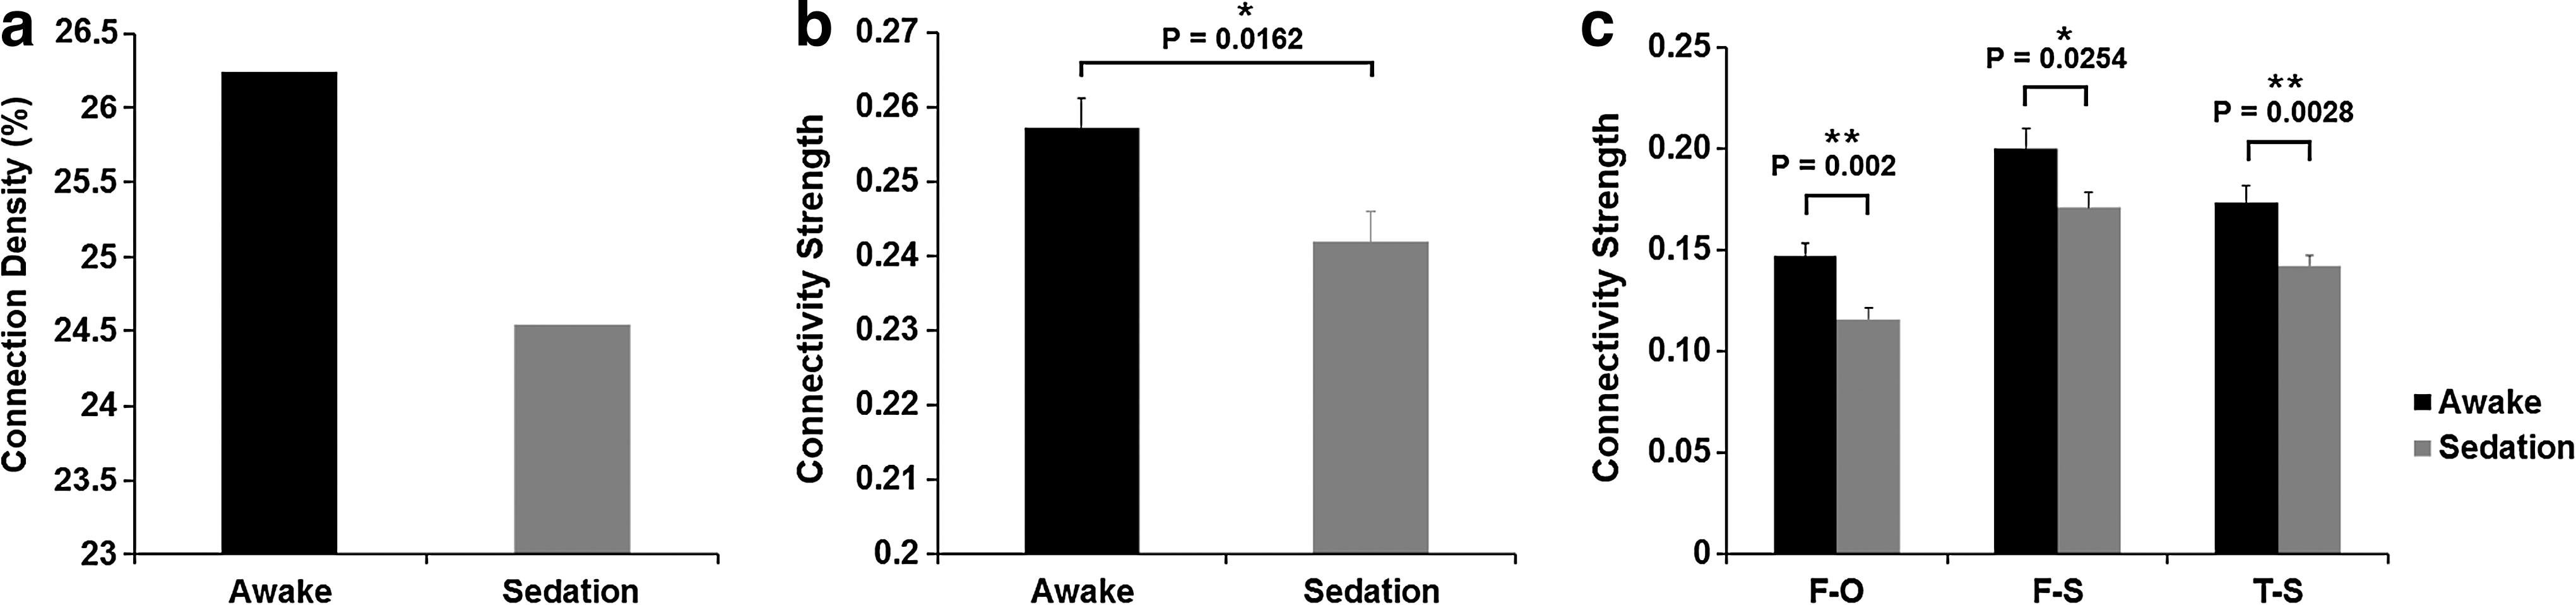
Minimal motion was detected and paired t-test of average FD between awake (0.0603±0.0143 mm) and sedation (0.0659±0.0246 mm) conditions showed no significant difference (p=0.2483; Table S1). Consistently, the scrubbing process also revealed no volumes to be removed due to excessive movement in any subject/condition. Compared with awake resting, sedation results in reductions of both the density and the magnitude of the whole brain functional connectivity matrix (Fig. 1). Specifically, the density of significant positive connections is reduced from 26.24% during awake to 24.54% during CH-induced light sedation (Fig. 1a) and the magnitude of those significant positive connections is also significantly decreased (p=0.0162; Fig. 1b). The breakdown of the connection strength changes within and between lobes is provided in Table 1. A general reduction of lobe-wise connectivity is observed with those between frontal–occipital and temporal–subcortical lobes showing statistically significant changes (p=0.002 and 0.0028, respectively; Fig. 1c) and frontal–subcortical connections showing marginally significant changes (p=0.0254; not significant after FDR correction; Fig. 1c).
Differences evaluated with two-group t-test on significant positive connections in the group mean connectivity matrices. Bold values: significant at p<0.05. Underscored bold values: significant at false discovery rate–corrected p<0.05. There were no significant occipital–subcortical connections during sedation. N.A., not applicable; SD, standard deviation.
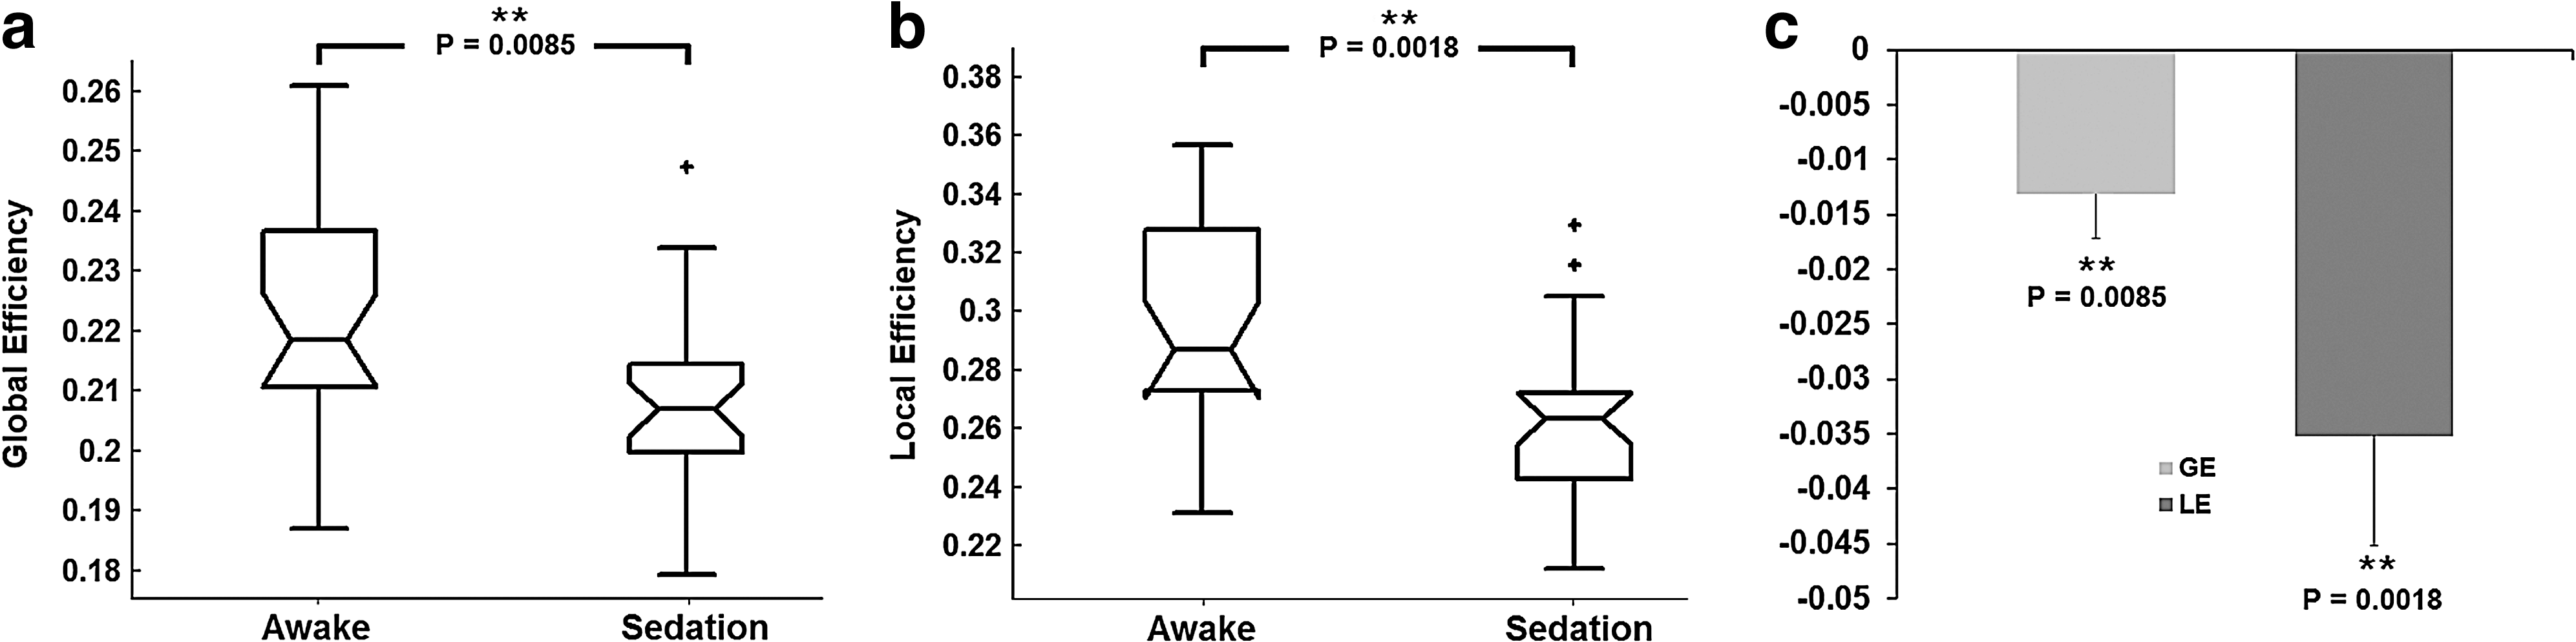
For graph theoretical measures, the global and local efficiency are both significantly reduced during sedation (p=0.0085 and p=0.0018, respectively; Fig. 2), which is highly consistent with our hypothesis. Actually, a significant decrease of global/local efficiency is consistently observed regardless of the different masking strategies and the application of global signal regression (except for local efficiency using separate masks without controlling for density and regressing out the global signal; Table S3), strongly supporting the robustness of this finding.
Sedation-induced efficiency changes.
To further examine the regional changes of global/local efficiency induced by sedation, nodal efficiency values are compared between states. Thirty-two regions, residing in all lobes of the brain, show a significant decrease in local efficiency (p<0.05, FDR corrected; Fig. 3a, b and Table 2). Collectively, these regions show less number of significant positive connections (Fig. 3c) and significantly weaker connectivity strength (p=1.8×10⁻⁵; Fig. 3d). Moreover, 20 regions show significantly reduced global efficiency (p<0.05, FDR corrected; Fig. 4a, b and Table 3). The only region showing increased global efficiency during sedation is the right angular gyrus (p=0.001, FDR corrected; Fig. 4a, b and Table 3). Consistently, the set of regions showing reduced global efficiency collectively possess less significant connections (Fig. 4c), while right angular region shows an increase in the number of significant connections (Fig. 4e). The collection of connections associated with the regions showing significant decrease in global efficiency shows a trend of decrease in connection strength (p=0.0876; Fig. 4d), while that of the right angular regions shows nonsignificant changes (p=0.9420; Fig. 4f).
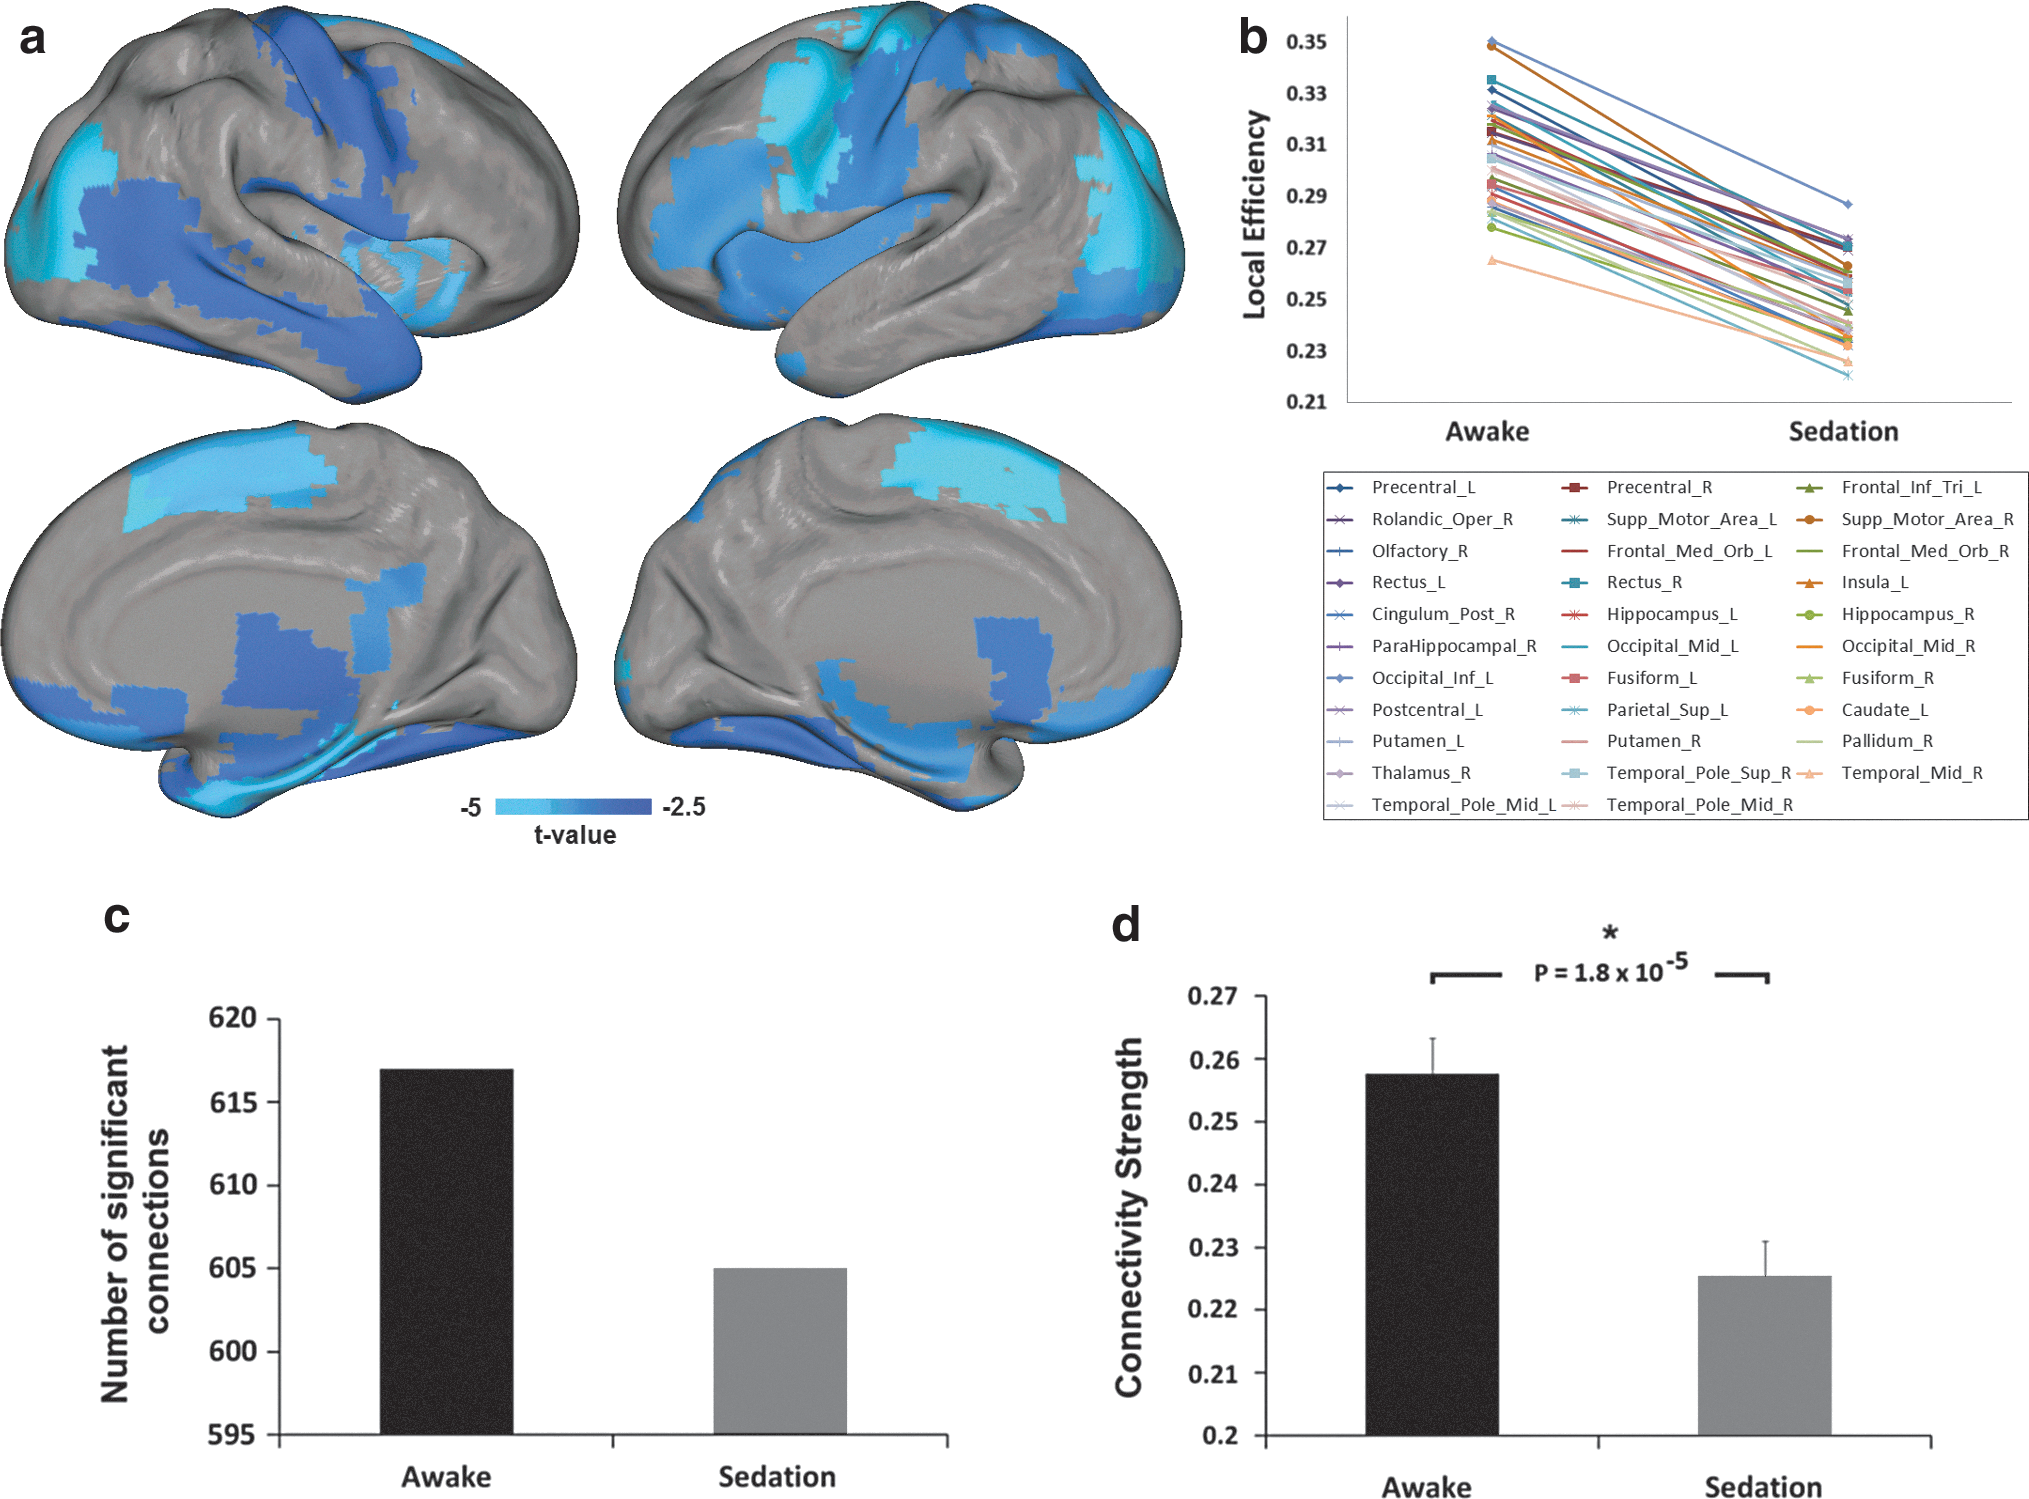
Sedation-induced regional local efficiency changes.
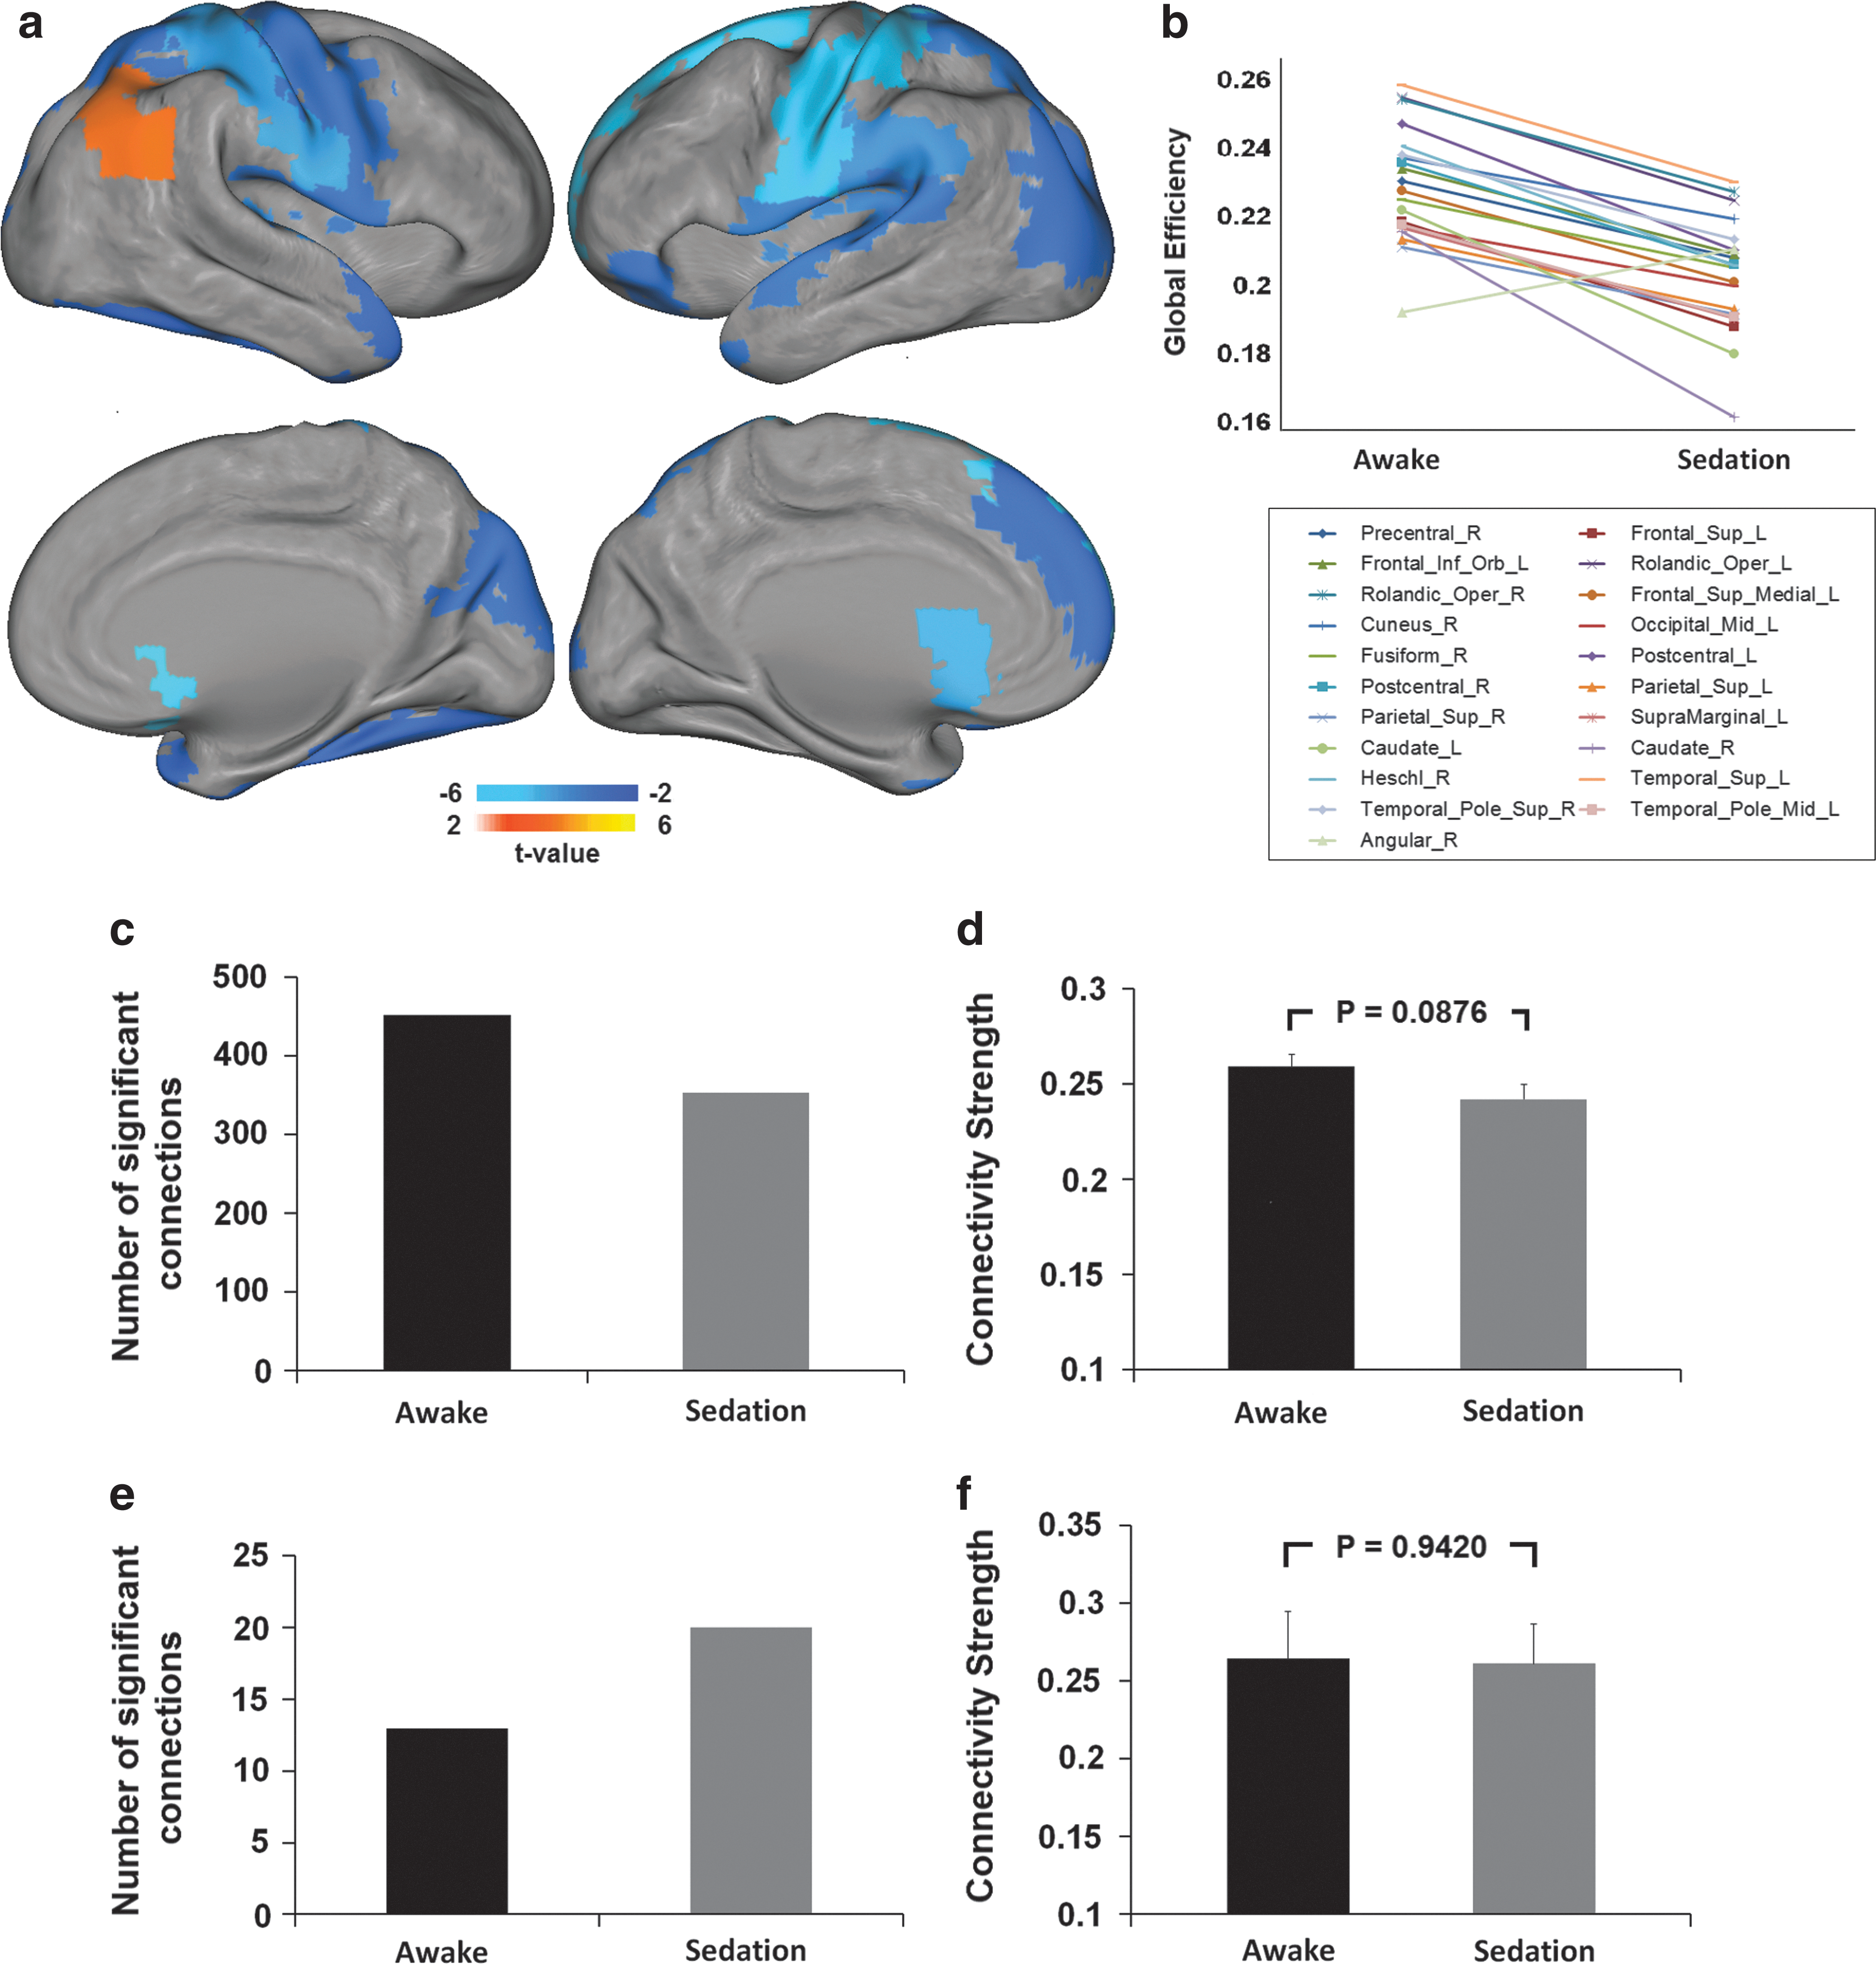
Sedation-induced regional global efficiency changes.
AAL, automated anatomical labeling.
Finally, the top 10 hubs with the highest betweenness centrality (i.e., hubs) and their associated connections are shown in Figure 5a and b, for awake and sedation state, respectively. Their corresponding statistics during each state are shown in Figure 5c and d. Specifically, the top 10 hubs in the awake condition include the left superior medial frontal gyrus, bilateral superior frontal gyri, left inferior orbital frontal gyrus, right superior orbital frontal gyrus, right heschl gyrus, left amygdala, left posterior cingulum, and bilateral superior parietal gyri. Such a distribution features a roughly bilateral symmetric distribution (6/4 hubs in the left/right hemisphere) and an emphasis on frontal regions (5 hubs). However, the hubs show an apparent redistribution during sedation. First, there is a clear shift to the right hemisphere: 7 out of 10 hubs are now in the right hemisphere, including the right middle occipital, right middle and inferior temporal gyri, right posterior cingulum, right putamen, right precuneus, and right olfactory gyrus; the three left hemisphere hubs are left middle frontal, left inferior parietal, and left middle occipital gyri. Second, there is an apparent shift to the posterior part of the brain, leaving only one frontal hub (i.e., left middle frontal gyrus). Finally, the top 10 hubs in sedation collectively possess less number of connections (Fig. 5c) and a trend for weaker connectivity strength (Fig. 5d).

Sedation-induced reorganization of hubs.
Discussion
In this study, we adopted a whole brain efficiency perspective to explore the effect of mild sedation in children. Our results showed a reduction in whole brain functional connectivity in terms of both connection density and magnitude (Fig. 1 and Table 1). Moreover, brain's global and local efficiencies show global but locally graded reduction during sedation (Figs. 2 –4 and Table S3). Finally, brain's hub distribution is also dramatically altered featuring a right and posterior shift (Fig. 5). These findings inform a specific functional reorganization pattern during CH-induced light sedation in school-aged children.
At the whole brain level, consistent with previous findings using a similar graph theoretical analysis in adults (Schrouff et al., 2011; Schroter et al., 2012), our results show significant decreases of the whole brain connectivity/efficiency measures at both global and local levels during sedation (Figs. 1 and 2), indicating disrupted functional integration among the whole brain system. More specifically, our results highlight significant cortical–subcortical connectivity disruption (i.e., frontal–subcortical, temporal–subcortical; Fig. 1 and Table 1), which was also consistently observed in both adult studies, underscoring the importance of subcortical structures in the maintenance of consciousness (Alkire and Miller, 2005; Schlunzen et al., 2006, 2010, 2012; Sun et al., 2008; Van der Werf et al., 2002). Moreover, the observed frontal–occipital connectivity disruption is consistent with animal electroencephalography studies showing reduced frontal–occipital coherence during general anesthesia (Imas et al., 2005, 2006; John et al., 2001). These findings are in great support of the cognitive unbinding model which states that the hypnotic anesthetic agents alter the functional interactions among different brain areas resulting in a reduced capability to integrate information at the whole brain level and hence reduced consciousness (Mashour, 2004, 2005; Massimini et al., 2005; Tononi, 2004). Interestingly, natural sleep also represents a state with a reduced level of consciousness (Franks, 2008) and shares similar electroencephalographic patterns and metabolic changes with drug-induced sedation (Franks, 2008; Heine et al., 2012; Murphy et al., 2011; Stamatakis et al., 2010). Therefore, it is likely that similar disruption of the brain's functional integration also occurs during natural sleep (Tononi, 2004; Tononi and Massimini, 2008). Indeed, recent studies have shown reduced thalamocortical connectivity at sleep onset (Spoormaker et al., 2010), as well as diminished cortical network connectivity (Horovitz et al., 2008; Samann et al., 2011; Wu et al., 2012) and whole brain connectivity (Spoormaker et al., 2010) during slow-wave sleep. Collectively, these findings imply that the disrupted ability for functional integration may be a common denominator underlying the reduced level of consciousness during both natural sleep and drug-induced sedation. However, the potential brain mechanism differences between these two states deserve further delineation.
At the regional level, in line with previous PET studies (Alkire and Miller, 2005; Fiset et al., 1999; Schlunzen et al., 2006, 2010, 2012; Sun et al., 2008), our results showed locally graded disruption in both local and global efficiencies. Specifically, the regions with significant decrement in local efficiency are distributed in frontal (n=12 regions), parietal (n=3), temporal (n=7), occipital (n=5), and subcortical (n=5) areas. Of notice, the frontal lobe includes the most regions affected such as bilateral primary and supplementary motor areas in charge of motor output; right olfactory and bilateral rectus gyri important for olfactory perception (Killgore et al., 2010); the left triangular part of the inferior frontal gyrus related to language production (Geschwind, 1970); and medial orbitofrontal gyri involved in decision making (Glascher et al., 2012). Other areas include the bilateral middle occipital gyri, left postcentral gyrus for visual and sensory processing, respectively, and hippocampus area related to long- and short-term memory (Woodward et al., 2012). The significant decrease of local efficiency in these areas may represent disruptions in their local information communication and hence reduced functioning of their specialized functions (Davis et al., 2007; Liu et al., 2012; Mhuircheartaigh et al., 2010). Notably, we also observed a decrease of local efficiency among subcortical structures such as left caudate nucleus, right pallidum/thalamus, and bilateral putamen. Thalamus has long been recognized as an important structure implicated in sedation-induced loss of consciousness (Alkire and Miller, 2005; Schlunzen et al., 2006, 2010, 2012; Sun et al., 2008; Van der Werf et al., 2002). Although still in debate, the thalamus has been proposed as a switch-like structure controlling the consciousness–unconsciousness switching (Alkire, 2008; Alkire et al., 2008). Our findings, although still not able to inform the debate regarding whether this is a consequence or trigger of loss of consciousness, do provide further support for the association between subcortical structure function and consciousness.
The regions with significant decrement in global efficiency are also widespread and cover frontal (n=6 regions), parietal (n=5), temporal (n=4), occipital (n=3), and subcortical areas (n=2). Among these regions, parietal association areas such as bilateral superior parietal gyri and left supramarginal gyrus are synchronized during the resting state (Fox et al., 2006) and have been related to a dorsal attention network involved in preparing and applying goal-directed selection for stimuli and responses (Cabeza et al., 2011; Corbetta and Shulman, 2002). As a result, the reduced global efficiency may suggest interrupted attention processing potentially contributing to the reduced ability to orient attention during mild sedation (Corbetta and Shulman, 2002). Moreover, while other studies have shown that motor and other primary networks (e.g., auditory and visual) preserve or even increase their within-network connectivity (Boveroux et al., 2010; Greicius et al., 2008), our results implied that sedation affects the interaction of primary motor and sensory areas (i.e., the postcentral and rolandic operculum gyri in both hemispheres and right precentral gyrus) with other remote brain areas, potentially leading to the observed compromised global efficiency (Fig. 4). Such disruption could be related to the reduced level of somatosensory information integration with higher order decision-making cortices and diminished motor output as commonly observed during sedation (Campagna et al., 2003). Consistent with our results, Martuzzi et al. (2010) found reduced connectivity between brodmann area 1 and distant brain areas in healthy adults under light anesthesia. Moreover, Schrouff et al. (2011) also found decreased functional integration between the motor network and the salience, dorsal attention, and visual networks in adults under deep propofol sedation. Among the other regions, the left medial superior frontal cortex is one of the main hub regions within the default network typically involved in self-referential mental activities (Goldberg et al., 2006; Gusnard et al., 2001). The significant disruption of global efficiency associated with this region is consistent with previous findings (Boveroux et al., 2010) suggesting a reduced level of self-awareness during sedation. Surprisingly, the right angular gyrus shows an increase in global efficiency during mild sedation. The angular gyrus, also part of the default network, located in the posterior part of the inferior parietal lobule, has been shown to participate in a variety of tasks (for a review, see Seghier, 2012), including memory retrieval, internal mentation, autobiographical memory, and mental scene construction (Andrews-Hanna et al., 2010; Kim, 2010; Spaniol et al., 2009; Vilberg and Rugg, 2008). It is possible that part of these cognitive processes remains active during the light sedation status used in this study, potentially leading to the observed increase in global efficiency. However, future studies particularly focusing on this region are needed to pinpoint the exact role of the angular gyrus during sedation.
The right and posterior shift of hubs during sedation is intriguing. Specifically, a roughly left-right symmetric hub distribution featuring medial prefrontal and parietal regions during awake resting state is consistent with previous resting-state functional connectivity studies (Hagmann et al., 2008; Tomasi and Volkow, 2011). However, during sedation, the hubs become more right lateralized (seven right hemisphere regions) and the frontal hubs largely disappear (only the left middle frontal cortex remains as a hub). Given the well-documented role of the left hemisphere in maintaining consciousness (Gazzaniga, 1989; Turk et al., 2003), the loss of left hemisphere hubs during sedation is not surprising. Moreover, the frontal lobe hubs during the awake state observed in this study are mainly responsible for executive control and self-referential processes (Collins and Koechlin, 2012; Seniow, 2012; Stuss, 2011), which are likely inhibited during sedation (Alkire et al., 2008). As a result, the disappearance of frontal hubs may reflect the diminished executive/self-referential functions during sedation-induced sleep (Boly et al., 2012; Lee et al., 2009).
Comparing our results in children and those in adult studies (Schrouff et al., 2011, 2012), we found that several differences exist. First, the reported dominant effect of parietal connectivity disruption in Schrouff et al. (2011) was not observed in this study. Second, although all three reports observed a decrease of connection density and strength, the decrease in the two adult studies seems to be more dramatic than ours. Although these differences may potentially reflect interesting developmental changes, confounding factors, including different sedative drugs (i.e., CH in the current study and propofol in the two adult studies) and sedation levels (light sedation in this study but deep sedation in the two adult studies), do exist. It is known that different sedation levels result in differential functional connectivity modulation (Boveroux et al., 2010) that likely underlies the reduced level of connectivity disruption observed in this study. However, the effect of different sedative drugs needs to be better characterized. Overall, a direct comparison using identical sedation protocols and involving both children and adult population is needed to disentangle these hypotheses. Nevertheless, given the reasonable age span in the current population (7–15 years of age), we performed a preliminary correlation analysis between age and changes in efficiency properties from awake to sedation in order to delineate the potential developmental effect on sedation-induced brain functional reorganization. The results show no significant correlation (age-global efficiency changes: R=−0.1621, p=0.4100; age-local efficiency changes: R=−0.2832, p=0.1443). Moreover, there is no significant correlation between age and efficiency measured separately during the two states either (age-global efficiency, awake: R=0.2588, p=0.1835; sedation: R=0.0512, p=0.7959; age-local efficiency, awake: R=0.3366, p=0.0799; sedation: R=0.0158, p=0.9365). These results suggest that there is minimal age effect on brain's efficiency properties and their sedation-induced changes in the currently studied age range. Consistent with our findings, previous studies directly comparing school-aged children and adults during the resting state also showed no differences in their small-world properties (Fair et al., 2009; Supekar et al., 2009), suggesting that such high-level efficiency measures might have already matured at school age. However, as both studies as well as our own study (Gao et al., 2011) suggested, developmental changes may focus more on specific local regions/networks and the detection of such localized effects deserves further research.
Regarding the sedative drug, we used CH to induce a light sedation state because of its ease of use (liquid for oral intake) and wide application in clinical settings. Moreover, CH was documented to cause a lower adverse respiratory effect than other sedatives such as propofol and pentobarbital (Dalal et al., 2006). Given the wide use of CH in experimental neuroimaging examinations and pediatric clinical settings, our findings could not only provide a reference for future experimental studies using CH as a sedative agent but also inform clinical applications. One limitation of this study is that all of our subjects have relatively short stature at the time of scanning. However, we have carefully screened our subjects to exclude pituitary structure and growth hormone problems as well as a wide series of mental disorders/illnesses, so we would expect minimal impact of this developmental issue on brain organization and its interaction with sedation. However, future studies involving a true normal children population are necessary to test the generalizability of the current findings. Finally, although efforts were made to ensure a sedation score of 5 immediately before scanning, one could not guarantee that exactly the same sedation state was maintained during the scan. However, no wake-up or major movement was observed for any subject during the scan, indicating, to some extent, a stable state during the whole process. Future efforts using an independent sedation-state monitoring system without the need for human interactions are preferred to more rigorously address this issue.
Conclusions
By viewing the whole brain as an integrated system, we examined the effect of CH-induced light sedation in brain's information-processing properties in school-aged children using the graph theory-based functional connectivity analysis. Our results revealed a global reduction/weakening of brain's functional interactions leading to compromised information-transferring efficiency among a wide range of functional areas dealing with spatial attention, sensory perception, motor execution, self-awareness, and others. Moreover, sedation also leads to a redistribution of brain's functional hubs featuring a right and posterior shift. Overall, our results support a global detrimental effect of sedation on brain's functional interactions and point to the importance of looking at brain's information-processing properties in future search for the neurophysiological mechanism underlying sedation.
Footnotes
Acknowledgments
This study was supported in part by NIH grant 2R01MH070890 and grant 2011FJ4156 from Hunan Provincial Science and Technology Department of China.
Author Disclosure Statement
No competing financial interests exist.
References
Supplementary Material
Please find the following supplemental material available below.
For Open Access articles published under a Creative Commons License, all supplemental material carries the same license as the article it is associated with.
For non-Open Access articles published, all supplemental material carries a non-exclusive license, and permission requests for re-use of supplemental material or any part of supplemental material shall be sent directly to the copyright owner as specified in the copyright notice associated with the article.