
Abstract
Communication and integration of information between brain regions plays a key role in healthy brain function. Conversely, disruption in brain communication may lead to cognitive and behavioral problems. Autism is a neurodevelopmental disorder that is characterized by impaired social interactions and aberrant basic information processing. Aberrant brain connectivity patterns have indeed been hypothesized to be a key neural underpinning of autism. In this study, graph analytical tools are used to explore the possible deviant functional brain network organization in autism at a very early stage of brain development. Electroencephalography (EEG) recordings in 12 toddlers with autism (mean age 3.5 years) and 19 control subjects were used to assess interregional functional brain connectivity, with functional brain networks constructed at the level of temporal synchronization between brain regions underlying the EEG electrodes. Children with autism showed a significantly increased normalized path length and reduced normalized clustering, suggesting a reduced global communication capacity already during early brain development. In addition, whole brain connectivity was found to be significantly reduced in these young patients suggesting an overall under-connectivity of functional brain networks in autism. Our findings support the hypothesis of abnormal neural communication in autism, with deviating effects already present at the early stages of brain development.
Introduction
H
Autism is a neurodevelopmental disorder that is characterized by language and communication deficits, impaired social interactions, restricted and stereotyped behavior as well as atypical sensory sensitivity, and these symptoms emerge already in the first years of life. At this early age in the typically developing brain, profound maturational processes occur, such as pruning of superfluous connections and myelination of long-distance axons (Huttenlocher, 1984; Lebel et al., 2008), leading to weakening of short range, and strengthening of long-range functional connections at a spatial level (Fair et al., 2009; Supekar et al., 2009; Thatcher, 1992). In addition, increased levels of slow-wave interregional phase synchronization and decreased levels of high-frequency oscillations are noted in the developing child (Vakorin et al., 2011). Disturbances of these developmental processes both at micro- and macroscales have been hypothesized to underlie aberrant communication between brain regions in autism (Courchesne and Pierce, 2005; Levy, 2007; Levy et al., 2009). Indeed, functional brain connectivity has been found to be affected in autism (Just et al., 2012; Kana et al., 2011; Muller et al., 2011; Murias et al., 2007; Vissers et al., 2012; Wass, 2011). A previous study using graph analytical techniques to examine the overall organization of functional brain connectivity in autism showed reduced levels of absolute clustering and a longer absolute characteristic path length in electroencephalography (EEG)-based networks, which were suggested to reflect inefficient local and global topology of the brain network in adult patients (Barttfeld et al., 2011). Besides a recent functional magnetic resonance imaging (fMRI) study that reports on disrupted synchronization in the spontaneous slow fluctuating cortical activity in autistic toddlers (Dinstein et al., 2011), our knowledge of the underlying organization of functional brain networks at this early, but crucial stage of brain development remains, however, limited. As a pattern of accelerated brain development or overgrowth in the first years of life and a subsequent decline in growth around the age of four has been theorized in autism (Courchesne et al., 2011; Wass, 2011), investigating the brain dynamics at these early developmental stages is crucial for gaining new insight in deviant brain development in autism.
The present study reports on novel findings of aberrant brain functional network organization in autistic toddlers. Functional brain networks were constructed from EEG recordings of 12 autistic and 19 control children, aged 2–5 years old. Whole brain connectivity strength as well as measures of local and global network efficiency were computed to examine whether, and if so, how network connectivity and communication efficiency is affected in autistic children, as compared to healthy children at the same neurodevelopmental stage. In particular, our study provides first evidence that the balance between information segregation and integration in autistic toddlers is already disturbed.
Methods
Participants
This study presents data collected previously from patients who were recruited from the Department of Psychiatry of the University Medical Center in Utrecht, and from Karakter Child and Adolescent Psychiatry University Center in Nijmegen (two patients). The study was approved by the ethics committee of the University Medical Center Utrecht. Written informed consent was obtained from the parents or guardians of each child and the study was conducted in accordance with the standards set by the Declaration of Helsinki.
A group of seventeen children with a clinical diagnosis of autism spectrum disorder (ASD) according to DSM-IV criteria were included in this study. The group of patients (from which complete EEG recordings were obtained, that is, 12 children, see exclusion criteria below) received a clinical diagnosis according to DSM-IV criteria of Autism (2 patients), Asperger Syndrome (1 patient), or Pervasive Developmental Disorder Not Otherwise Specified (9 patients). The clinical diagnoses were assigned on the basis of an extensive interview with the parents, a psychiatric observation, and a psychometric assessment of the child by a multidisciplinary team consisting of a child psychiatrist, child psychologist, and licensed social workers specialized in developmental disorders. Unfortunately, we did not have complete autism diagnostic interview and/or autism diagnostic observation schedule scores to reliably test for correlations between the severity scores of autism and brain network parameters in these very young patients. Twenty-two control children were recruited from different schools and child care centers in the Utrecht area. The Child Behavior Checklist (CBCL/1.5–5) (Achenbach, 2000) was completed by the parents, and the Vineland Social-Emotional Early Childhood Scales (Sparrow et al., 1998) were administered to exclude clinically relevant psychopathology among the control children. All children scored within the normal range of the CBCL and Vineland scales and were included for further analysis.
Additional exclusion criteria based on the EEG recordings (described in the EEG Recordings section below) led to exclusion of three controls and five patients in total. This resulted in a total set of 19 controls (mean age 3.53±1.19 years; IQ=108.0±12.4) and 12 autistic children (mean age 3.35±0.80 years; IQ=85.0±17.2) who were included in the analysis. Subject characteristics and statistics are listed in Table 1. Groups did not differ in age. IQ estimates significantly differed between groups, with the autistic patients showing significantly lower IQ scores than the group of healthy controls (p<0.001).
Number of subjects, distribution of sex, age in years [mean (SD)], IQ [mean (SD)], and number of included trials [mean (SD)] are shown. Bold text indicates a statistical significant difference.
Age data not available for two controls and one patient.
IQ data not available for one patient.
EEG recordings
Data were selected from a task-dependent EEG study, in which children passively watched pictures of cars and faces. In the current study, the effect of autism was primarily studied on both task conditions grouped together, as the main focus of this study was on the effect of autism on functional network organization and not necessarily on task performance. A detailed description of the task procedure and the results for the separate task conditions are presented in the Supplementary Materials (Supplementary Data are available online at
EEG recordings were obtained from 32 electrodes positioned at standard EEG recording locations of the international 10/20 system by using a BioSemi Active Two EEG system (BioSemi), while participants were sitting in an acoustically shielded room (midline: Fz, Cz, Pz, Oz; frontal: Fp1, Fp2, AF3, Af4, F3, F4, F7, F8; frontocentral: FC3, FC4, FC5, FC6; central: C3, C4; centroparietal: CP1, CP2, CP5, CP6; temporal: T7 (T8 was excluded due to continuous artifacts in most children); parietal: P3, P4, P7, P8; parieto-occipital: PO3, PO4; occipital: O1, O2). An online Common Mode Sense-Driven Right Leg (CMS-DRL) was used as a reference. Horizontal electro-oculography (EOG) was recorded from electrodes at the outer canthi of the eyes by means of adhesive rings. Vertical EOG was recorded from electrodes placed infra- and supra-orbital to the left eye. Impedances were typically kept below 5 kΩ for both EEG recordings and EOG recordings. The EEG was sampled at a rate of 2048 Hz and stored offline as continuous signals.
EEG time series were segmented in epochs starting 100 ms before and ending 900 ms after stimulus presentation. Segments with artifacts were excluded for further analysis, using a semiautomated artifact correction tool (Brain Vision Analyzer software package [Version 2.0]) and additional visual inspection of the data. Typical artifacts that led to exclusion, included eye blinks or movements, muscle artifacts, drowsiness, and detached electrodes. Two controls and five patients in total were excluded due to sleep or drowsiness or noisy data due to detached EEG electrodes or other artifacts. Furthermore, one control was excluded due to spike-wave discharges, which might indicate epileptiform activity. In total, this resulted in the inclusion of (on average) 32 artifact-free segments [mean (SD)=32.1 (4.0)] in the patients and 27 artifact-free segments in the control group [mean (SD)=27.4 (2.2)], each of length 1000 ms.
Functional connectivity: phase lag index
The phase lag index (PLI) expresses the level of asymmetry of the distribution of the instantaneous phase differences between two EEG signals. A detailed (mathematical) description of PLI can be found in (Stam et al., 2007). An advantage of PLI over other nonlinear measures of connectivity (e.g., correlation, synchronization likelihood) is that the PLI is much less affected by the influence of volume conduction/common sources and reference electrodes.
Connectivity matrix formation
For each selected trial, EEG signals were filtered in broad band (0.1–30 Hz, i.e., standard event related potential filtering), and in the theta-alpha band (4–10 Hz), and the beta band (10–25 Hz; Fig. 1A). We deviated from the standard definition of frequency bands, since in developing young children the power spectrum is dominated by slow frequencies; the alpha peak occurs at slower frequencies (∼8 Hz) in young children (Boersma et al., 2011; Marshall et al., 2002), which is in contrast with the faster alpha peak frequencies in adults (∼10 Hz) (Cragg et al., 2011; Smit et al., 2011). To prevent splitting up the alpha band at this 8 Hz alpha peak and capturing as much slow oscillations as possible, we chose to combine the alpha and theta frequency bands, ranging from 4 to 10 Hz.
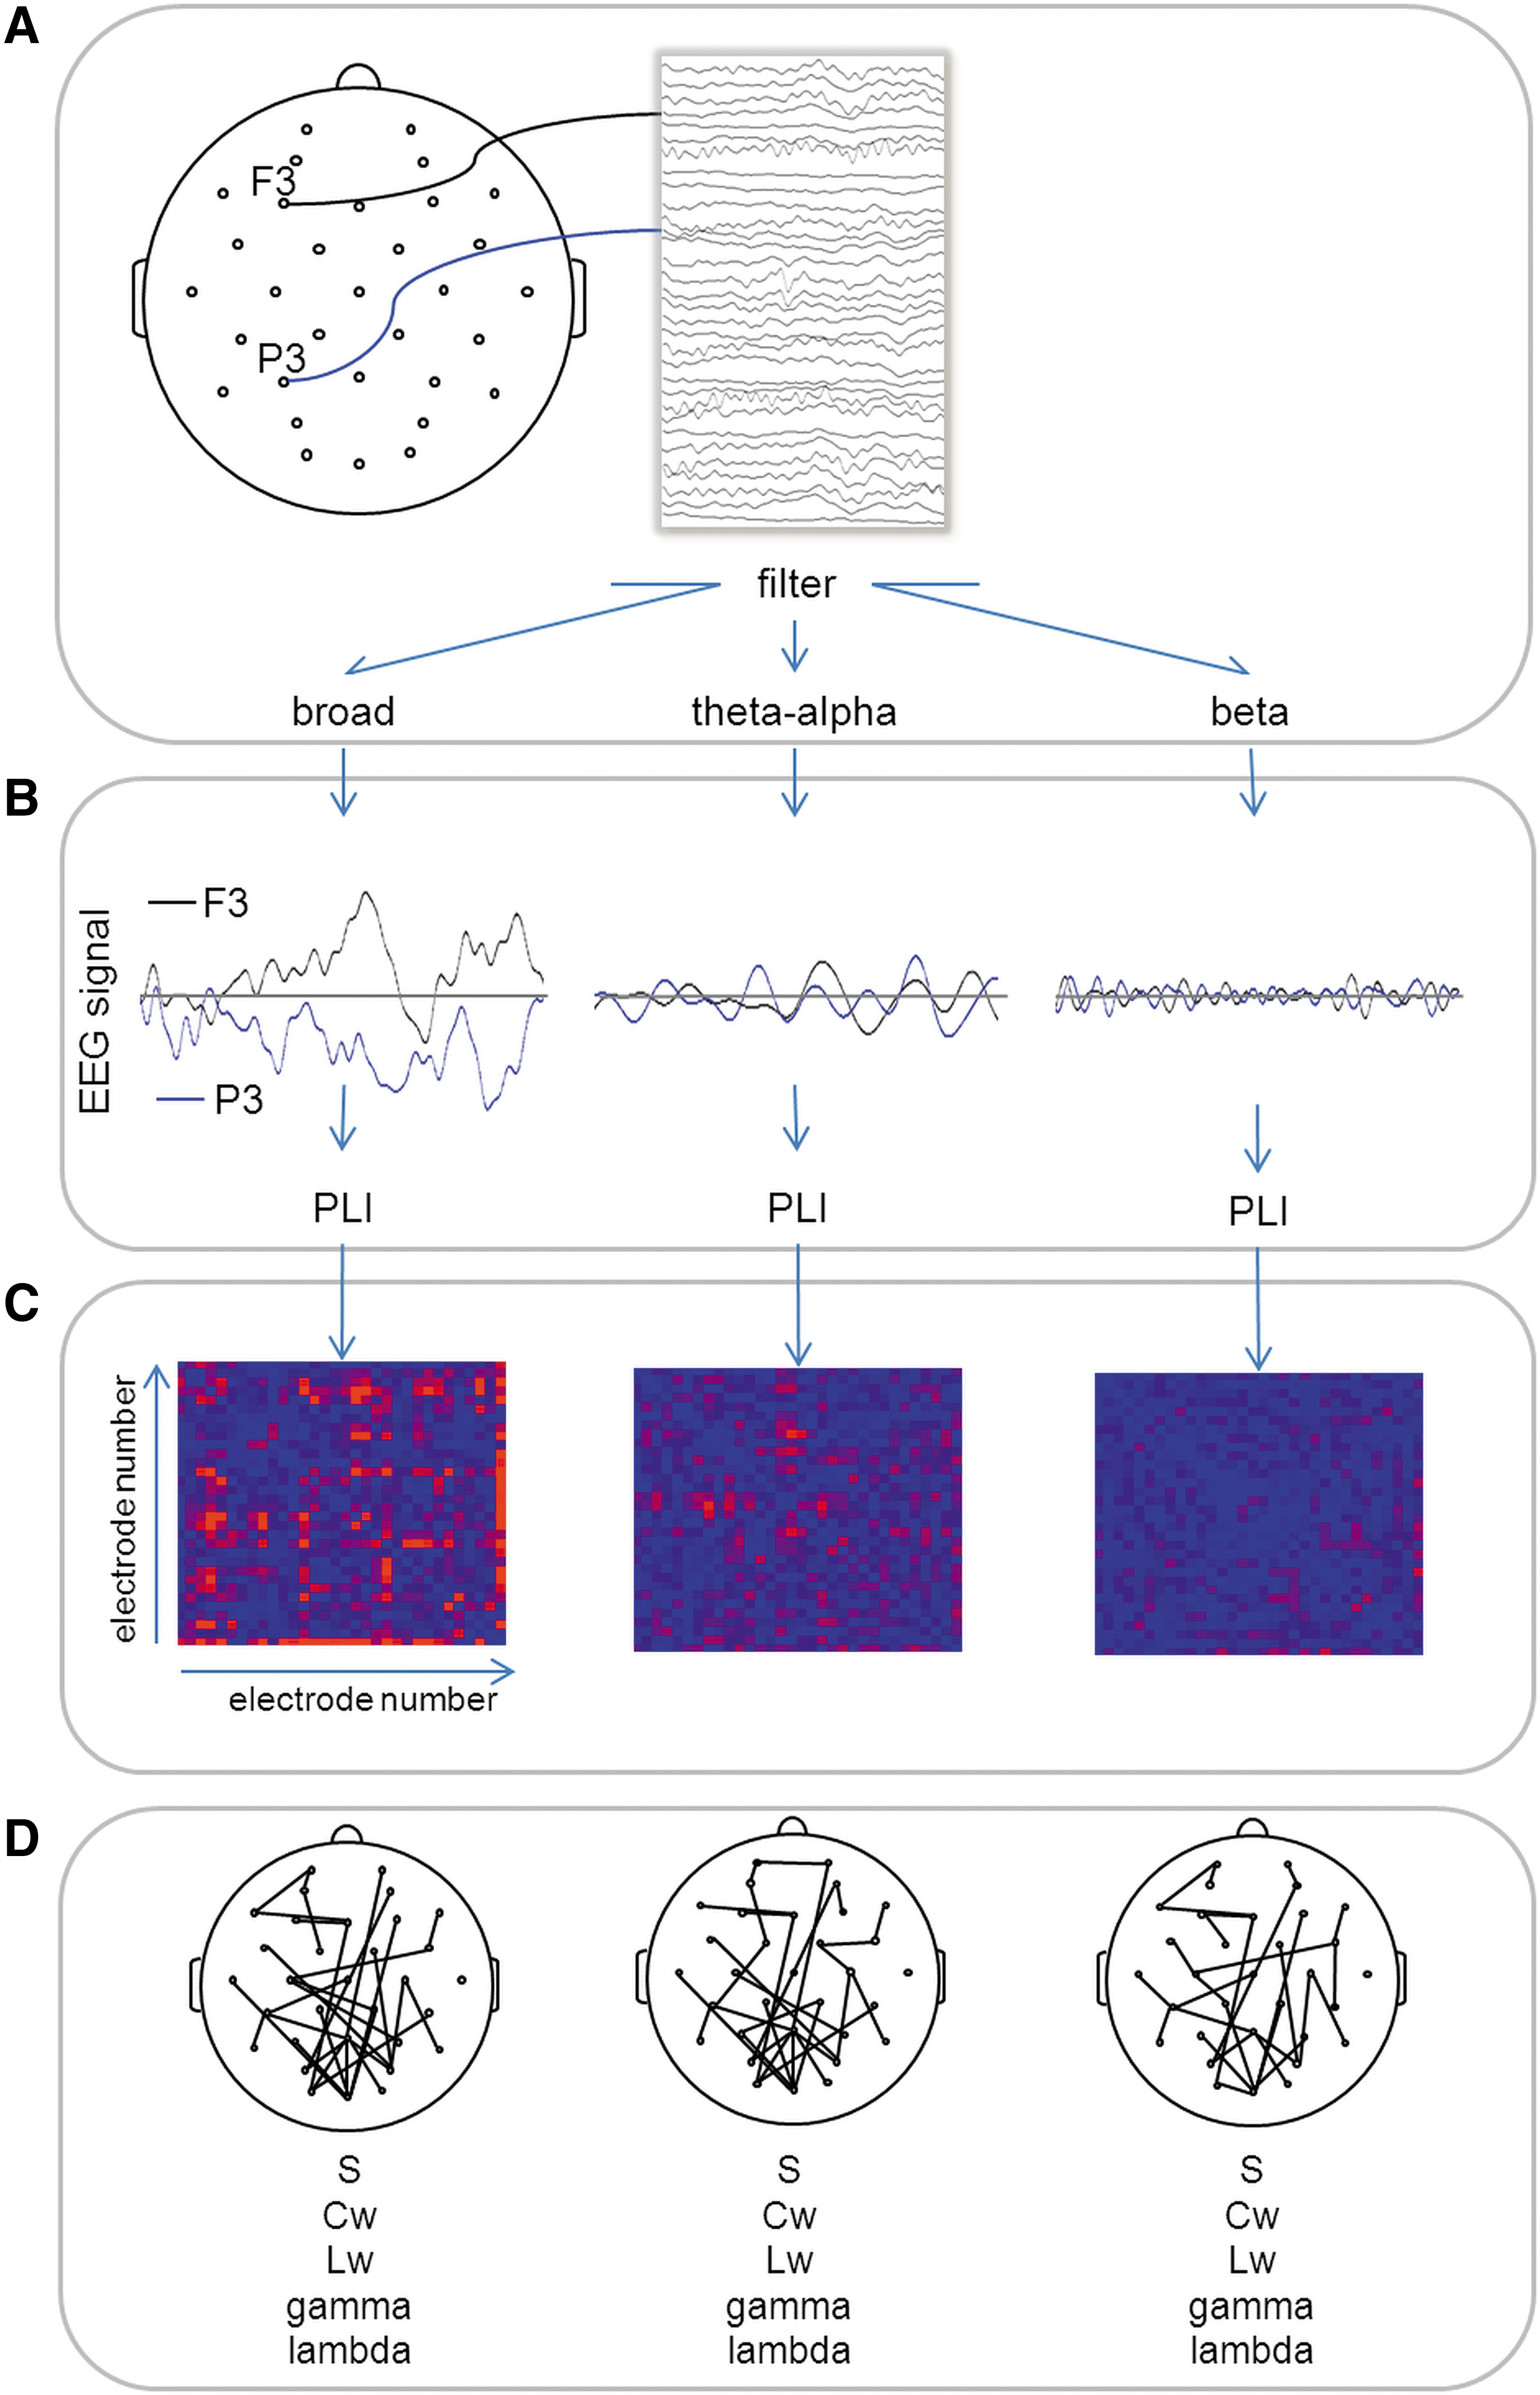
Consecutive steps of functional connectivity analysis and graph analysis applied to electroencephalography (EEG) recordings of brain activity.
For each frequency band, and for each epoch (each consisting of 2048 samples), the level of synchronization (PLI) was computed between each pair of electrodes (Fig. 1B) using the BRAINWAVE software, version 9.70 (CS,/home.kpn.nl/stam7883/brainwave.html). This resulted in a trial-specific 31×31 connectivity matrix (electrode T8 was excluded), representing the functional dynamics between brain regions (Fig. 1C).
The resulting PLI connectivity matrices were used to construct undirected, weighted networks in which each EEG electrode is a node, and the PLI values represent the weights of the links between nodes (Fig. 1D). Functional connectivity networks were visualized using the EEGLAB toolbox (Delorme and Makeig, 2004). To obtain whole brain connectivity strength (S), PLI matrices were averaged for each trial, and subsequently averaged over all trials (per dataset).
Graph analysis of functional brain networks
Graph analytical tools were applied (using BRAINWAVE software) to characterize the topology of the obtained weighted functional brain networks (Stam et al., 2009). For each node, the weighted clustering coefficient Cwi was calculated, expressing the likelihood that neighbors of node i are connected in which the strength of the connections between the node and the neighboring nodes are taken into account. Averaging Cw over all 32 nodes resulted in an average, whole brain, weighted clustering coefficient reflecting the level of local organization of the network.
For each pair of nodes, the weighted shortest path, that is, a path that minimizes the sum of the inverse PLI weights, was computed. Averaging the weighted lengths of these shortest paths resulted in the weighted characteristic path length (Lw), a commonly used measure for global network communication capacity.
As a normalization step, both average absolute clustering (Cw-r) and average absolute path length (Lw-r) were calculated for 1000 randomized networks with similar number of nodes and edge weights and symmetry as the observed graph. The normalized clustering coefficient (gamma) was then defined as the ratio of the clustering of the observed and the average of the collection of randomized networks (Cw/Cw-r). In a similar fashion, the normalized path length (lambda) was defined as the ratio of the path length of the observed and the average of the randomized networks (Lw/Lw-r). A network is said to show small-world characteristics when Cw/Cw-r>>1 and Lw/Lw-r ∼ 1, with a small-worldness (SW) index defined as the ratio of gamma/lambda, exceeding 1 (Humphries et al., 2006).
Statistical methods
Statistical analysis performed using SPSS (version 20). Independent samples t-test and Fisher's exact tests were used to test for differences in subject characteristics between groups. To test for group differences in whole brain connectivity and network parameters, independent samples t-tests (equal variances assumed) were used.
In addition, network-based statistic (NBS) was used to test for differences in connection strength between autism and control groups (Zalesky et al., 2010, 2012). NBS is a nonparametric statistical test that isolates clusters of edges that significantly differ between groups. To examine both increased and decreased connections, a threshold of p=0.025 was set to select supra-threshold connections. Testing all 31×30/2 unique connections, the largest connected component of supra-threshold connections was determined and compared to the cluster-sizes in a randomized condition. To this end, subjects were randomly assigned to two groups of equal sizes as the original subject groups, and the largest connected component of the supra-threshold connections was determined for these groups. This process was repeated 5000 times, resulting in a null-distribution of component sizes that can occur on the null-hypothesis. Finally, the observed cluster size of the original data was assigned a p-value as the percentage of random permutations that exceeded this value.
Pearson correlations were used to examine a possible association between network metrics and age and IQ.
Independent samples t-tests were used to study the effect of autism for separate task conditions (see Supplementary Data).
Results
Broad band
Patients showed significantly increased lambda (normalized path length) in the broad band (p=0.004) compared to control children, suggesting aberrant organization of global communication in patients showing relatively longer normalized path length, that is, in proportion to randomized networks. Furthermore, a trend toward decreased SW was found (p=0.084) in this frequency band, whereas whole brain connectivity strength (S) did not significantly differ between patients and controls.
Theta-alpha band
In theta-alpha band, a significant reduction of gamma (normalized clustering) was found (p=0.021) and, additionally, SW significantly decreased (p=0.010) in patients compared to controls. Whole brain connectivity strength did not differ between groups.
Beta band
Patients showed a significant reduction in whole brain connectivity strength S in the beta band (p=0.009; Fig. 2 and Table 2) which was accompanied by significantly reduced Cw (absolute clustering) and significantly increased Lw (absolute path length).
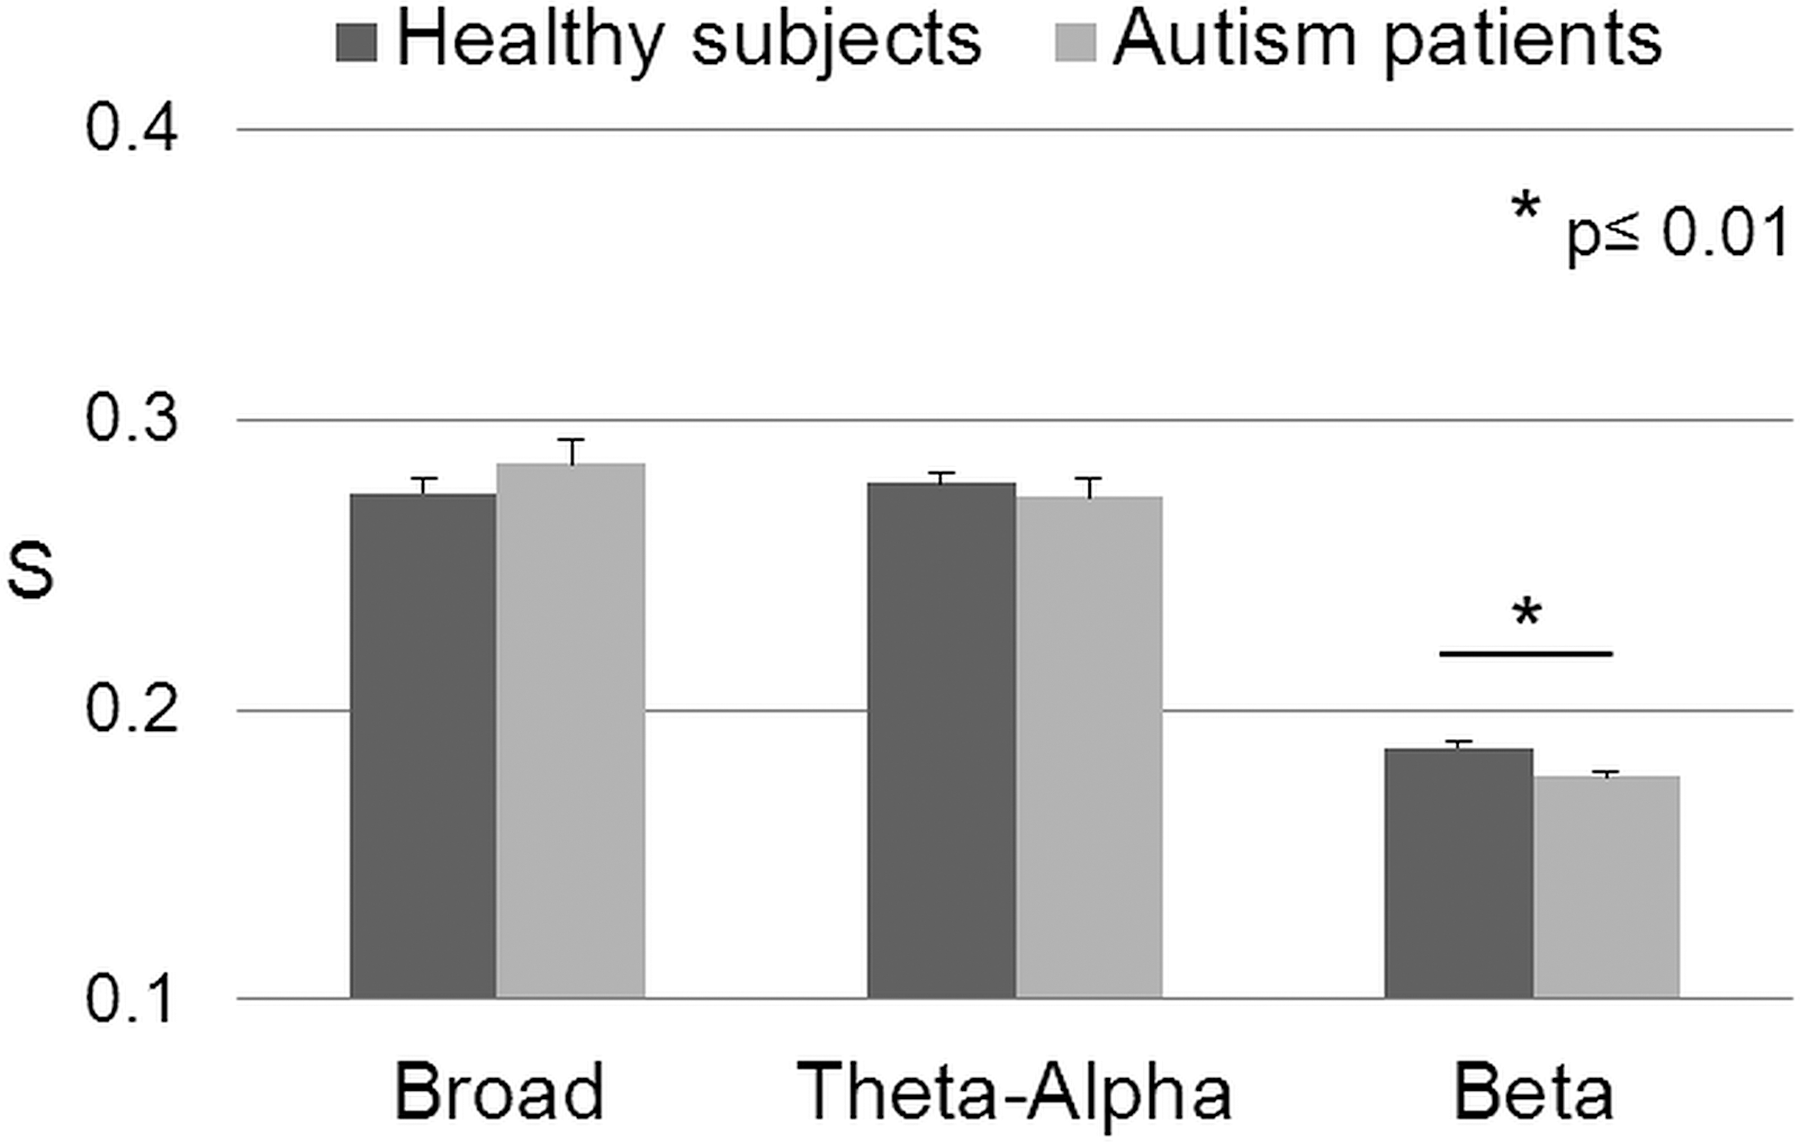
Whole brain connectivity strength (S), as the average of all PLI values between all electrode pairs, in broad, theta-alpha and beta bands. Significant reduced connectivity was found in autistic children (light gray bars) in the beta band (p=0.009) compared to controls (dark gray bars).
Results of independent samples t-test are shown for whole brain connectivity strength (S), clustering (Cw), path length (Lw), normalized clustering (gamma), normalized path length (lambda), and small-worldness (SW) for each frequency band. Arrows indicate the direction of the group effect: ↓, pt<con; and ↑, pt>con. Bold text indicates a statistical significant difference (p<0.05).
Figure 3 illustrates which of the functional connections were reduced (blue color) and increased (red color) in autistic children as compared to controls, in broad, theta-alpha and beta band. A widespread significant cluster of 51 reduced connections (NBS; p=0.003) was found in autistic children compared to controls, in the beta band. In broad band the increased connections did not form a connected cluster.
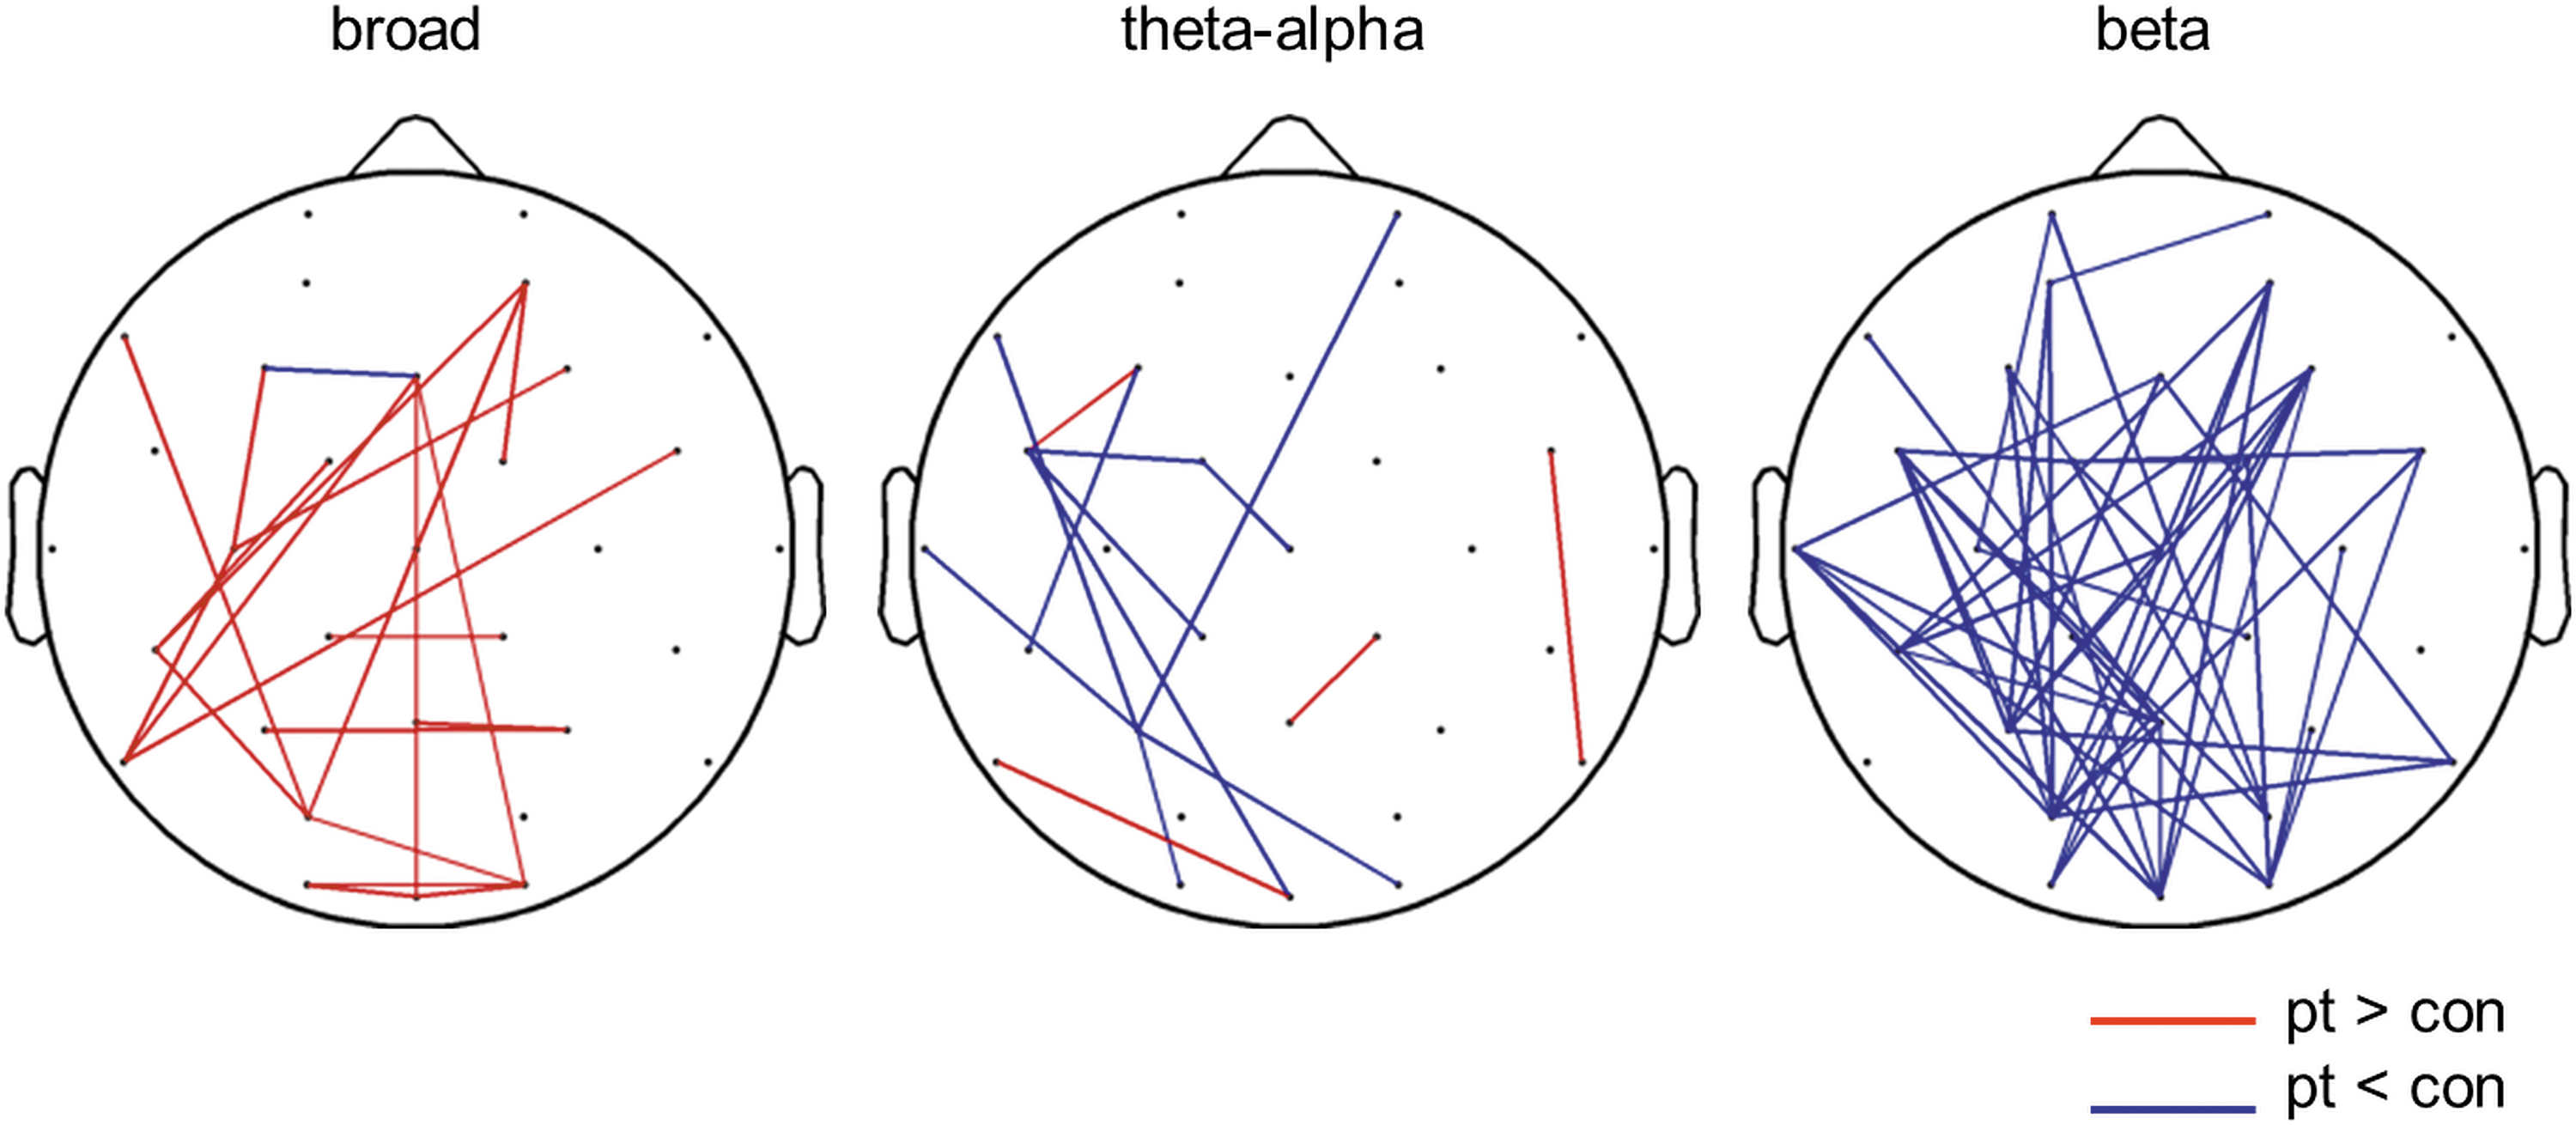
Significantly stronger (red) and weaker (blue) connections (p<0.025) in autistic children in respectively broad, theta-alpha, and beta band. Beta band showed a cluster (p=0.003) of 51 connected links showing reduced connectivity in autistic children, as compared to control children.
An overview of the results of the t-tests for group differences in whole brain connectivity strength, clustering, path length, gamma, lambda and SW per frequency and an overview of the direction of the effects can be found in Table 2.
In the Supplementary Materials, the effect of autism was studied in the separate conditions (Supplementary Table S1), showing similar results as for combined conditions. Furthermore, besides the applied t-tests, statistical evaluation was performed using nonparametric permutation testing, being less sensitive to the effect of group-size and potential outliers. Permutation testing (10,000 permutations) revealed similar results, which are described in the Supplementary Data.
Since autistic children showed significantly lower IQ than control children (p<0.001), we tested if IQ and graph measures were correlated. In both control children and patients, no significant correlations were found between network parameters and IQ. A supplemental test showed that subgroups of control and autistic children with overlapping IQ showed significant differences in connectivity and graph parameters equal similar to the results obtained in the complete groups (see Supplementary Table S2 for test statistics). Furthermore, no significant correlations were found between network parameters and age.
Discussion
The present study demonstrates abnormal functional network organization in autistic children, showing that affected brain connectivity in autism may be already present at the early stages of brain development in patients. Functional networks differed in topology, leading to increased lambda (normalized path length) in broadband, together with reduced gamma (normalized clustering) and SW in theta-alpha band, suggesting an abnormal balance of information integration and segregation at the system level in autism. Inherent to these organizational differences, deviant connectivity strength was found in autism, both averaged over the whole brain (Fig. 2) as well as at the level of single connections (Fig. 3). In broadband EEG, a pattern of strengthened connections was found in children with autism, whereas whole brain connectivity strength (S) did not significantly differ between groups. Furthermore, in theta-alpha band, no difference was found in S and only few connections showed increased or reduced strength in autism. Finally, in the beta band, a cluster of 51 reduced connections was found and average whole brain S was significantly reduced. Taken together, these findings support the interpretation that not merely connectivity strength is affected in autism, but also involves an aberrant organization of connectivity.
Over different developmental stages of typical brain maturation, functional connectivity tends to weaken locally and strengthen over longer distances concurring with maturational processes like pruning of synapses and myelination of long-range axons, and leading to decreasing (local) segregation and increasing (global) integration with development (Barry et al., 2004; Fair et al., 2009; Giedd et al., 1999; Hagmann et al., 2010; Thatcher, 1992; Uddin et al., 2010; Yap et al., 2011). These typically developing functional networks show small-world features. However, disturbed temporal coordination of these local and global synchronization processes at different stages of brain maturation might lead to neuropsychiatric disorders (Uhlhaas and Singer, 2012). Several patterns of over- and under-connectivity at distinct spatial and temporal scales have been reported in autism (Just et al., 2012; Kana et al., 2011; Li et al., 2012; Muller et al., 2011; Murias et al., 2007; Vissers et al., 2012; Wass, 2011). A recurrent pattern of local over-connectivity (most pronounced within frontal areas), and decreased connectivity from frontal to other brain areas has been found in autism (Courchesne et al., 2011; Just et al., 2012), supporting our current findings of reduced global communication capacity in autistic toddlers. Additionally, studies have observed enhanced local synchronization within parietal areas in children with autism, suggesting local over-connectivity in parietal areas (Perez Velazquez et al., 2009). Regarding local connectivity patterns, the present study showed reduced normalized clustering in whole brain networks, suggesting a reduction in local information processing at the system level in young children with autism. This apparent discrepancy might be explained by the fact that previous studies focused on connectivity patterns within one specific brain region, whereas the present study examined clustering patterns between all brain regions. At this system level, only a few graph theoretical studies have shown deviations in clustering (local segregation) and average path length (global integration) in anatomical and functional networks in adults with autism (Barttfeld et al., 2011; Dennis et al., 2011). Our results confirm and extend the findings of Barttfeld and colleagues who found reduced (absolute) clustering and increased average path length in slow frequency EEG networks, and suggested that the topology of the adult network departs from small-world behavior in autism (Barttfeld et al., 2011).
Interestingly, our findings tend to suggest a shift or disbalance in slow versus fast frequencies in children with autism, as suggested by the observation that network parameters are increased in slow, and somewhat reduced in fast frequencies in children with autism (Table 2). Healthy brain development has been characterized by an ongoing increase in interregional phase synchronization in the slower frequencies and desynchronization in faster oscillations, a developmental trajectory that starts prenatally and continues into early adulthood (Vakorin et al., 2011). The deviant pattern found in the present study might suggest that young children with autism show abnormally fast brain maturation compared to controls at this age. Indeed, consistent with such a hypothesis, an accelerated or overgrowth of brain volume in the first years of life (and subsequently a decline in growth) in autism was previously found in structural MRI studies (Courchesne et al., 2007, 2011; Hazlett et al., 2011). In terms of cognitive functions, slow frequencies, such as theta oscillations, are involved in memory function in adults, especially when cross-frequency coupled to faster frequencies such as gamma band frequencies (Canolty and Knight, 2010; Osipova et al., 2006). Furthermore, alpha band synchronization has been associated with cognitive functions such as top-down control and regulation of (visual) attention (Engel et al., 2001); interestingly, recent studies suggest that alpha band activity at source space appears to be confined to regions referring to the well-known default mode network and other attentional networks commonly found in resting-state functional MRI studies (Hillebrand et al., 2012; Sadaghiani et al., 2012). However, the association between development of cognitive functions and development of synchronization patterns in different frequency bands in children is not well understood yet. Longitudinal investigation of how the potential trajectory of early overgrowth and declined growth of brain volume later in life is related to abnormal development of functional brain networks in subjects with autism is of great importance. It would add to our understanding of how structural and functional brain development contribute to the expression of autism and might serve as a coarse template for understanding developmental aspects of other neurological and neuropsychiatric diseases that have been associated with altered brain efficiency previously (Ahmadlou et al., 2012; Basset and Bullmore, 2009; Kramer and Cash, 2012; Liu et al., 2012; van den Heuvel et al., 2010). Since it has been shown that brain network organizations are under genetic control in adults (Fornito et al., 2011; Smit et al., 2008, 2010) and children (van den Heuvel et al., 2012), graph analytical metrics of the efficiency of the organization of the brain's network might be important intermediate phenotypes for molecular-genetic studies in autism.
Some methodological considerations need to be taken into account when interpreting the findings of this study. Toddlers passively watched pictures of cars and faces during EEG recordings. The effect of autism was studied combining the two task conditions. In the Supplementary Materials a detailed description of the task procedure and additionally, the group effect in the separate conditions can be found, showing similar results as for combined conditions. Interestingly, group differences tend to be more pronounced in the “cars condition.” Previous studies showed atypical processing of basic visual stimuli in autism, including preferential attention to detail (Behrmann et al., 2006; Ronconi et al., 2012; Vlamings et al., 2010) and faster responses to objects than to faces in infants at high risk for autism (McCleery et al., 2009), suggesting enhanced local processing. Based on our findings, one might speculate that the aberrant processing of visual information in autism, especially of objects, is also reflected in a disbalance of information processing at the system level in large-scale functional networks. Since these early deviations in basic perceptual processing might have consequences for development of higher order processing, it is important to gain further insight in how this deviant perceptual processing relates to aberrant brain network organization in children with autism. Constructing directed networks incorporating information on the direction of information flow (Stam and Van Straaten, 2012) might help to further explore whether and if so, perceptual processing is affected in autism.
Another potentially confounding factor in functional connectivity studies is the effect of volume conduction and active reference electrodes causing spurious correlations (Nunez et al., 1997). However, in contrast with measures such as coherence or synchronization likelihood, PLI has been shown to be less sensitive to these zero-phase lag effects while reflecting functional connectivity in EEG as well as other measures (Stam et al., 2009).
As previous studies have shown an association between intelligence and brain network organization (Li et al., 2009; van den Heuvel et al., 2009), a potential confounding effect in the present study might include that the children with autism had a significantly lower intelligence score than control children. To this end, a post hoc analysis was performed on subgroups with overlapping IQ, resulting in comparable effects as shown for the complete groups. These additional findings suggest that the changes in organization in brain networks of children with autism are unlikely to be related to group differences in IQ. Future investigation of the association of network parameters and clinical scores might lead to better understanding of, and give new insight in possible underlying pathophysiological mechanisms affecting the brain as a developing large-scale complex communication system.
In conclusion, our findings demonstrate that autism is related to aberrant functional organization of the brain's network, suggesting an abnormal balance of information integration and segregation already at the early stages of development. Moreover, our findings tend to point into the direction of a possible developmental disbalance between connectivity and network organization between the low and high frequency bands. Our findings thus suggest an abnormal developmental trajectory for functional brain dynamics in patients with autism, a deviating pattern of less efficient global brain communication that is already present during the earlier stages of brain development.
Footnotes
Acknowledgments
We thank Bob van Dijk, Maretha de Jonge and Carlijn van den Boomen for their valuable comments and advice with the data preprocessing and analysis. We would like to thank Emma van Daalen for helping with recruitment of the patients. This project was financially supported by a grant from the Netherlands Brain Foundation (MP No. 2011(1)-137) and the Netherlands Organization for Scientific research (CK VICI No. 453-07-004, MP VENI No. 451-12-001), and was co-financed by the Charity Stichting Rob Beers and Zabawas Foundation (grant Martin P. van den Heuvel, 2011 (1)–137).
Author Disclosure Statement
No competing financial interests exist.
References
Supplementary Material
Please find the following supplemental material available below.
For Open Access articles published under a Creative Commons License, all supplemental material carries the same license as the article it is associated with.
For non-Open Access articles published, all supplemental material carries a non-exclusive license, and permission requests for re-use of supplemental material or any part of supplemental material shall be sent directly to the copyright owner as specified in the copyright notice associated with the article.