
Abstract
The human brain can be modeled as a network, whose structure can be revealed by either anatomical or functional connectivity analyses. Little is known, so far, about the topological features of the large-scale interregional functional covariance network (FCN) in the brain. Further, the relationship between the FCN and the structural covariance network (SCN) has not been characterized yet, in the intact as well as in the diseased brain. Here, we studied 59 patients with idiopathic generalized epilepsy characterized by tonic–clonic seizures and 59 healthy controls. We estimated the FCN and the SCN by measuring amplitude of low-frequency fluctuations (ALFF) and gray matter volume (GMV), respectively, and then we conducted graph theoretical analyses. Our ALFF-based FCN and GMV-based results revealed that the normal human brain is characterized by specific topological properties such as small worldness and highly-connected hub regions. The patients had an altered overall topology compared to the controls, suggesting that epilepsy is primarily a disorder of the cerebral network organization. Further, the patients had altered nodal characteristics in the subcortical and medial temporal regions and default-mode regions, for both the FCN and SCN. Importantly, the correspondence between the FCN and SCN was significantly larger in patients than in the controls. These results support the hypothesis that the SCN reflects shared long-term trophic mechanisms within functionally synchronous systems. They can also provide crucial information for understanding the interactions between the whole-brain network organization and pathology in generalized tonic–clonic seizures.
Introduction
The human brain can be represented, both in the anatomical and functional domains, as a large-scale complex network characterized by fragmental and coalescent organizations (Bullmore and Sporns, 2009; Hagmann et al., 2008). In this context, anatomical and functional brain connections reflect axonal pathways and long-range synchronizations of neural activity, respectively (Sporns, 2011). Notably, anatomical connectivity constrains, and can be used to predict functional connectivity (Greicius et al., 2009; Honey et al., 2009). These two modalities are complementary. Accordingly, combined analyses of anatomical and functional connectivity can provide novel tools to examine complex network properties of the intact and the diseased brain.
Analyzing covariance of imaging measurements is one of the prevalent methods for constructing functional and structural brain networks (He and Evans, 2010; Horwitz, 2003), which is carried out by correlating the inter-regional interdependencies across subjects. Recent studies proposed specific approaches to examine that morphological (e.g., gray matter volume [GMV], surface area, and cortical thickness) changes in one brain region are significantly correlated with changes in other brain regions (Horwitz et al., 1984; Lerch et al., 2006; Mechelli et al., 2005). Covariations in the GMV across subjects may relate to the mutually trophic effects on connected regions (Bassett et al., 2008; Mechelli et al., 2005). Using cortical thickness and graph theoretic analysis, He et al. (2007) revealed that the structural covariance network (SCN) of the human brain has small-world properties. Inter-regional coordination in the SCN has been interpreted as the phenotype of brain development and/or plasticity (He et al., 2007; Sanabria-Diaz et al., 2010; Seeley et al., 2009; Zielinski et al., 2010). In parallel, other studies have focused on functional covariance network (FCN) measures using hemodynamic (Melie-Garcia et al., 2013), metabolic (Di and Biswal, 2012), and amplitude of low-frequency fluctuation (ALFF) descriptors (Taylor et al., 2012; Zhang et al., 2011c). For instance, ALFF in blood oxygenation level-dependent functional MRI can be used to measure the covariance between activity levels among distributed regions during short periods of time (Taylor et al., 2012; Zhang et al., 2011c). Importantly, structural and functional connectivity measures were proposed to be linked (Taylor et al., 2012; Zhang et al., 2011c). The topology of the SCN was related to that of the canonical intrinsic connectivity network (ICN) (Biswal et al., 2010), obtained by seed-based temporal correlation (Seeley et al., 2009; Zielinski et al., 2010). Notably, in one of our previous studies, we compared structural and functional networks, and revealed convergence and divergence in their topological patterns (Zhang et al., 2011c). Further, analysis of the structural and FCNs in cross-sectional group studies proved useful for assessing overall network integrity rather than the local brain structure or function (Seeley et al., 2009; Zhang et al., 2011c; Zielinski et al., 2010).
Epilepsy is typically viewed as a brain network disorder (Richardson, 2012). Recent network analyses have documented that widespread brain regions and extensive networks are involved in temporal lobe epilepsy (Bernhardt et al., 2011; Liao et al., 2010), in chronic epilepsy (Vaessen et al., 2012; Vlooswijk et al., 2011), and in idiopathic generalized epilepsy (IGE) (Bernhardt et al., 2009). Generalized tonic–clonic seizure (GTCS) epilepsy is a common phenotype of IGE (Chang and Lowenstein, 2003). We have previously suggested that patients with GTCS have altered topological organization in both anatomical and functional connectivity networks (Zhang et al., 2011b). Little attention has been devoted to the relationship between networks revealed by the across-subject covariance in brain function (i.e., FCN) and morphology (i.e., SCN).
In the present study, we test the following three hypotheses: (1) Large-scale SCNs were widely investigated in healthy populations (He et al., 2007), and in normal development (Zielinski et al., 2010). Further, they were found to be altered in various neurological and psychiatric diseases. Accordingly, we hypothesize that SCN will reveal specific altered features of brain network architecture in patients with GTCS. We expect that FCN will also possess topological properties such as small worldness and core hub regions, and will be altered in patients. (2) We hypothesize that the topological abnormalities in the patients will be reflected in both the FCN and the SCN based on across-subject covariance. This would extend our previous findings with regard to a disrupted topological organization (Zhang et al., 2011c). (3) The correlation of the intrinsic and anatomical connectivity networks (ACN) were found to be disrupted in patients (Zhang et al., 2011b). However, the relationship between functional- and structural-related networks may vary across measurements (even for data of the same modality) and computational method used (Gong et al., 2012; Sanabria-Diaz et al., 2010; Zhang et al., 2011c). Here, we aim to investigate whether the relationship between the ALFF-based FCN and GMV-based SCN was altered in the patients.
Materials and Methods
Participants
We recruited 59 patients with GTCS (21 women, all right-handed; age [mean±SD]: 24.9±7.07 years; age at first seizure onset: 18.08±5.98 years; duration: 7.83±7.51 years), under treatment at the Jinling Hospital from June 2009 to October 2011. A part of this patient population (n=26) participated in one of our previous studies (Zhang et al., 2011b). The patients met the following inclusion criteria: (1) presence of typical clinical symptoms of GTCS, including tic of limbs, loss of consciousness, and no partial seizures; (2) presence of generalized spike-and-wave or polyspike-wave discharges in their scalp EEG; (3) no focal abnormality in routine structural MRI examinations; and (4) no obvious history of etiology. All patients were found with IGE with GTCS only according to the International League against Epilepsy (ILAE) classification. Forty-six patients were treated with antiepileptic drugs, including valproate, phenytoin, carbamazepine, lamotrigine, and topiramate.
Healthy controls (22 women, all right-handed; age: 24.79±6.38 years) were recruited from the staff of the Jinling Hospital. They had no history of neurological disorder or psychiatric illness and no gross abnormalities in the brain MRI images. There was no significant difference in age (two-sample two-tailed t-test, p=0.9240) and sex (Kruskal-Wallis test, p=0.6653) between the two groups (Table 1). Written informed consent was obtained from all participants. The study was approved by the local medical ethics committee at Jinling Hospital, Nanjing University School of Medicine.
Demographic Data of IGE-GTCS Patients and Healthy Controls
The p-value was obtained by Kruskal–Wallis test. bThe p-value was obtained by two-sample two-tailed t-test.
IGE-GTCS, Idiopathic generalized epilepsy-generalized tonic–clonic seizures; HC, healthy controls; FD, framewise displacement.
MRI acquisition
We performed functional and structural neuroimaging acquisitions in patients and healthy controls using a Siemens Trio 3T scanner at Jinling Hospital. We used foam padding to minimize head motion. We acquired resting-state functional images using a single-shot, gradient-recalled echo planar imaging sequence (250 volumes, repetition time=2000 ms, echo time=30 ms, flip angle=90°, field of view=240×240 mm2, interslice gap=0.4 mm, voxel size=3.75×3.75×4 mm3, 30 transverse slices aligned along the anterior–posterior commissure). Subjects were instructed simply to rest with their eyes closed, not to think of anything in particular, and not to fall asleep. Subsequently, we acquired high-resolution T1-weighed anatomical images in sagittal orientation using a magnetization-prepared rapid gradient-echo sequence (repetition time=2300 ms, echo time=2.98 ms, flip angle=9°, field of view=256×256 mm2, voxel size=0.5×0.5×1 mm3, 176 slices without interslice gap).
Data preprocessing
Functional images were preprocessed using the DPARSF (
Anatomical parcellation
To determine the nodes of functional and SCNs, we used the automated anatomical labeling (AAL) template (Tzourio-Mazoyer et al., 2002). Accordingly, we parcellated the whole brain into 90 (45 for each hemisphere) noncerebellar anatomical regions of interest (ROIs). This parcellation scheme will be referred to as AAL-90. A list of anatomical labels for the AAL-90 nodes is in Table 2. For each subject, we obtained representative descriptors (ALFF and GMV) of each ROI by simply averaging the values over all voxels in the ROI. Considering that the range of nodal scale and the difference in template parcellations may impact on the results of network analysis (Wang et al., 2009), we also used a high-resolution parcellation scheme with 1024 ROIs (Fornito et al., 2010; Wang et al., 2013; Zalesky et al., 2010). Specifically, we generated 1024 ROIs of approximately identical size (1.2 cm3) across both hemispheres (512 ROIs for each hemisphere) by subdividing each region in the low-resolution AAL-90 template into a set of subregions. This parcellation scheme will be referred to as AAL-1024 (Zhang et al., 2011b).
Regions of Interest in the Automated Anatomical Labeling Template
FCN construction
Amplitude of low-frequency fluctuation
The ALFF was defined as the averaged square root of activity in the low-frequency band (0.01–0.08 Hz), which was estimated voxel-by-voxel by using Fast Fourier Transform (Zang et al., 2007).
ALFF-based FCN
We extracted the average regional ALFF value within each ROI of each subject. Then, we computed an inter-regional correlation matrix rij
(
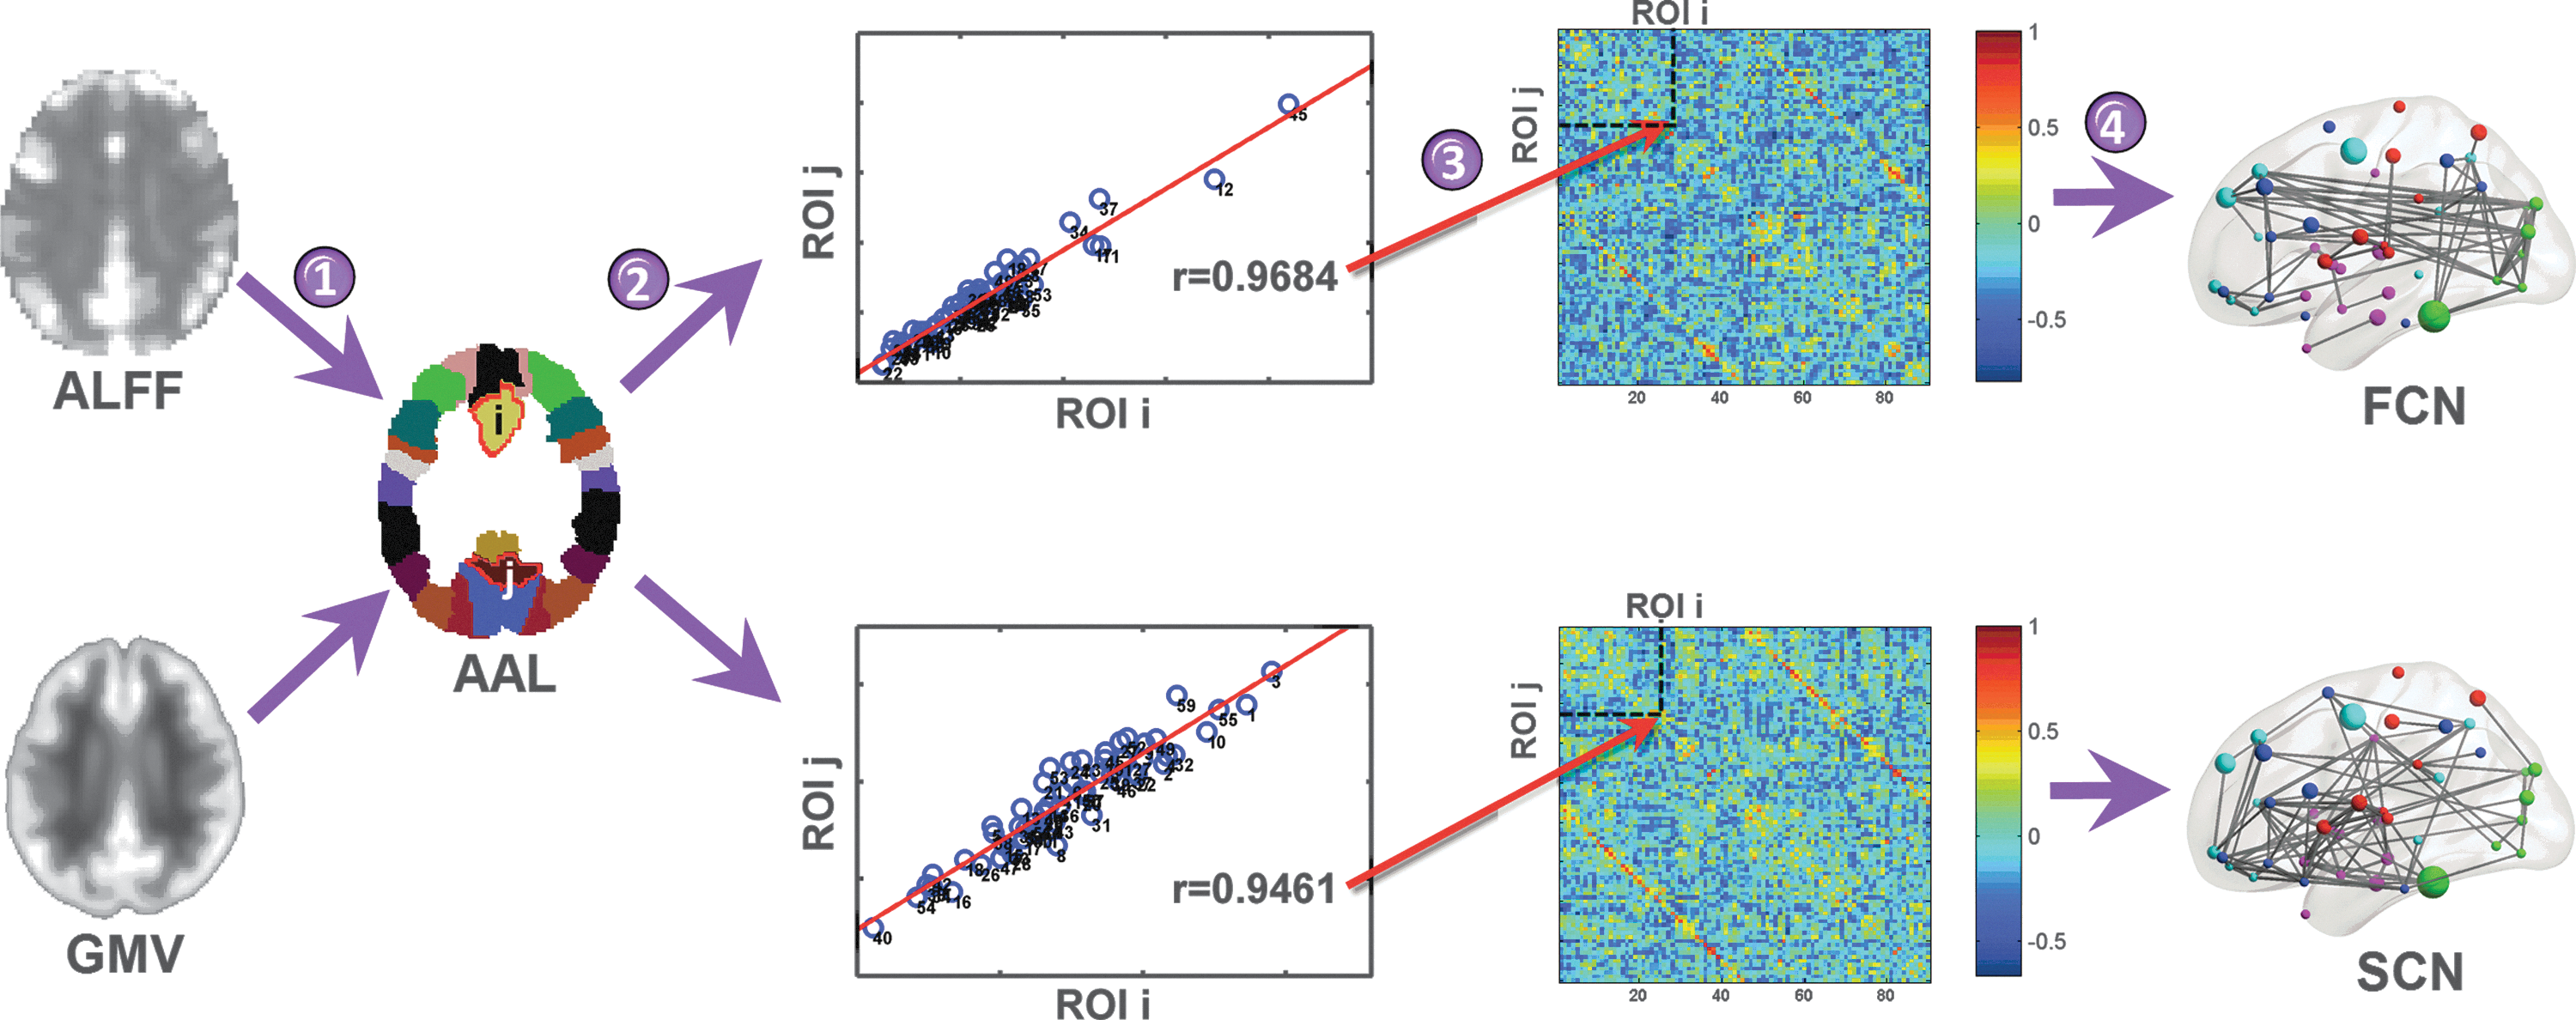
Flowchart of the construction of the functional and structural covariance networks. First, we extracted amplitude of low-frequency fluctuations (ALFF) and gray matter volume (GMV) values of each regions of interest (ROIs) defined on an automated anatomical labeling (AAL) template (step 1). Then, we calculated the partial correlation coefficients across individuals between the averaged ALFF values (or the averaged GMV values) of each pair of ROI (step 2). This yielded the construction of two connectivity matrices, based on the ALFF and GMV values, respectively (step 3). Finally, we thresholded the ALFF and GMV correlation matrices with a cost threshold, thereby constructing a weighed functional covariance network (FCN) and weighed structural covariance network (SCN), respectively (step 4).
SCN construction
Voxel-based morphometry analysis
We performed voxel-based morphometry analysis using SPM8. First, we reoriented all T1-weighed anatomical image position, the anterior commissure midline at the origin of the three-dimensional MNI space. The images were then segmented into gray matter, white matter (WM), and cerebrospinal fluid (CSF). A diffeomorphic nonlinear registration algorithm (diffeomorphic anatomical registration through exponentiated lie algebra [DARTEL]) (Ashburner, 2007) was used to warp the segmented images to a common space, which was representative of a group of individuals. The resulting images were then spatially normalized to the MNI space. An additional processing step consisted of multiplying each spatially normalized gray matter image by its relative volume before and after normalization, to preserve the total amount of gray matter in each voxel. Finally, we smoothed the resulting gray matter images with an 8-mm full-width half-maximum isotropic Gaussian kernel.
GMV-based SCN
Similarly to the procedure used to calculate the ALFF-based FCN, we estimated a GMV-based SCN using the inter-regional covariance of GMV across subjects (Bassett et al., 2008). First, we regressed out from the GMV in each ROI the effects of age, sex, the total intracranial volume (sum of the volume of gray matter, WM, and CSF), and interindividual variability of registration errors from individual GMV maps. The six head-motion parameters were estimated from the subject's GMV maps using a rigid-body realignment procedure, and we measured registration errors for each subject based on those parameters. For each pair of regions i and j, we computed the across-subject partial correlation rij , using the GMV from all other regions as controlling variables. The partial correlation coefficients between GMV across individuals were used to construct the SCN for each group (Fig. 1, bottom).
Network analysis
The analysis of weighed networks is aimed to investigate the connectivity strength on a continuous scale. This can enable a more comprehensive understanding brain organization. To construct weighed functional and SCNs, we defined as weighed edges as the absolute functional and structural covariance connectivity strengths between ROIs; for example, wij
=|rij
|, where rij
is the partial correlation coefficient between nodes i and j. Subsequently, we applied graph theoretical analyses on the functional and SCNs of patients with IGE-GTCS and healthy controls. To this end, we used the Brain Connectivity Toolbox (
Threshold selection
A previous study suggested that the brain network of each normal subject differs in both the number of significant edges and their weights (Wen et al., 2011). Accordingly, we applied a matching strategy before the comparison between patients and healthy controls, defining a network cost threshold for which each graph had the same number of edges. Since there is currently no formal consensus regarding selection of cost thresholds, here we selected a range of cost thresholds for the functional and SCNs according to the following criteria: (1) the averaged degree (the degree of a node is the number of connections linked to the node) over all nodes of each thresholded network was larger than log(N), where N is the number of ROIs (He et al., 2007). The selected cost was further adjusted to assure the each thresholded network was fully connected; and (2) the small worldness of the thresholded networks was larger than 1.1 for all participants and for two types networks (Zhang et al., 2011a). Based on the criteria above, we defined thresholds ranging from 0.14 to 0.30, with step=0.01.
Network metrics
We calculated both overall topology and nodal characteristics for both functional and SCNs, at each cost threshold (Rubinov and Sporns, 2010). The overall topologies included (1) small-world properties (σ) related to weighed clustering coefficient (Cnet ), weighed characteristic shortest path length (Lnet ), normalized weight clustering coefficient (γ), and normalized weight characteristic shortest path length (λ); (2) the total connection strength (Snet ); and (3) the network efficiency involving local efficiency (Eloc ) and global efficiency (Eglob ). The nodal characteristics included the nodal degree (Si ), which quantifies the extent to which a node is relevant to the graph, and the nodal efficiency (Ei ), which quantifies the importance of the nodes for the communication within the network (Bassett and Bullmore, 2006). Further, we calculated the area under the curve (AUC) for the above-mentioned network metric, providing an overall value for the topological characterization of brain networks independent of the selection of the cost threshold.
Overall topologies
The weighed clustering coefficient of a node i, Ci
, which expresses the likelihood that node i is connected to other nodes (Onnela et al., 2005), is defined as follows:
where wij
is the weight between nodes i and j in the network, and ki
is the degree of node i. The clustering coefficient is zero, Ci
=0, if the nodes are isolated or with just one connection. The overall weighed clustering coefficient, namely, Cnet
, was computed as the average of Ci
across all nodes in the network:
The overall weighed clustering coefficient Cnet is measure of the local interconnectivity or cliquishness of the network (Watts and Strogatz, 1998).
The path length between nodes i and j was defined as the sum of the edge lengths along the path, where each edge's length was quantified as the reciprocal of the edge weight, 1/wij
. The shortest weighed path length Lij
between nodes i and j was defined as the length of the path with the shortest length between the two nodes. The overall weighed characteristic path length Lnet
of a network was measured by a harmonic mean length between pairs (Newman, 2003), to overcome the problem of possibly disconnected network components. Formally, Lnet
is the reciprocal of the average of the reciprocals of the shortest weighed path lengths:
The overall weighed characteristic path length quantifies the ability for information propagation in parallel.
Small-world properties were originally proposed by Watts and Strogatz (1998). Here, to examine small-world properties, we compared the value of Cnet
and Lnet
of the brain network with those of the random networks (Crandom
and L
random). A small-world network has a similar path length, but higher clustering coefficient than a random network, that is,
Network efficiency
Efficiency is a biologically plausible metric to describe the brain networks from the point of view of information flow across nodes (Latora and Marchiori, 2001). For a given weighed network G with N nodes, the weighed global efficiency can be expressed as follows:
where Lij is the shortest weighed path length between the nodes i and j in G (see above definition).
The weighed local efficiency of graph G is measured as follows:
where Eglob (Gi ) is the global efficiency of subgraph (Gi ), which is composed by the neighbors of node i. Global and local efficiencies measure the capacity of information flow of a network at the global and local level, respectively.
Nodal characteristics
The nodal weighed degree (Si
) was computed as the sum of the weights of all the connections of node i, that is,
The nodal weighed efficiency of a given node i (Ei
) is defined as the inverse of the man harmonic shortest path length (Lij
) (see above) between this node and all other nodes in the network G (Achard and Bullmore, 2007), according to the following formula:
Nodal weighed efficiency (Ei ) quantifies the importance of the nodes for the communication within the network (Bassett and Bullmore, 2006).
Correlation between the FCN and SCN
For each group, we quantified the correlation between the FCN and SCN. After calculating the functional and structural covariance matrices, we converted them to Z-scores using the Fisher's r-to-z transformation. We measured the spatial correlation between the resulting Z-score matrices (considering only the values in upper triangular matrix) to quantify their similarity (Zhang et al., 2011b).
Statistical analysis
We first compared the regional ALFF and GMV between patients and healthy controls. We used two-sample t-tests on each regressed ALFF (or GMV) values in each ROI of the AAL-90 parcellation. We corrected the statistical significance for multiple comparisons using a false-positive adjustment. Specifically, we set p<(1/N)=0.011, where N=90 corresponds to the number of comparisons. This implies accepting less than one false-positive per analysis (Fornito et al., 2011; Lynall et al., 2010).
In addition, we delineated six specific brain systems (frontal, parietal–premotor, occipital, medial temporal, subcortical, and temporal systems), and we examined the relationship between their network costs, estimated on the ALFF and GMV inter-regional correlations of patients and healthy controls. Further, between-group differences were compared to a null distribution of differences, which were recalculated on the correlation matrices obtained by randomizing all participants, and splitting them into two groups numerically equivalent to the original patient and healthy control groups. This procedure was repeated for 1000 iterations. We assigned a p-value to the between-group difference (patients vs. healthy controls) by computing the proportion of differences exceeding the null distribution values. A threshold of α=0.05 was used.
We then compared the overall graph topology of the FCN and SCN between patients and healthy controls. To this end, we used nonparametric permutation tests (He et al., 2008) on network metrics for each cost threshold, as well as on its AUC. A threshold of α=0.05 was used for testing all graph characteristics.
Using the above nonparametric permutation framework, we also compared the nodal properties (Si and Ei ) between patients and healthy controls. Statistical significance was corrected for multiple comparisons using a false-positive adjustment (Fornito et al., 2011; Lynall et al., 2010).
Finally, we compared the correlation of the FCN and SCN between patients and healthy controls by using permutation testing (1000 iterations).
Relationship between ALFF and GMV and clinical variables
To investigate the clinical relevance of ALFF and GMV in patients, we correlated the clinical variables, duration of epilepsy, and seizure frequency, with ALFF and GMV measurements. We used a Pearson's correlation analysis, controlling for sex, and mean FD for FCN, a as confounding variable (p<0.05).
Results
Regional ALFF and GMV changes
We examined altered regional GMV changes in patients relative to healthy controls by between-group comparisons (Fig. 2). We observed an increased regional GMV in the bilateral hippocampus (T=3.84 and T=4.32 for left and right, respectively) and the right middle temporal pole (T=3.99). We also found a decreased regional GMV in the left orbital part of the inferior frontal gyrus (T=−3.88), medial superior frontal gyrus (T=−4.03), rectus gyrus (T=−4.85) and right Rolandic operculum (T=−4.74), anterior cingulate cortex (T=−4.40), and medial orbital part of the superior frontal gyrus (T=−5.03) (all p<0.05, corrected). There were no significant changes in the regional ALFF.
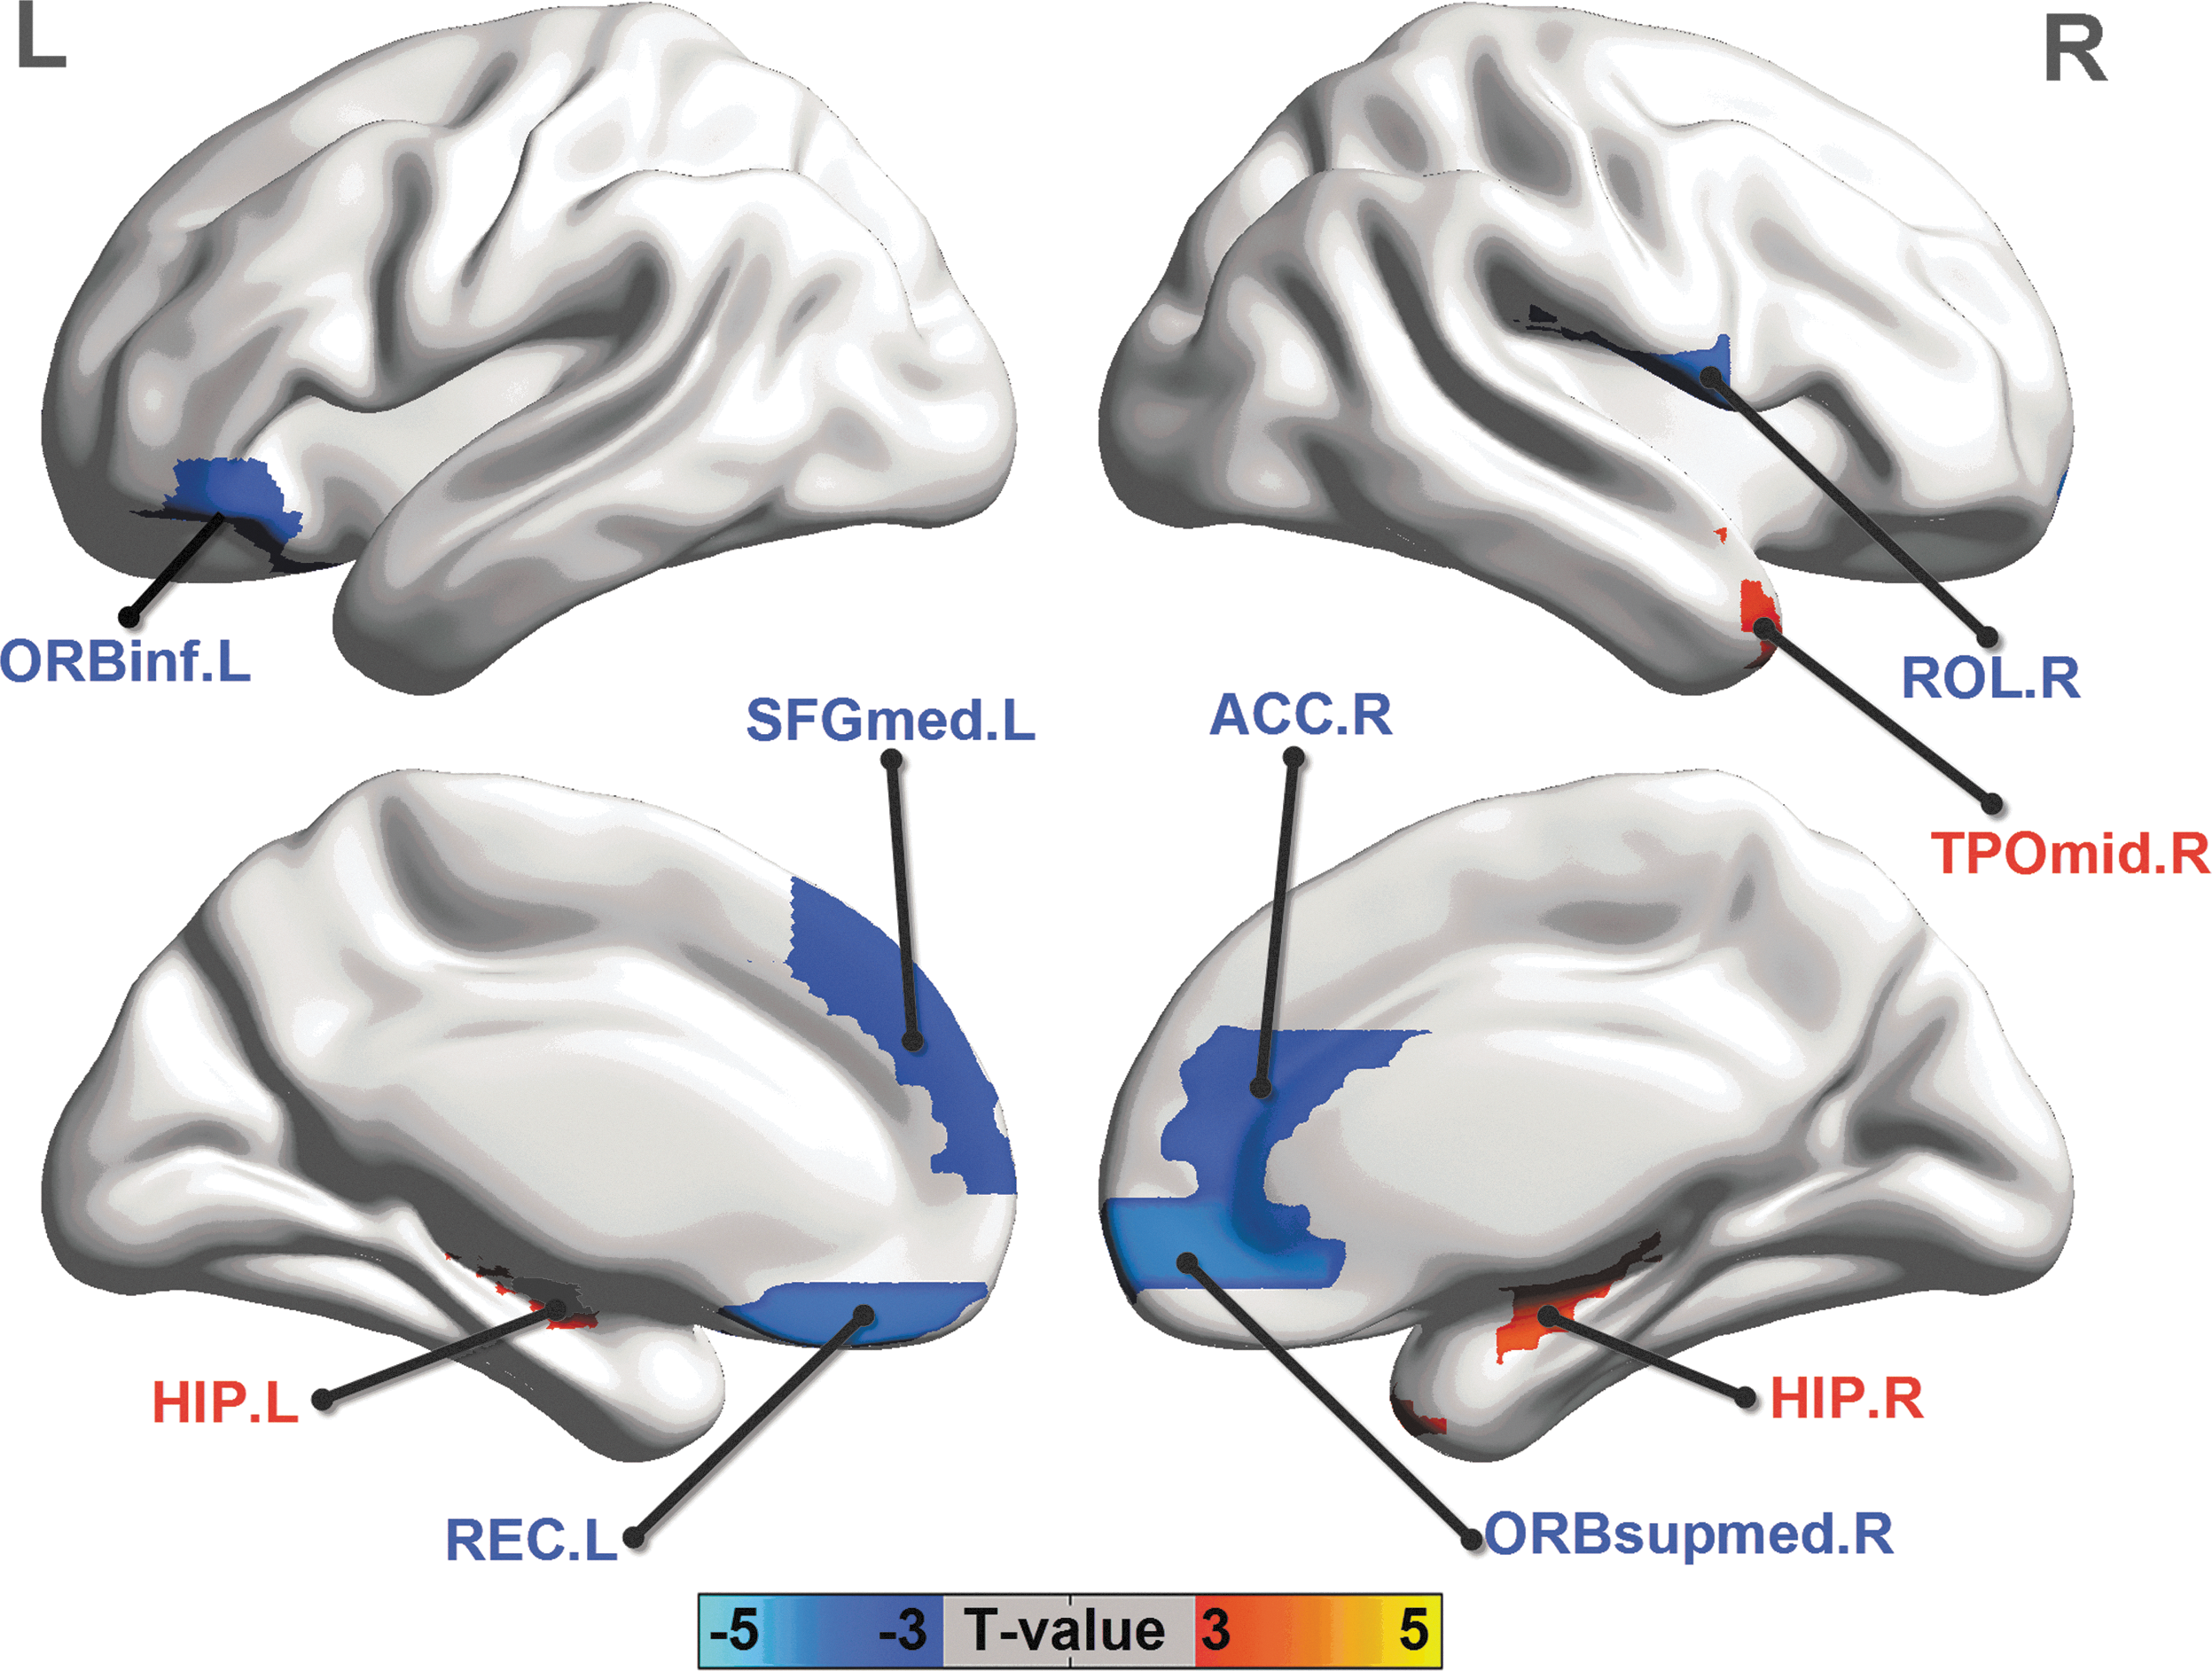
Between-group comparison of regional GMV. Three-dimensional representations (Left: lateral view of left hemisphere; Right: lateral view of right hemisphere) of regional GMV changes in patients (two sample two-tailed t-test, p<0.05, corrected). The warm and cold colors indicate the brain regions with significantly increased and decreased regional GMV in patients, respectively. A list of anatomical labels of the nodes is in Table 2. Results were visualized using the BrainNet viewer (NKLCNL, Beijing Normal University).
Network constructions in inter-regional covariance of ALFF and GMV
We created an AAL-90 FCN and SCN by measuring the inter-regional ALFF and GMV correlations in patients and healthy controls, separately (Fig. 3). In addition, we compared the network cost within and between six anatomically defined brain systems (frontal, parietal–premotor, occipital, medial temporal, subcortical, and temporal systems) defined on the AAL-90 FCN and SCN (Fig. 4). We found relatively high cost values within systems and low cost values between systems. Further, the patients showed increased cost between the medial temporal system and occipital system (p=0.039) and decreased cost within the frontal system (p=0.043) of the AAL-90 FCN. Moreover, we observed increased cost between the subcortical and the frontal systems (p=0.028) of the AAL-90 SCN in the patients.
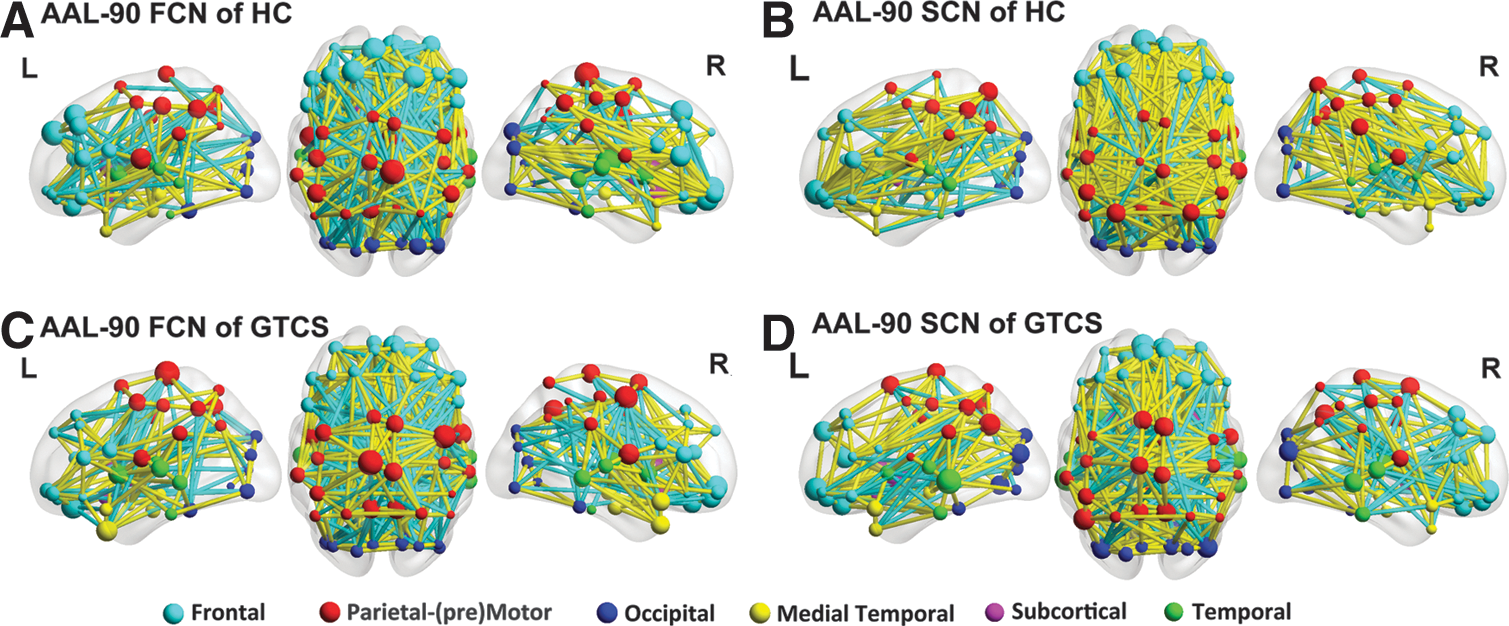
ALFF-based FCN and GMV-based structural covariance network. Three-dimensional representations (Left: lateral view of left hemisphere; Center: dorsal view; Right: lateral view of right hemisphere) of ALFF-based FCN
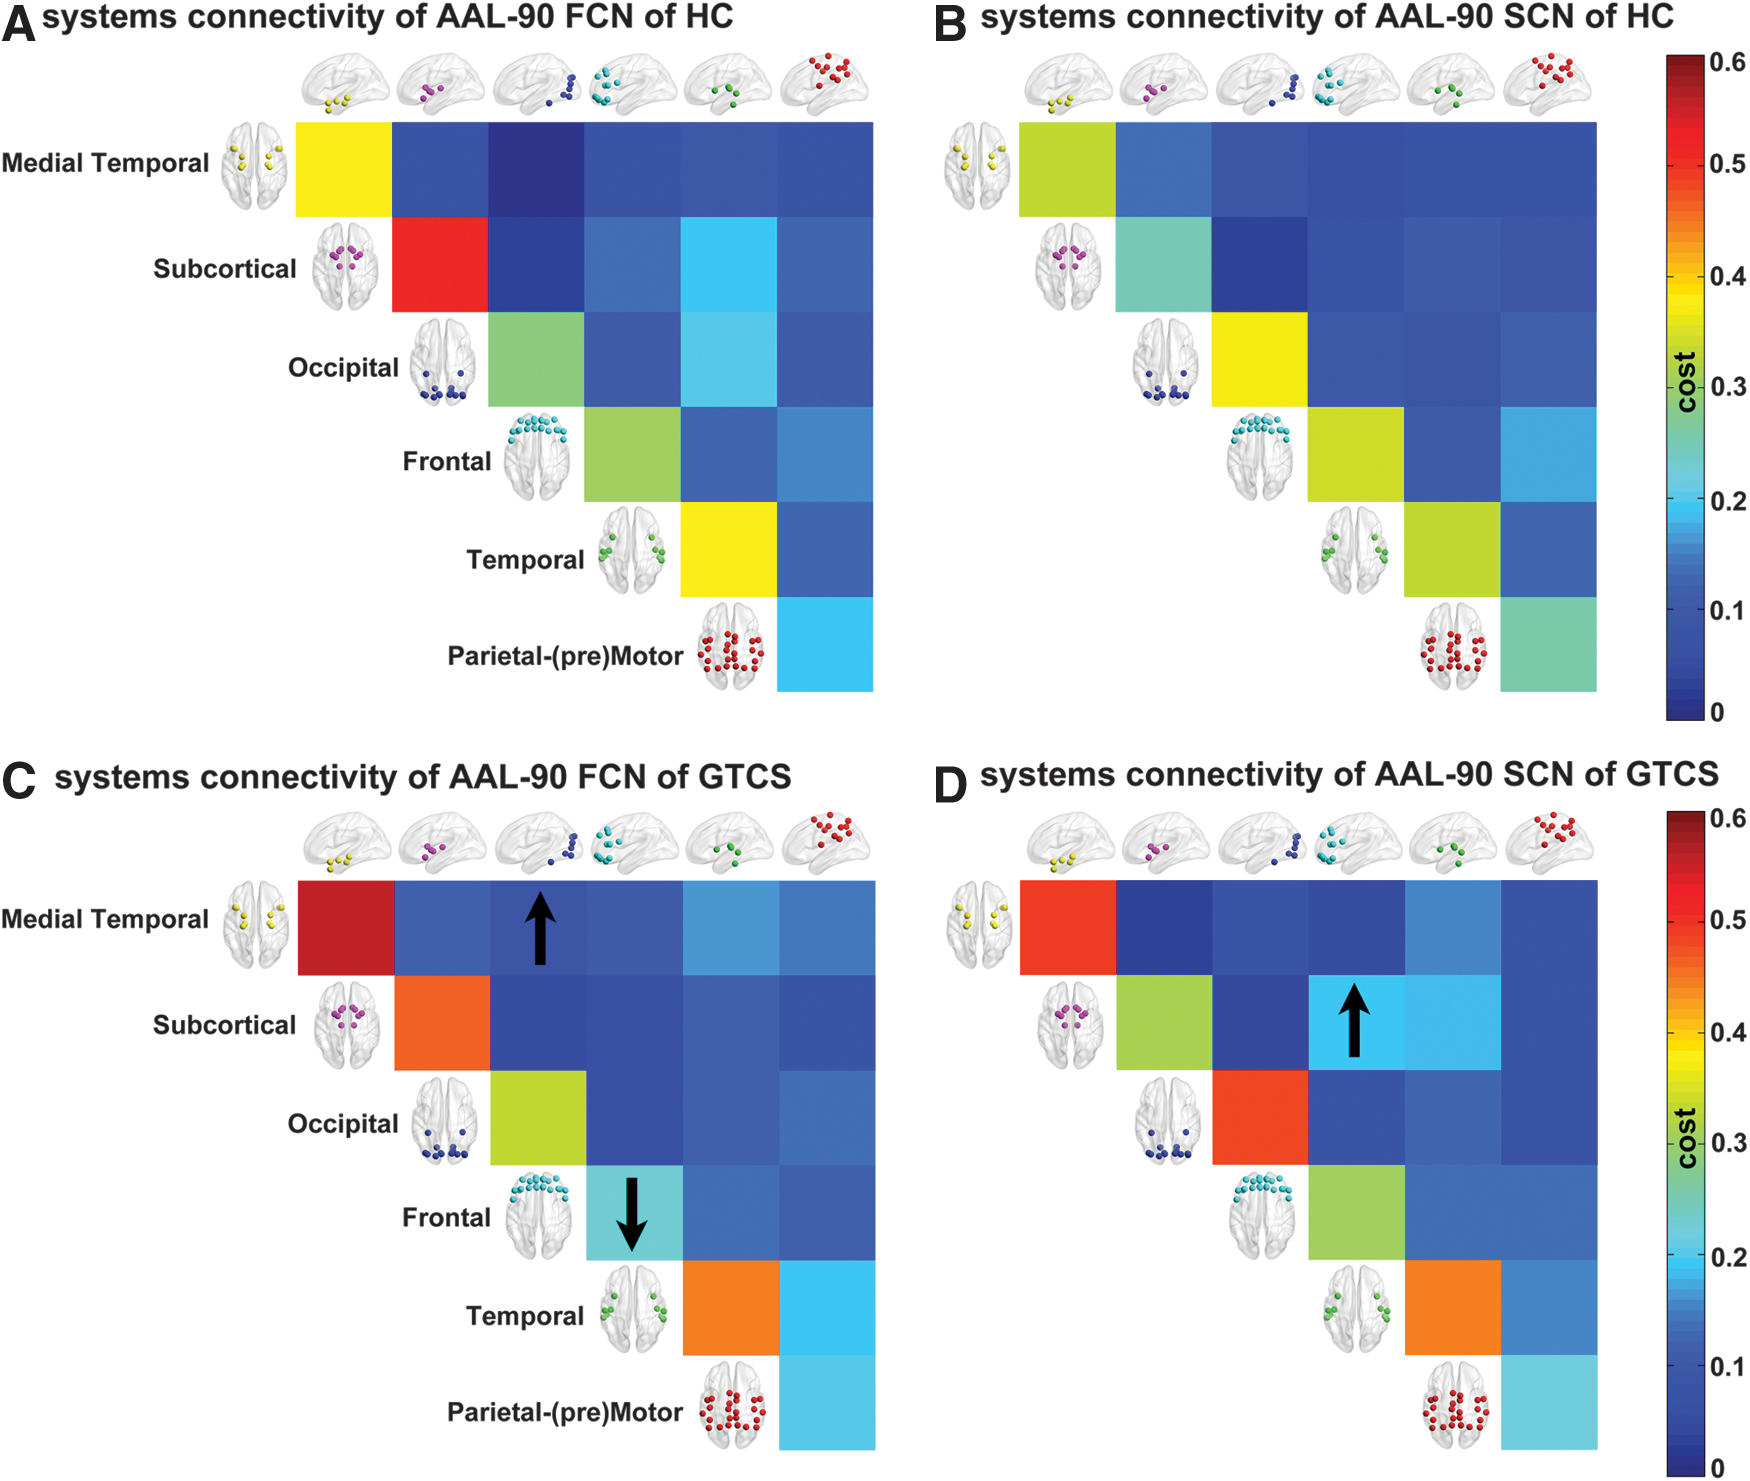
Inter-regional correlation changes between brain systems in patients and healthy controls. We examined the cost values within systems (matrix diagonal) and between systems (upper triangular matrix) of the AAL-90 FCN and SCN of controls
Overall topology of the FCN and SCN
Since the overall topological properties of the brain network rely on the choice of the threshold, we used multiple cost thresholds (0.14 to 0.30, step=0.01) to evaluate the stability of the topological organization at specific small-world regimes for both the AAL-90 FCN and SCN (Fig. 5).
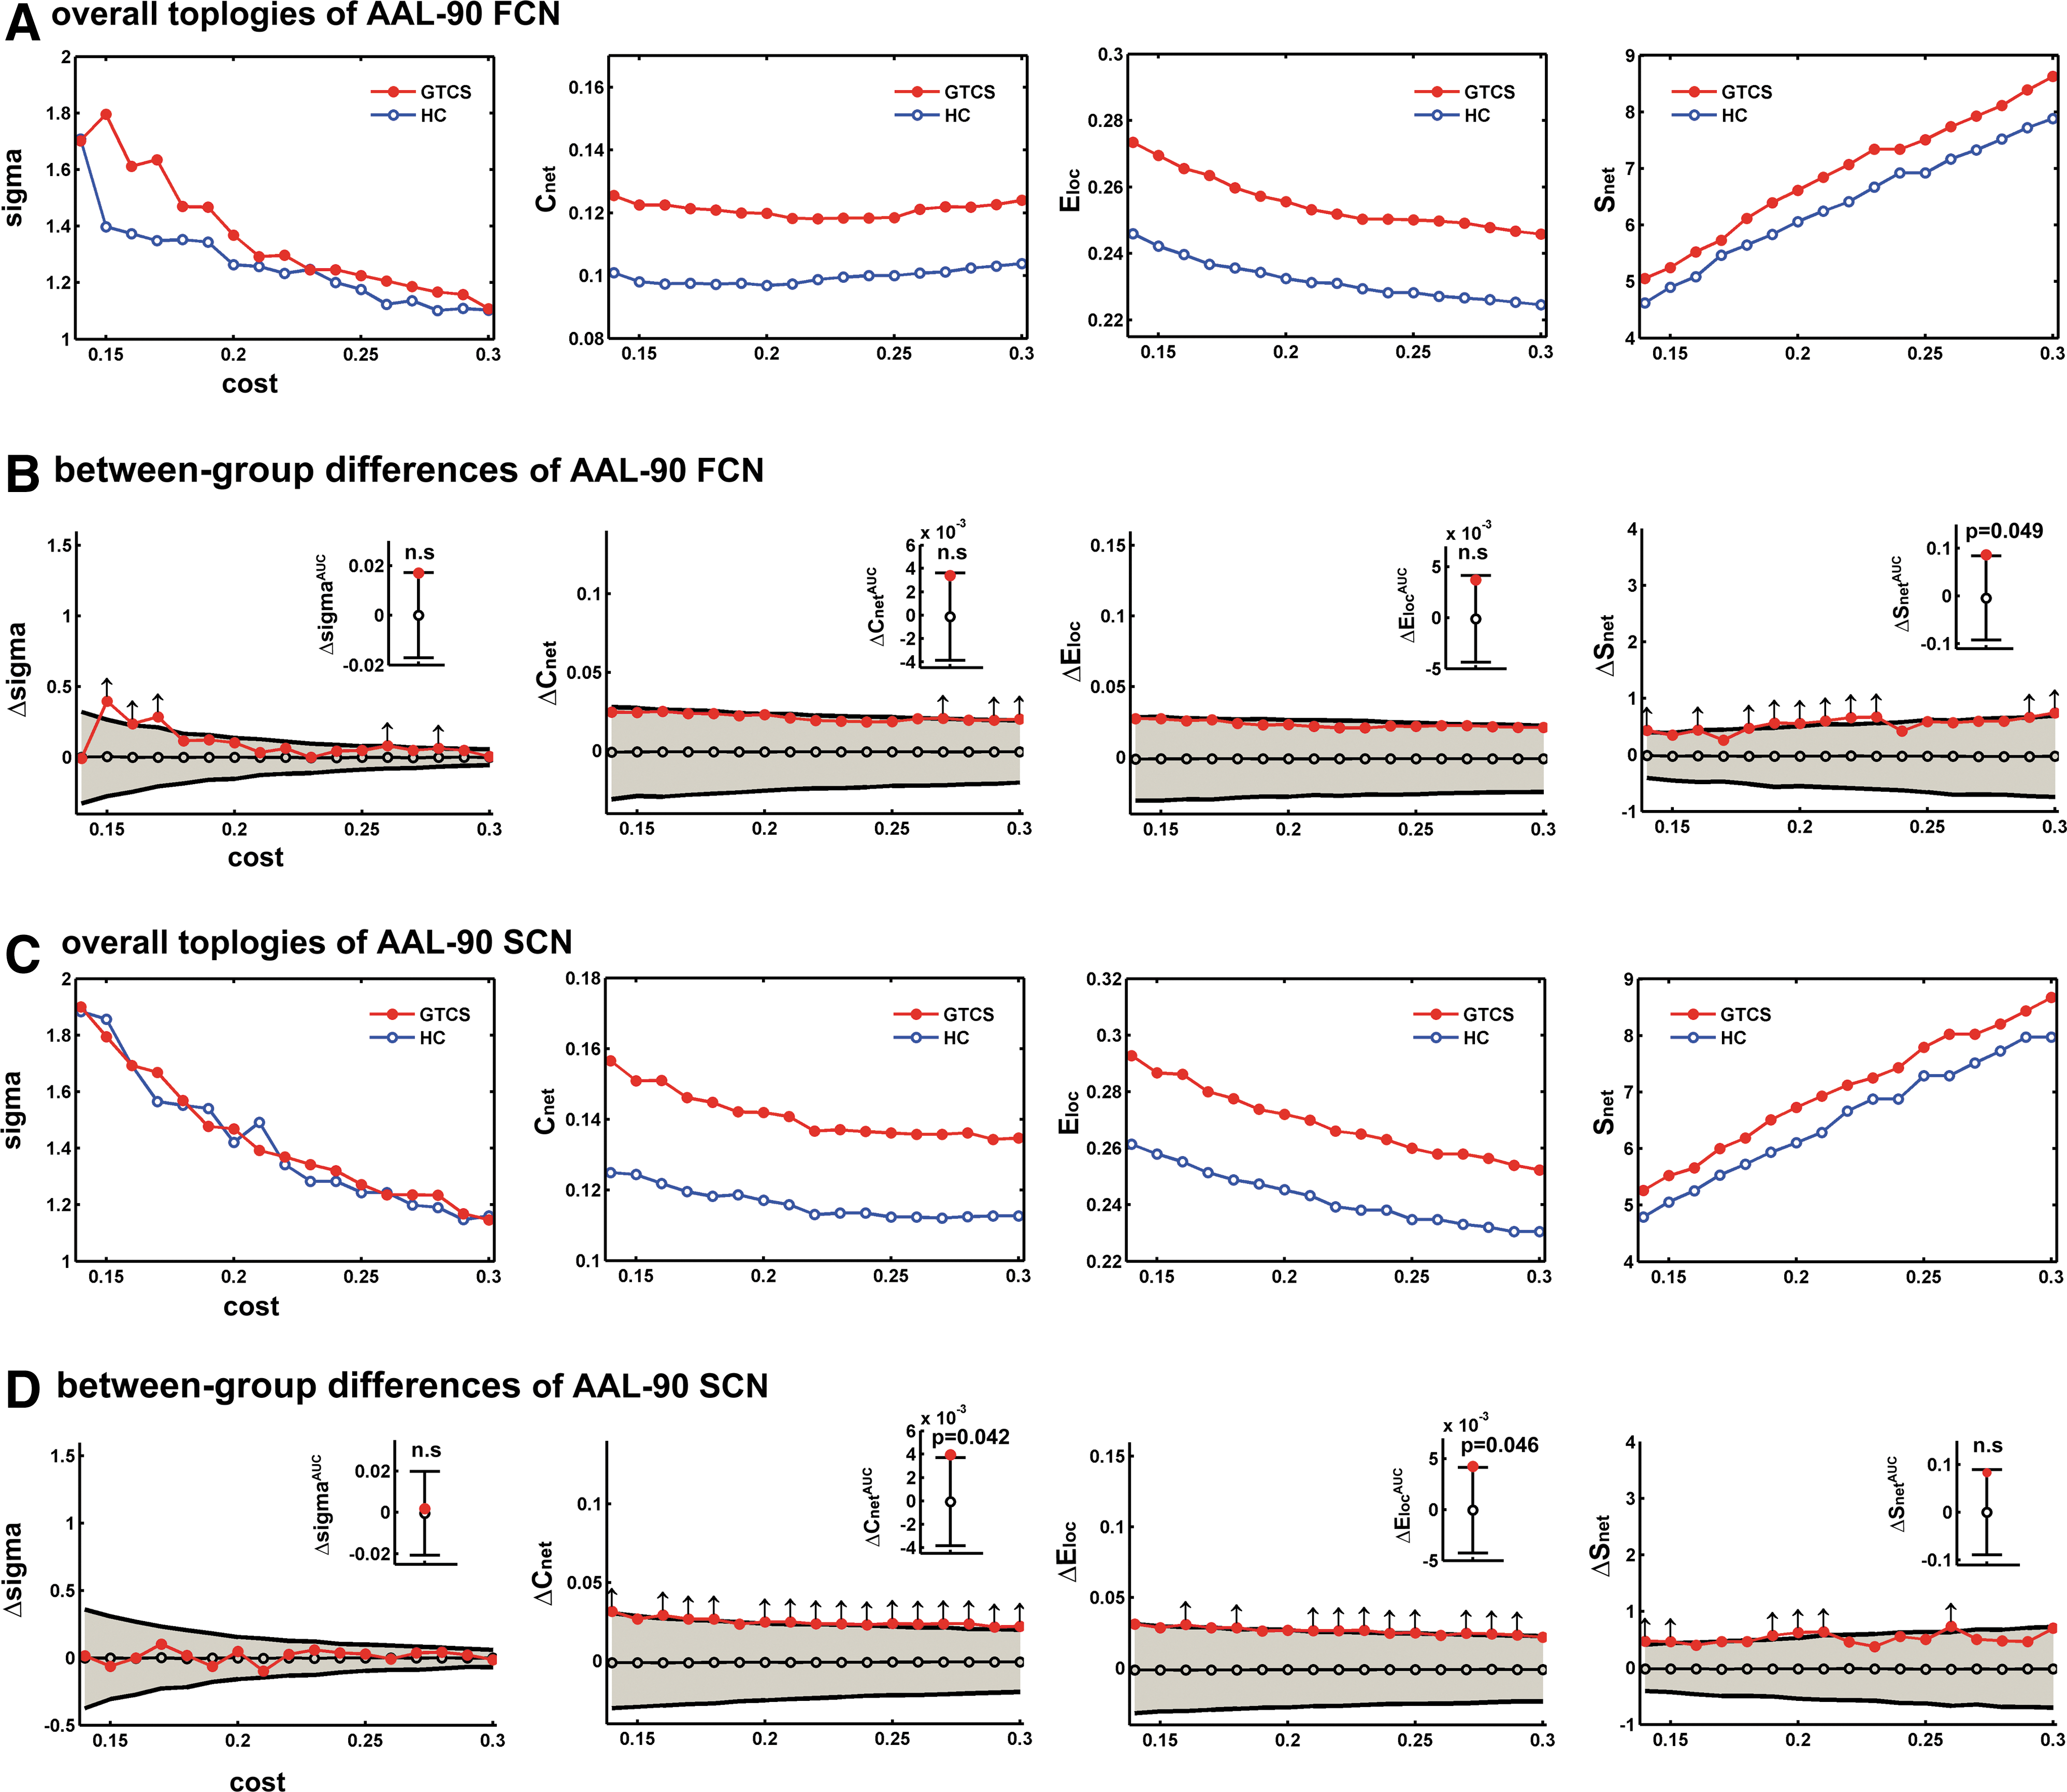
Overall topologies of the AAL-90 FCN and SCN. We examined small-world topology (Sigma), weighed clustering coefficient (Cnet
), weighed local efficiency (Eloc
), and total connection strength (Snet
) (left to right, respectively) of the FCN
Between-group comparisons showed altered overall network characteristics in patients relative to healthy controls. Among the topological properties in the AAL-90 FCN, we observed the total connection strength (Snet ) to be significantly increased in patients across multiple (10 out of 17) cost thresholds (p<0.05) (Fig. 5B, arrows). The AUC of the Snet was decreased in patients (p=0.049) (Fig. 5B, inset barplot). The AUC of the sigma, Cnet and Eloc showed no significant difference between groups.
Among the topological properties in the AAL-90 SCN, weighed local efficiency (Eloc ) and weighed clustering coefficient (Cnet ) were increased in patients for all cost thresholds (p<0.05) (Fig. 5D, arrows). Conversely, the AUC of both Eloc (p=0.046) and Cnet (p=0.042) were decreased in patients (Fig. 5D, inset barplot).
Other topological properties, that is, small-world properties (σ), normalized weighed clustering coefficient (γ), normalized weighed characteristic path length (γ), and weighed characteristic path length (λ), did not show between-group differences in the AAL-90 FCN and SCN (Fig. 5).
The overall topological properties of FCN and SCN were also compared between groups using the high-resolution AAL-1024 parcellation. In this case, a fixed cost (cost=0.0115) was used (Fig. 6). This ensured that the averaged degree (the degree of a node is the number of connections linked to the node) over all nodes of each FCN and SCN network was larger than log(N), with N=1024 in this case. We observed the small-world property (σ) to be significantly increased in patients for the AAL-1024 FCN (p=0.001) (Fig. 6).
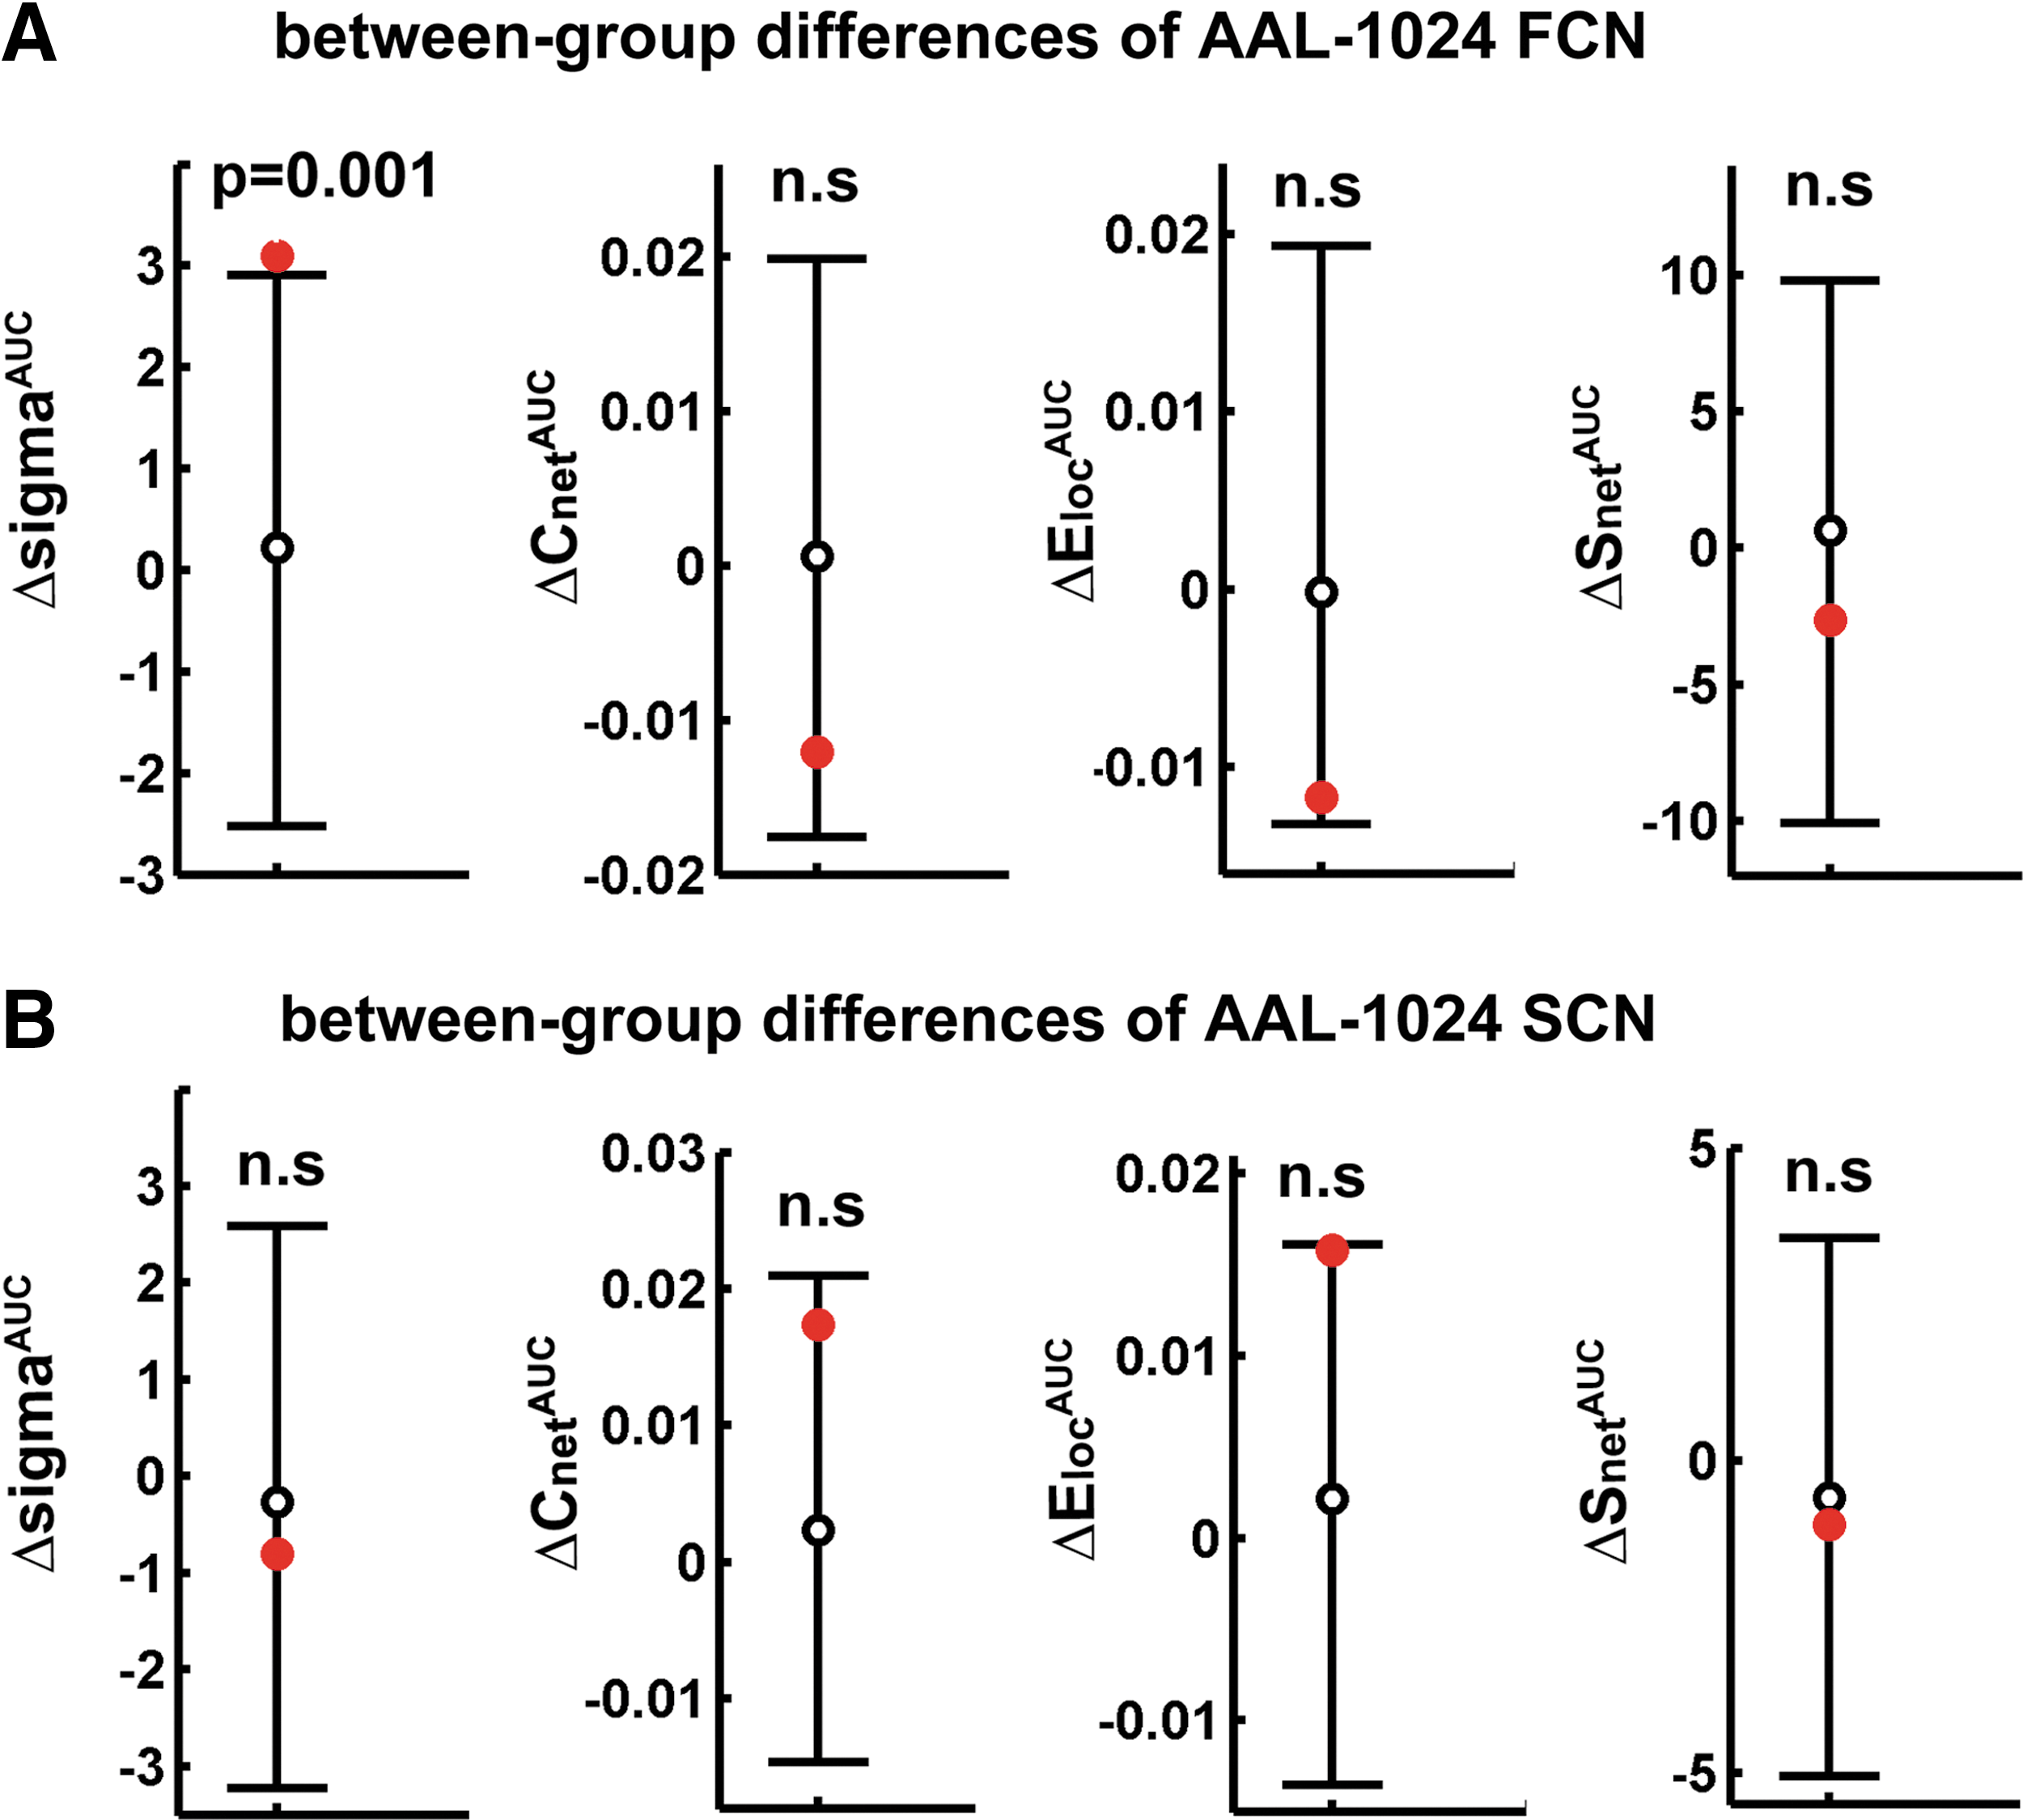
Overall topologies of AAL-1024 FCN and SCN. We examined the differences (red circles) between the FCN
Nodal characteristics of the FCN and SCN
Between-group comparisons on the nodal weighed efficiency (Ei ) and degree (Si ) revealed alterations in both the FCN and SCN of patients (Fig. 7). In the AAL-90 FCN, patients had an increased Ei in the right hippocampus (p=0.005) and amygdala (p=0.031, uncorrected) (Fig. 7A). Similar alterations in patients were found for Si , with increases in the right hippocampus (p=0.007) and amygdala (p=0.033, uncorrected) (Fig. 7A).
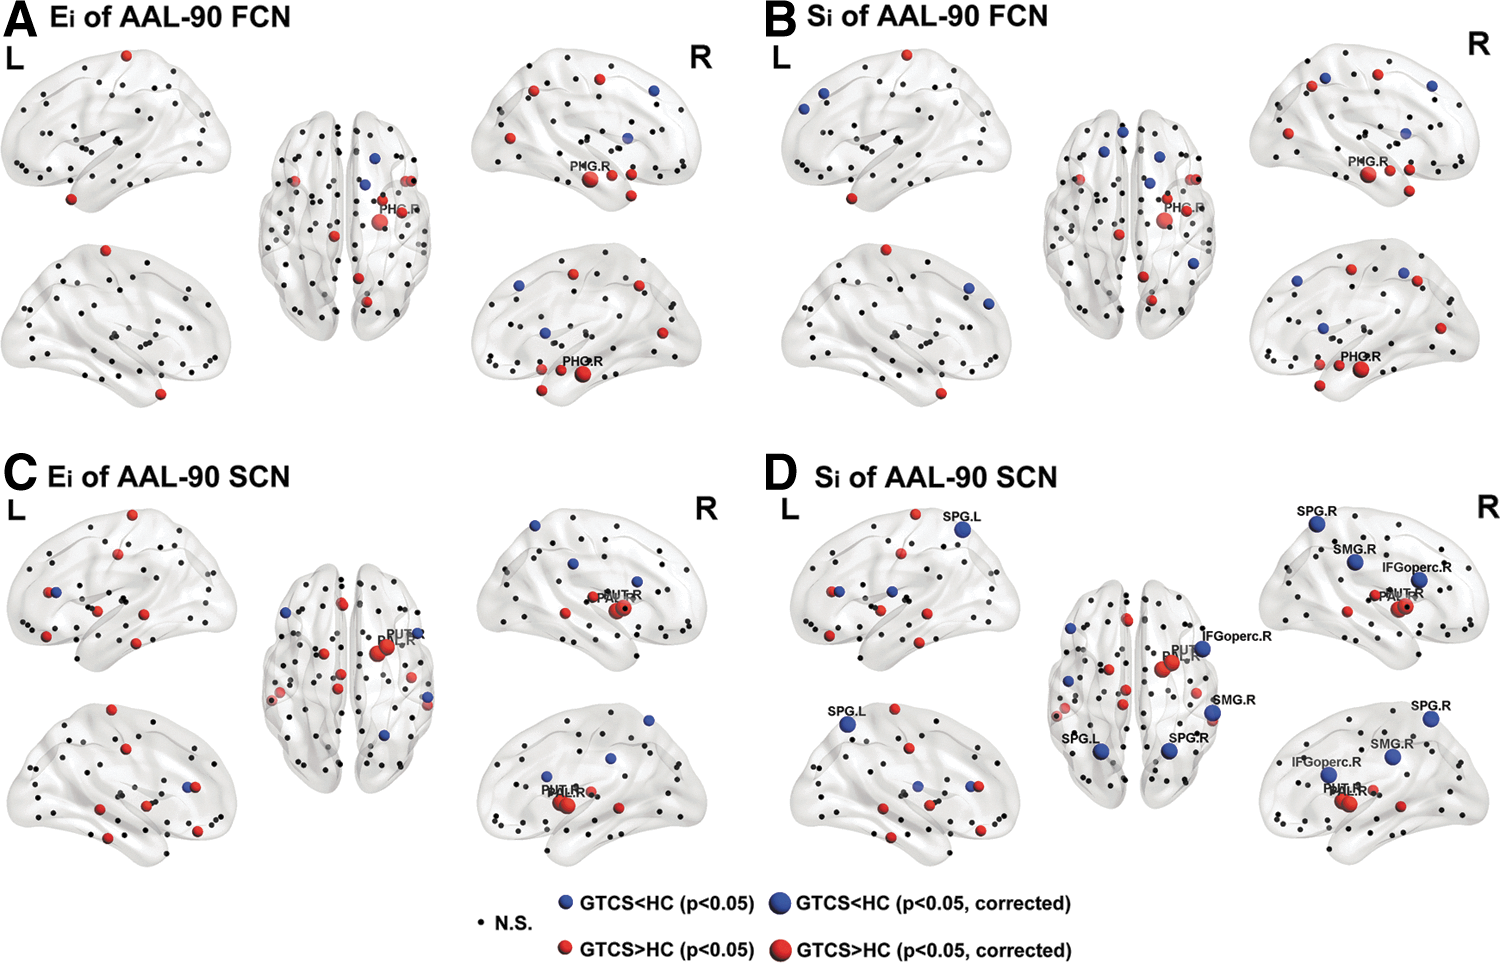
Alterations of nodal weighed efficiency and degree of AAL-90 FCN and SCN in patients. Results were produced using permutation testing, and visualized using the BrainNet viewer (NKLCNL, Beijing Normal University). Three-dimensional representations (Left: lateral and medial view of left hemisphere; Center: dorsal view; Right: lateral and medial view of right hemisphere) show the between-group difference of nodal weighed efficiency (Ei
) of FCN
In the AAL-90 SCN, we found increased Ei in patients in the right putamen (p=0.005) and pallidum (p=0.005) (Fig. 7C). These increases in patients were also mirrored in the Si measure. Further, we observed decreased Si in the bilateral superior parietal gyrus (p=0.008 and p=0.009 for left and right, respectively), right supramarginal gyrus (p=0.006), and opercular part of the inferior frontal gyrus (p=0.007) (Fig. 7D).
The epilepsy duration was negatively correlated with the ALFF in the bilateral parietal (superior parietal gyrus, precuneus, and supplementary motor area) and temporal (middle temporal gyrus and inferior temporal gyrus) regions. Further, we found positive correlations between epilepsy duration and ALFF in the bilateral subcortical and medial temporal regions (Fig. 8A). GMV in the bilateral frontal and parietal regions (e.g., posterior cingulate cortex, precuneus, inferior parietal gyrus, superior inferior parietal gyrus, and medial orbital part of the superior frontal gyrus) was negatively correlated in patients, and there were no significant positive correlations (Fig. 8C). In addition, the seizure frequency was positively correlated with ALFF in the left posterior cingulate cortex and inferior parietal gyrus (Fig. 8B), and with GMV in the bilateral anterior cingulate gyrus (Fig. 8D).
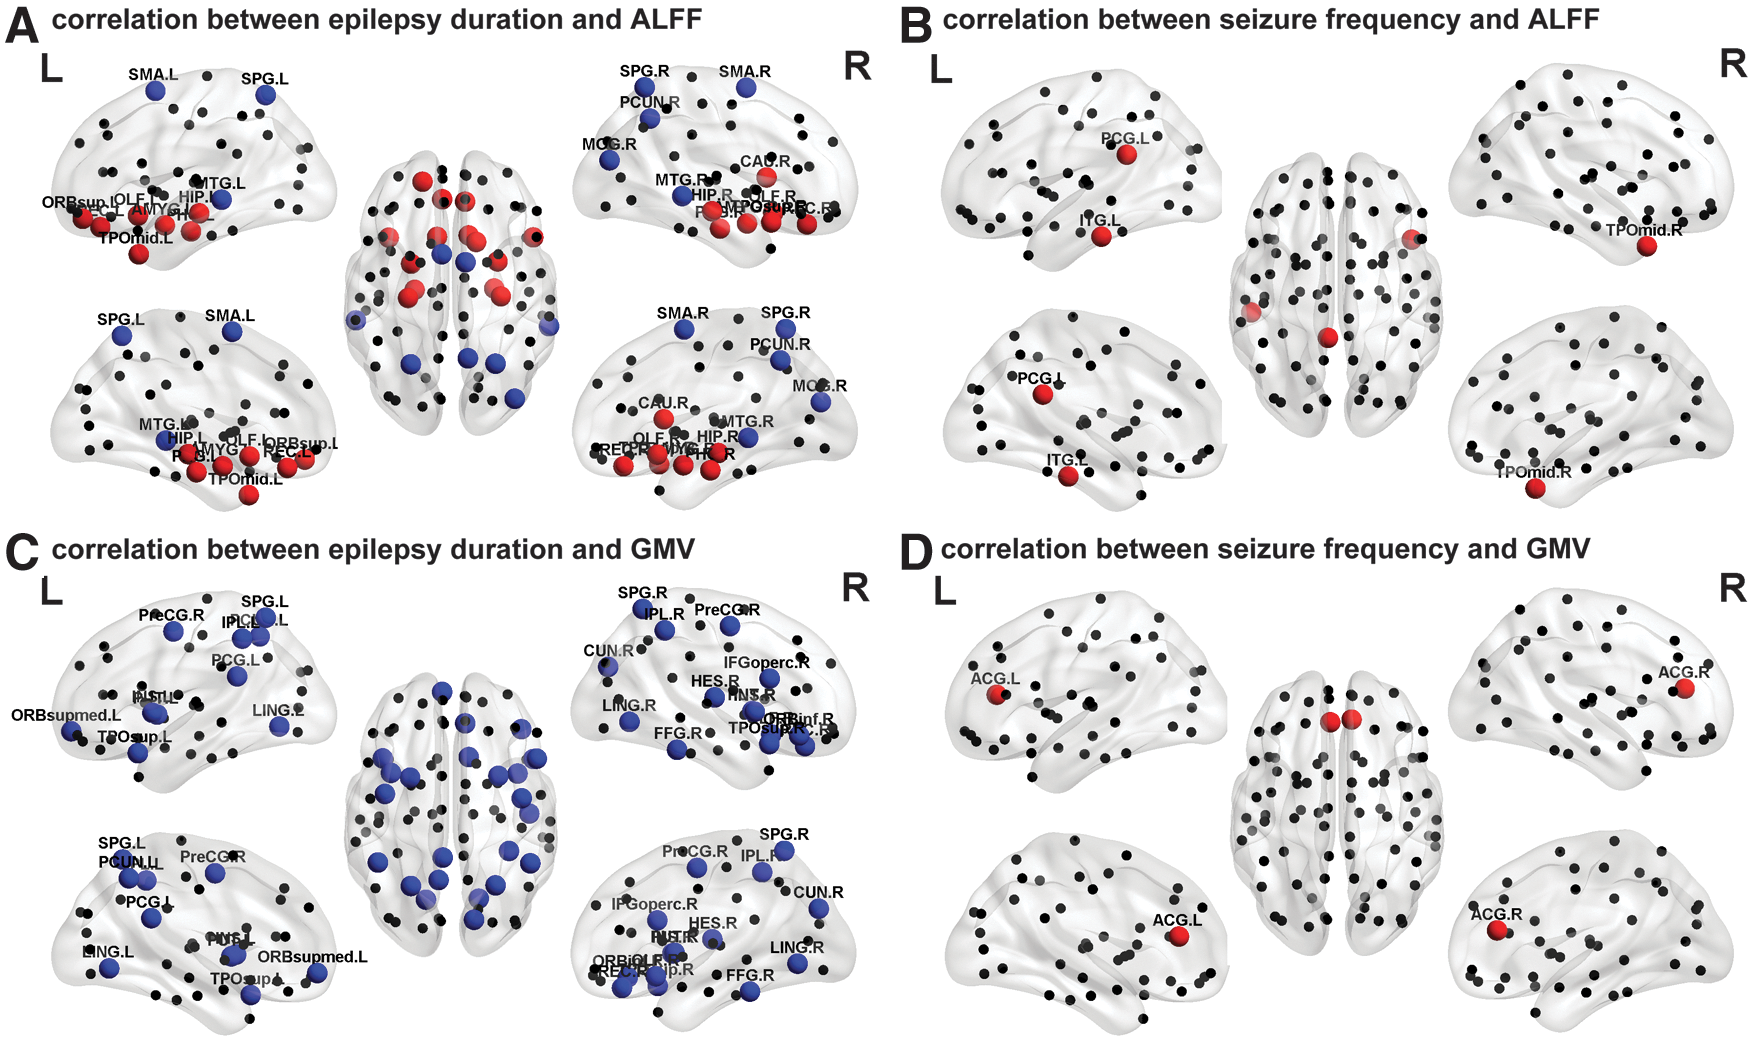
Relationship between functional and structural descriptors and clinical variables. Three-dimensional representations (Left: lateral and medial view of left hemisphere; Center: dorsal view; Right: lateral and medial view of right hemisphere) showing correlations between epilepsy duration and functional (ALFF) descriptor
Altered correlation of the functional and SCNs
We found significant positive correlations between the FCN and SCN matrix in patients (r=0.5275 and r=0.2989 for AAL-90 and AAL-1024 parcellation, respectively) as well as in healthy controls (r=0.4271 and r=0.2343 for AAL-90 and AAL-1024 parcellation, respectively), for both low- and high-resolution parcellations. Strikingly, the FCN-SCN correspondence in patients was significantly larger (p=0.0109 and p=0.0103 for AAL-90 and AAL-1024 parcellation, respectively) than that in the healthy controls (Fig. 9).
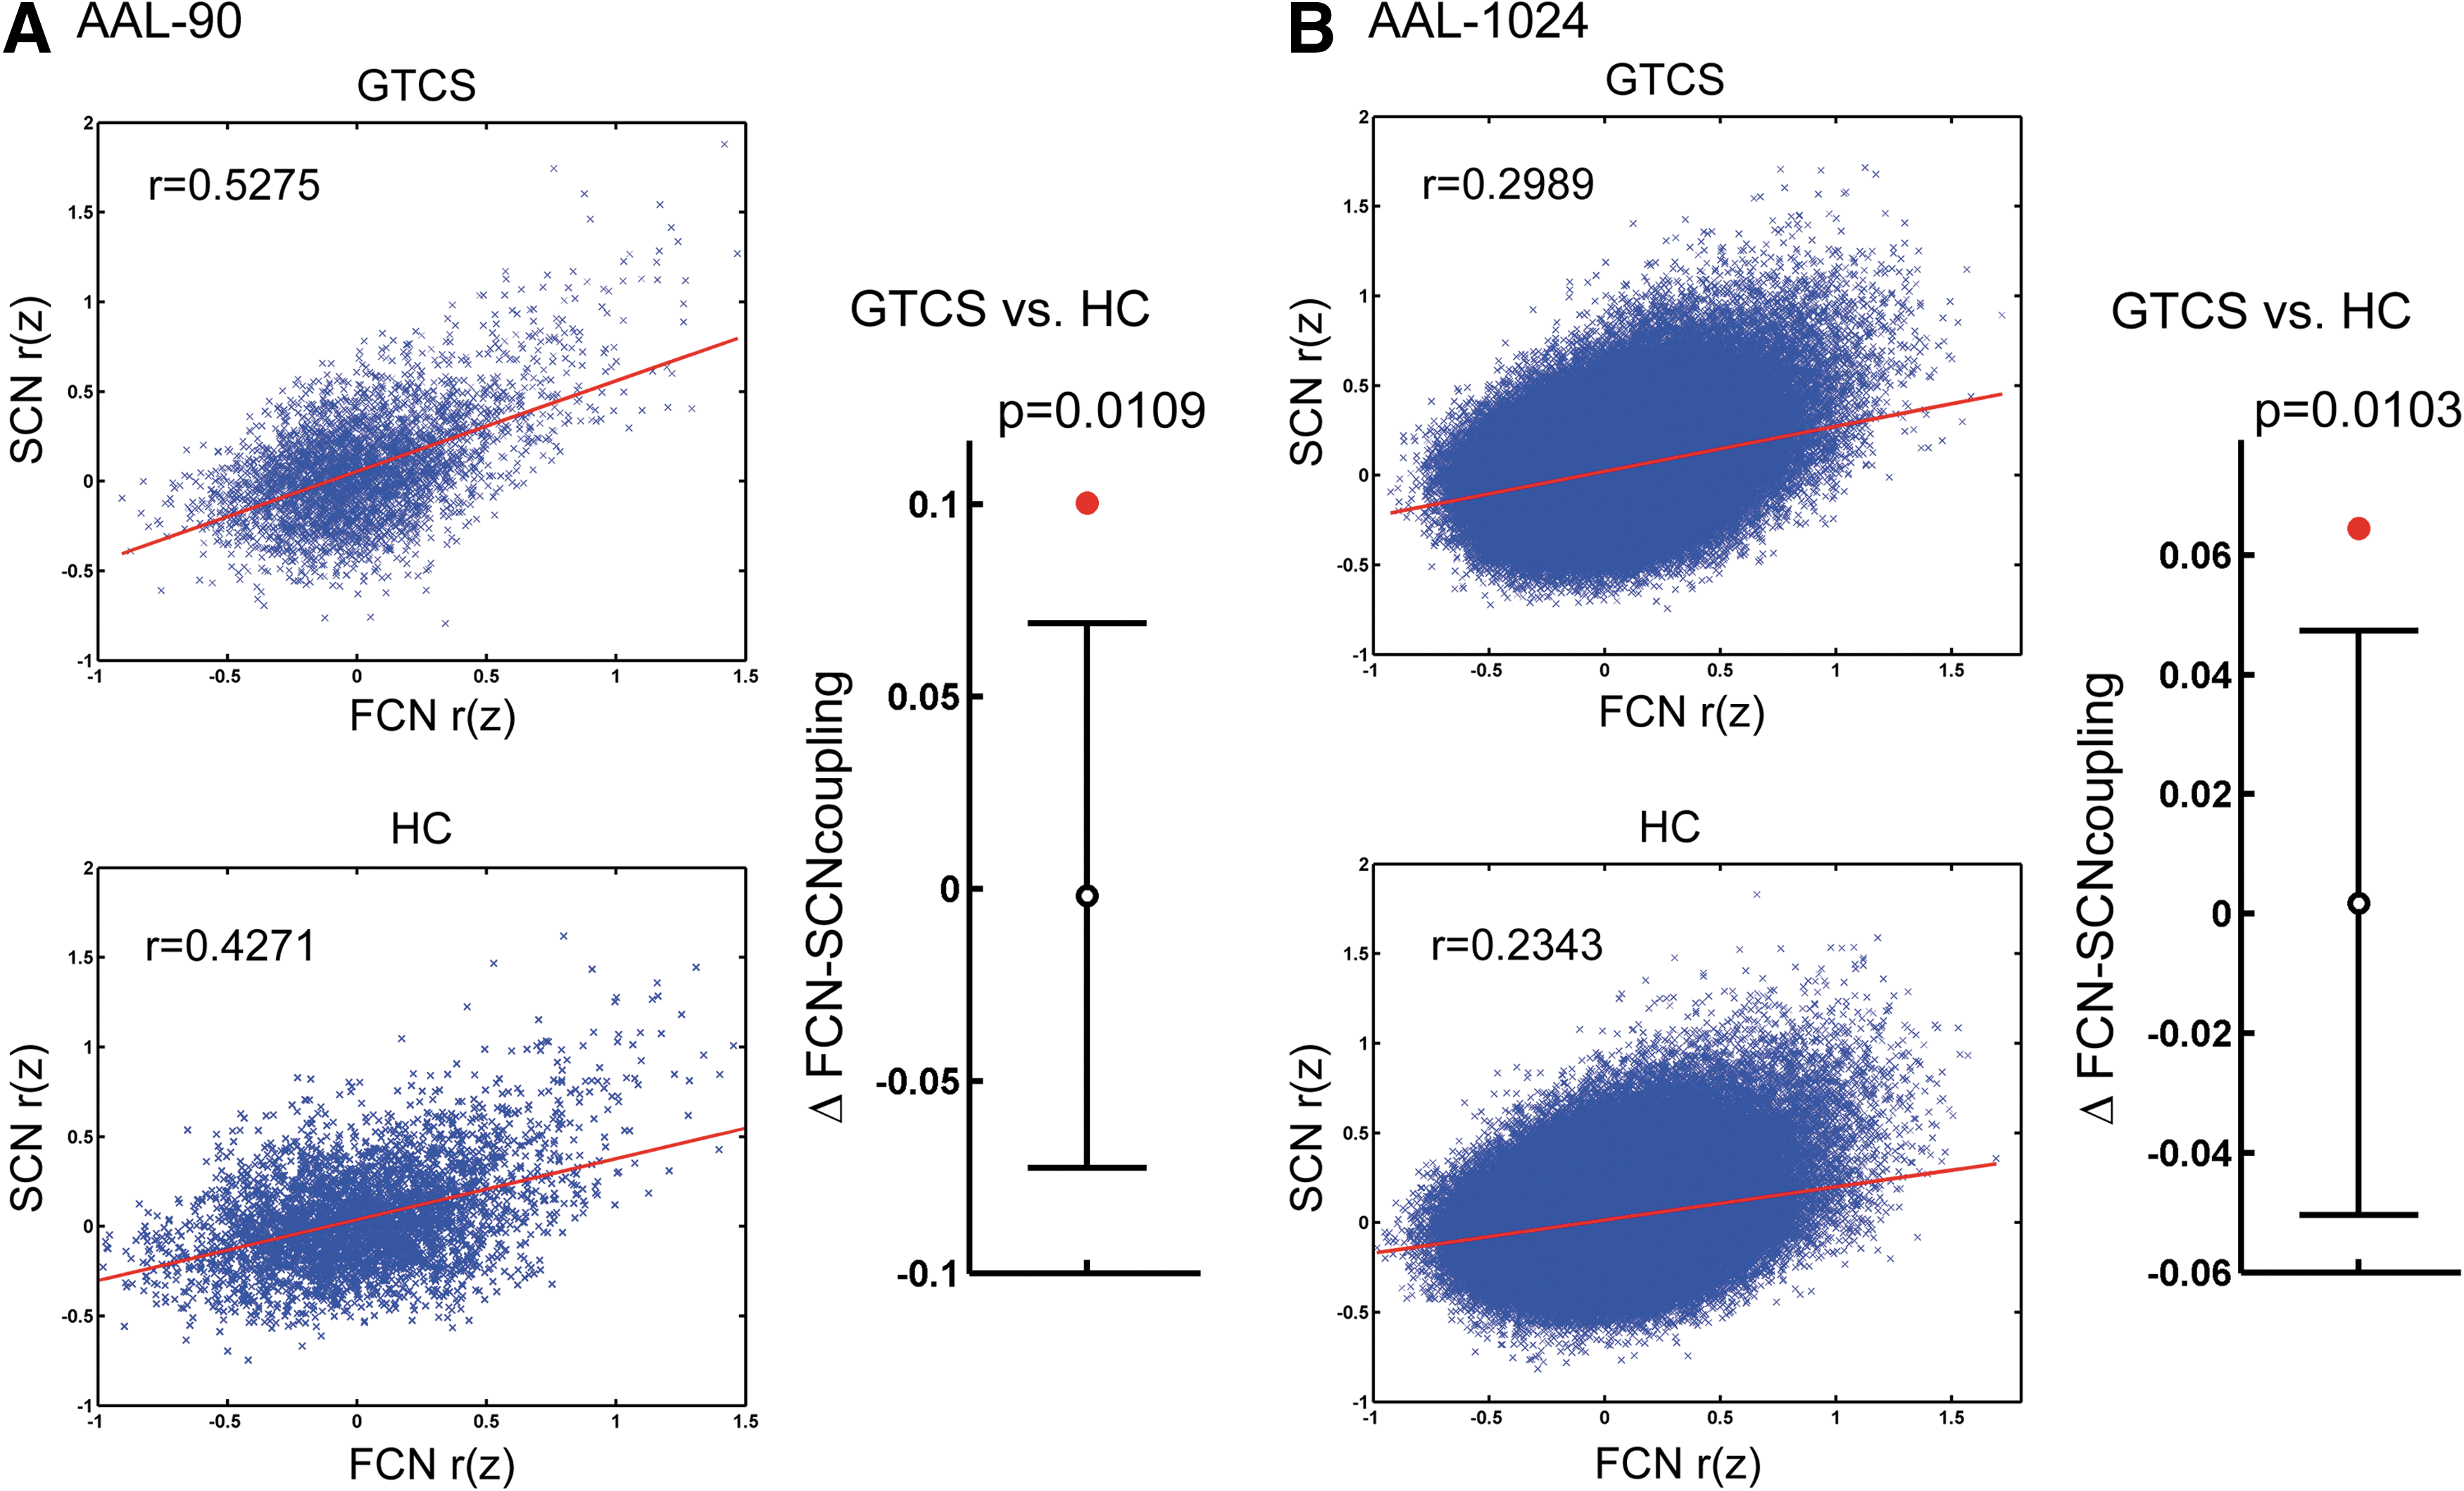
Disrupted correlation of functional and structural covariance networks. The correlation of the functional and structural covariance matrix (Fisher z-transformed) of the patients and healthy controls of AAL-90
Discussion
In this study, we examined the topological organization of the brain in IGE patients, through the ALFF-based FCN and GMV-based SCN. Our investigation led to four main findings: (1) the FCN revealed that the brain has network topological characteristics, including small worldness and highly connected hub regions, as previously observed in the SCN; (2) small worldness in both the FCN and SCN were not altered in patients, whereas other overall network characteristics (Snet , Cnet , and Eloc ) showed alterations for both the FCN and SCN. (3) Alterations of nodal characteristics in the FCN and SCN of the patients were concentrated in the subcortical and medial temporal regions, as well as in the default-mode regions; and (4) there was a correlation between the functional and SCNs in both groups of patients and controls, but this correlation was significantly larger in patients.
Interpreting variations in the regional ALFF
ALFF has proven to be a reliable measure of intrinsic or spontaneous brain activity (Zang et al., 2007; Zuo et al., 2010). ALFF partly quantifies resting brain's metabolism, exhibiting highly consistent spatial patterns (Biswal et al., 2010). On the other hand, interindividual differences are thought to be at the basis of human behavior (Kanai and Rees, 2011). Interindividual variability (i.e., across-subject covariance) of ALFF has been associated with that in neural activation and in behavior (Mennes et al., 2010; Wei et al., 2012). In this regard, one can directly use such concurrent fluctuations to describe the distribution of different populations, suggesting a neurophysiological origin for the ALFF (Taylor et al., 2012; Zhang et al., 2011c).
Based on graph theoretical analysis, the present report for the first time mapped the neuroanatomic patterns of the ALFF-based FCN. The covariance of ALFF among different brain regions indicates synchronization in changes of local intrinsic brain activity. Although the precise neurobiological mechanism underlying them remains unclear, it has been posited that brain regions covary as a result of mutually trophic effects (Ferrer et al., 1995) or soft-wiring (Lee et al., 2008) on a functional aspect. Thus, the FCN may offer the possibility of characterizing individuals in terms of global network organization, in addition to the study of local ALFF in relation to brain function and dysfunction.
Large-scale SCN in IGE-GTCS
This study revealed important information about the large-scale SCN organization in patients as compared to healthy controls. In our previous study, we performed univariate mapping of GMV in IGE patients (Huang et al., 2011), while here we specifically investigated the whole-brain pathological interactions. The SCN, which reflects the inter-regionally coordinated structural variances, has been suggested to reveal long-term effects of the brain physiological (Zhang et al., 2011c; Zielinski et al., 2010) or pathological phenomena (Bassett et al., 2008; He et al., 2008, 2009a; Seeley et al., 2009). Moreover, a recent study has found partial convergence between the SCN and ACN measured by diffusion tractography, suggesting that the SCN may partly relate to anatomical connections (Gong et al., 2012). Bernhardt et al. (2009) have studied the thalamocortical networks by correlating thalamic volumes with cortical thickness in patients with GTCS. Specifically, they related the observed alterations of thalamocortical structural correlations to remodeling, following a generalized seizure activity (Bernhardt et al., 2009). Our study employed a graph theory-based network analysis on a relatively larger patient population, and found alterations in both overall and nodal properties of SCN in patients, independent of a prior selection of specific networks. The superior parietal gyrus and opercular part of inferior frontal gyrus showed increased Ei and Si . This might underlie an impairment of the default-mode network in patients (Gotman et al., 2005; McGill et al., 2012; Song et al., 2011; Wang et al., 2011).
Large-scale FCN in IGE-GTCS
By combining graph theoretic analysis with an ALFF-based FCN approach, we provided in this study a novel analysis tool to investigate the pathophysiology of IGE-GTCS. Since the FCN measures covariance of ALFF across subjects, it may capture inter-regional correlations of brain activity within relatively short periods (Zhang et al., 2011c). In our previous study on the FCN, we revealed a novel pattern of brain network organization with an anticorrelated high-level cognitive system and a low-level perceptive system (Zhang et al., 2011c). Here we mapped for the first time the FCN in patients, and we compared it to that in healthy controls. Both subject groups showed small-world topology in the FCN, indicating simultaneous global and local parallel information processing (Bassett and Bullmore, 2006). This finding is consistent with the results revealed by other network approaches, and corroborates the ubiquitous small-worldness property of the human brain (Achard and Bullmore, 2007; Gong et al., 2009; Hagmann et al., 2008; Salvador et al., 2005). Moreover, when we carried out the same in a larger population (Beijing dataset, publicly available in the 1000 Functional Connectomes Project:
The total connection strength (Snet ) in patients was increased in AAL-90 FCN, whereas the same parameter was not altered in SCN. This may suggest a relative stable organization of the brain structural network in patients (Bullmore and Sporns, 2009; Park et al., 2008; Zhang et al., 2011b), which would also be in line with the findings of our previous study (Zhang et al., 2011b).
Correlation between the structural and FCNs
We observed significant spatial correlations between the FCN and SCN in patients and healthy controls, with both low- and high-resolution parcellations. This result confirms that correspondence between the structural and FCNs is a general property of the human brain. A similar correspondence has been also revealed between the ICN estimated by temporal activity correlations and the ACN estimated via WM tractography (Hagmann et al., 2008, 2010; Honey et al., 2009; van den Heuvel et al., 2009). Structural–functional network correlations may indicate a degree of topological isomorphism (Bassett et al., 2008). Anatomic fiber connection has been considered to constrain and be highly predictive of intrinsic functional connections (Honey et al., 2010). Although a little is known about the biological relationships between the FCN and SCN architectures, the FCN-SCN correspondence lends support to the hypothesis that the SCN reflects shared long-term trophic influences within functionally synchronous systems (i.e., FCN) (Zielinski et al., 2010).
Our study demonstrated an increased SCN-FCN correlation in patients, following an opposite trend compared the reduction of ICN-ACN correspondence found in our previous study (Zhang et al., 2011b). It is conceivable that this discrepancy may originate from differences of imaging modalities and computational methods. It is also worth noting that the function–structure relationship mainly depends on the time scale (Honey et al., 2007). Long-term and progressive remodeling of FCN on the SCN architecture may induce increase in the FCN-SCN correlation in epileptic patients. Decreased ICN-ACN correlation, in contrast, may result from impairments of epileptic activity (Zhang et al., 2011b).
Methodological considerations and limitations
Our findings should be evaluated in the light of some methodological aspects. First, we found convergences and divergences between the structure of the FCN and SCN. Divergences may be explained by several factors, such as different epilepsy phenotypes and modalities of connectivity measurement (Gong et al., 2012; Sanabria-Diaz et al., 2010), as well as the different mechanisms underlying functional or structural connectivity changes. Secondly, our analyses were based on weighed networks, which contain information about heterogeneity in the capacity and intensity of connections. Previous studies suggested the use of weighed networks to be a valid approach for brain modeling (Rubinov and Sporns, 2010). Thirdly, there are many other functional descriptors that may be utilized for constructing FCN across populations, as for example, fractional ALFF (Zou et al., 2008). The fractional ALFF having higher specificity can rule out cardiac and respiratory contributions (Zuo et al., 2010). However, we used the ALFF-based FCN in both groups, so that our approach is unlikely to biased by between-group differences related to respiratory and cardiac artifacts. Finally, recent studies have shown significant effects of head motion on ICN (Power et al., 2012; Van Dijk et al., 2012), which were quantified and controlled in our study. The solution of the head motion issue still requires systematic methodological work.
Besides the methodological issues mentioned above, a number of potential limitations should be considered. First, we could not investigate the effects of antiepileptic drugs, which can however affect the normal neuronal function and in some cases produce cognitive impairments (Ortinski and Meador, 2004). Secondly, we did not comprehensively assess the cognitive state of the patients; however, previous studies have suggested that an impaired ICN and ACN architecture was associated with cognitive deficits in chronic epilepsy (Vaessen et al., 2012; Vlooswijk et al., 2011). It therefore remains to be elucidated how altered FCN and SCN are linked to cognitive deficits. Thirdly, we did not evaluate the effects of interictal epileptiform discharges on the brain networks, since no simultaneous EEG data were acquired. Finally, we measured the inter-regional correlations of ALFF and GMV of brain regions across subjects, resulting in a single functional or SCN (at a given cost threshold). Accordingly, we could not directly examine the relationship between the network metrics and individual clinical variables.
Conclusion
We mapped for the first time the ALFF-based FCN of the human brain, indicating ubiquitous topological properties, including small worldness and highly connected core hub regions in a short-duration functional network. Moreover, both overall topologies and nodal characteristics of the large-scale inter-regional FCN and SCN were altered in IGE-GTCS patients, providing additional evidence that IGE-GTCS is a disorder of cortical network organization. Importantly, the correlation between the functional and SCNs was significantly increased in patients. Combined functional and structural measures of connectivity can potentially lead us to a better understanding of the pathophysiological mechanisms of IGE-GTCS.
Footnotes
Acknowledgments
This research was supported by the Natural Science Foundation of China (grant number 81201155, 81271553, 81171328, 30971019, and 81020109022/H1802).
Author Disclosure Statement
No competing financial interests exist.