
Abstract
Though previous examinations of intrinsic resting-state networks (RSNs) in healthy populations have consistently identified several RSNs that represent connectivity patterns evoked by cognitive and sensory tasks, the effects of different analytic approaches on the reliability and reproducibility of these RSNs have yet to be fully explored. Thus, the primary aim of the current study was to investigate the effect of method (independent component analyses [ICA] vs. seed-based analyses) on RSN reproducibility (independent datasets) for ICA and reliability (independent time points) in both methods using functional magnetic resonance imaging. Good to excellent reproducibility was observed in 9 out of 10 commonly identified RSNs, indicating the robustness of these intrinsic fluctuations at the group level. Reliability analyses showed that results were dependent on three main methodological factors: (1) group versus subject-level analyses (group>subject); (2) whether data from different visits were analyzed separately or jointly with ICA (combined>separate ICA); and (3) whether ICA output was used to directly assess reliability or to inform seed-based analyses (seed-based>ICA). These results suggest that variations in the analytic technique have a significant impact on individual reliability measurements, but do not significantly affect the reproducibility or reliability of RSNs at the group level. Further investigation into the effect of the analytic technique on RSN quantification is warranted to increase the utility of RSN analyses in clinical studies.
Introduction
Since Biswal's first manuscript on resting-state functional connectivity (Biswal et al., 1995), a number of recent investigations have used this method to study the human brain. Currently, seed-based correlation and independent component analyses (ICA) are the two most commonly applied techniques to examine resting-state networks [RSNs; (Snyder and Raichle, 2012; Margulies et al., 2010)] during periods of extended rest. With seed-based correlation, the researcher can identify areas of the brain that are functioning together with a pre-defined cortical location; while with the use of ICA, the researcher can identify multiple independent, functionally connected cortical networks. The majority of earlier studies use low-order ICA (Beckmann et al., 2005; Calhoun et al., 2008a; Damoiseaux and Greicius, 2009; De Luca et al., 2006; van de Ven et al., 2004; van den Heuvel et al., 2009) and find ∼10 RSNs. However, the number of RSNs naturally increases with model order of the ICA (Biswal et al., 2010; Kiviniemi et al., 2009). The 10 reliably observed RSNs can be broadly classified into two distinct categories based on whether the correlated network activity is centered in primary and secondary sensory-motor cortical areas (hereafter referred to as sensory-motor RSN) or in association cortices (hereafter referred to as association RSN). Although a number of recent studies have examined the reproducibility and reliability of these networks (Damoiseaux et al., 2006; Guo et al., 2012; Honey et al., 2009; Shehzad et al., 2009; van de Ven et al., 2004; Van Dijk et al., 2010; Zuo et al., 2010a) specific to a method, to date, there has been no direct comparison of the potential impact of two most commonly used analytic approaches (ICA and seed-based analysis) on the reproducibility and reliability of the 10 most commonly observed RSNs.
The four identified sensory-motor RSNs include (1) primary and (2) secondary visual cortical areas, (3) auditory cortical areas, and (4) primary and secondary somatomotor areas. Commonly identified association RSNs include the default mode network (DMN) (Raichle et al., 2001), which can further be subdivided into three subnetworks: (1) anterior (aDMN), (2) posterior cingulate (pcDMN; Broyd et al., 2009; Kim et al., 2009; Mannell et al., 2010; Uddin et al., 2009), and (3) posterior precuneus (ppDMN) networks (Zuo et al., 2010b). Additional association networks consist of the (4) left and (5) right lateral frontoparietal networks, which include areas in the middle temporal gyrus (BA 21), posterior cingulate (BA 23/31), superior parietal (BA 7,40), and the middle and orbital frontal (BA 6,9,10; Damoiseaux et al., 2006). Although the frontoparietal networks are involved in a multitude of cognitions, the left is putatively more involved in production processes; whereas the right is more involved in monitoring processes (Cabeza et al., 2003). Finally, an association network that includes the medial (supplementary motor area), superior frontal, and anterior cingulate gyri has been referred to as the (6) executive control network (Seeley et al., 2007).
The few studies that have examined the statistical properties (i.e., reproducibility and reliability both within and between subjects) of these RSNs (Biswal et al., 2010; Damoiseaux et al., 2006; Guo et al., 2012; Honey et al., 2009; Shehzad et al., 2009; van de Ven et al., 2004; Van Dijk et al., 2010; Zuo et al., 2010b) have reported mixed results. These mixed results are likely influenced by how RSNs were identified (e.g., ICA or seed-based analyses), the methods used to quantify reproducibility and reliability, and whether reliability was assessed at the individual subject or group level (Biswal et al., 2010). Shehzad and colleagues (2009) used three different sets of seed regions from previously published work to assess the intra- (1 h apart), inter- (>5 months apart), and multi-scan (all three time points) reliability of resting-state functional connectivity analyses. Findings indicated a wide range of test–retest reliability between pairs of regions during rest, which was dependent on the statistical significance of relationships between regions. Guo and colleagues (2012) directly compared their results with Shehzad's publication. In their study, the reliability of the salience and DMN's within a variety of metrics was calculated. Using a healthy elderly population (age >60), each subject performed a resting state scan twice, roughly a year apart. Findings show that the use of graph theoretical methods and group ICA yielded the highest reliability within the two networks analyzed. They also observed that motion has a major negative impact on reliability, especially on methods dependent on correlation between regions of interest. Van de Ven and colleagues (2004) used spatial ICA to examine both inter-subject reproducibility and intra-subject reliability of RSNs and reported a high degree of consistency across subjects and moderate reliability of eight RSNs (four sensory-motor and four association) within subjects (Pearson's r [0.45–0.79]). Van Dijk and colleagues (2010) reported good within-subject (n=48) reliability in two association networks (Pearson's r=0.63 and 0.67); while Honey and colleagues (2009), using seed-based correlations derived from high- and low-resolution brain parcellation, reported low to moderate individual reliability (Pearson's r [0.38–0.69]) within and between scanning sessions for five subjects.
Previous work directly comparing seed-based analysis and ICA suggests that they yield similar maps for the primary DMN network, although results were more variable for secondary sub-networks (i.e., medial-temporal lobes) and in comparisons of healthy and clinical populations (Mannell et al., 2010). Though Van Dijk and colleagues (2010) reported a high degree of consistency between methods in the identification of four RSNs, a quantification of these similarities was not provided. For exploratory investigations into the nature and structure of the human brain at rest, seed-based analyses are at a disadvantage, as they require some form of a priori knowledge. In addition, placing the seed in slightly different regions can result in very different outcomes (Cole et al., 2010). Conversely, though ICA has the benefit of being a data-driven technique, it is known that iterative ICA algorithms produce a slightly different solution set (i.e., components) for each iteration (Himberg et al., 2004). Another technique that is gaining strength to study RSNs consists of a spatiotemporal regression method, also known as dual regression (Filippini et al., 2009; Zuo et al., 2010b). This method consists of using pre-defined brain networks to estimate the subject-specific network map, and can be considered a hybrid method between seed-based correlation and ICA.
A critical methodological consideration when utilizing ICA to characterize reliability is how to treat within-subject datasets from multiple time points. Traditional reliability analyses treat data from each time point separately (i.e., independently); however, clinical studies using ICA to investigate between-group differences often combine the group datasets into a single group ICA (e.g., healthy controls and patients with schizophrenia (Calhoun et al., 2008b; Kim et al., 2009), which has also been implemented in a probabilistic independent component analysis reliability framework in a sample of healthy participants (Damoiseaux et al., 2006). The combination of datasets across sessions or subject groups facilitates ICA analyses by guaranteeing that matching components are generated for both time points/groups, which likely increases the reliability of findings. However, to date, no studies have specifically examined the effects of single-versus multiple-session ICA approaches on the metrics of reliability and reproducibility.
Given the wide range of reproducibility and reliability estimates reported in the literature, the current study had two primary aims. The first aim was to examine the reproducibility of sensory-motor and association RSNs across two independent samples collected from the same scanner and using identical imaging parameters while using ICA. The second aim was to determine the reliability of RSNs within the same sample across time (3–5 months apart) using two different ICA approaches for the initial identification of RSNs, and comparing these approaches with a seed-based technique. Finally, we examined the effects of conducting separate (data from time 1 and time 2 treated independently) or combined (data combined across visits) ICAs on RSN reliability.
Materials and Methods
Participants
A total of 50 healthy participants were enrolled in two separate studies investigating RSNs. Study 1 (hereafter referred to as model dataset) comprised 30 adult volunteers (21 men; mean age=31.83±10.72 [standard deviation, SD]) and performed one resting-state scan. Study 2 (hereafter referred to as the testing dataset) included a different pool of 20 adult volunteers who were recruited to perform two separate functional magnetic resonance imaging (fMRI) scans. One participant from the test dataset was identified as an outlier (3 SD) on several movement parameters during the resting-state run and was excluded from all further analyses (Mayer et al., 2007). In addition, no statistically significant difference in frame-wise displacement (Wylie et al., 2013) was found between visits one and two in the test dataset. All the remaining 19 subjects (10 men; mean age=28.95±10.02) returned for a second visit to perform an FMRI scan (average number of days post visit 1=114.47±12.19). None of the participants from either study were taking psychoactive medications or had a history of neurological, psychiatric, or recent substance abuse disorders. Informed consent was obtained from all subjects according to institutional guidelines at the University of New Mexico.
Image acquisition and task
Identical imaging parameters were used in both datasets (model and test). High-resolution T1 anatomic images were collected on a 3 T Siemens Trio scanner with a 5-echo multi-echo MPRAGE sequence (echo time [TE]=1.64, 3.5, 5.36, 7.22, 9.08 msec, repetition time [TR]=2.53 sec, inversion time=1.2 sec, 7° flip angle, number of excitations=1, slice thickness=1 mm, field of view [FOV]=256×256 mm, voxel resolution=1×1×1 mm]. A single 5 min resting-state run was completed by each participant, and 150 echo-planar images were collected using a single-shot, gradient-echo echoplanar pulse sequence [TR=2000 msec; TE=29 msec; flip angle=75°; FOV=240 mm; matrix size=64×64]. Thirty-three contiguous, axial 4.55-mm thick slices were selected to provide whole-brain coverage (voxel size: 3.75×3.75×4.55 mm). In addition to two dummy scans, the first image of each run was also eliminated to account for T1 equilibrium effects, leaving a total of 149 images for the final analyses.
Subjects passively stared at a foveally presented fixation cross (visual angle=1.02°) and were requested to keep their eyes open to diminish the likelihood of falling asleep and to avoid the electrophysiological spectrum changes (i.e., increased alpha waves) associated with closed eyes (Laufs et al., 2003). Subjects were also instructed to keep head movement to a minimum throughout the duration of the scan.
Image processing
Functional images were generated and processed using a mixture of freeware and commercial packages, including the Analysis of Functional NeuroImages (Cox, 1996), Group ICA of FMRI Toolbox [GIFT, (Calhoun et al., 2001),
For the seed-based analysis, individual subject's anatomical images (i.e., T1) were segmented into maps of white matter, gray matter, and cerebral spinal fluid (CSF), with the resultant CSF and white matter masks used to obtain an average time series for these tissues. The six movement parameters and averaged time series for white matter and CSF were then entered into a linear regression against the extended resting-state time series to remove the variance associated with each of these variables [for review see Fox et al. (2005)]. Global temporal values were not used as a regressor, as it has been shown that they artificially create a negative correlation between brain regions (Murphy et al., 2009).
RSN selection: model dataset
ICA, using the Infomax algorithm (Bell and Sejnowski, 1997), was conducted to generate 36 components from the resting-state run in the model dataset based on minimum description length criteria (Li et al., 2007). Data were intensity normalized (removing the mean and setting the standard deviation equal to zero for each voxel), and individual subject components were back reconstructed from the group components using the group ICA-3 (GICA3) method (Erhardt et al., 2010). This back-reconstruction method uses information retained in the principal component analysis step to estimate the subject-specific component spatial map and time course, where the group component is exactly the sum of the subject-level components. In comparison, spatiotemporal regression (Biswal et al., 2010; Filippini et al., 2009) uses only the spatial map from the group ICA to estimate the subject-specific component. The resultant 36 components were then independently inspected by two raters (A.R.F. and A.R.M.), with each selecting the 10 sensory-motor and association RSNs of interest with 100% inter-rater reliability (Fig. 1A). These network maps are referred to as ICA-based template map. Cluster quality index (iq ; ICASSO; 20 iterations) were used to provide an index of the statistical reliability of the independent components across different iterations using initial random conditions (Himberg et al., 2004).
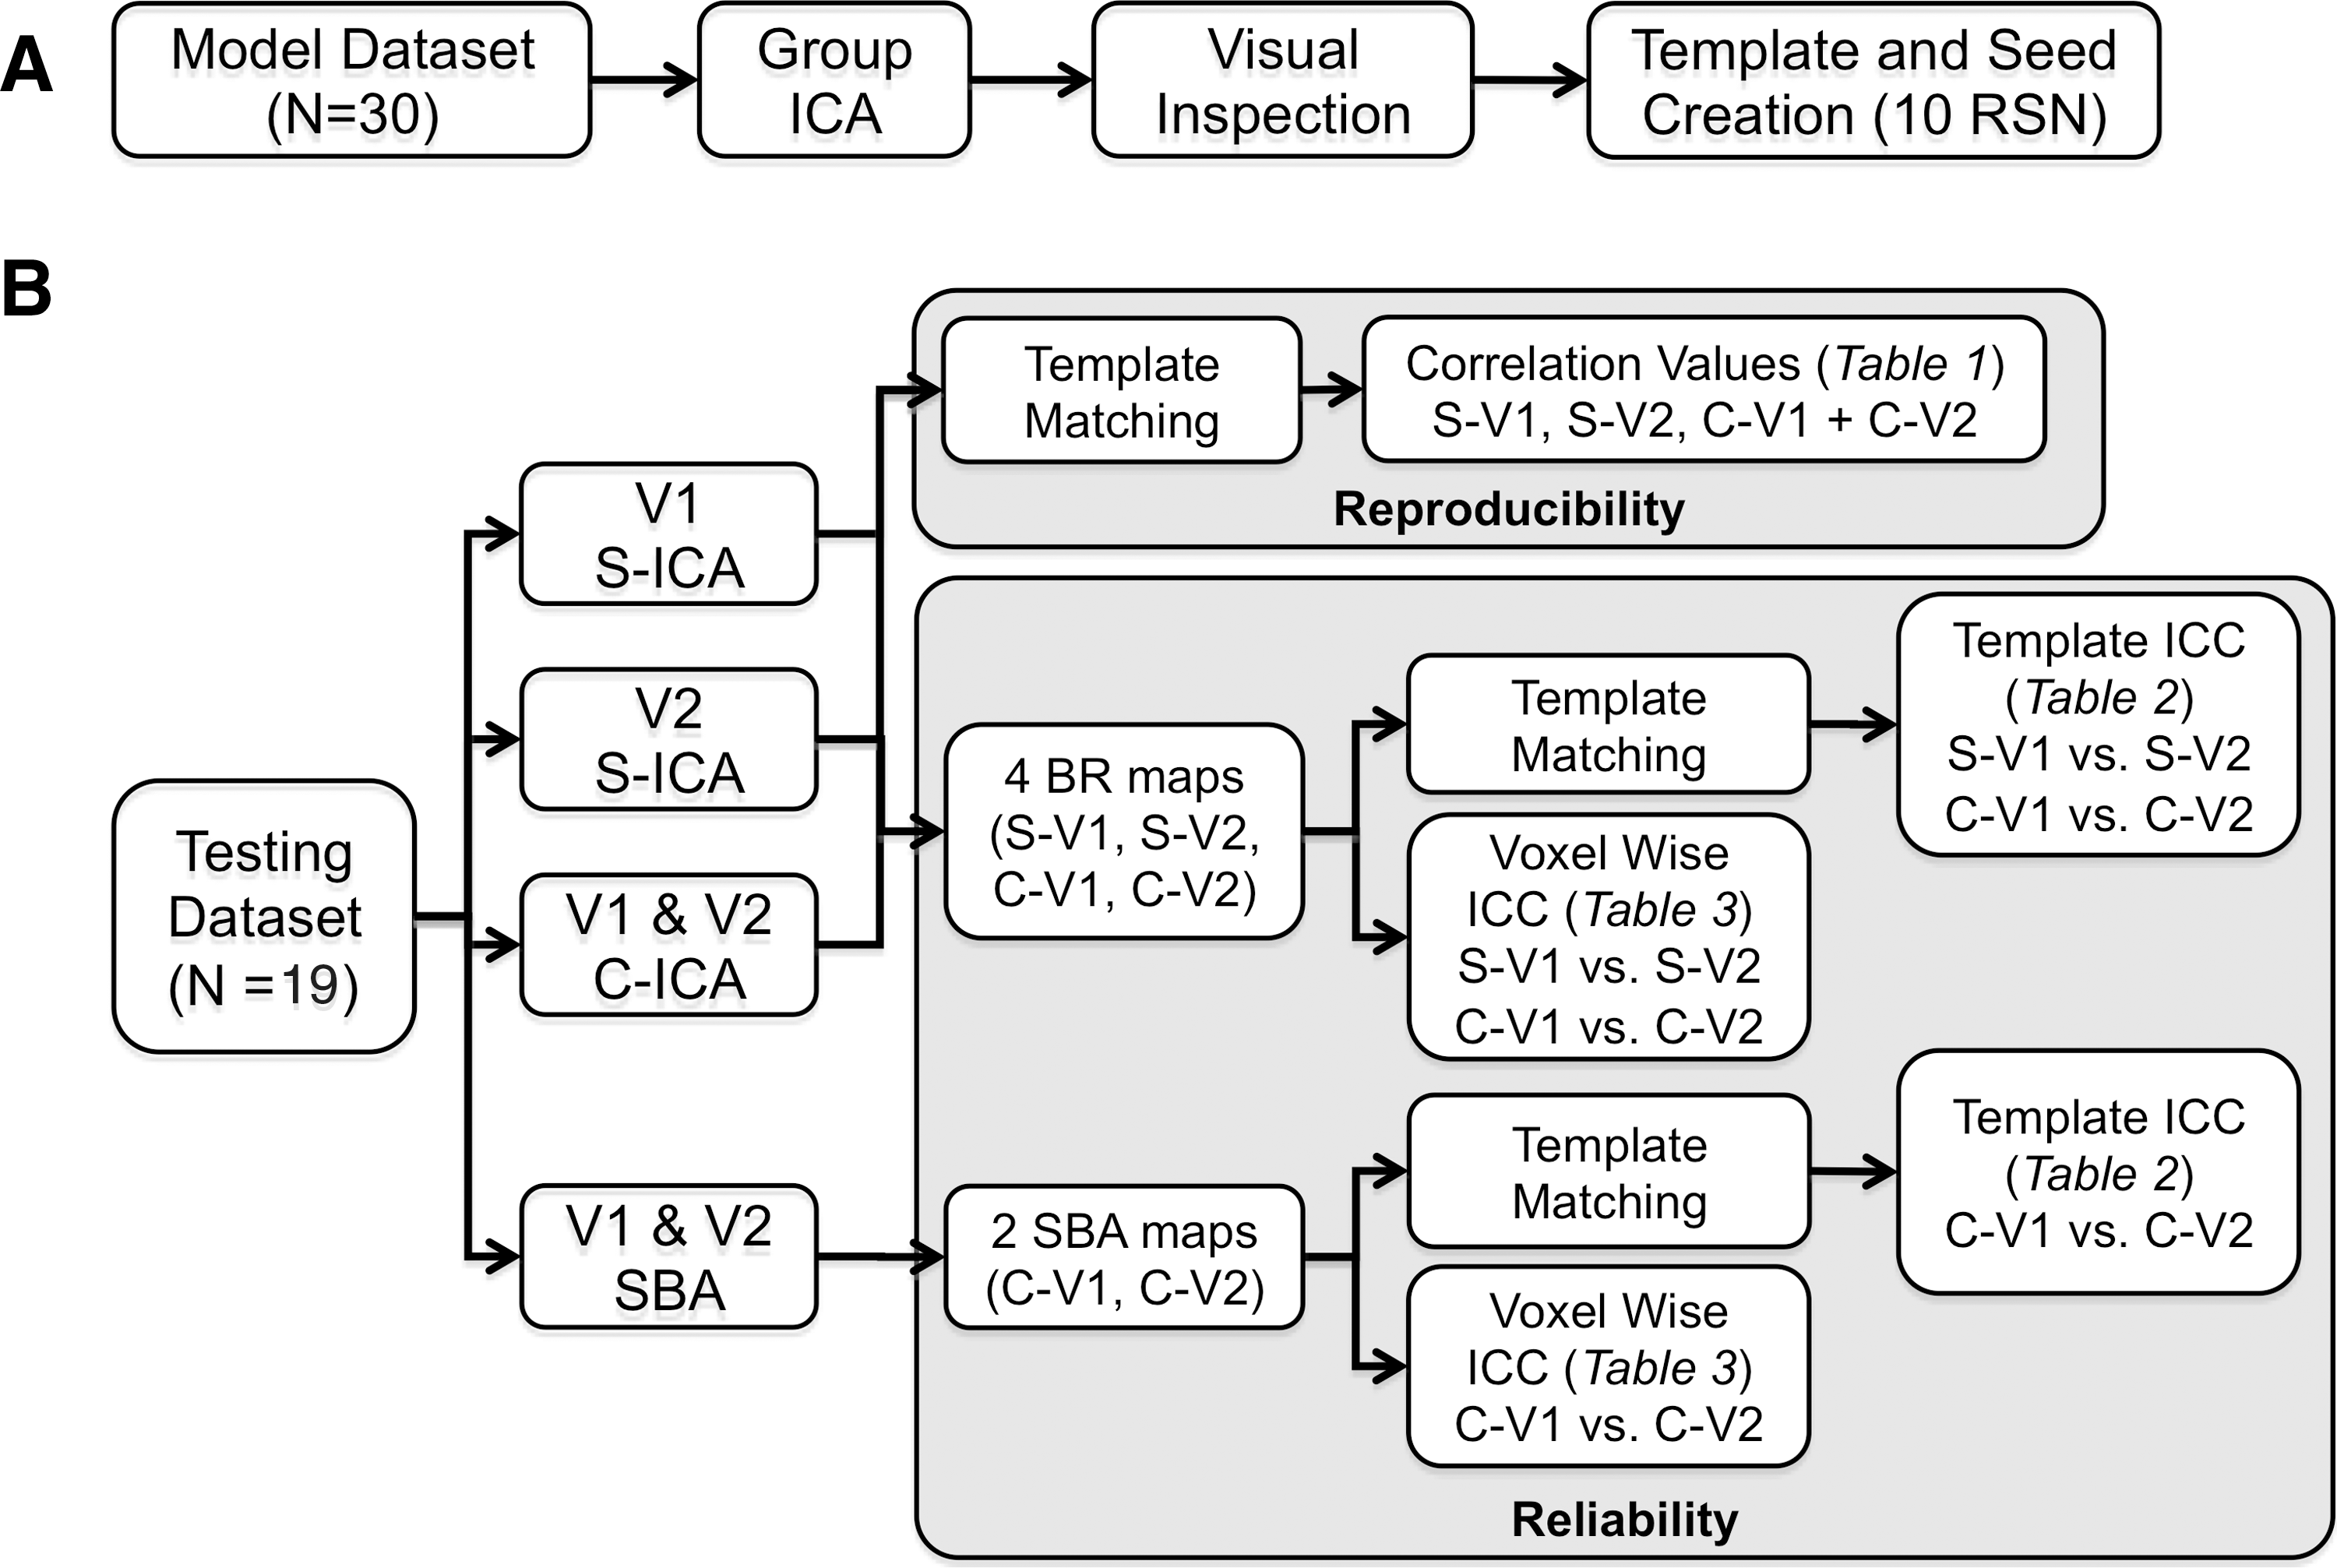
Pictorial representation of the analyses performed on the model
Seed-based analyses for functional connectivity (Biswal et al., 1995; Fox et al., 2005) were performed based on the 10 RSN selected by the raters of the ICA of the model dataset. Specifically, each network seed was derived by thresholding the group ICA results from the model dataset for voxels exhibiting a p-value<10−12. Location and shape of seeds can be seen in yellow in the model dataset maps of Figures 2 and 3, while coordinates and volumes are described in Supplementary Table S1 (Supplementary Data are available online at
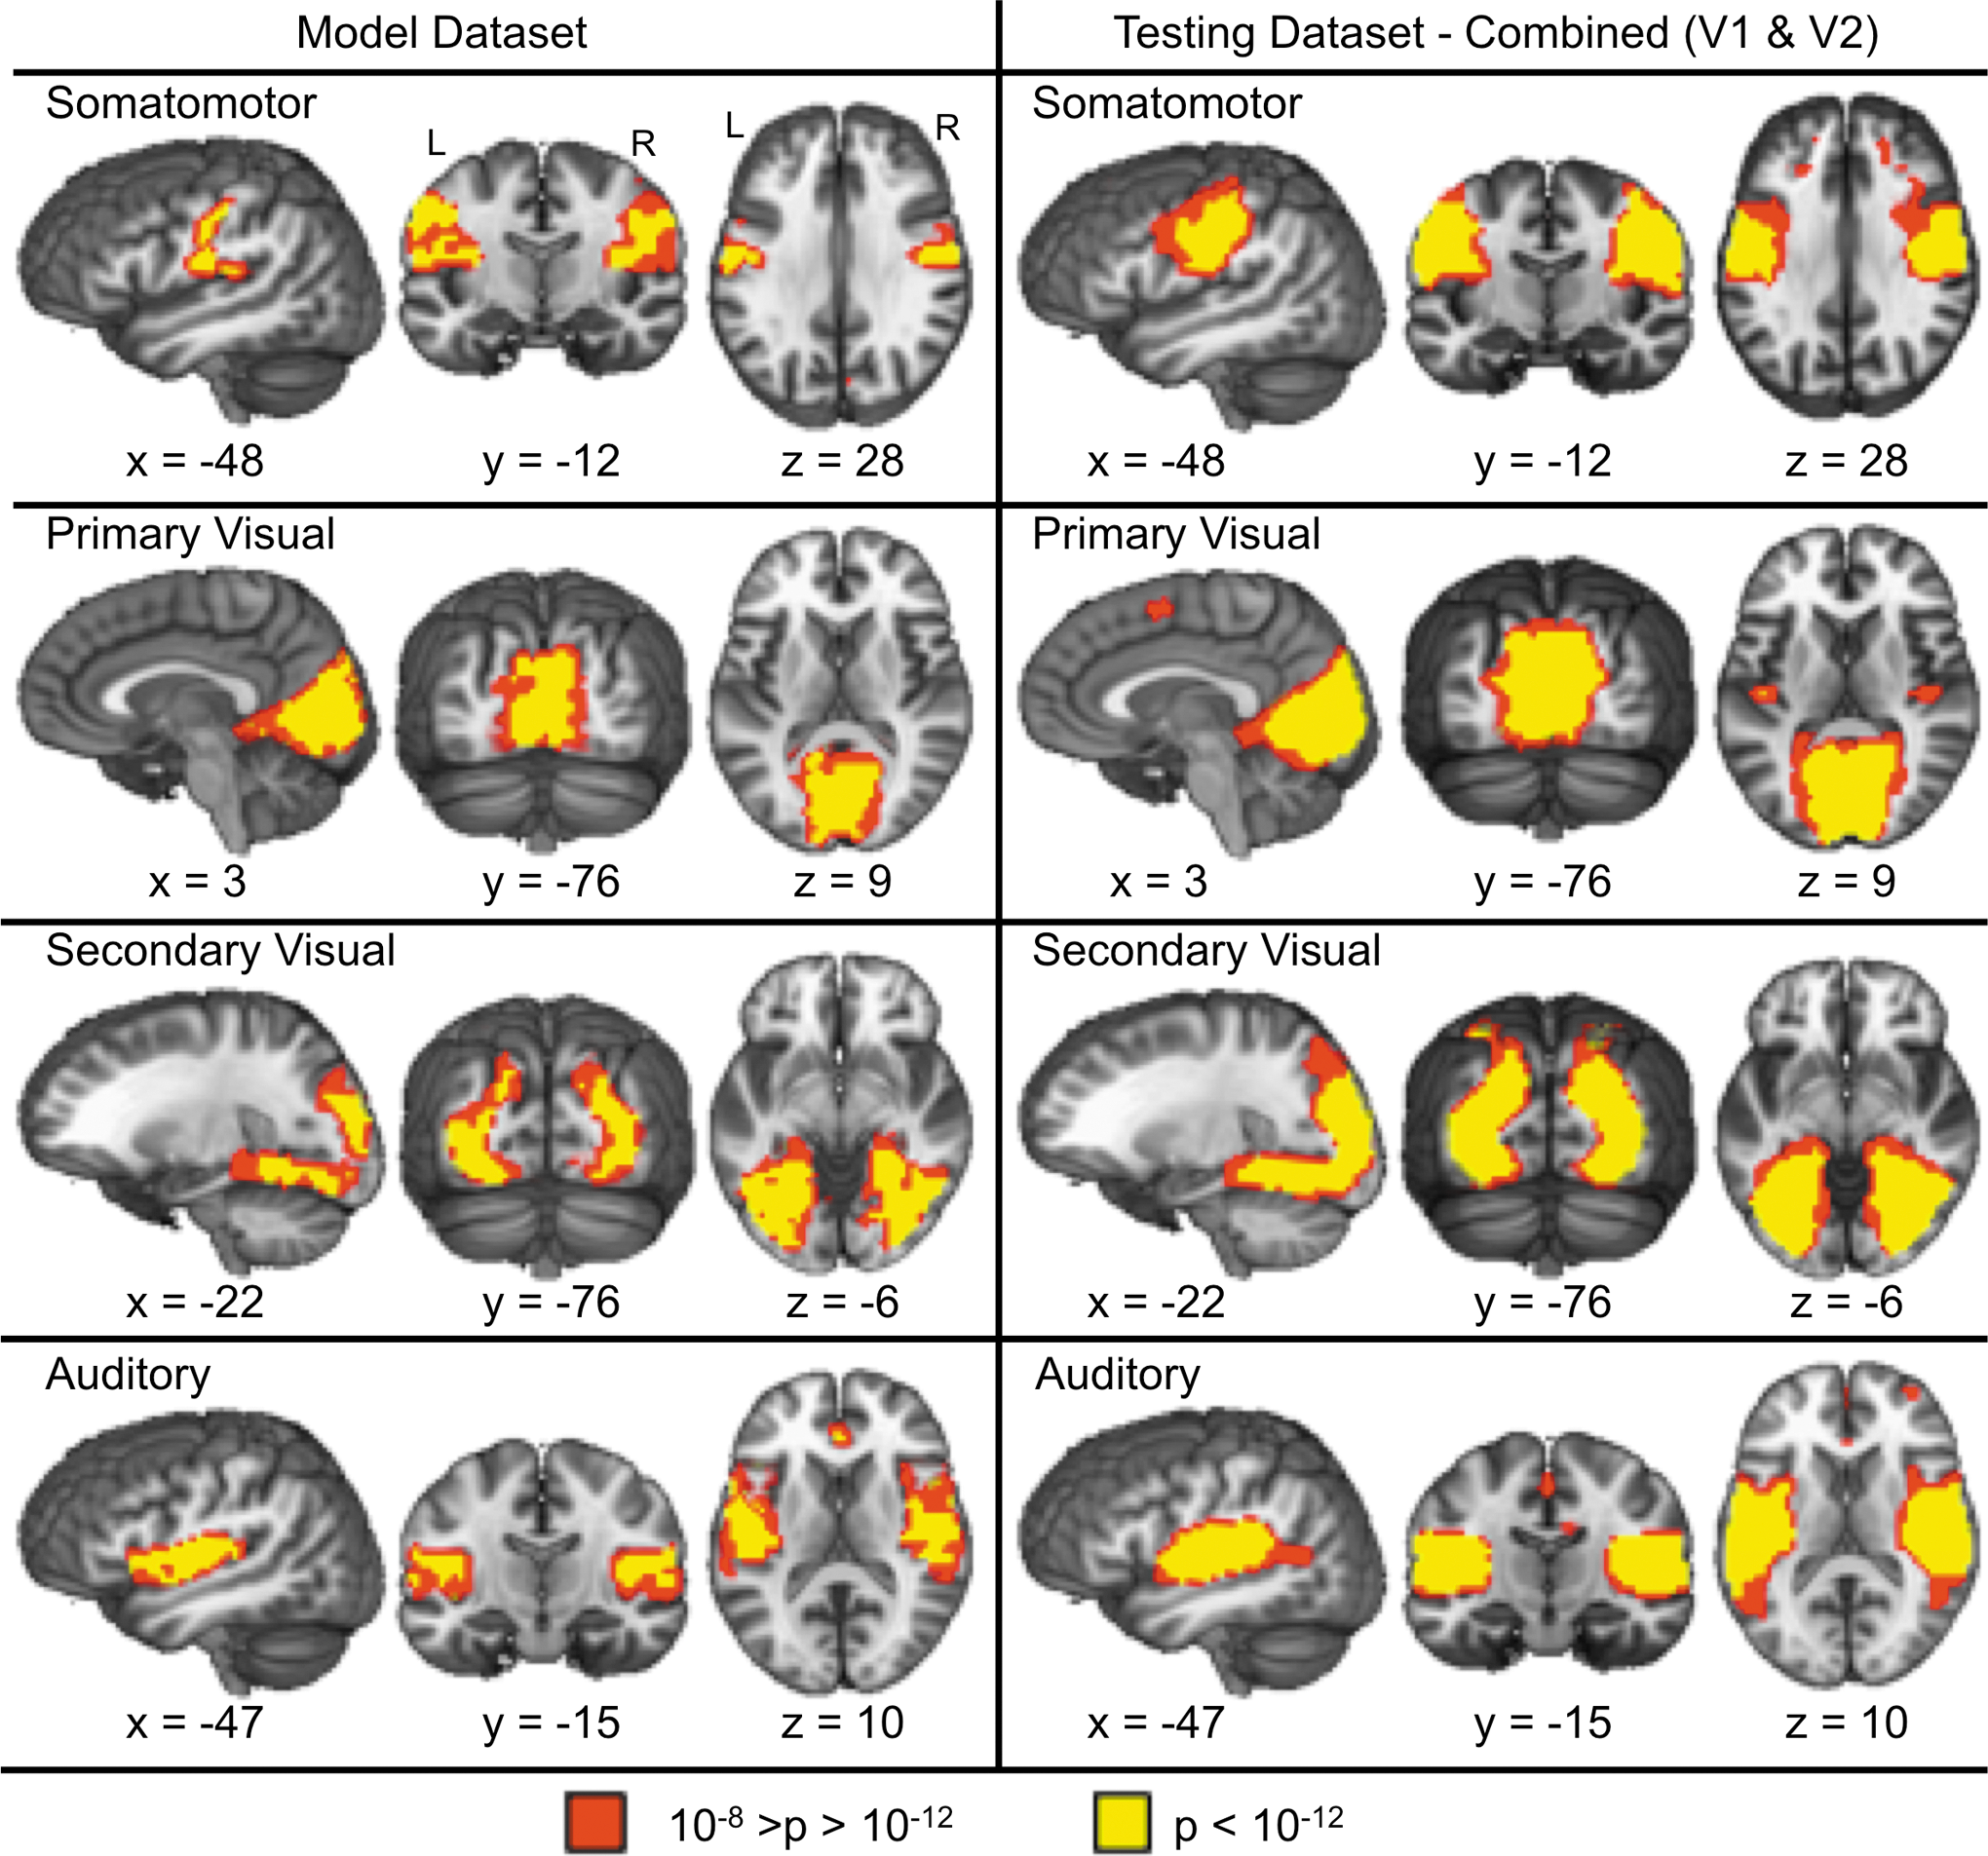
Presents the four sensory-motor RSNs identified in the model dataset (left panel) along with the corresponding RSNs from combining both visits (V1 and V2) from the testing dataset (right panel). Red indicates areas within the RSNs with a p-value between 10−12<p<10−8, while yellow indicates a p<10−12. All x, y, and z coordinates are given according to the Talairach atlas.
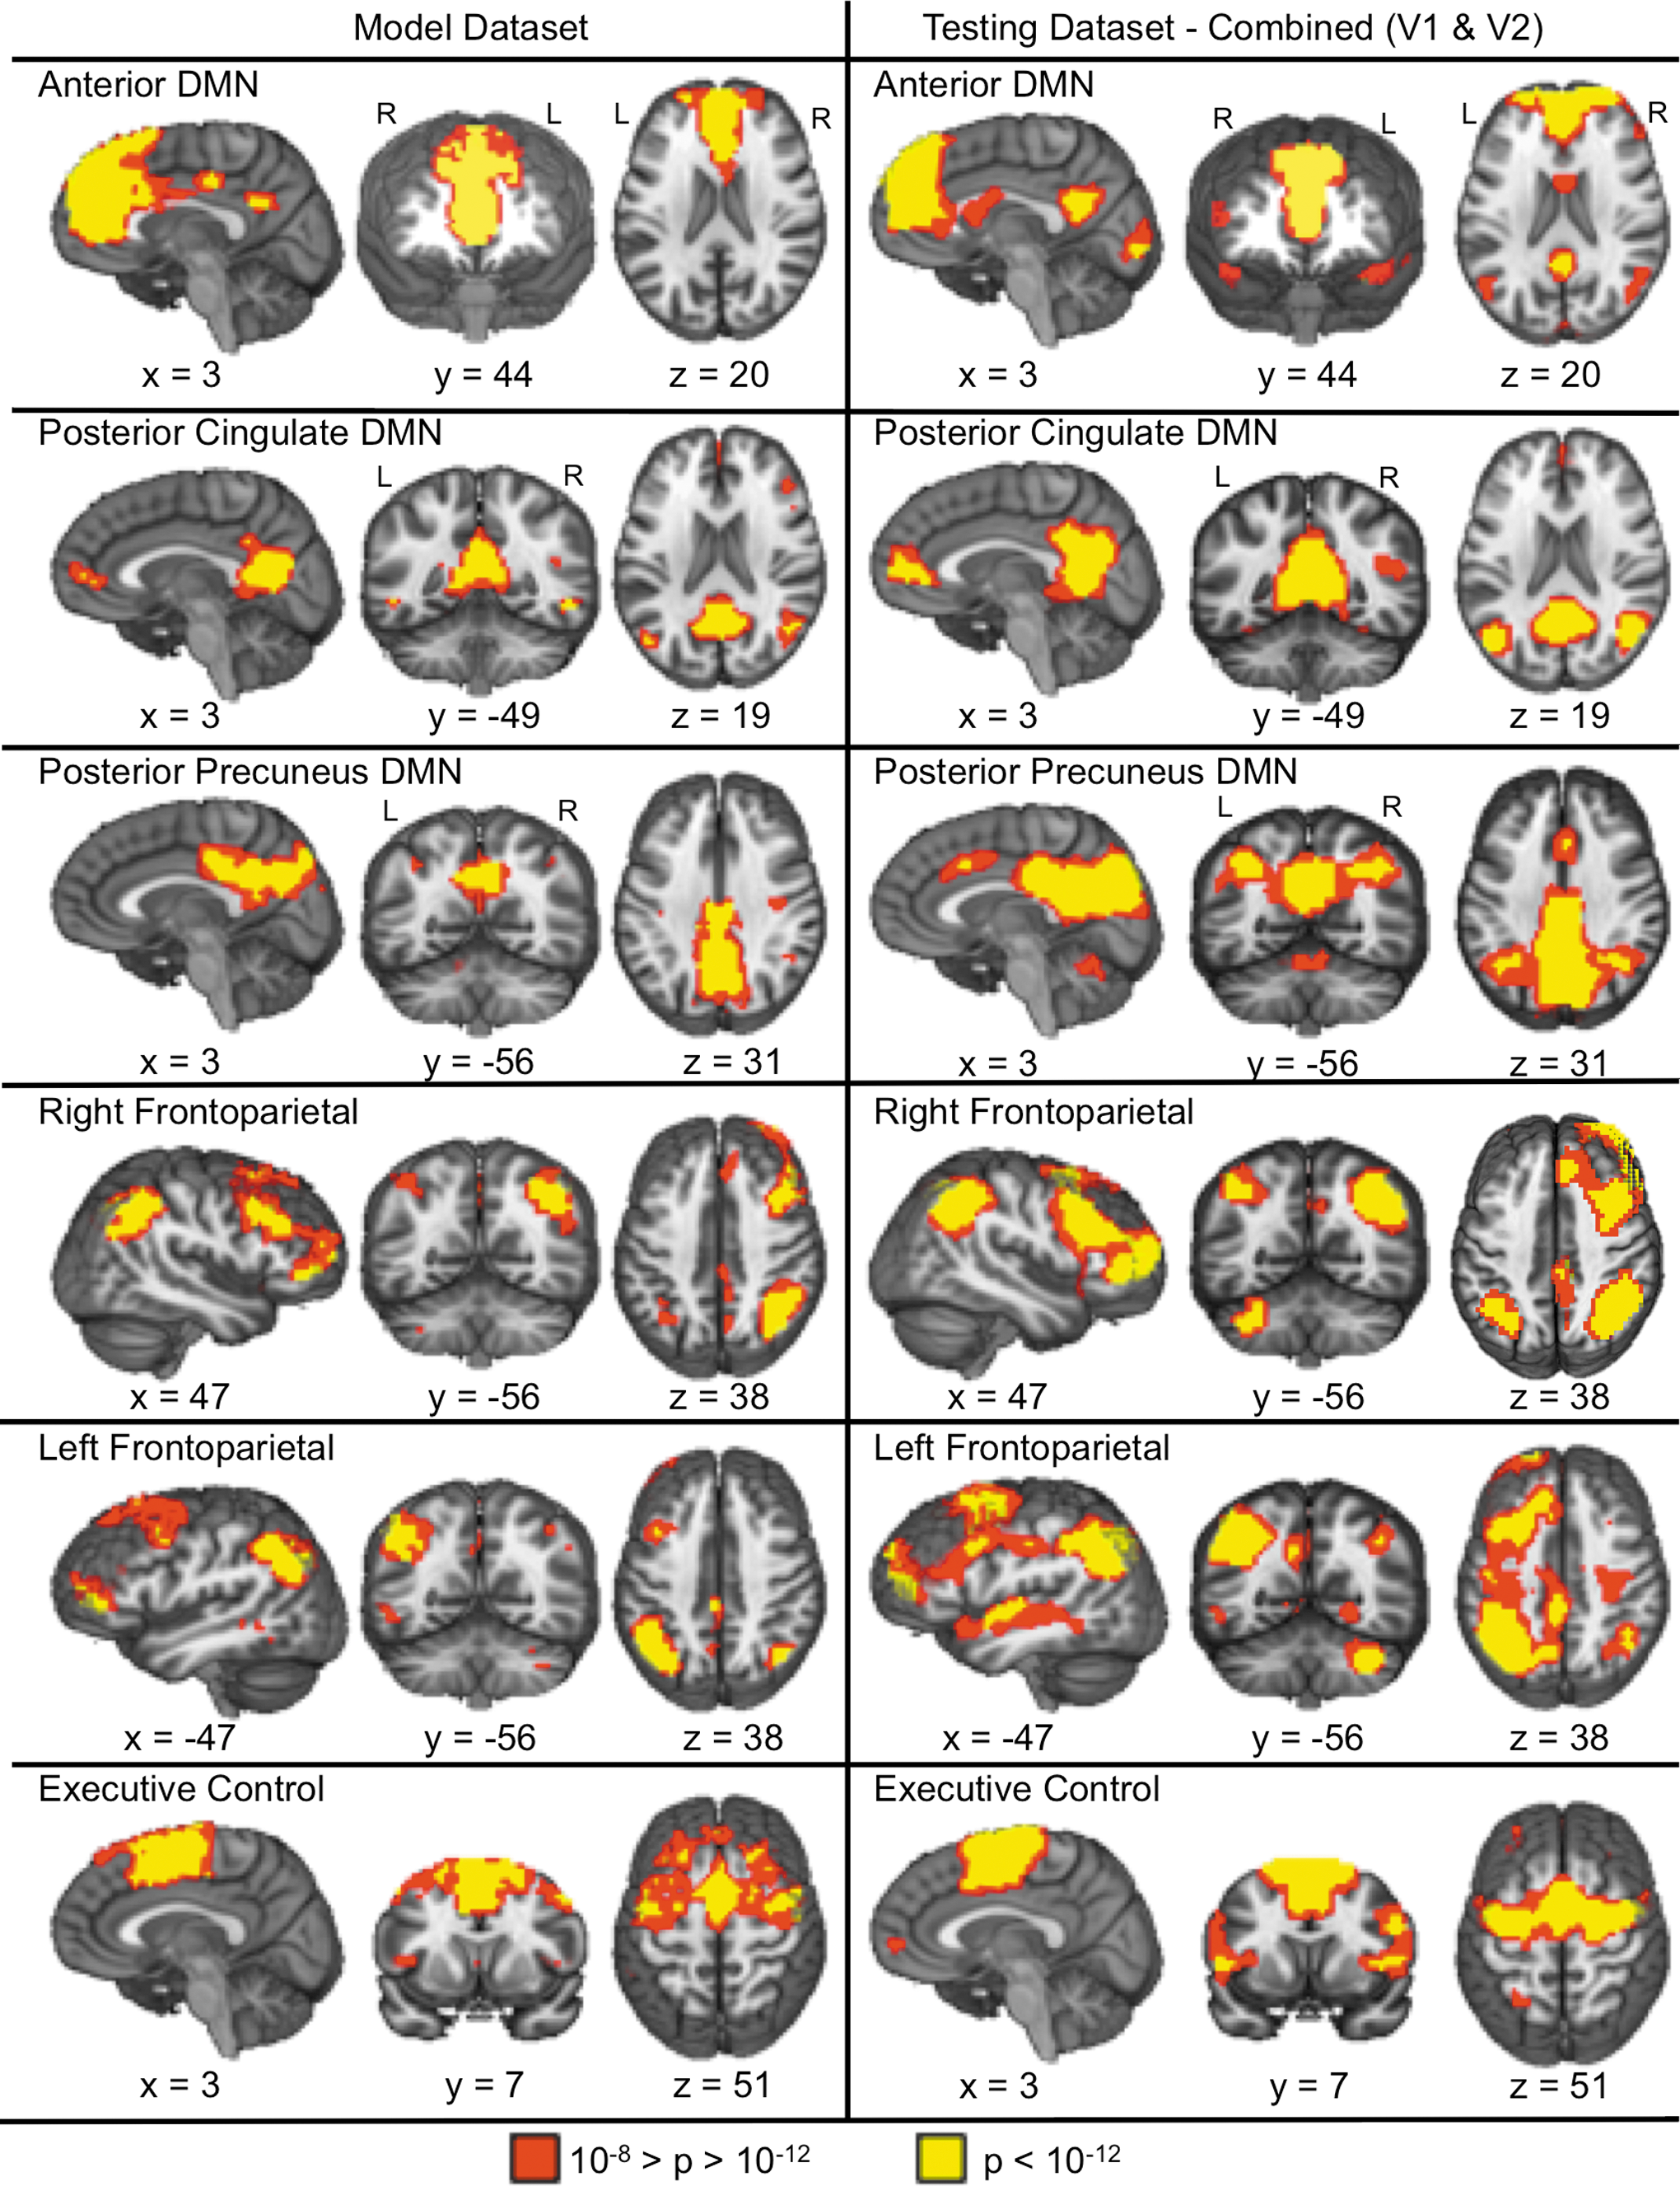
Depicts the six association RSNs identified in the model (left panel) and testing (right panel; combined ICA) datasets. Color representations are identical to those presented in Figure 2. All x, y, and z coordinates are given according to the Talairach atlas.
Group ICA of testing datasets
Two different ICA approaches were employed to calculate the group-independent components for the testing dataset (Fig. 1B). In the first approach, a separate group ICA was performed for each time point (i.e., visit 1 and visit 2). In the second approach, a single group ICA was performed on data from both time points (i.e., combining visit 1 and visit 2 data). Both ICA approaches were restricted to 36 components to maximize consistency with the model dataset and to permit a direct comparison of the reliability of resultant components. For both approaches, a spatial template matching procedure was performed. This consisted of creating a vector with all the brain voxels from each spatial component map; whereas a correlation matrix was then constructed from these vectors. The cells of the correlation matrix were calculated by correlating the group component vectors from the testing dataset with the selected component vectors (RSNs) from the model dataset. Due to the preprocessing of these data before ICA (pre-whitening), the directionality of the component is lost; therefore, the component with the highest positive or negative (absolute) correlation value from the testing dataset was selected as the best match for each RSN from the model dataset. The magnitude of the spatial template matching (correlation) between the model and testing datasets was used as an estimate of reproducibility.
Intraclass correlation coefficients (ICCs) were calculated at the group level for the separate ICA only, as the combined ICA provided only a single group component. To determine the reliability of these group RSN components, a 10×2 (RSN×visit) matrix was created to calculate the ICCs using standard equations (Shrout and Fleiss, 1979) (model 1,1):
where the between-component mean square (BMS) and the within-component mean square (WMS) were calculated for each correlation, and the number of visits (k) was defined as 2. For the purposes of discussion, we adopted a set of nominal values (poor=[−1.0 to 0.20], fair=[0.21–0.40], moderate=[0.41–0.60], good=[0.61–0.80], and excellent=[0.81–1.00]) for both the ICC and template matching (i.e., spatial correlation) that are similar to those utilized for the kappa statistic (Landis and Koch, 2011).
For all group ICA analyses (model and testing datasets), voxel-wise t-tests were performed on the subject's back-reconstructed component maps. Voxels were thresholded at a high p-value (p<10−8, with an additional spatial threshold of six voxels in the acquired space) to facilitate communication of results (e.g., Figs. 2 and 3).
Reliability analyses for individual subject data
A similar analysis was conducted to determine the reliability of individual subject RSNs. Specifically, each subject's back-reconstructed component (derived with GIFT GICA-3) from each RSN of the test datasets were spatially template matched with the ICA-based template map for each RSN. Correlations were then r-to-z transformed using Fisher's method. For the separate and combined ICA approaches, ICCs for visits 1 and 2 were calculated for each RSN using the method described earlier, where subjects were rows (n=19) and time was the two columns in the matrix.
Seed-based analyses for the test dataset were performed to further investigate reliability at the individual subject level. Seeds used to perform the functional connectivity analysis were based on the 10 seeds defined from the model dataset (Figs. 2 and 3). Functional connectivity maps were generated for each subject in both visits, and the r-values for each voxel were then r-to-z transformed using Fisher's method. The resultant maps were spatially correlated with the seed-based template map, then r-to-z transformed, and then, the ICC was calculated for each RSN based on these values.
Voxel-wise analyses of testing dataset
For every brain voxel, ICCs were also calculated for each of the 10 RSNs (testing dataset) for each of the three different methods described earlier (i.e., separate and combined ICA approach, or seed-based analyses). Voxel-wise ICCs were then multiplied by respective RSN masks (thresholded at p<10−8) from the model dataset, and histograms were constructed for voxels both within and outside of the RSN, normalizing the total number of voxels in the respective masks. For example, voxel-wise estimates for the sensory-motor RSN (testing dataset) were multiplied by a binary mask of the sensory-motor RSN (model dataset) and its inverse, resulting in separate reliability histograms for voxels within the sensory-motor RSN and outside of the sensory-motor RSN. Next, the median reliability values for each histogram were estimated and compared across the three methods by using two paired t-tests (Separate ICA vs. Combined ICA and Combined ICA vs. Seed) for values within and outside the RSN.
Results
RSNs from model dataset
ICA of resting-state functional connectivity from the model dataset revealed four sensory-motor and six association RSNs that were identified by two raters with 100% inter-rater agreement. The sensory-motor RSNs are shown in Figure 2, and included the bilateral somatomotor network, bilateral primary visual cortex, bilateral secondary visual cortex, and bilateral auditory cortex.
The association RSNs are presented in Figure 3. The aDMN was associated with large volumes of coherent connectivity in the midline anterior cingulate cortex and dorsomedial prefrontal cortex, with relatively smaller clusters of connectivity in the posterior cingulate cortex. This pattern of connectivity was reversed for the pcDMN, with relatively large clusters of activation within the posterior midline coupled with smaller anterior midline clusters and clusters within the parahippocampal gyrus. A large cluster that contains the posterior cingulate, precuneus, and cuneus is shown for the ppDMN. Other association RSNs included the executive control (medial and lateral prefrontal cortex), and the right and left fronto-parietal networks. A detailed description of the individual regions comprising each of the networks is reported in Supplementary Table S1. Supplementary Figures S1–S16 exhibit all component maps generated from the model and testing datasets.
Reproducibility of RSNs of group ICA results
The test dataset produced sensory-motor (Fig. 2) and association (Fig. 3) RSNs that exhibited moderate to excellent spatial correlations with the RSNs derived from the model dataset using both separate (visit one, all r within [0.41–0.90]; visit 2, all r within [0.70–0.97]) and combined (all r within [0.67–0.97]) ICA approaches. Table 1 provides the maximal and second highest absolute spatial correlation for each RSN. There was a negative relationship between the maximal correlation and the second highest correlation for visit 1 (Spearman's rho=−0.79, p<0.05) and visit 2 (Spearman's rho=−0.86, p<0.05) and the combined (Spearman's rho=−0.90, p<0.05) data, suggesting that the more reproducible RSNs had more spatially distinct patterns of connectivity among all of the components compared with less reproducible RSNs.
Reproducibility of Independent Component Analyses Shown by Template Matching (Correlation Values)
Correlation values of the two components from the testing dataset (visit 1, visit 2 and combining visits 1 and 2) that exhibit the highest correlation with the selected RSNs from the model dataset are shown.
In the visit 1 testing dataset, the same component had the highest spatial correlation with the primary visual and posterior cingulate DMN networks of the model dataset.
ICA, independent component analyses; RSNs, resting state networks; DMN, default mode network.
Stability and reliability analyses of group ICA results
ICASSO results (Table 2) indicated that all RSN components displayed a high iq regardless of whether the ICA was done separately for visit 1 (iq ranging from 0.85 to 0.98) and visit 2 (iq range from 0.97 to 0.98), or combined across both time points (iq =0.97–0.98). Although the ICC comparing the spatial correlation between the ICA-based template maps and testing RSNs (i.e., group components) from visits one and two (separate ICA only) was only fair (ICC=0.37), the spatial correlation of the pDMN appeared to be an outlier (data more then 3 SD from the mean). Once this component was excluded, the ICC value became excellent (ICC=0.81).
Intraclass Correlations Following Template Matching with Model Dataset and ICASSO Measurements for Each Resting-State Network
ICC template matching reliability (ICA-based template map) and iq results are displayed for the separate (visit 1 and visit 2) and combined ICA approaches. ICC template matching reliability (seed-based template map) results of seed-based analyses with model dataset for each RSN are shown in the last column.
 For visit 1, the posterior cingulate DMN component was not identified.
ICC, intraclass correlation coefficients.
Reliability analyses of individual subject RSNs
In contrast to the group results, reliability among individual subjects was found to be much less robust for both template matching and voxel-wise results. In terms of template matching (i.e., spatial correlation between back-reconstructed individual subject RSN and ICA-based template maps), the results of the separate and combined ICA were similar only for the somatomotor component (separate ICA: ICC=0.34, combined ICA: ICC=0.38), indicating only fair reliability (Table 2). Reliability of the primary (ICC=0.22) and secondary (ICC=0.21) visual RSN was only fair when the group ICA was combined across time points. Both methods resulted in ICCs below 0.14 for the remainder of RSNs, although reliability for the separate ICA approach was notably poorer. Average template matching scores for each network are reported in Supplementary Table S2. No significant correlation was observed between template matching scores and frame-wise displacement for each visit and each RSN.
When seed-based analyses were utilized for identifying individual subject RSNs (Table 2), template-matching reliability with the seed-based template map was good for the executive control (ICC=0.71) and moderate for the right frontoparietal (ICC=0.51). Reliability was fair for the posterior cingulate DMN (ICC–0.24). The ICCs of the remaining seven RSNs were below 0.20 (poor). Similar to ICA, no significant correlation was observed between motion parameters and template matching scores.
Voxel-wise reliability analyses of individual subject RSNs
Two sets of paired t-tests were performed (Separate ICA vs. Combined ICA and Combined ICA vs. Seed) to compare the within-mask median histogram values (Figs. 4 and 5; Table 3) across the 10 RSNs. Results indicated that the reliability was significantly higher (t 9=−3.51, p<0.01) for the combined ICA (mean=0.40±0.06) approach compared with the separated ICA (mean=0.04±0.35). However, there were no significant differences between the seed-based approach (mean=0.41±0.09) and the combined ICA method.

Histograms representing the reliability values for each method within the four sensory-motor RSNs (dashed black line=seed-based combined ICA, gray line=separate ICA, and solid black line=combined ICA). Voxel-wise ICCs are presented along the x-axis, whereas the y-axis represents the percentage of voxels within each RSN with the specific ICC value.
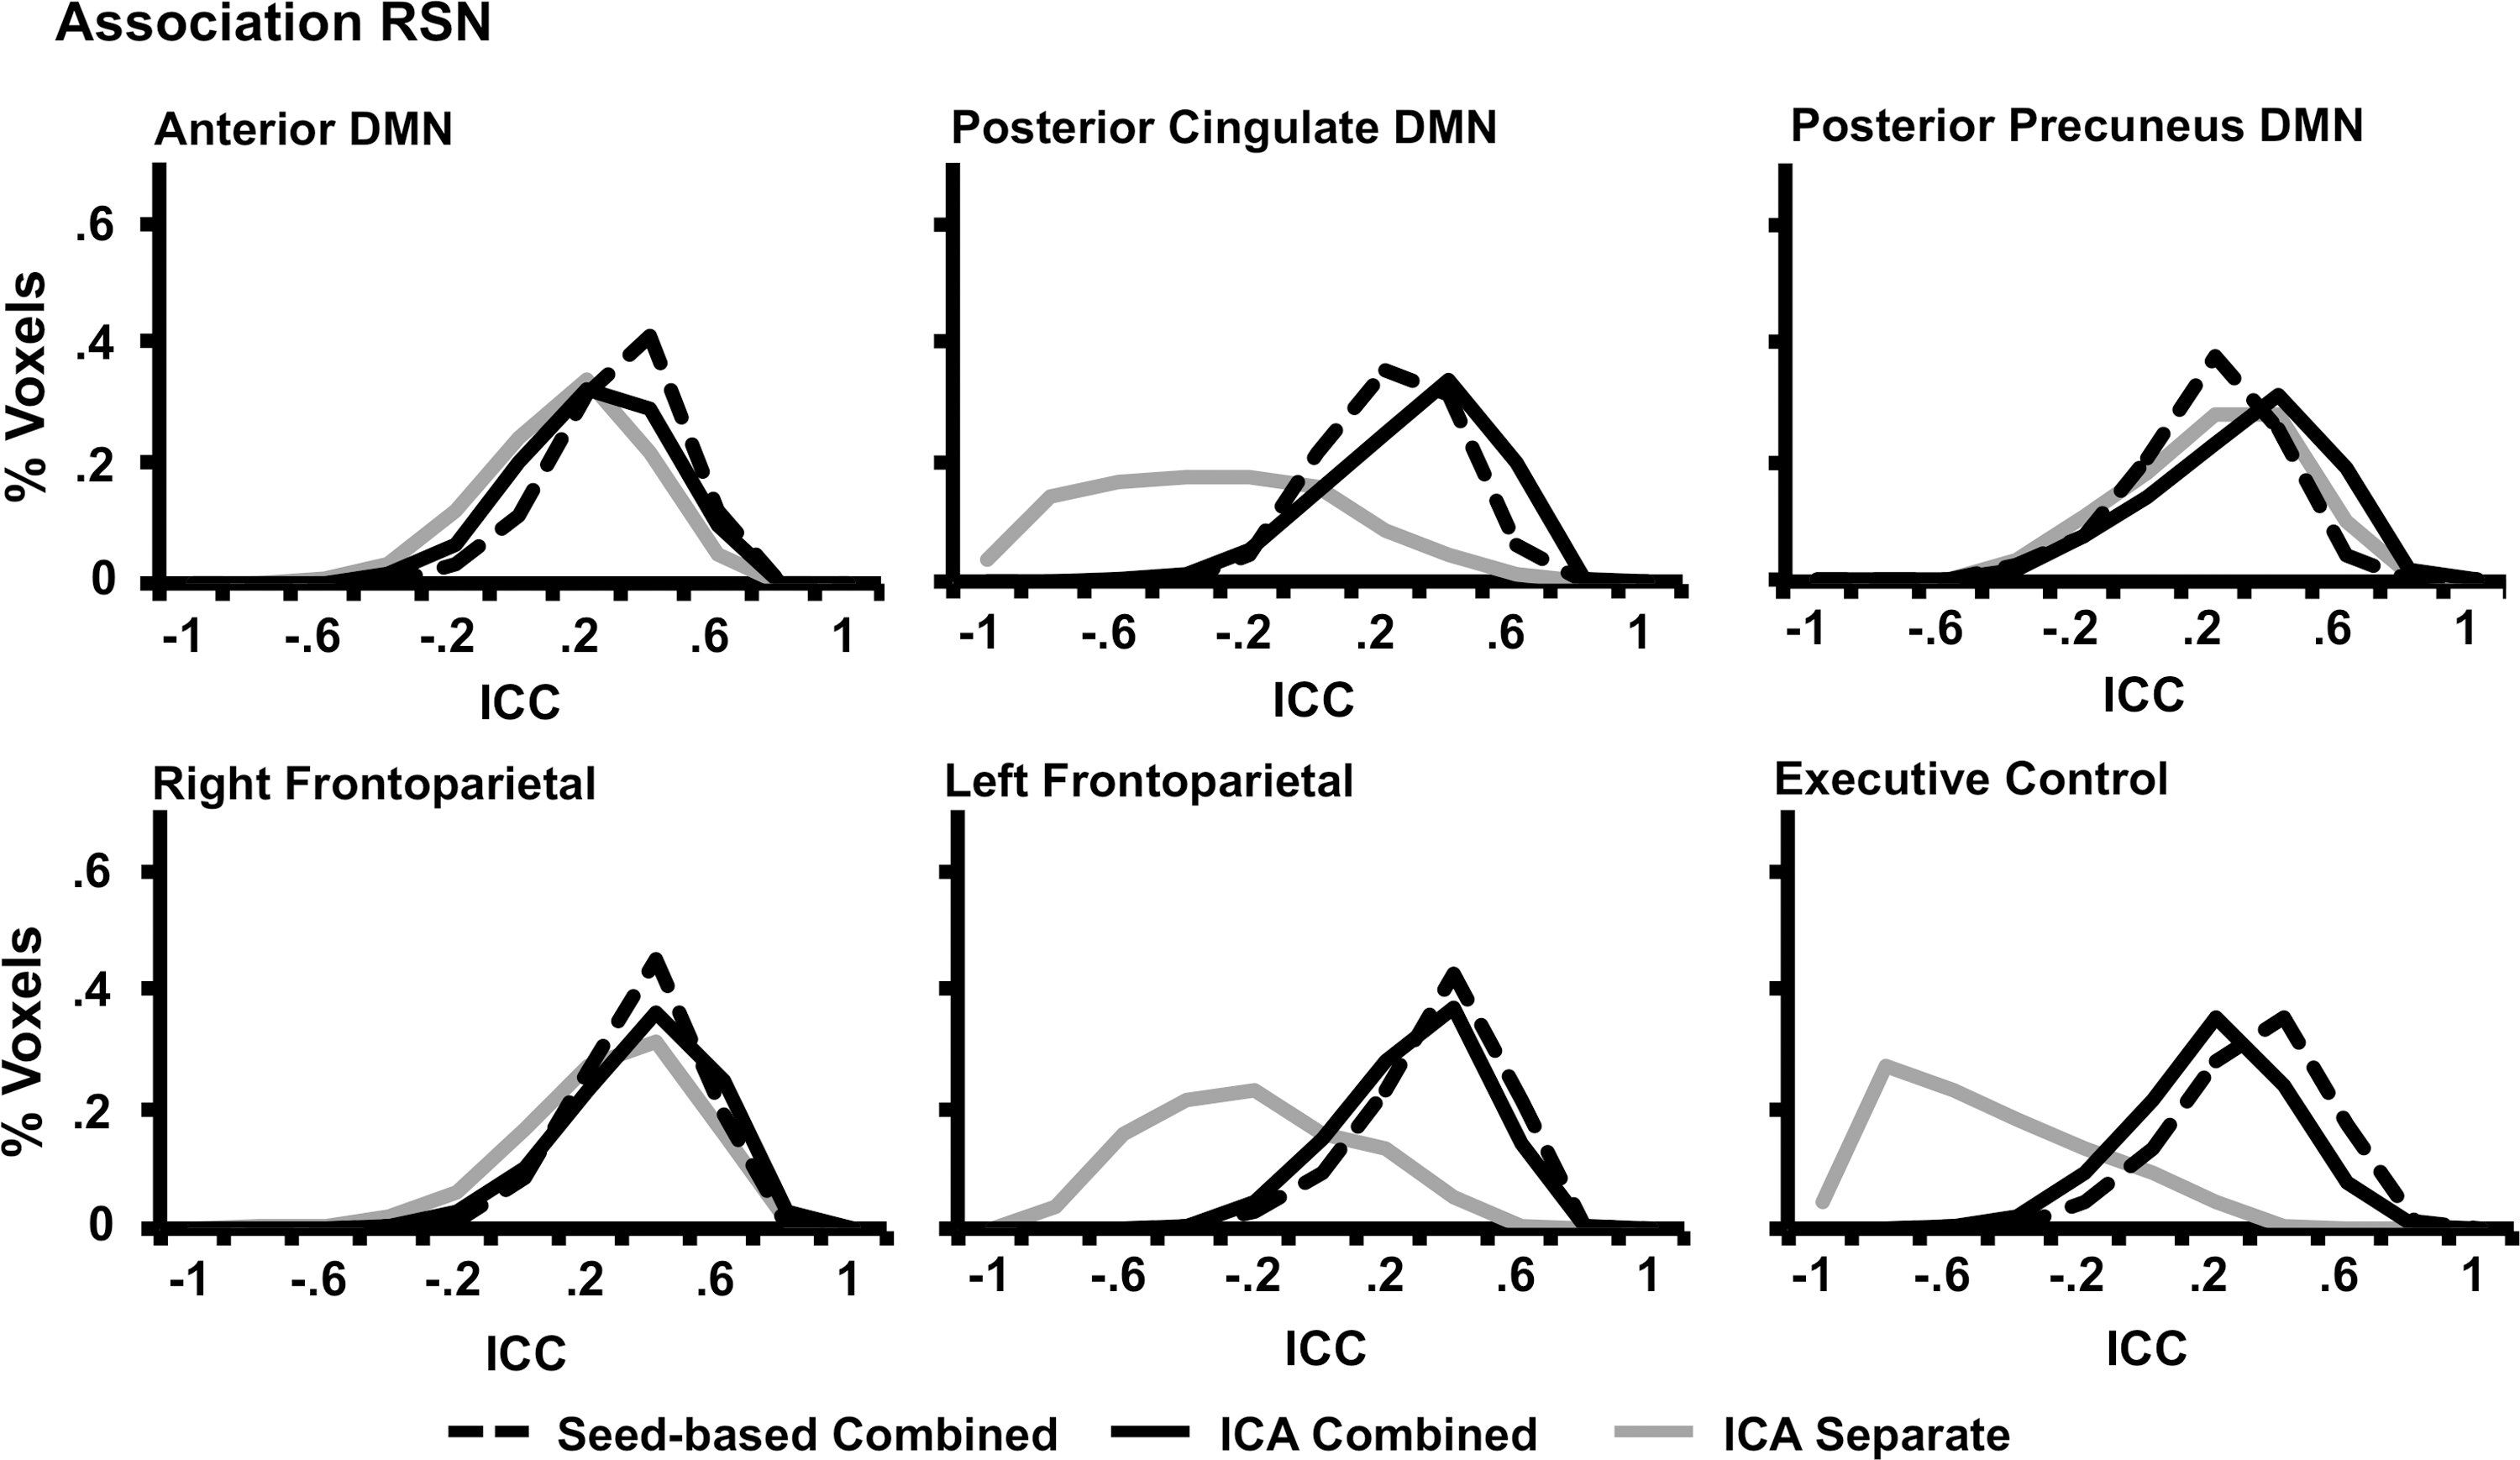
Histograms representing the reliability values for each method within the six association RSNs. Line representations and axes are identical to those presented in Figure 4.
For Each Method, Median Histogram Intraclass Correlation Values for Voxels In and Outside the Resting-State Network Templates
Identical t-tests were also conducted to assess reliability of brain voxels outside the RSNs (Table 3). Results again indicated that the reliability was significantly higher (t 9=−4.69, p<0.005) for the combined ICA (mean=0.15±0.03) approach compared with the separate ICA approach (mean=0.00±0.09). In addition, when comparing the reliability of methods, the seed-based approach (mean=0.27±0.09) was significantly higher (t 9=−4.22, p<0.005) than the combined ICA method.
Discussion
Although considerable research has been devoted to the identification of intrinsic functional networks (RSNs) in healthy and clinical populations (Damoiseaux et al., 2006; Greicius, 2008; van den Heuvel et al., 2009), current results suggest that the analytic pathway can affect RSN quantification. At the group level, results indicated that the majority of RSNs demonstrated good to excellent reproducibility (r within 0.66–0.97) in an independent cohort of subjects (i.e., testing dataset) as determined by template matching. The exception was the pcDMN, which exhibited spatial correlations at 0.417 for the first visit as a result of being combined with the primary visual component (see Supplementary Fig. S6, component 12). As discussed next, higher-order ICA approaches may reduce the combination of RSNs further. Repetitions of the ICA algorithm on the testing dataset (as implemented in ICASSO) suggested that the ICA solution was highly stable across both visits (iq >0.85). Finally, the reproducibility and stability estimates for the group RSNs were very similar regardless of whether data from visits one and two were analyzed separately or combined into a single ICA.
In concordance with the reproducibility results, the reliability of the spatial correlation between model and testing RSNs at visits 1 and 2 was excellent when examined at a group level after the removal of a single outlier (ICC=0.805). Therefore, current results indicate the robustness and stable nature of spontaneous neuronal fluctuations when data are collapsed across groups of subjects. Moreover, a recent analysis reported that the large-scale cortical networks identified at rest are similar to those observed across a variety of cognitive and sensory tasks (Smith et al., 2009) derived via a meta-analysis of approximately 30,000 datasets, suggesting that intrinsic BOLD fluctuations mirror patterns of evoked activity. The high degree of reproducibility across different groups of subjects suggests that spontaneous fluctuations in BOLD signal may be representative of an intrinsic self-organization of the brain that is functionally similar across individuals. The exact role of these covarying spontaneous fluctuations within RSNs is not clear, but they may serve as a record of previous task-dependent usage, may coordinate neuronal activity between regions that are traditionally co-activated, or may represent a dynamic prediction of future use (Fox and Raichle, 2007).
In contrast to the group reliability data, estimates were much lower at the individual subject level for both the voxel-wise and template matching approaches. In addition, current results indicated that individual subject reliability estimates were highly influenced by the RSN estimation method, with the poorest results obtained when data were analyzed with separate ICAs for visits one and two. Specifically, the majority of RSNs had negative ICCs (greater within than between-subject variance), with only the somatomotor RSN exhibiting fair reliability when separate ICAs were applied to the data.
A seed-based analysis derived from the single-session group ICA results improved reliability for both the voxel-wise and template matching analyses, with eight out of 10 RSNs exhibiting a higher ICC when compared with the separate ICAs, one of which was considered good. However, combining data from both visits into a single group ICA clearly improved the reliability of spatial correlations compared with the separate analyses, with the seed-based approach yielding the highest voxel-wise reliability coefficients.
There are several potential explanations for the differences in reliability estimates observed across the three different analytic approaches. First, a combined ICA approach forces the group components (RSNs) to share increased spatial similarity across the two sessions (Calhoun et al., 2001), thereby reducing variability in the individual subject back-reconstructed components. However, this occurs at the cost of independent treatment of the data for each of the two visits as is traditionally done in reliability analyses. Second, ICA approaches require several different data processing steps that are not present in the seed-based approach. For example, as a result of random component ordering following group ICA, back reconstruction should be used to determine individual subject components, which may result in some information loss and decrease reliability. Third, seed-based analyses involve an explicit step in which putative noise sources (i.e., motion) are directly removed from the time-series data through regression. An analogous step is inherent to the ICA process (i.e., separation of noise components from components of interest), but likely varies based on dimensionality estimates (Kiviniemi et al., 2009; Smith et al., 2009) and the presence of subject-specific noise sources.
It should be noted that the method producing the highest reliability estimates on an individual subject level still resulted in a wide range of reliability values across all 10 RSNs. Factors that did not appear to contribute to the variability in reliability among RSNs included the type (i.e., sensory-motor or association) and size of the network (single or multiple clusters), as well as whether analyses were conducted at a network (i.e., template matching) or voxel-wise level. However, a relatively consistent relationship existed between inter-subject reproducibility at the group level and reliability at the intra-subject level. Specifically, in the seed analysis, RSNs (somatomotor, auditory, anterior DMN, and left frontoparietal) that exhibited lower spatial correlations (i.e., reproducibility) with the model dataset at the group level tended to be less reliable than RSNs (right frontoparietal, posterior cingulate DMN, and secondary visual) exhibiting higher spatial correlations. However, this effect was not observed in the primary visual, posterior precuneus DMN, and executive control RSNs. In addition, reliability estimates for the use of the sensory-motor networks are greater for the combined ICA compared with the seed-based method. With the exception of the posterior precuneus DMN, the opposite is true for the association networks, Other work suggests that RSN reliability is also influenced by factors such as degree of anatomical connectivity (Honey et al., 2009), valence of connectivity (Skudlarski et al., 2008), and strength of functional connectivity estimates (Shehzad et al., 2009). Finally, there is evidence that reliability can vary widely among the different nodes of RSNs (Damoiseaux et al., 2006).
Another often debated issue with regard to ICA is the selection (dimensionality estimate) of the number of initial components (Calhoun et al., 2001; Kiviniemi et al., 2009; van de Ven et al., 2004), which can influence the spatial properties of individual RSNs, and may, in turn, impact the reliability of these networks. For this study, we have chosen to use 36 components based on the minimum description length criteria (Li et al., 2007) defined with the model dataset. This is a typical procedure used to define the number of components to be generated. A study by (Smith et al., 2009) demonstrated that increasing the dimensionality of ICA (i.e., from 20 to 70 components) effectively separated more spatially extensive (i.e., larger) functional networks into smaller, increasingly better defined subnetworks that shared higher temporal correlations with one another than with subdivisions of other large-scale networks. Thus, optimally increasing the number of components (essentially reducing each network to sets of independent nodes) could potentially increase reliability. Current data support this hypothesis, as RSNs that were less spatially distinct from the remainder of other components (Table 1) tended to have lower reproducibility and reliability estimates. However, increasing the dimensionality increases the likelihood of splitting functionally connected regions into separate (e.g., a node rather than network analysis) components (Abou-Elseoud et al., 2010; Smith et al., 2009).
Many other variables still need to be addressed to further assess the reliability and reproducibility of RSNs. With the proposed methodology of calculating reliability and reproducibility, scan time has not been evaluated for all networks. Specifically, would single-subject reliability increase if scan time increased from 5 to 10 min? Another question to be addressed is how seeds are defined. Even though on average the reliability of the seed-based methods is greater, the template matching scores for the ICA methods are far superior (Supplementary Table S2). Possible reasons for this to occur can be due to (1) sensitivity of seed placement (Cole et al., 2010), (2) subject motion, and (3) how seeds are defined. Even though we did not observe any significant statistical difference in motion between visits and their relationship to template matching scores, there is a potential for it to be a diver of reliability of the RSNs (Dijk et al., 2012). In this article, we have chosen to define the seeds based on the ICA results of the model dataset in order to attempt to maintain consistency across both methods (ICA and Seed). Therefore, our results might be underestimating the reliability of the seed-based analysis. Finally, ICC is a reproducibility and reliability estimate that can be highly skewed by outliers. This is directly exhibited in the reproducibility estimate when removing the posterior cingulate DMN from the ICC. Henceforth, our estimates of reliability can also be altered by data of only a few subjects.
In summary, current and previous work suggests a wide range of reliability coefficients at the individual level (Honey et al., 2009; Shehzad et al., 2009; Van de Ven et al., 2004), which greatly improve when data are combined across subjects (Chen et al., 2008; Shehzad et al., 2009; Zuo et al., 2010b). Collectively, this work demonstrates that good to excellent reproducibility and stability of RSNs at the group level does not explicitly translate into the same level of reliability at the individual subject level. Reduced individual subject RSN reliability (poor to moderate range) may be a result of the inherent statistical properties of RSNs (e.g., low signal to noise) and data processing techniques (e.g., noise separation). In addition, it has been suggested that covariations in BOLD signal may result from both unconstrained mental activity (i.e., reviewing previous episodic events) and spontaneous fluctuations in neuronal activity (Fox and Raichle, 2007). Although the contribution of unconstrained mental activity is likely to be minimal, future experiments should examine whether these two different signal sources might differentially affect individual subject reliability estimates, as unconstrained mental activity is likely to be more variable on a daily basis (e.g., days in which subject daydreams more or less) and may be affected by confounds such as recent nicotine or caffeine use (Rack-Gomer et al., 2009).
This article tests two methods of maximizing reliability in normal controls, without directly addressing longitudinal studies in which there is an expected change (e.g., in the case of an intervention). Though combining two or more scans in a single ICA can potentially generate group components that are heavily biased toward one scanning session, there is evidence that group analyses do reveal differences which are representative of individual variations (Allen et al., 2012).
Finally, variations in the analytic technique (i.e., single vs. combined ICA and ICA vs. seed-based analyses) had a significant impact on individual reliability measurements, but did not greatly affect the reproducibility, reliability, or stability of RSNs at the multi-subject level. Current results suggest that individual-subject RSNs reliability coefficients can be maximized by combining time points into a single ICA and utilizing the resulting output (with a high threshold) to inform a seed-based analysis. Although seed-based analyses produced on average the highest reliability coefficients at the individual subject level, they are inherently dependent on a priori anatomical or functional connectivity information. Therefore, a hybrid approach that utilizes ICA to identify RSNs and seeds to quantify changes as a function of time may maximize the strength of both techniques.
Footnotes
Acknowledgments
Special thanks are due to Diana South and Cathy Smith for assistance with data collection; to Reyaad Hayek, MD, for review of anatomical images; and to Elena Allen, PhD, for reviewing this article.
This work was supported by the National Institutes of Health (grant numbers R21 NS064464-01A1, 3R21 NS064464-01A1S1 to A.R.M., and 2R01 EB000840 to V.D.C.) and the National Center for Research Resources, Centers of Biomedical Research Excellence (grant number P20 RR021938).
Author Disclosure Statement
No competing financial interests exist.
References
Supplementary Material
Please find the following supplemental material available below.
For Open Access articles published under a Creative Commons License, all supplemental material carries the same license as the article it is associated with.
For non-Open Access articles published, all supplemental material carries a non-exclusive license, and permission requests for re-use of supplemental material or any part of supplemental material shall be sent directly to the copyright owner as specified in the copyright notice associated with the article.