
Abstract
The simultaneous acquisition of electroencephalography (EEG) and functional magnetic resonance imaging (fMRI) data potentially allows measurement of brain signals with both high spatial and temporal resolution. Partial directed coherence (PDC) is a Granger causality measure in the frequency domain, which is often used to infer the intensity of information flow over the brain from EEG data. In the current study, we propose a new approach to investigate functional connectivity in resting-state (RS) EEG-fMRI data by combining time-varying PDC with the analysis of blood oxygenation level-dependent (BOLD) signal fluctuations. Basically, we aim to identify brain circuits that are more active when the information flow is increased between distinct remote neuronal modules. The usefulness of the proposed method is illustrated by application to simultaneously recorded EEG-fMRI data from healthy subjects at rest. Using this approach, we decomposed the nodes of RS networks in fMRI data according to the frequency band and directed flow of information provided from EEG. This approach therefore has the potential to inform our understanding of the regional characteristics of oscillatory processes in the human brain.
Introduction
Functional magnetic resonance imaging (fMRI) of the brain, based on the blood oxygenation level-dependent (BOLD) (Ogawa et al., 1990) signal, provides a relatively high spatial resolution, but a limited temporal resolution; and only indirectly reflects the electrophysiological activity of neurons (Logothetis et al., 2001). On the other hand, electroencephalography (EEG) directly measures the electrical activity of assemblies of cortical pyramidal cells with an accuracy to the order of milliseconds. However, localizing the sources of the EEG signal is an ill-posed problem, the so-called inverse problem (Pascual-Marqui et al., 1994). Simultaneous recording of EEG and fMRI signals has been proposed as a way to approach the inverse problem of EEG, the low temporal resolution of fMRI, and the interpretability issues of BOLD in terms of electrophysiological activity. This technique has become possible with the advances of multimodal acquisition technologies (Herrmann and Debener, 2008).
More recently, another method of fMRI analysis has emerged, focusing on the spontaneous fluctuations or intrinsic activity of the brain instead of evoked activity. Temporal correlation of activity in spatially consistent brain regions was found using resting-state (RS) fMRI experiments (Damoiseaux et al., 2006). These functionally connected areas constitute well-known brain systems, including those responsible for vision, audition, and attentional control (Broyd et al., 2009; Fox and Raichle, 2007). Among the various RS networks, the default mode network (DMN) has received particular attention, and been linked to self-referential processes, such as autobiographical memory and future envisioning (Biswal et al., 1995; Buckner et al., 2008; Raichle and Snyder, 2007). To date, DMN studies have been mostly conducted using fMRI alone; however, simultaneous recording of EEG-fMRI data provides an attractive means to investigate the electrophysiological basis of RS neural networks, and help to provide a better understanding of brain dynamics.
Several methods of analyzing simultaneous EEG-fMRI data have been reported. In a recent review, Rosa et al. (2010) proposed that these methods could be divided into fusion approaches, which are inherently symmetric, asymmetric fMRI-informed EEG procedures, and asymmetric EEG-informed fMRI approaches. Asymmetric EEG-informed fMRI methods are used to map the BOLD activity correlated with some event or EEG feature. The basic idea was developed in work on epilepsy aiming to localize focal spikes (Rosa et al., 2010). Usually, spike timing is convolved with a hemodynamic response function and the result is used as a regressor in a general linear model (GLM) (Formaggio et al., 2010). Similar approaches have also been applied to study EEG features related to RS networks (Gotman et al., 2005; Laufs et al., 2003). To date, there are few methods for assessing connectivity in RS EEG-fMRI data. A possibility is to perform a correlation or regression analysis between the time course of EEG frequency power within a time window and the simultaneously measured BOLD signal (de Munck et al., 2007, 2009). Recently, data-driven methods such as independent component analysis have also been proposed (Britz et al., 2010; Mantini et al., 2007).
Estimating directed flow of information in neural networks using fMRI is a difficult task, as demonstrated by Smith et al. (2011). This is mostly due to (1) the low temporal resolution of fMRI; (2), inter-regional and intersubject variability of BOLD response shape; and (3) inherent lag of the BOLD curve. In contrast, the high temporal resolution of EEG qualifies this signal to provide reliable measures of directional functional connectivity. In addition, the spatial resolution of fMRI makes it potentially suitable to map the brain regions in which the activity is correlated with the flow of information measured in EEG.
The Granger causality (GC) concept, which originates from econometrics (Granger, 1969), has been used to identify the direction of information flow and to quantify its strength. By definition, an observed time series, xj , Granger causes a time series, xi , if the past observations of xj significantly improve the prediction of present values of xi Partial directed coherence (PDC) (Baccalá and Sameshima, 2001) is a frequency domain description of GC. When applied to EEG, PDC can be interpreted as the strength of the directed flow of information between different channels.
Our main aim is to introduce a new approach to infer functional connectivity from RS EEG-fMRI data, by measuring directed functional connectivity (PDC) from EEG and locating the associated brain regions using fMRI. We propose that PDC can be used to map brain areas correlated with information flow between hemispheres and in the anterior–posterior axis. We hypothesize that, if PDC is a proxy of information flow between two neural modules, mapped brain regions should represent a known RS network related to these modules. Particularly, DMN areas should be activated in correlation with increased inter- or intrahemispheric connectivity (van den Heuvel et al., 2009). In addition, we expect BOLD activity in different components of RS networks depending on the EEG frequency and connectivity direction.
Materials and Methods
Subjects and data acquisition
Seven unmedicated right-handed healthy volunteers (25±3 years, six males), with no personal history of neurological or psychiatric disease, were recruited to take part in this work. During EEG-fMRI acquisition, they were instructed to remain in a supine position, motionless and with their eyes closed. The EEG signal was continuously recorded inside a 3T MRI scanner (Achieva, Philips Medical System, Best, Netherlands) using an MRI compatible EEG system (BrainAmp amplifier and Vision Recorder; Brain Products, Munich, Germany). We used 32 scalp compatible electrodes (Ag/AgCl) positioned according to the 10–20 system and electrocardiogram data recorded with a single lead. The EEG data were sampled at 5 kHz. Impedances for all electrodes were kept below 10 kOhms.
fMRI data were T2*-weighted gradient-echo echo-planar images (GE-EPI) collected using an eight-channel head coil, with the following parameters: 236 volumes, TR/TE=2000/20 ms, 30 contiguous slices in ascending order, field of view=230×230×85mm, matrix=128×128, slice thickness=4 mm, flip angle=90°, SENSE=2.
EEG preprocessing
MRI artifacts were removed offline from the EEG data using the averaged artifact subtraction method (Allen et al., 1998, 2000) available in a commercial EEG processing package (Brain Vision Analyzer; Brain Products, Munich, Germany). Independent component analysis was applied for removal of ECG and remaining MRI artifacts. Component with strong ECG related time courses were visually identified and removed. The signals were band-pass filtered between 1 and 50 Hz and downsampled to 500 Hz. This temporal resolution is appropriate since the scope of this study is to analyze the contribution of frequencies from delta to gamma bands (up to 50 Hz).
Partial directed coherence
PDC (Baccalá and Sameshima, 2001) is based on the vector autoregressive (VAR) model of order p. Consider
where I denotes the identity matrix and the coefficients aij
(r) are the VAR coefficients for the lag r. The PDC factor πi←j
(f) is defined as follows:
and |πi←j (f)|2 describes the ratio of the power spectrum of xj at frequency f, which is sent to the spectrum of xi . To map regions related to this information flow, the factor πi←j (f) is used as a regressor in a GLM. In other words, the magnitude of the information flow for a particular frequency measured in EEG is correlated with the magnitude of BOLD activity.
Bidirectional PDC between the EEG channels C3, C4, Fz, and Pz (in a multivariate sense and not pairwise) at distinct frequency bands, delta (δ; 1–4 Hz), theta (θ; 5–7 Hz), alpha (α; 8–12 Hz), beta (β; 13–30 Hz), and gamma (γ; 31–50 Hz), were calculated for each TR (i.e., each nonoverlapping time window of 2 sec). The VAR model order for each segment was determined using Akaike Information Criteria. Using this approach, we obtained estimates of time-varying connectivity between brain regions measured using PDC. The choice of the channels is illustrative, to assess the intra- and interhemispheric information flow. Note that by using this approach, the PDC being calculated for each TR implies that the temporal resolution of the connectivity measure is the same as the fMRI data. However, since changes in hemodynamic processes are slow, most relevant information is retained. PDC calculation was implemented using the R platform for computational statistics.
fMRI preprocessing and brain mapping
All preprocessing steps and brain mapping analysis of fMRI data were carried out using the FSL software (
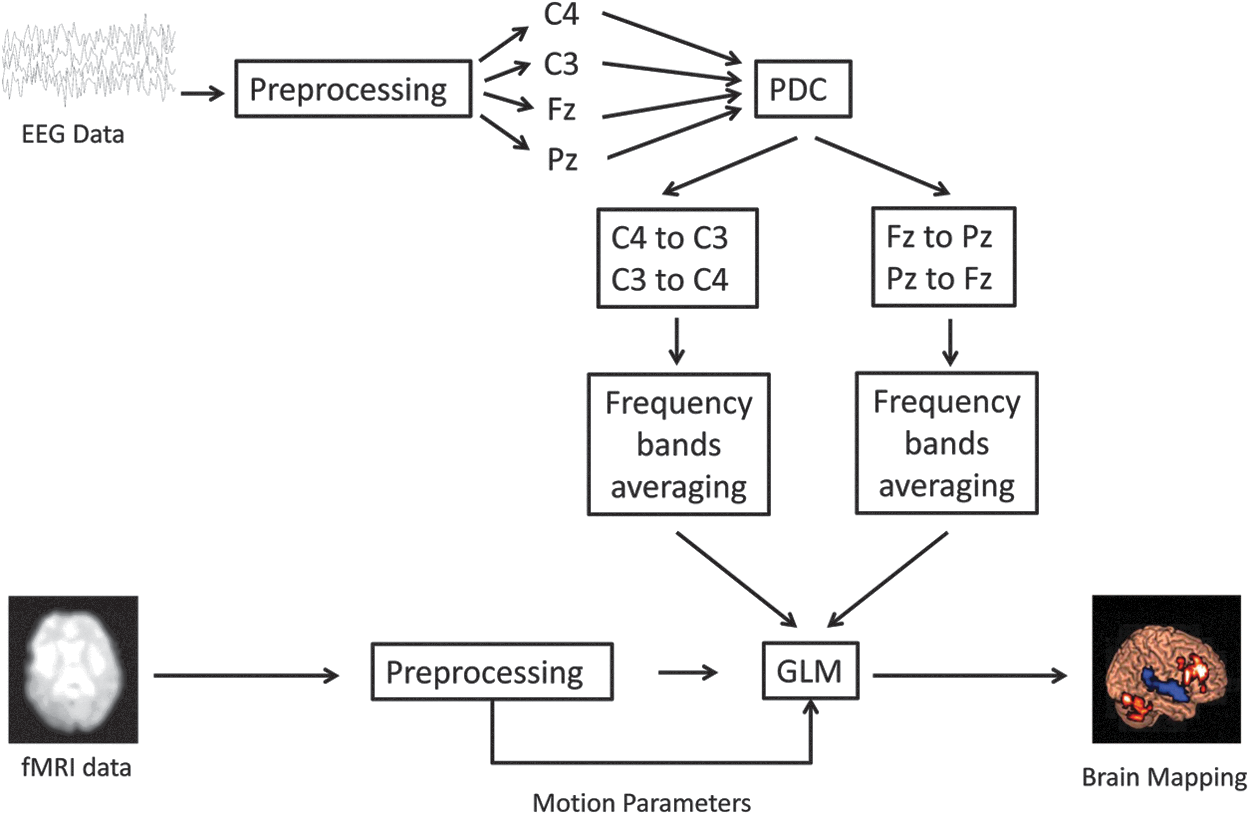
Flowchart of time-varying PDC brain mapping. EEG, electroencephalography; fMRI, functional magnetic resonance imaging; GLM, general linear model; PDC, partial directed coherence.
Results
Table 1 and Figure 2 summarize the brain regions at which the BOLD signal was significantly correlated with the information flow between C3–C4 and Fz–Pz channels for each frequency band. The analyses of PDC from Pz to Fz channels and from C3 to C4 provided no significant results. This finding suggests that in RS conditions, there is a predominant change in the activity levels of circuits involving information flow in the anterior–posterior direction and from the right hemisphere to the left hemisphere. The time-varying PDC in the anterior–posterior direction (from Fz to Pz) was mostly associated to the cerebellum, frontal and somatosensory cortex, although at different frequency bands. The PDC for right to left hemisphere revealed the participation of the premotor, sensory, and also precuneus/posterior cingulate cortex.
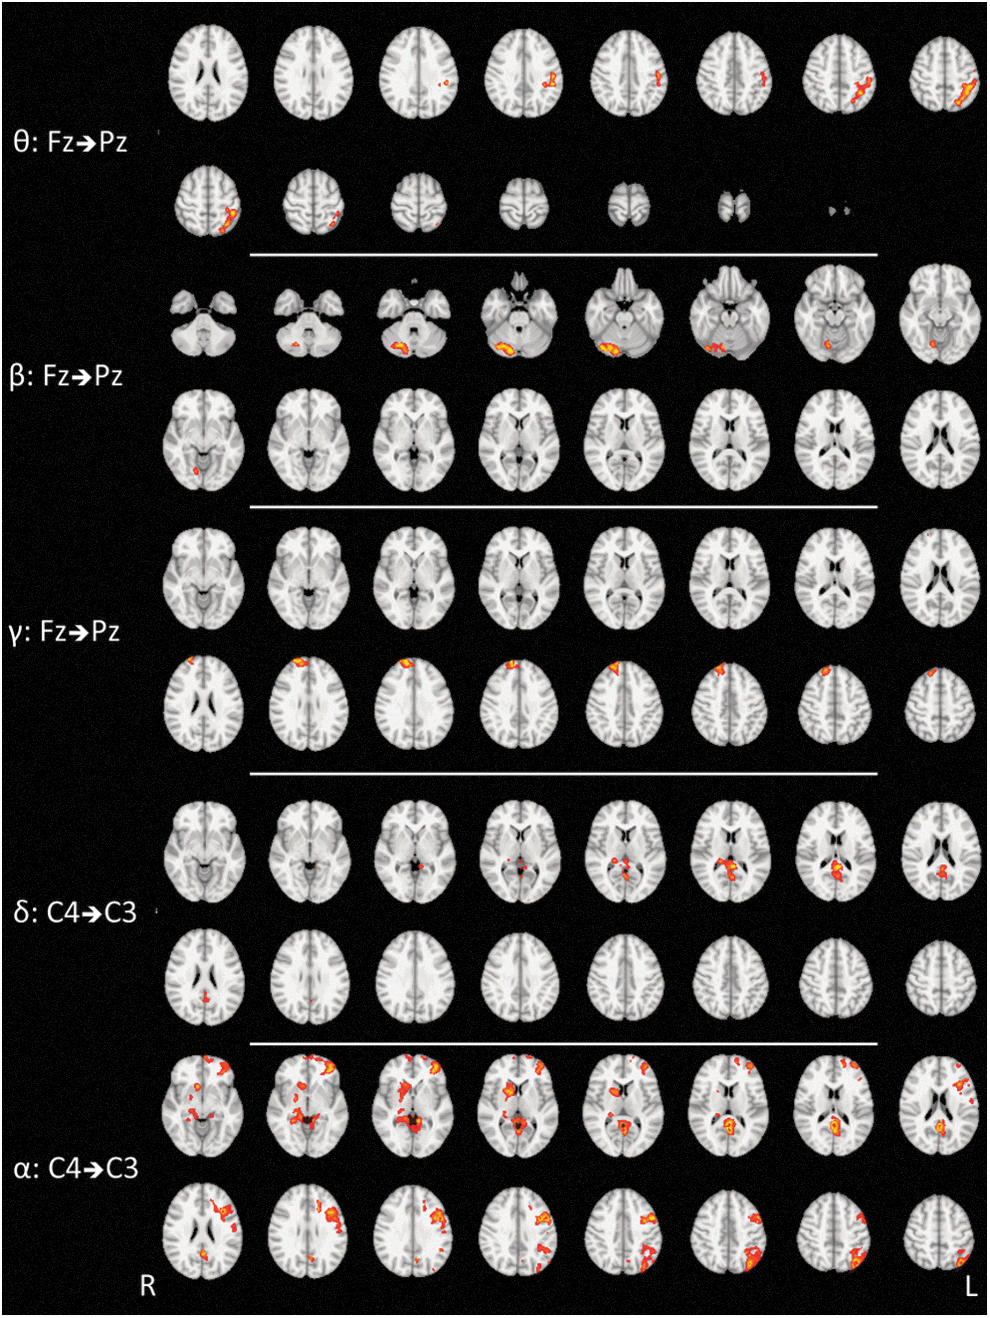
PDC brain mapping group results of seven healthy subjects. The figure displays statistically significant results at a corrected cluster threshold of 5% (z-voxel>2.32). The analyses of PDC from C3 to C4 and Pz to Fz did not provide any statistically significant result.
Summary Statistics of Partial Directed Coherence Brain Mapping
The table displays statistically significant results at a corrected cluster threshold of 5% (z-voxel>2.32).
MNI, Montreal Neurological Institute.
Discussion
The main goal of this work is to describe a new method to analyze simultaneously acquired EEG-fMRI data. This method is based on exploring the complementary strengths of these tools, that is, the high temporal resolution of EEG and the high spatial resolution of fMRI. The directed connectivity was quantified by calculating the PDC from EEG signals. The brain regions in which the activity was correlated to this directed connectivity were mapped using fMRI. To illustrate the usefulness of this approach, we described a proof-of-concept application to RS EEG-fMRI data.
The interhemispheric flow of information was correlated with BOLD activation of DMN components in the alpha and delta frequencies. Interestingly, only the DMN areas within the left hemisphere were active when there was an increased flow of information toward this same hemisphere. Similarly, basal ganglia network activation was found in the right, but not the left hemisphere. These findings confirm our hypothesis that BOLD activation of these highly consistent RS networks would correlate with the strength of directed connectivity measured with simultaneous EEG. Furthermore, network-specific interhemispheric connectivity was observed. For instance, increased connectivity from the right cortical surface toward the left cortical surface was associated with concomitant BOLD activity in the DMN cortical areas in the left hemisphere and basal ganglia in the right hemisphere. One possible functional explanation of this finding relies on the proposed neural basis of the BOLD signal. Considering that positive BOLD is better correlated with perisynaptic activity than with action potential firing (Logothetis et al., 2001), activated voxels may correspond to afferent rather than efferent areas. Indeed, we can speculate that C4–C3 connectivity reflects the efferent activity originating from the right hemispheric cortical surface that projects to both the left hemispheric cortical surface and right basal ganglia, which were mapped.
We can also reasonably propose an anatomical substrate to the information flow between the channels C3 and C4. The majority of interhemispheric fibers are located in the corpus callosum. These interhemispheric connections are mainly directed to homologous regions and are well structured (Brodal, 1981). A possible anatomical interpretation is that the flow of information measured by PDC reflects the activity of the commissural fibers of the corpus callosum. Reductions in spontaneous BOLD correlations have been observed in patients with callosal agenesis (Quigley et al., 2003). Moreover, Johnston et al. (2008) reported a complete loss of interhemispheric RS functional connectivity after section of corpus callosum. Alternatively, BOLD activity correlated with increased leftward, but not rightward connectivity, and may reflect underlying asymmetries of the DMN (Saenger et al., 2012).
One previously proposed hypothesis is that subunits of particular RS networks may be coordinated by oscillatory activity in different EEG frequency bands (Jann et al., 2009). We found more RS network components correlated with the alpha band activity when interhemispheric connectivity was increased. As this frequency is observed in resting, but conscious subjects with closed eyes, it has been proposed to be more strongly related to the DMN (Laufs et al., 2003). Relevant to the current work, Chen et al. (2008) analyzed spectral field powers to characterize DMN in EEG and observed alpha activity in the anterior–posterior measurements, delta activity in the prefrontal area, as well as high-frequency beta and gamma activities in prefrontal areas and frontocentral regions.
Increased anterior-to-posterior connectivity was correlated with BOLD activity in the right cerebellum (beta), right frontal cortex (gamma), and left pre- and postcentral gyri (delta). As observed for interhemispheric increased connectivity, all the areas mapped are components of RS networks. Specifically, BOLD activity in sensorimotor network areas was observed in the delta band. Changes in the EEG delta band have been associated with the difficulty of cognitive tasks, and specifically, increases in delta activity have been demonstrated during tasks that require attention to internal processes (Fernandez et al., 1993, 1995; Harmony et al., 1996). Moreover, the EEG delta band has been related to inhibitory activity, especially of corticofugal pathways (Dimitriadis et al., 2010; Harmony et al., 1999). The current findings feasibly represent intrinsic synchronization of the structures subserving these processes at rest.
In summary, components of default mode, sensorimotor, basal ganglia, and cerebellar RS networks were identified in fMRI in correlation with increased EEG directed connectivity. Notably, a recent study has shown that these same RS networks were the most consistent across subjects, and that the precuneus and posterior cingulate cortex were the most consistent cross-subject DMN nodes (Moussa et al., 2012). Accordingly, we found that these areas were activated with increased interhemispheric connectivity in the alpha and delta bands.
It is important to mention some limitations of the current study. First, the EEG measurements used in this work were sensor-level measures. This is an inherent limitation of EEG methodologies on account of the problems of transforming data into source space caused by the head's inhomogeneous conductivity profile. More sophisticated models based on solving the inverse problem for source localization could be applied, but since the number of EEG channels was small, this approach would not be appropriate in this case. More specifically, the four channels analyzed were chosen as representative and illustrative rather than definitive. Finally, the influence of the MRI gradient and ECG artifacts on multivariate measures between EEG signals such as PDC (and other brain connectivity measures) is still unknown. Further exploration of these effects in different subject groups, using varying acquisition protocols and scanning equipment should be carried out to evaluate the method's sensitivity to these artifacts.
Conclusion
In conclusion, we describe a method to explore the brain regions associated with directed flow of information in RS EEG-fMRI. This new method has the potential to inform our understanding of the electrophysiological bases of RS networks.
Footnotes
Acknowledgment
This research was supported by FAPESP (project number 2013/10498-6), São Paulo, Brazil.
Author Disclosure Statement
No competing financial interests exist.