University of Pittsburgh, Psychiatry, Pittsburgh, United States
University of Pittsburgh, Psychology, Pittsburgh, United States
The Nuisance of Nuisance Regression: Spectral Misspecification Obscures Functional Connectivity Estimates
Question: Recent resting state functional connectivity fMRI (RS-fcMRI) research has demonstrated that head motion during fMRI acquisition systematically influences connectivity estimates. This study explored optimal approaches for removing nuisance signals such as motion estimates from RS-fcMRI data.
Methods: Participants were 117 individuals, ages 10-26, who completed a five-minute resting state fMRI scan. We used frequency domain analyses and linear mixed models to assess the effects of nuisance regression (motion parameters and non-neural noise sources) on connectivity estimates among 244 brain regions when regression was performed before, after, or concomitant with, bandpass filtering.
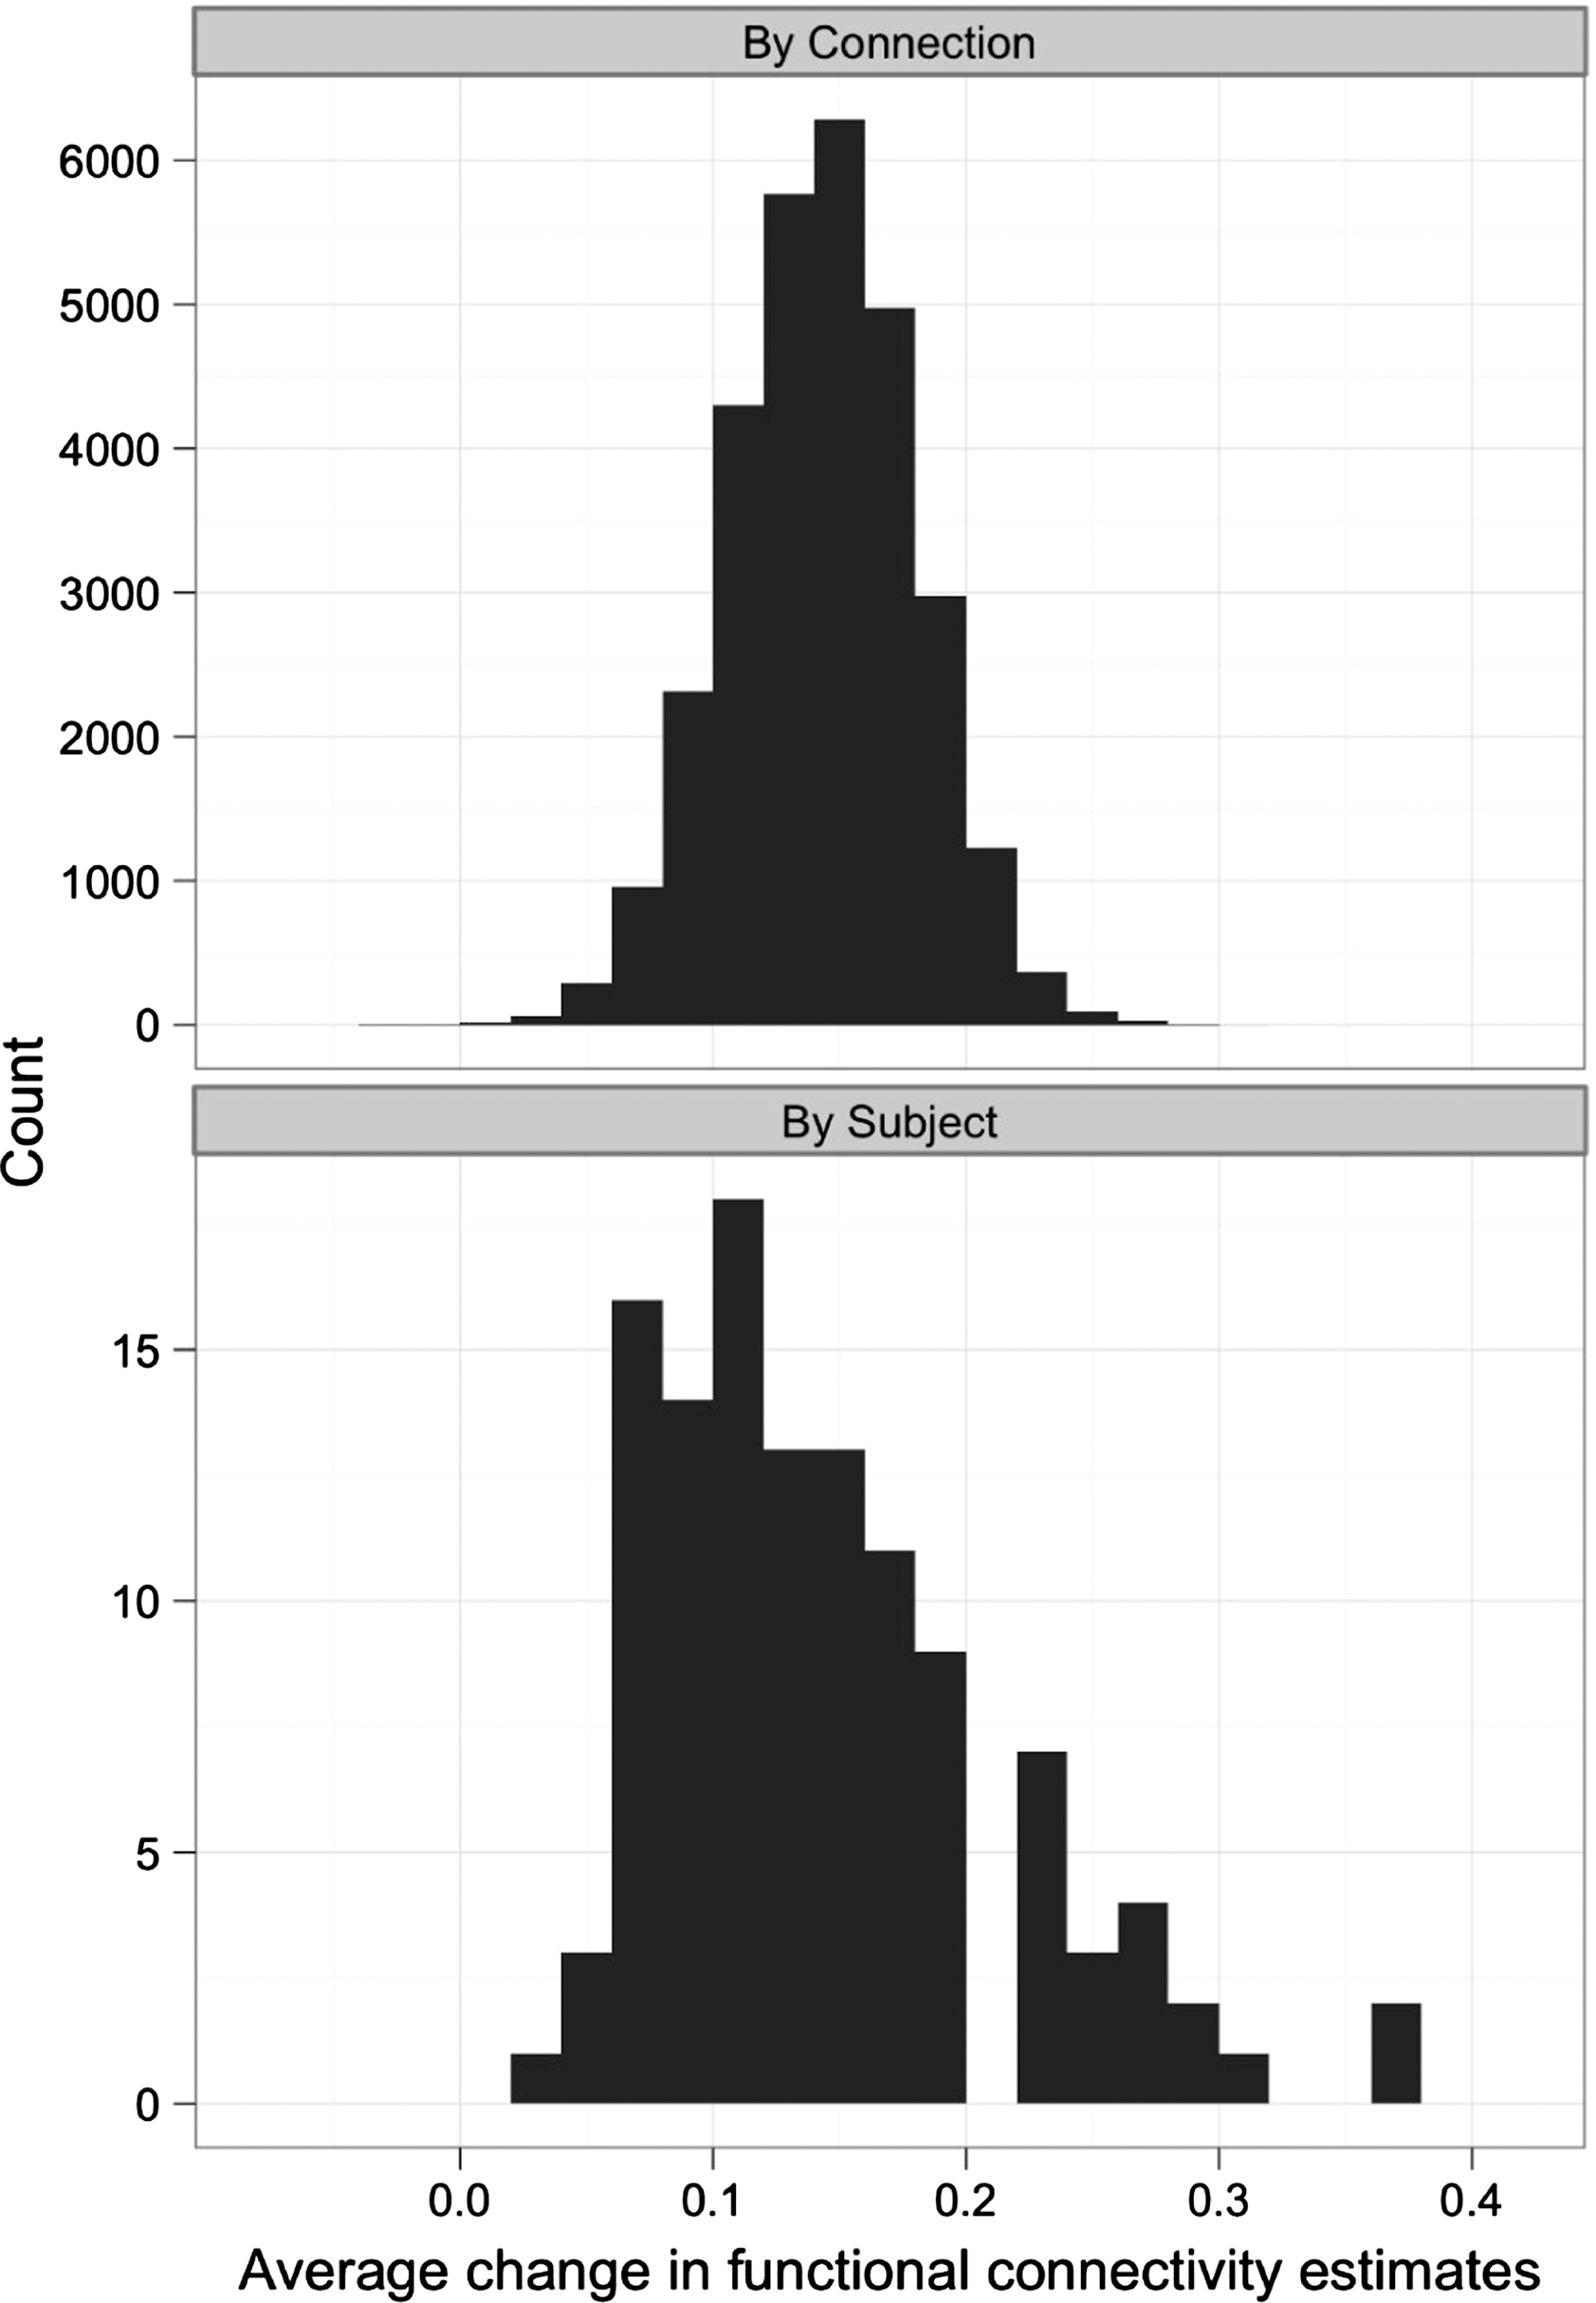
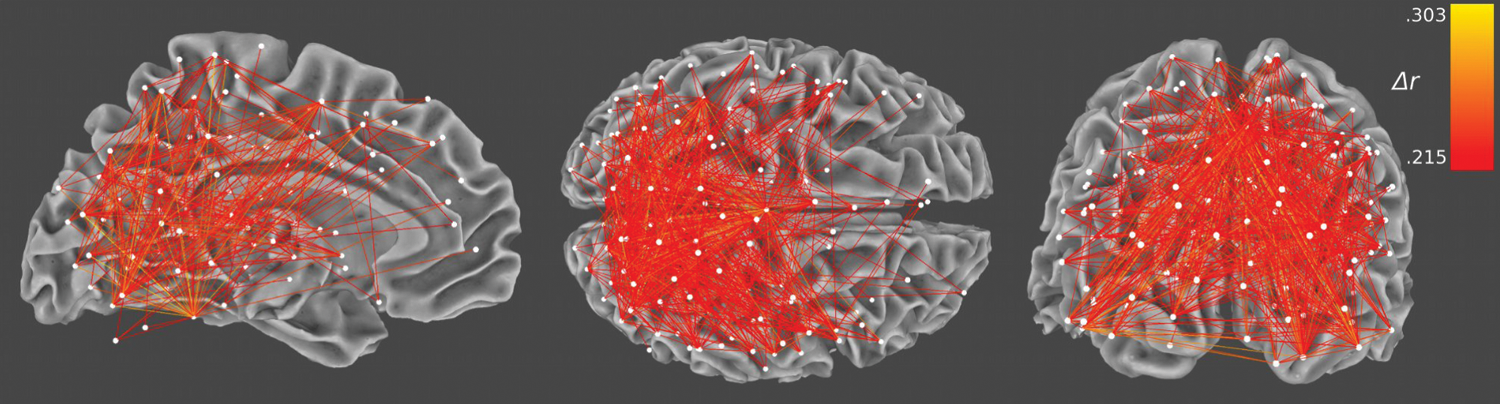
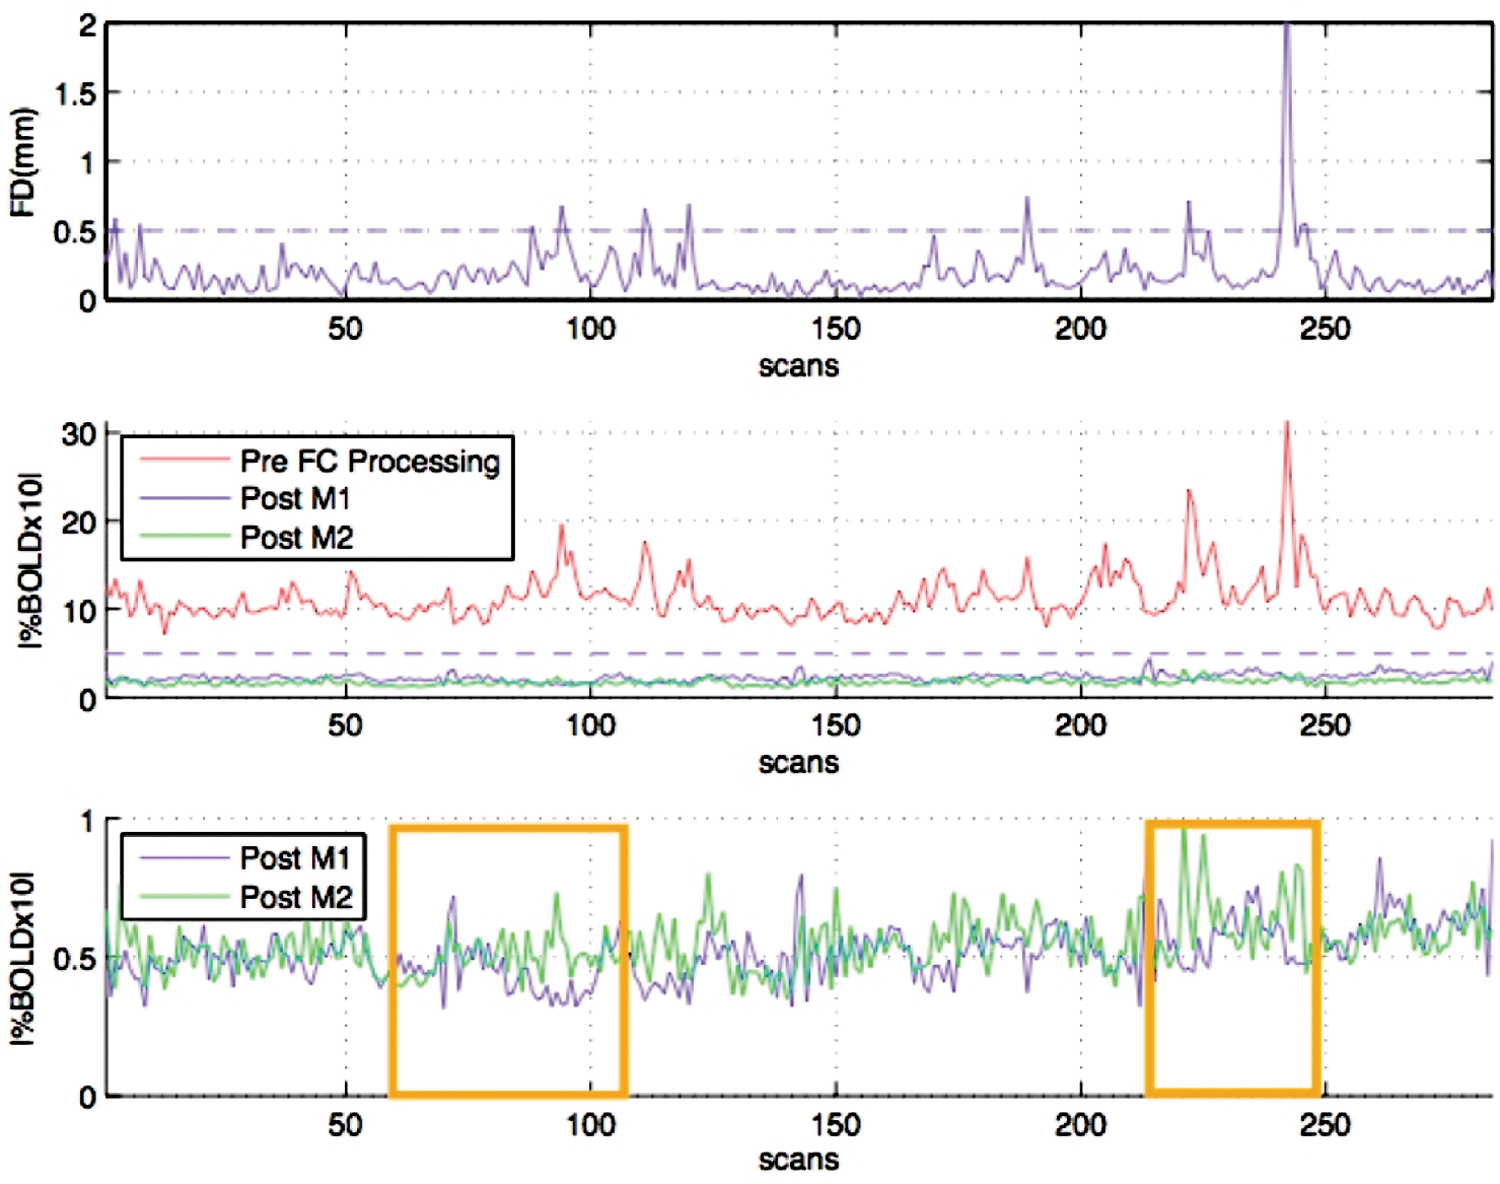
Results: The conventional approach to seed-based correlational analysis of RS-fcMRI data, where nuisance regression is performed after bandpass filtering, is a misspecified form of band-spectrum regression that resulted in poor removal of low-frequency nuisance variation and the systematic induction of high-frequency nuisance-related fluctuation into RS-fcMRI time series (Fig 1). Relative to a simultaneous bandpass filter and nuisance regression transformation, the conventional bandpass-regress approach consistently overestimated functional connectivity across the brain, typically on the order of r=.10-.35 (Fig 2). Particularly affected were connections involving regions near the center of the brain, such as the thalamus and posterior cingulate cortex (Fig 3), and the parcellation of the brain into functional networks differed when proper signal processing was applied. Inflated correlations under the bandpass-regress approach reflected motion- and cardiac-related variability reintroduced outside of the filter passband.
Cross-spectral power between fMRI BOLD time series and 18 nuisance regressors, estimated separately for each bandpass filtering and nuisance regression sequence.
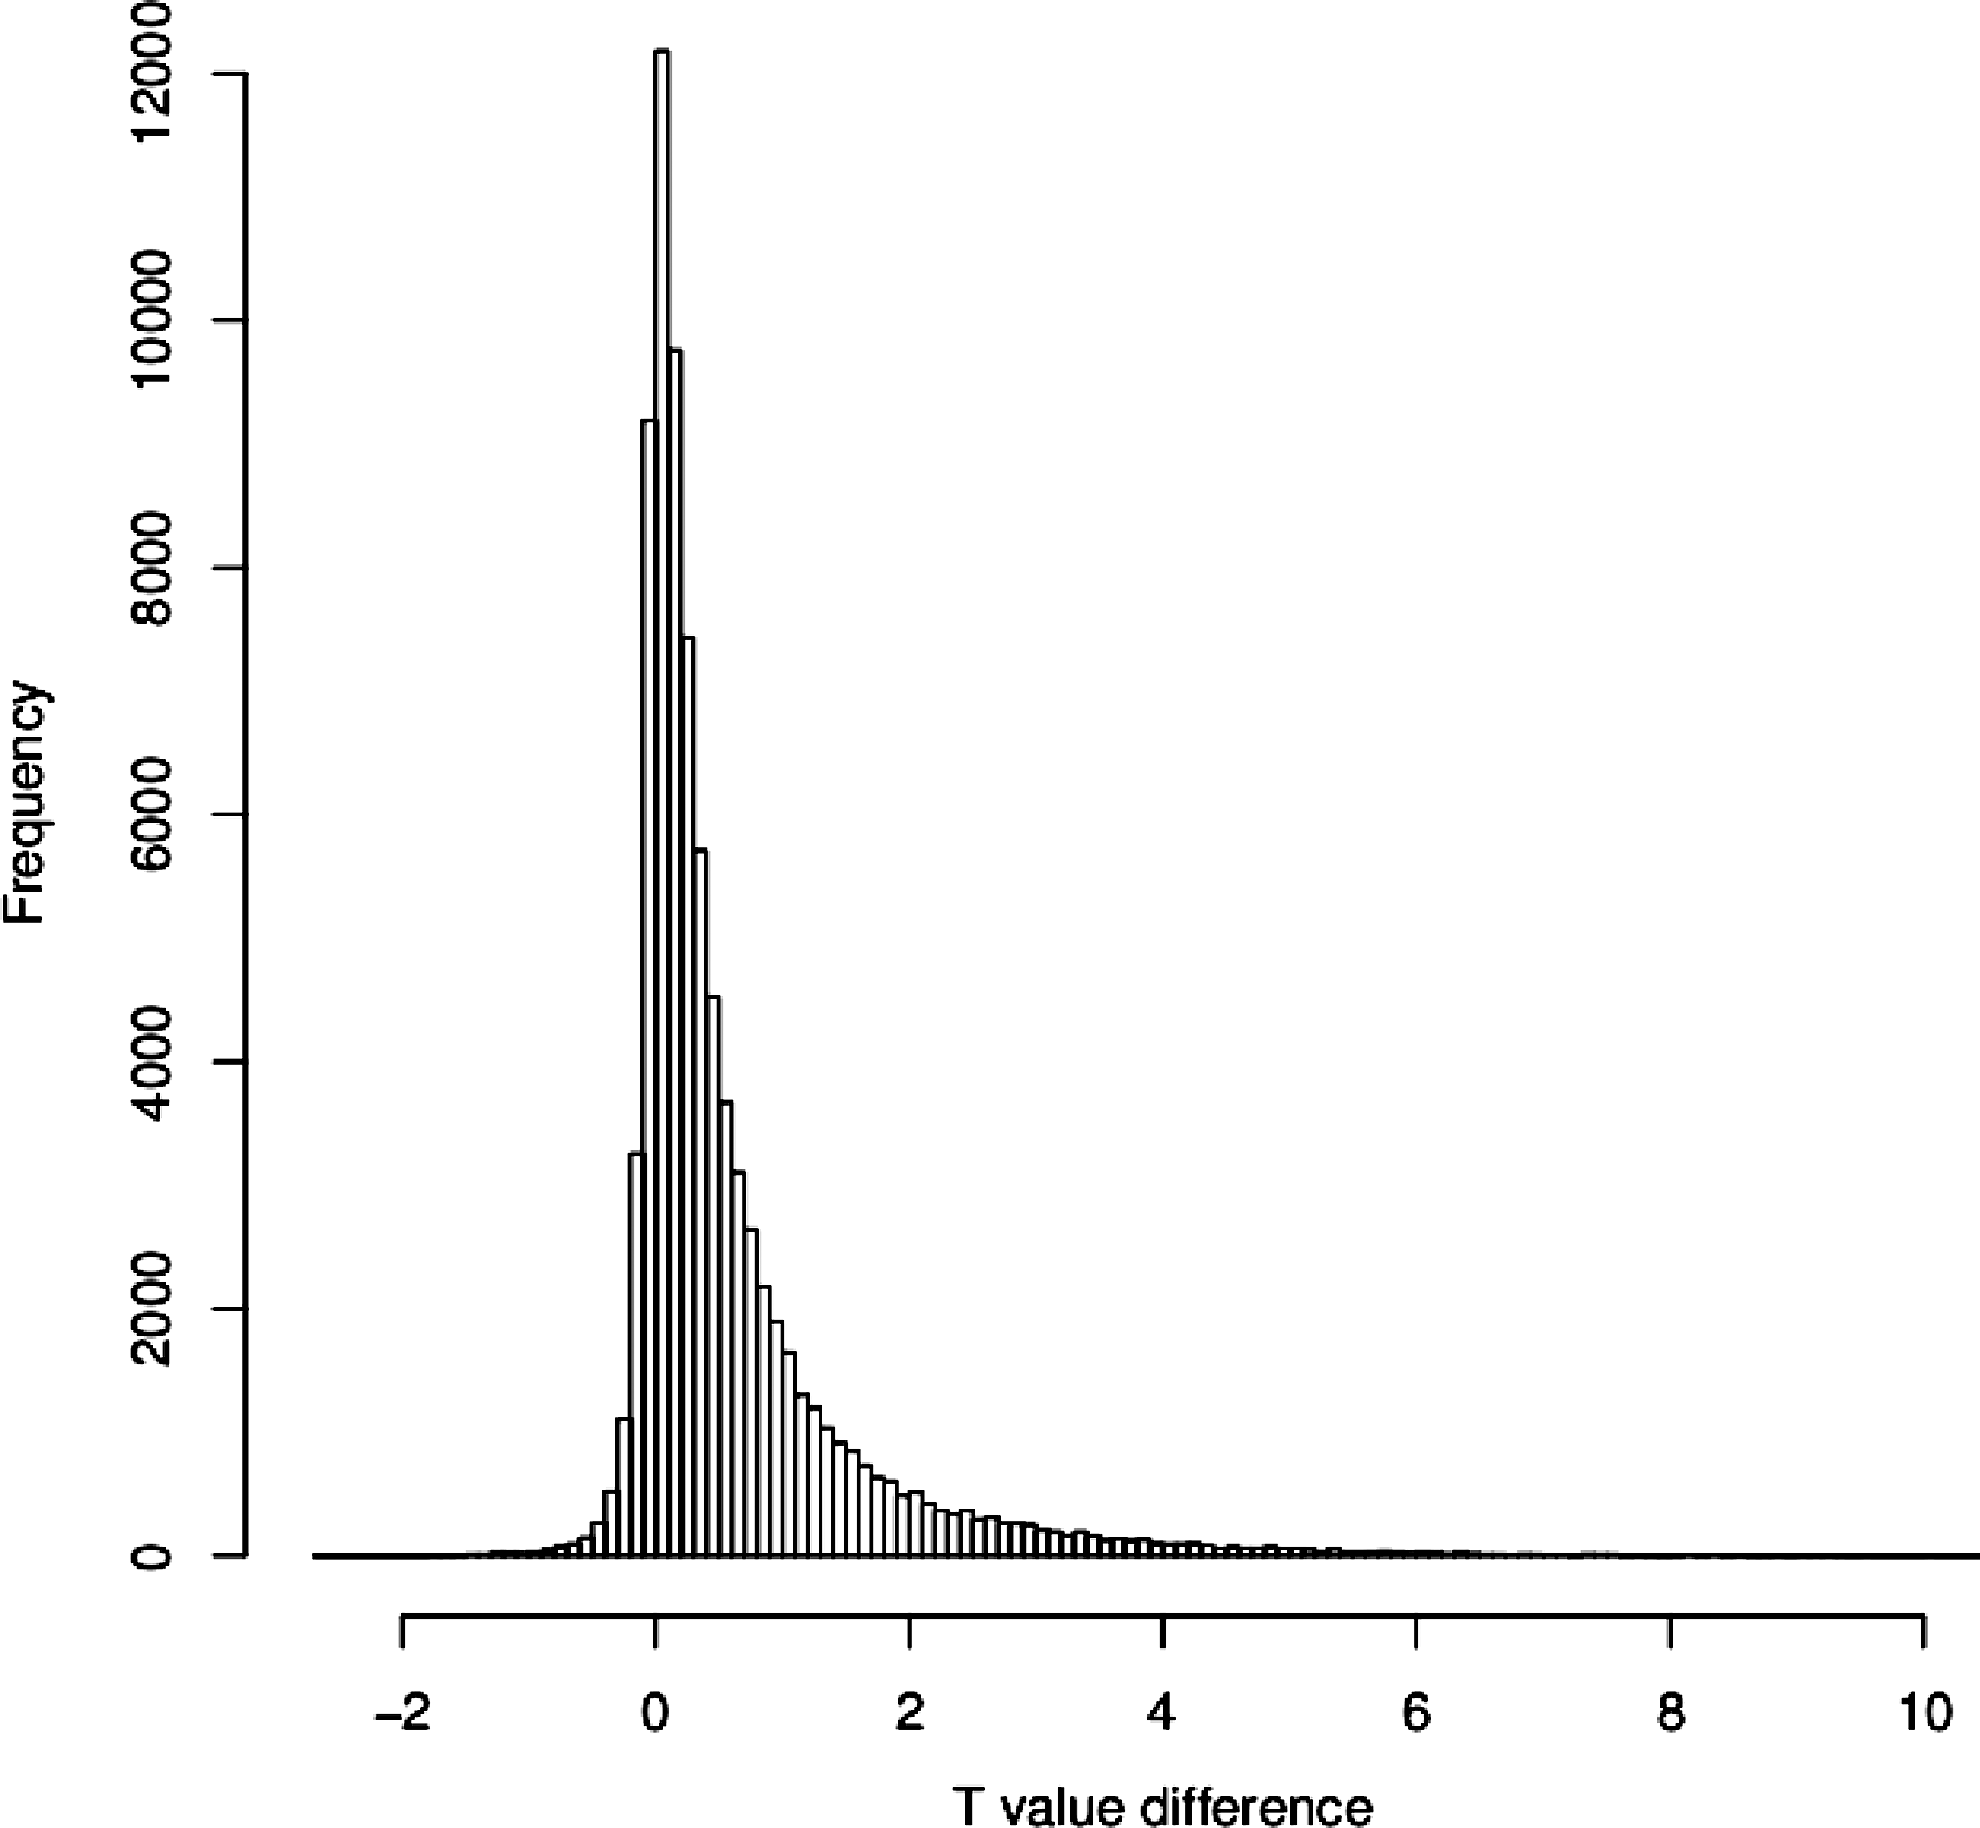
Frequency histograms of connectivity estimate changes between the Bandpass-Regress and Simultaneous sequences by connection and subject.
The spatial distribution of correlation changes between the Bandpass-Regress and Simultaneous sequences.
Conclusions: The conventional RS-fcMRI signal processing approach under-corrects nuisance variation in the frequencies of interest (.009-.08 Hz) and reintroduces nuisance-related variability at other frequencies. A simple fix, simultaneous bandpass filtering and nuisance regression, corrects the misspecified model and improves estimates of connectivity. We hope that the marked changes in functional connectivity estimates shown here will stimulate the RS-fcMRI field, particularly seed-based correlation research, to re-examine its findings.
Animal Imaging
MantiniD.1CorbettaM.23RomaniG.L.3OrbanG.14VanduffelW.156
KU Leuven, Dept. of Neurosciences, Leuven, Belgium
Washington University, Department of Neurology, St. Louis, MO, United States
G.D'Annunzio University, Department of Neuroscience and Imaging, Chieti, Italy, Italy
University of Parma, Department of Neurosciences, Parma, Italy, Italy
Harvard University, Department of Radiology, Boston, MA, Belgium
Martinos Center for Biomedical Imaging, Charlestown, MA, Belgium
Anatomical correspondence between resting state networks in monkeys and humans
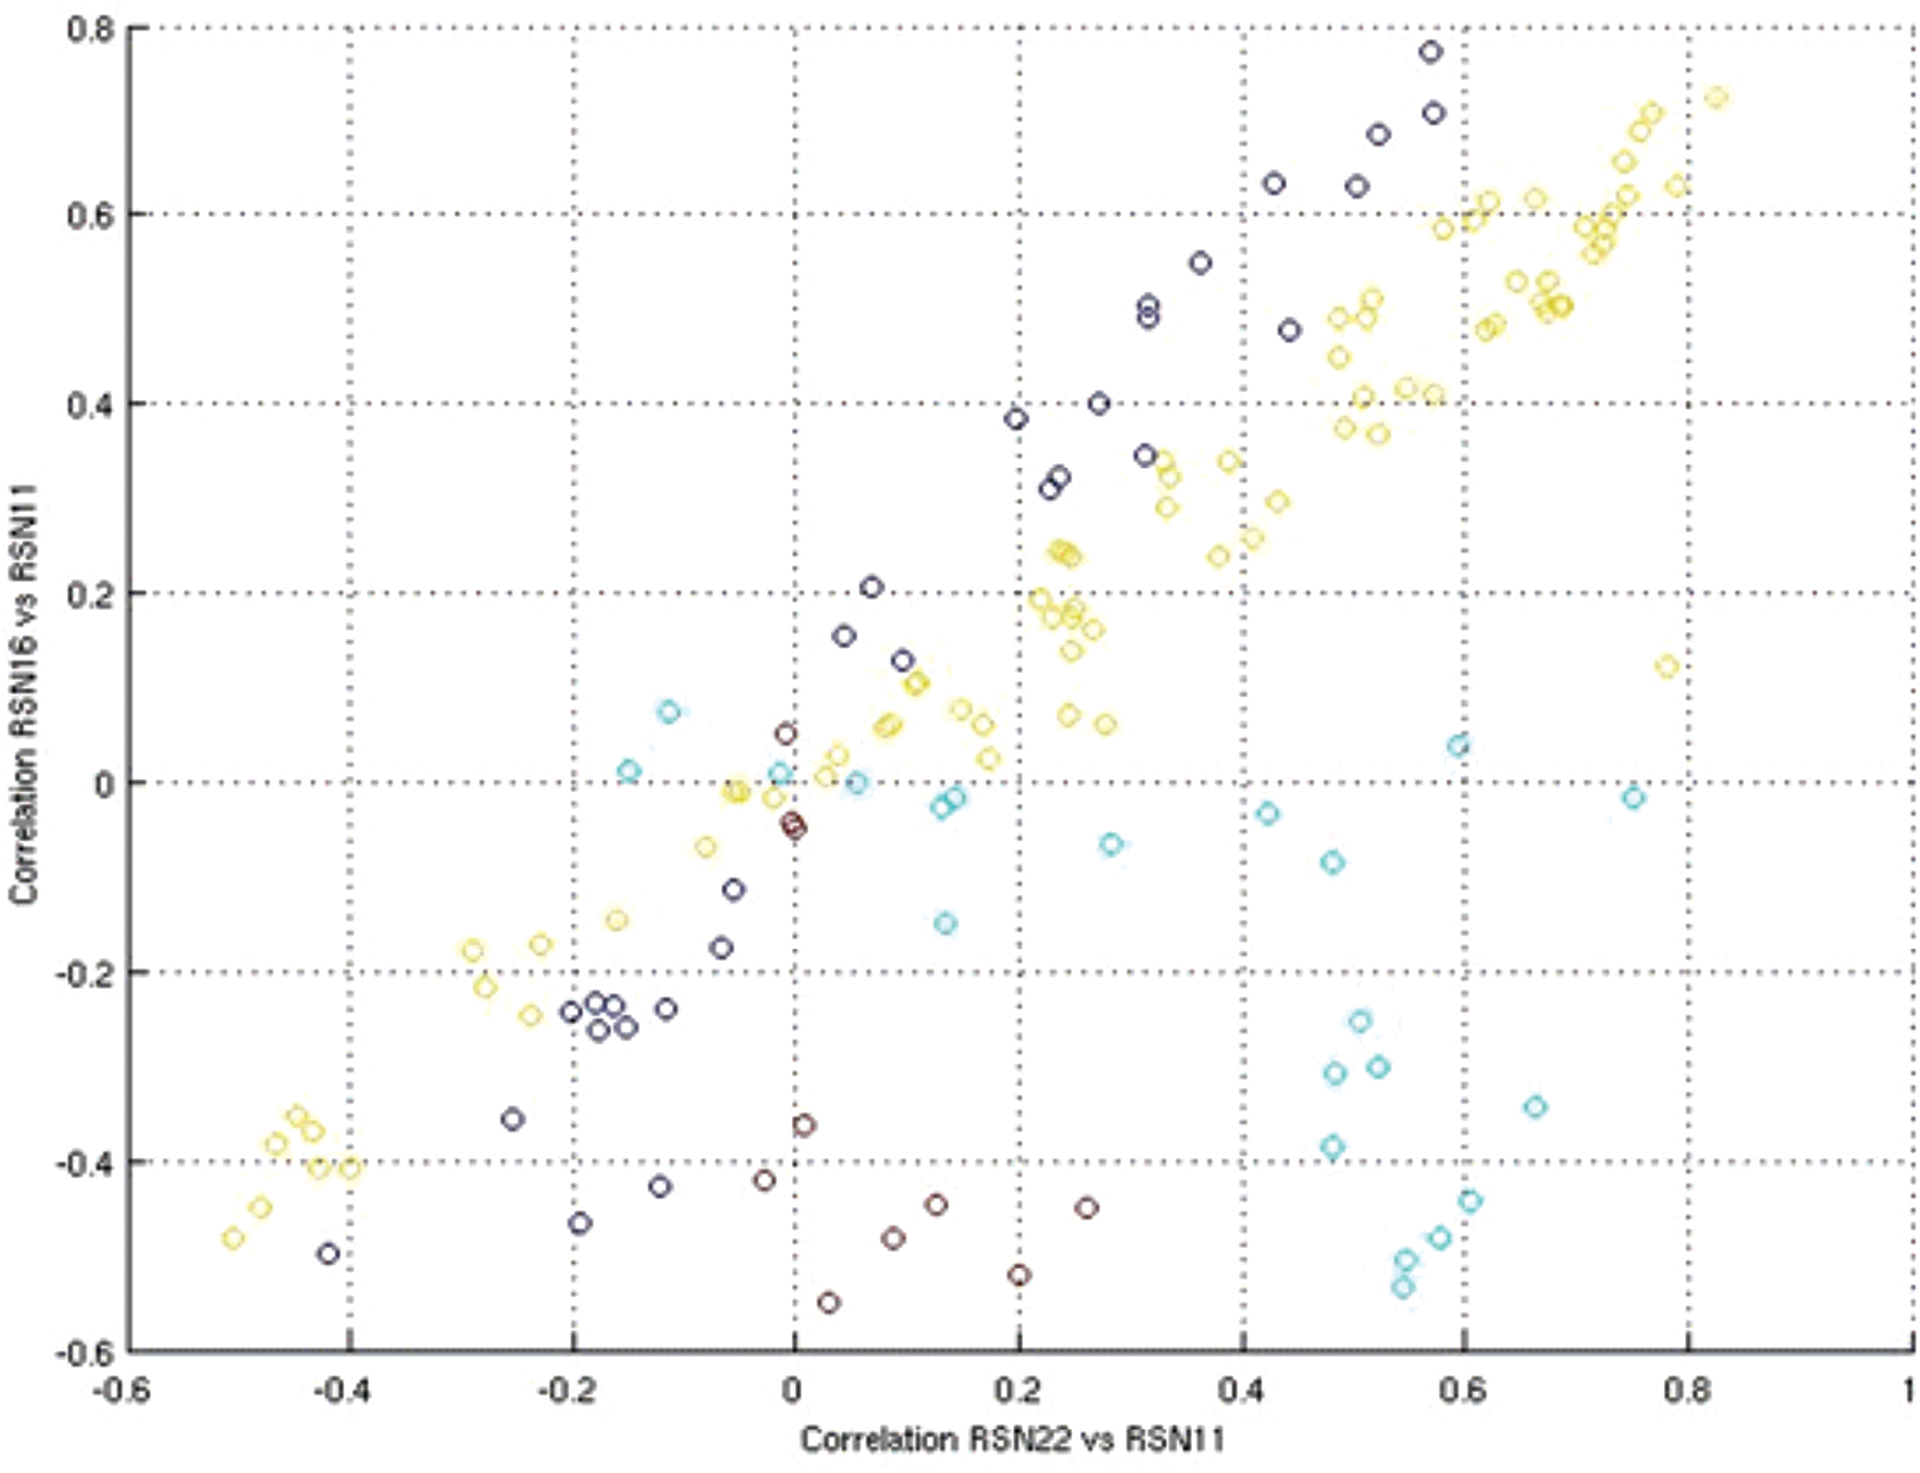
Question: Very limited knowledge about the resting state networks (RSNs) in monkeys is currently available. Although functional networks in anesthetized monkeys resemble those already documented in humans at rest, so far no systematic inter-species comparison has been conducted on RSNs. In this study, we compare monkey and human RSNs in a potentially unbiased manner by means of data-driven methods to test the hypothesis that monkeys and humans have similar intrinsic brain architecture.
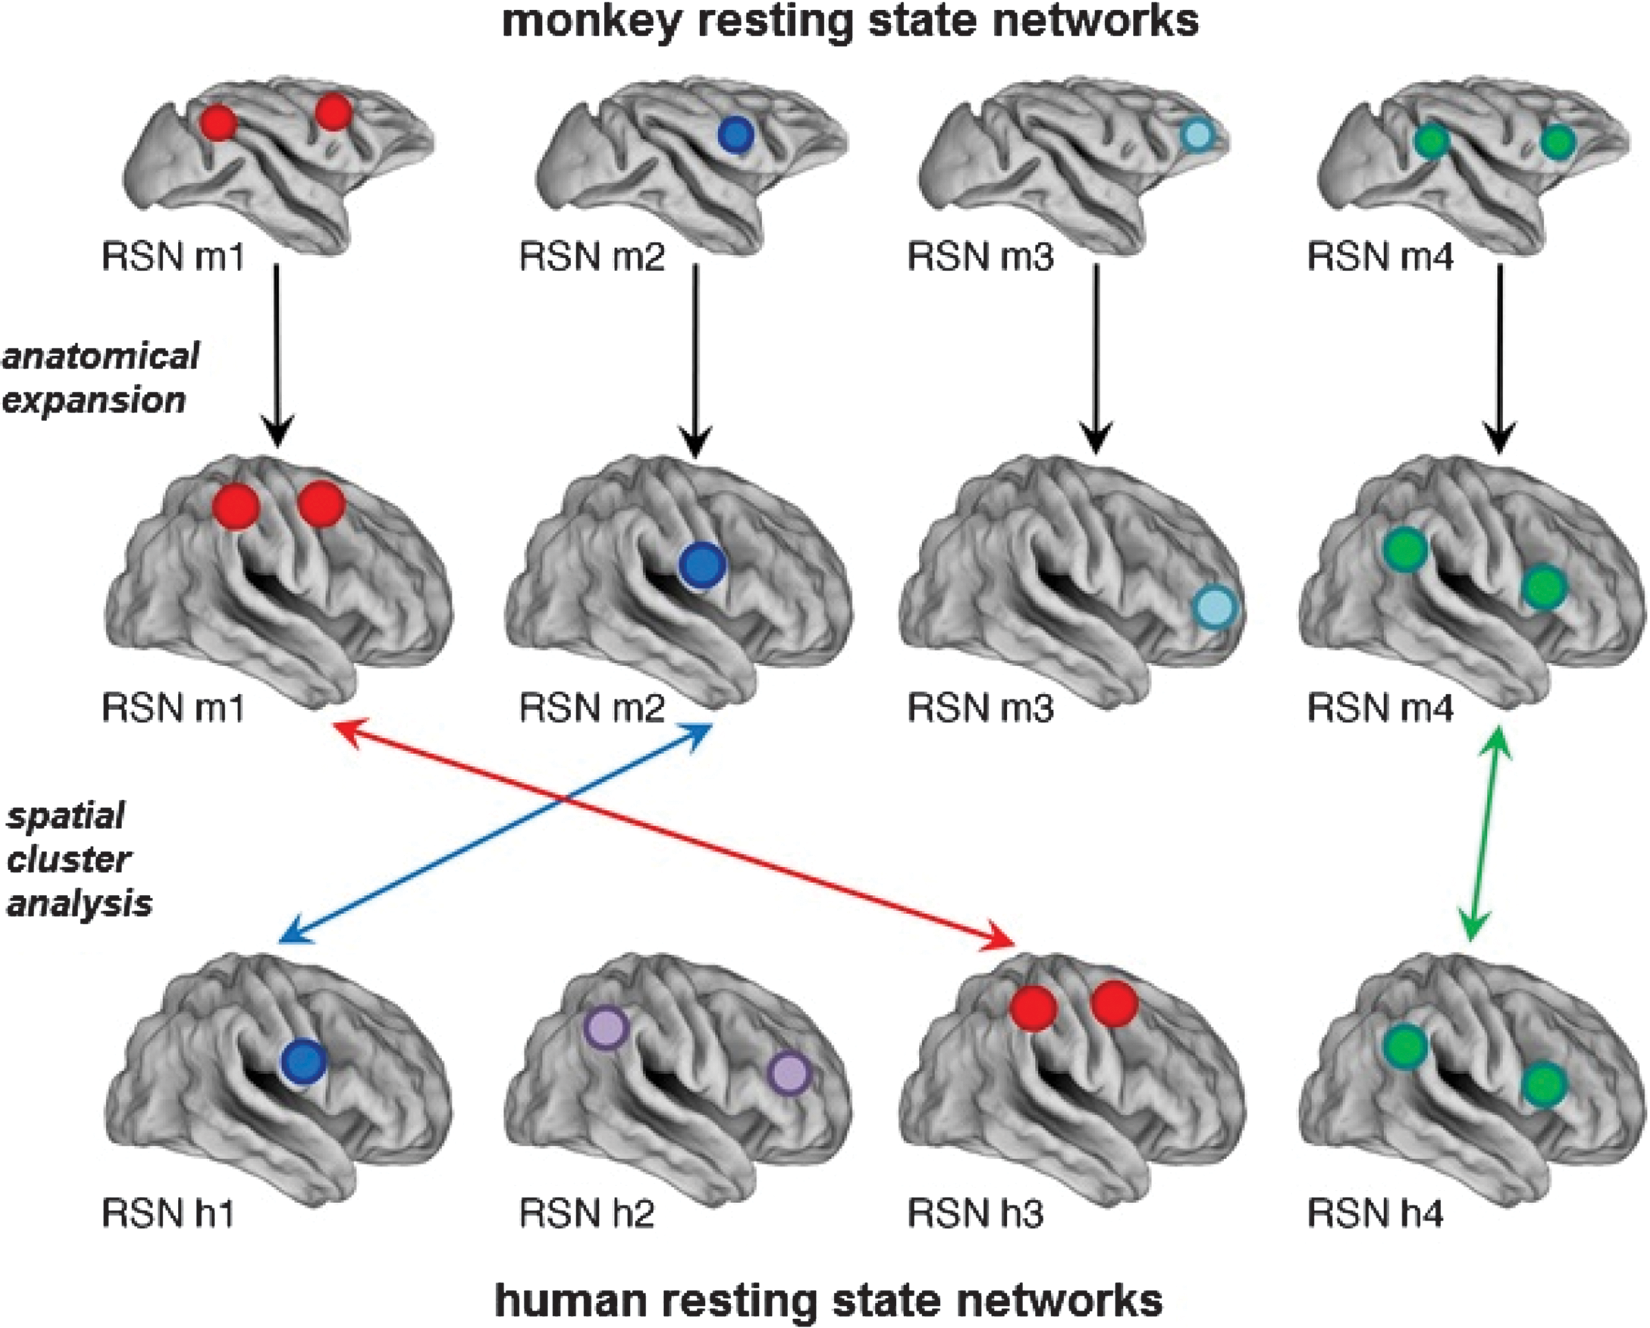
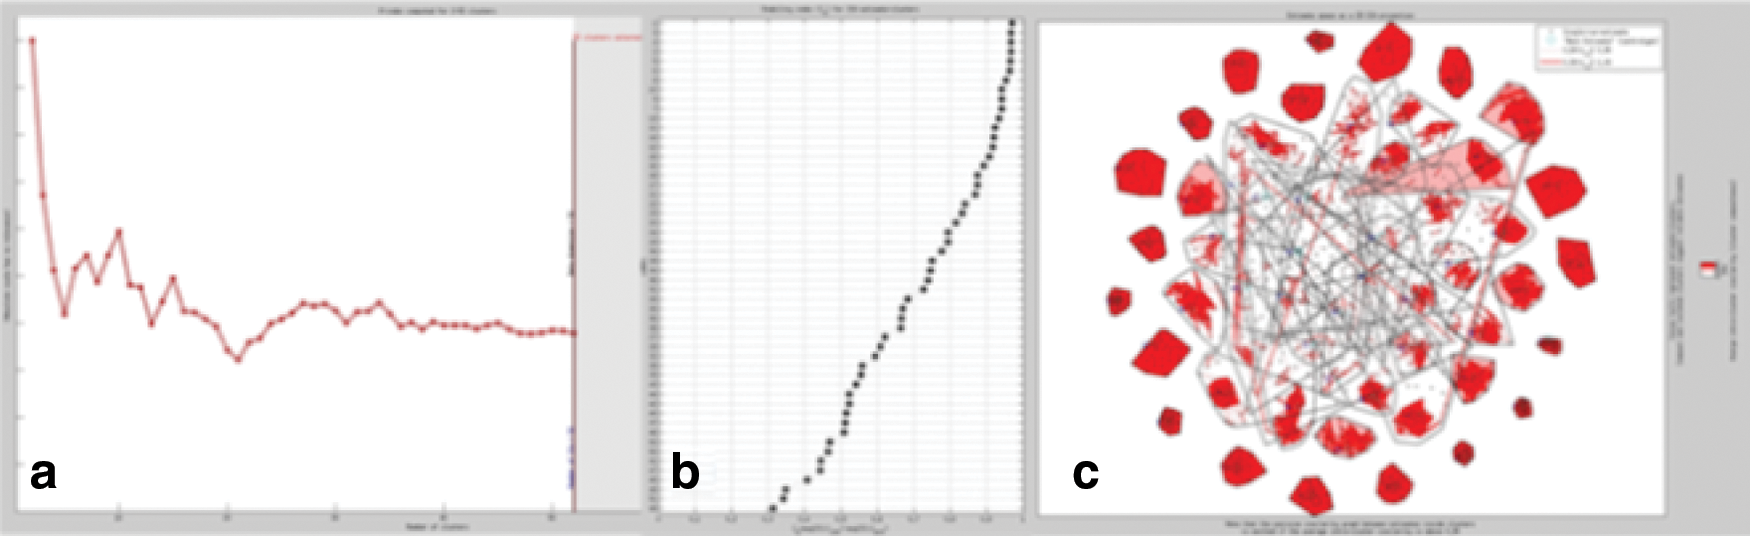
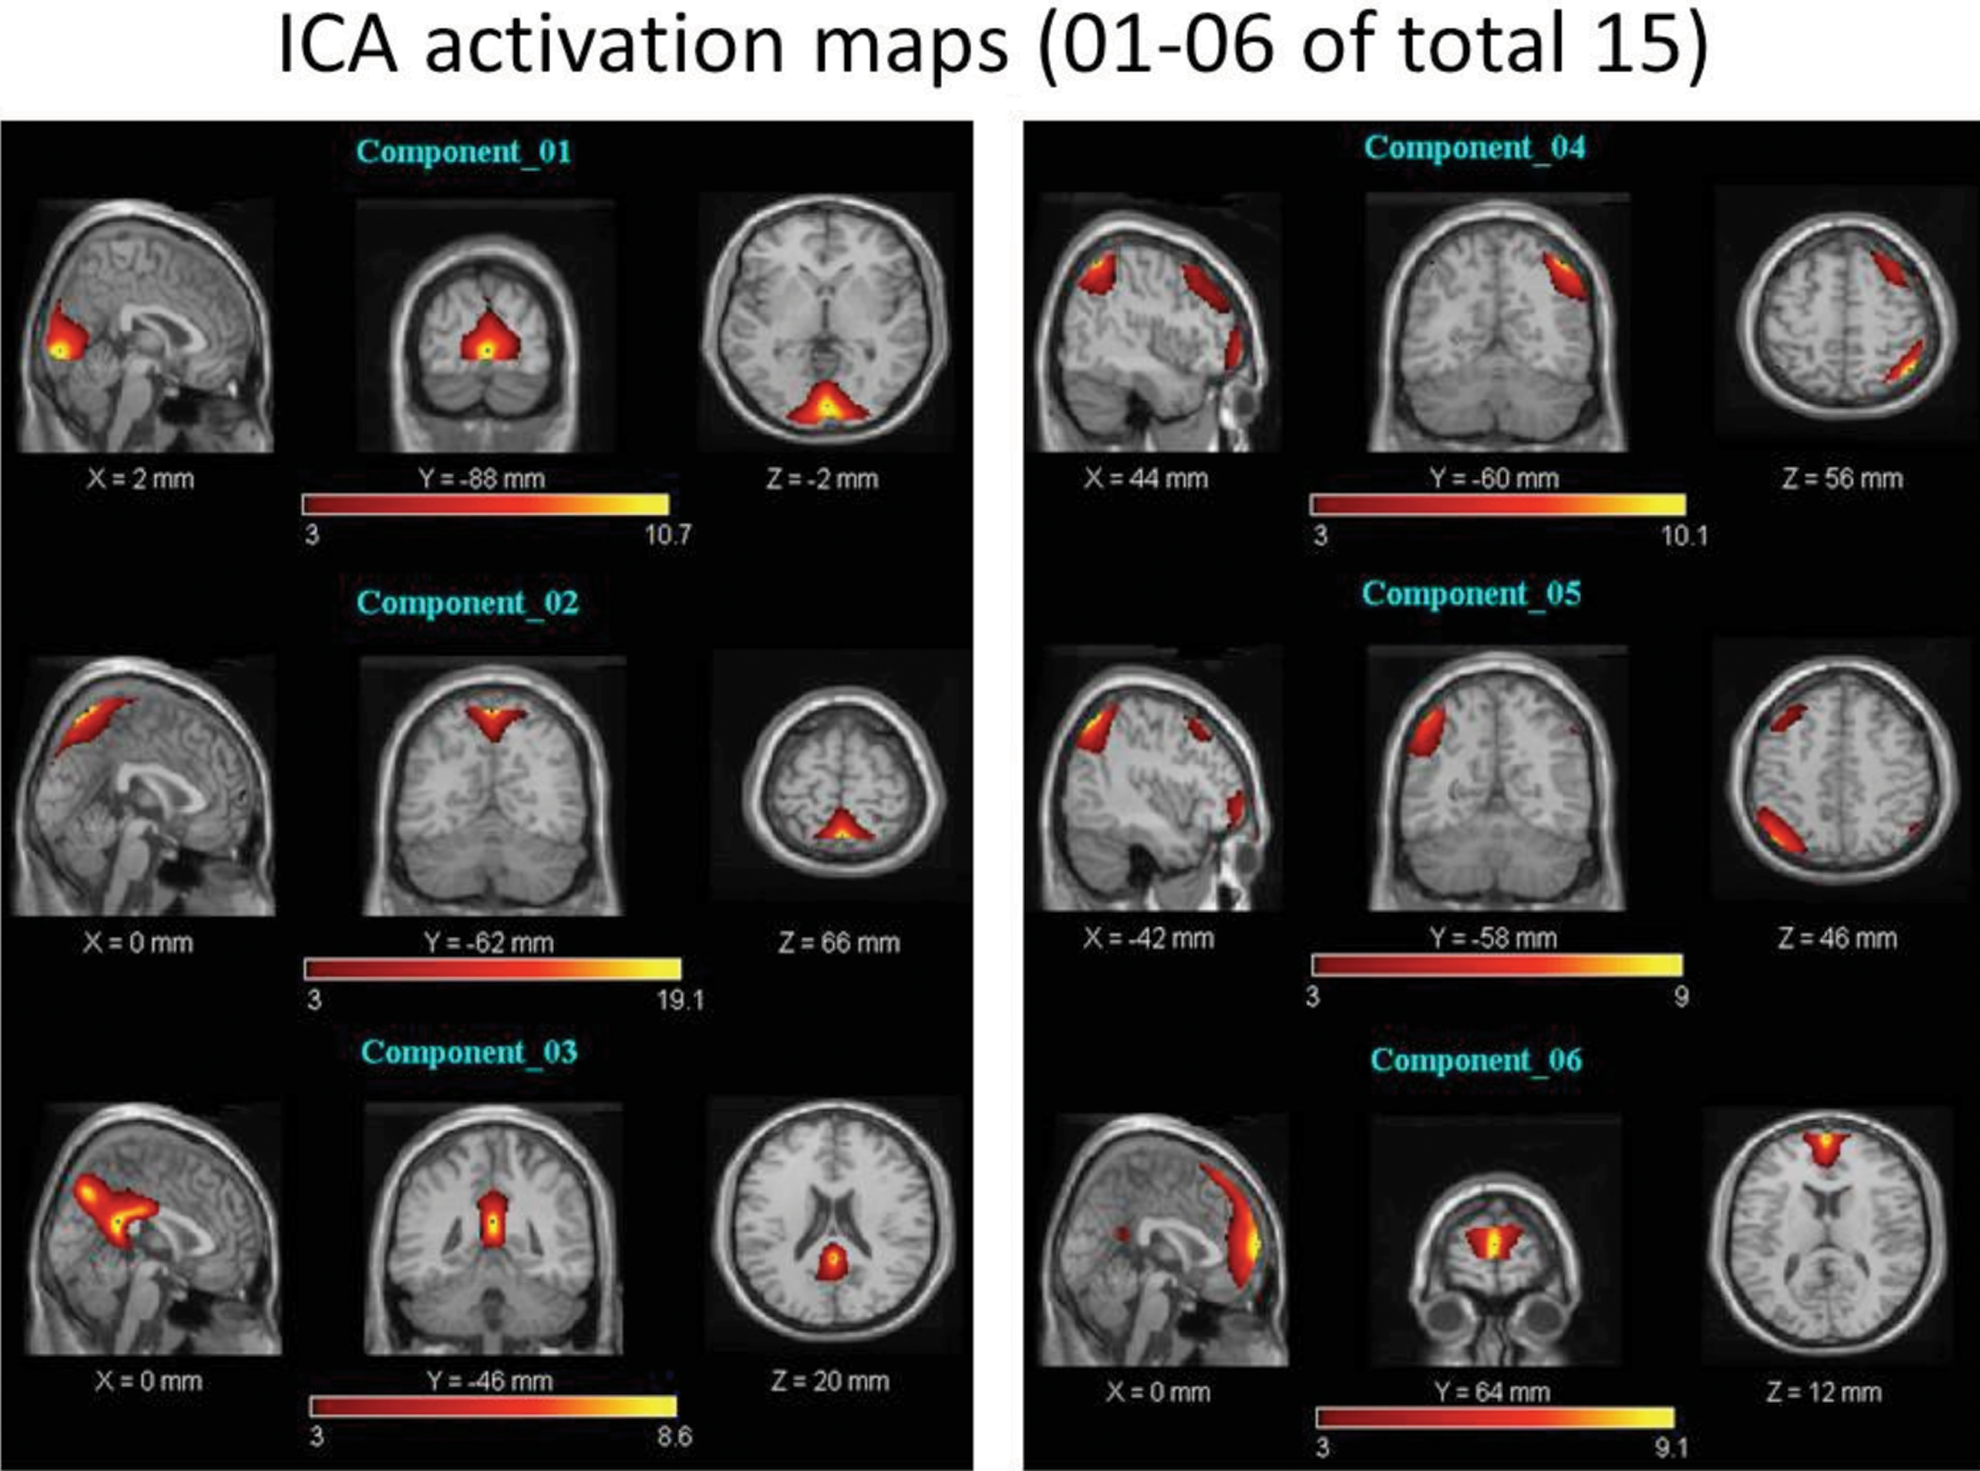
Methods: fMRI data were collected in 4 macaques and 24 healthy humans by 3T MR scanners, installed in the KU Leuven and Chieti University, respectively. Participants were scanned at rest, during eyes-open fixation. We first performed independent component analysis (ICA) on resting state data to delineate monkey and human networks. Next, after warping the monkey maps to human space by cortical expansion, we spatially compared their maps using a hierarchical cluster analysis (Fig 1).
FIG. 1.
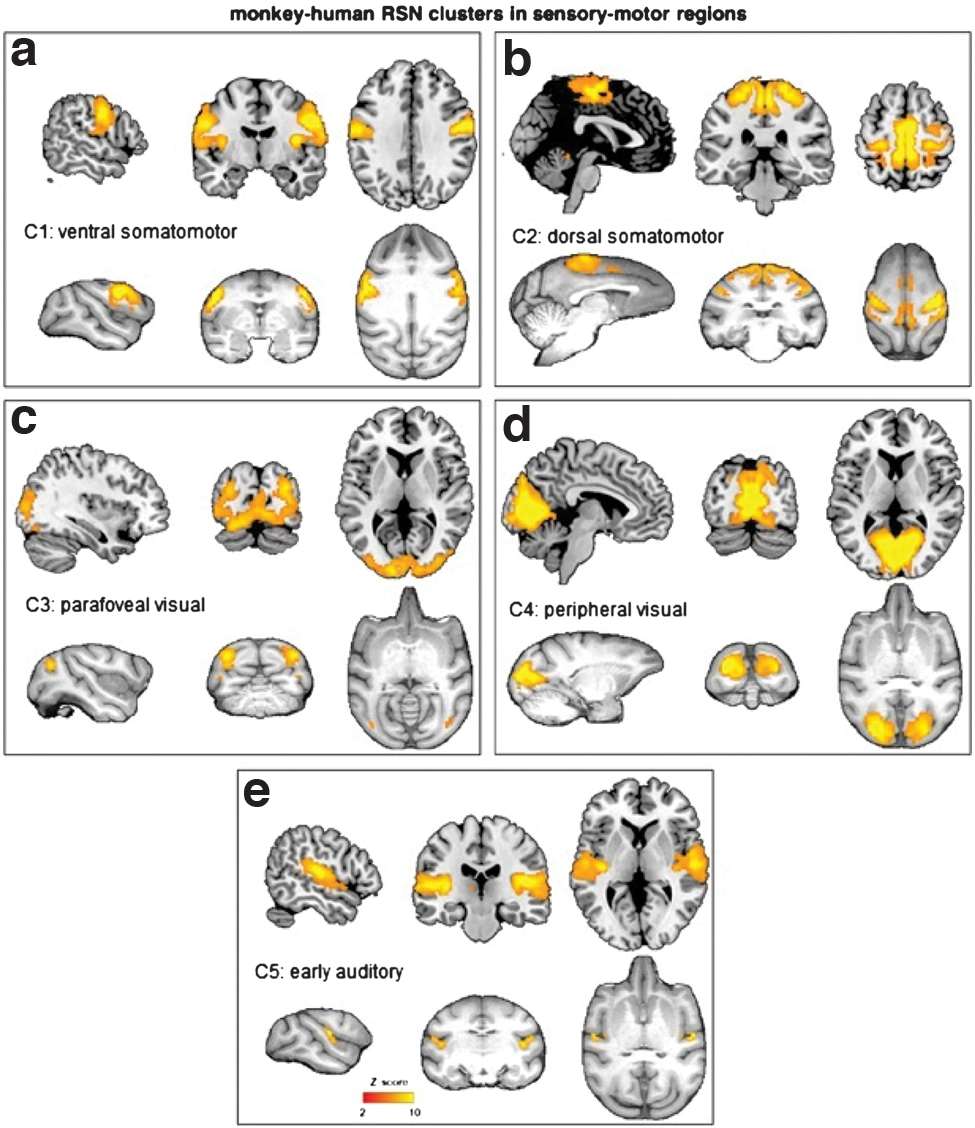
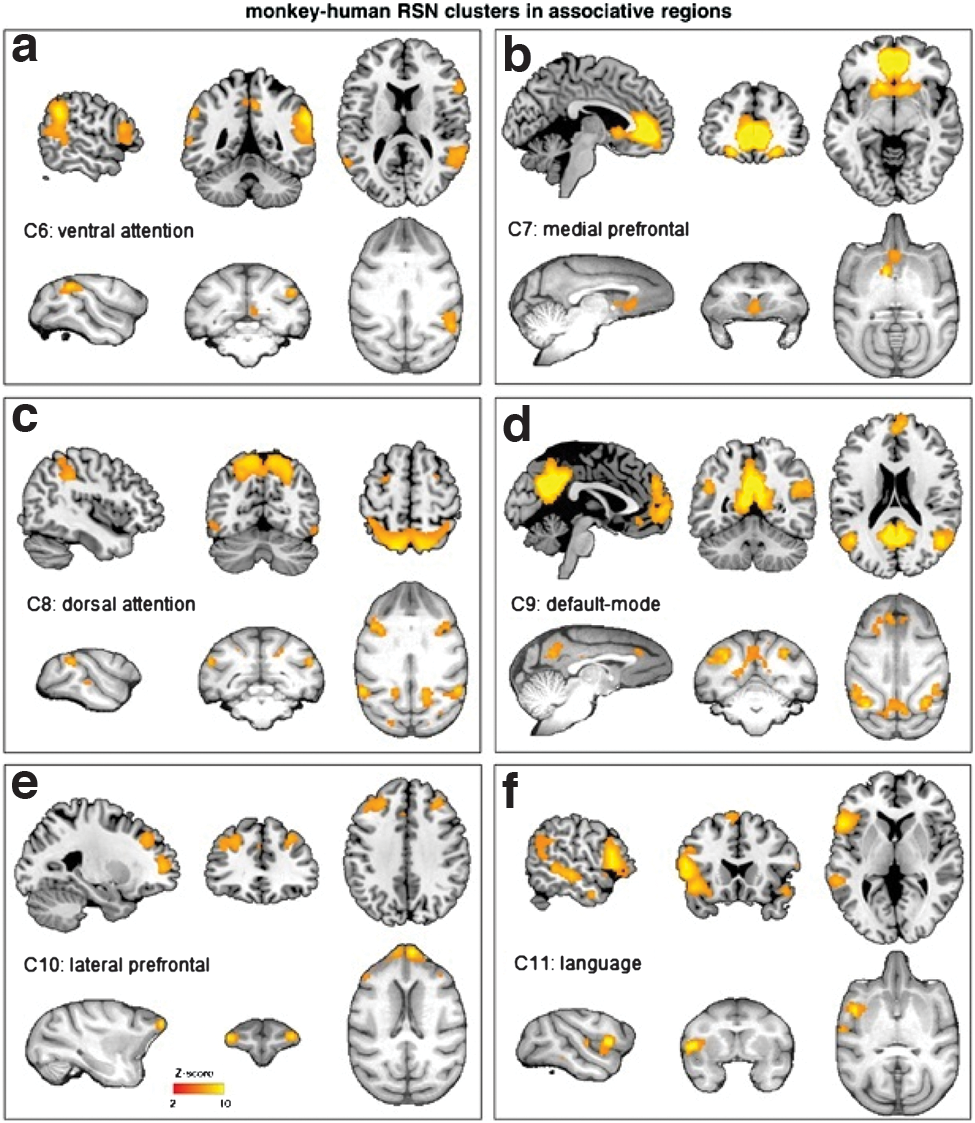
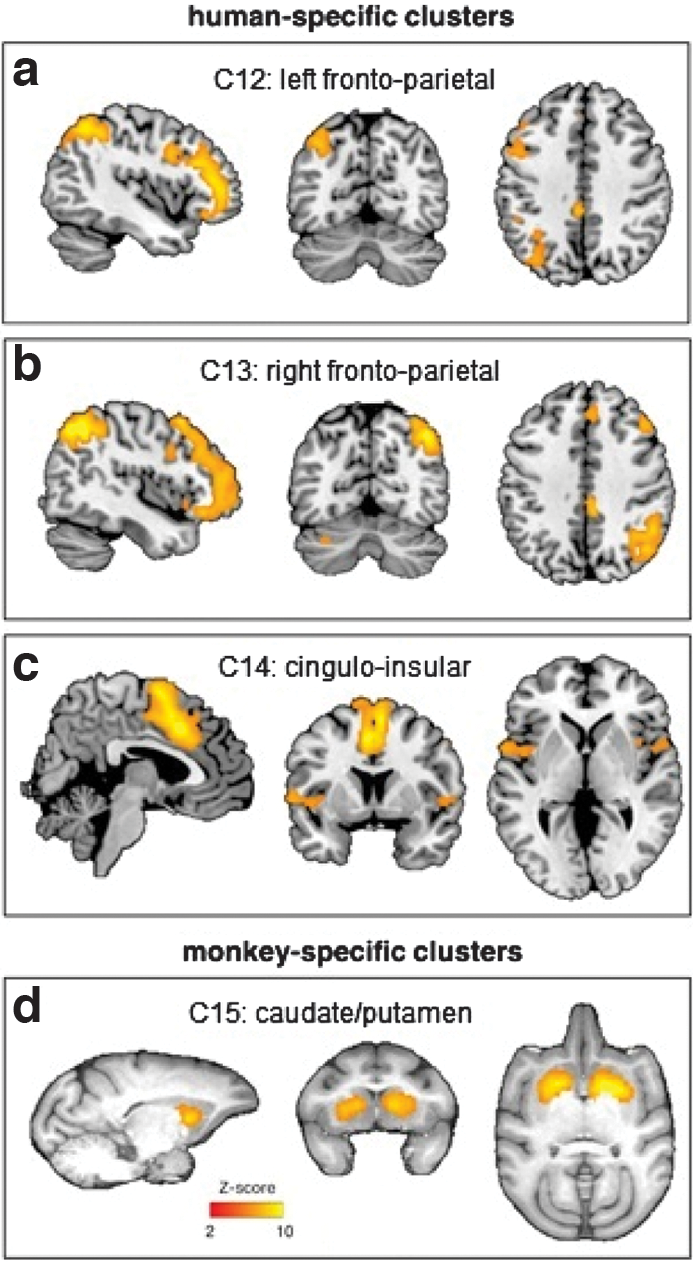
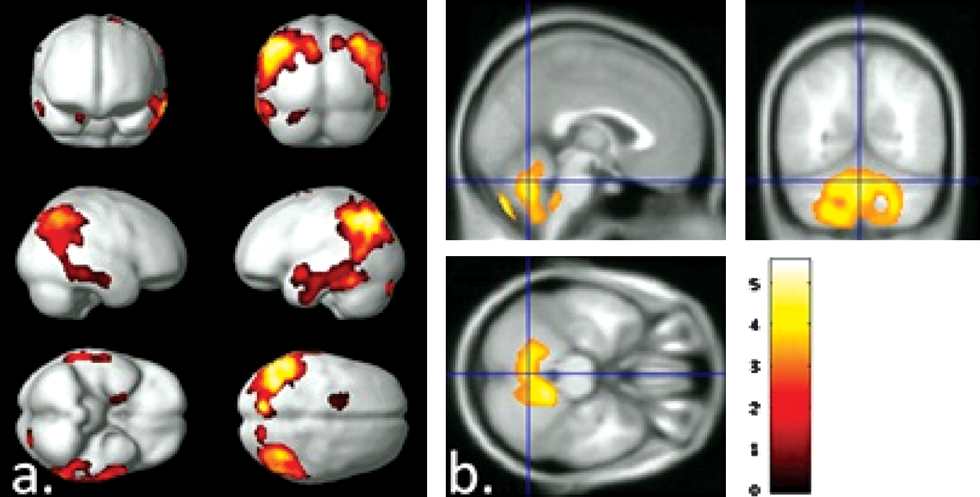
Results: ICA processing of resting-state fMRI data revealed in total 12 monkey and 14 human RSNs. Their spatial clustering produced in total 15 clusters, among which 11 clusters contained one monkey and one human RSN, and the other clusters contained either one monkey or one human RSN. Among the 11 monkey-human clusters, 5 spanned sensory-motor regions. The constituent RSNs showed striking topological similarities between species (Fig 2). The similarities in the remaining 6 monkey-human clusters were less pronounced. Importantly, we observed in these clusters monkey equivalents for the human ventral attention and language networks (Fig 3). Furthermore, we revealed three human-specific cortical and a single monkey-specific subcortical clusters (Fig 4). The human-specific clusters contained networks located in cortical regions with largest degree of anatomical expansion from monkeys to humans. And presumably related to error-recognition, procedural and abstract reasoning respectively.
FIG. 2.
FIG. 3.
FIG. 4.
Conclusions: We revealed a large number of spatially correspondent brain networks in monkeys and humans, spanning sensory-motor and associative regions. Nonetheless, in associative regions with largest evolution-driven expansion we also identified human-specific networks with no equivalents in the monkey. Our findings provide valuable experimental evidence to refine current theories on brain evolution, which are aimed to explain how human-specific cognitive abilities emerged.
University of Liège, Coma Science Group, Cyclotron Research Center & Neurology Department, Liège, Belgium
University of Liège, CHU Radiology department, Liège, Belgium
University of Liège, CHU Anesthesiology department, Liège, Belgium
Global breakdown of fMRI resting state network connectivity in patients with disorders of consciousness
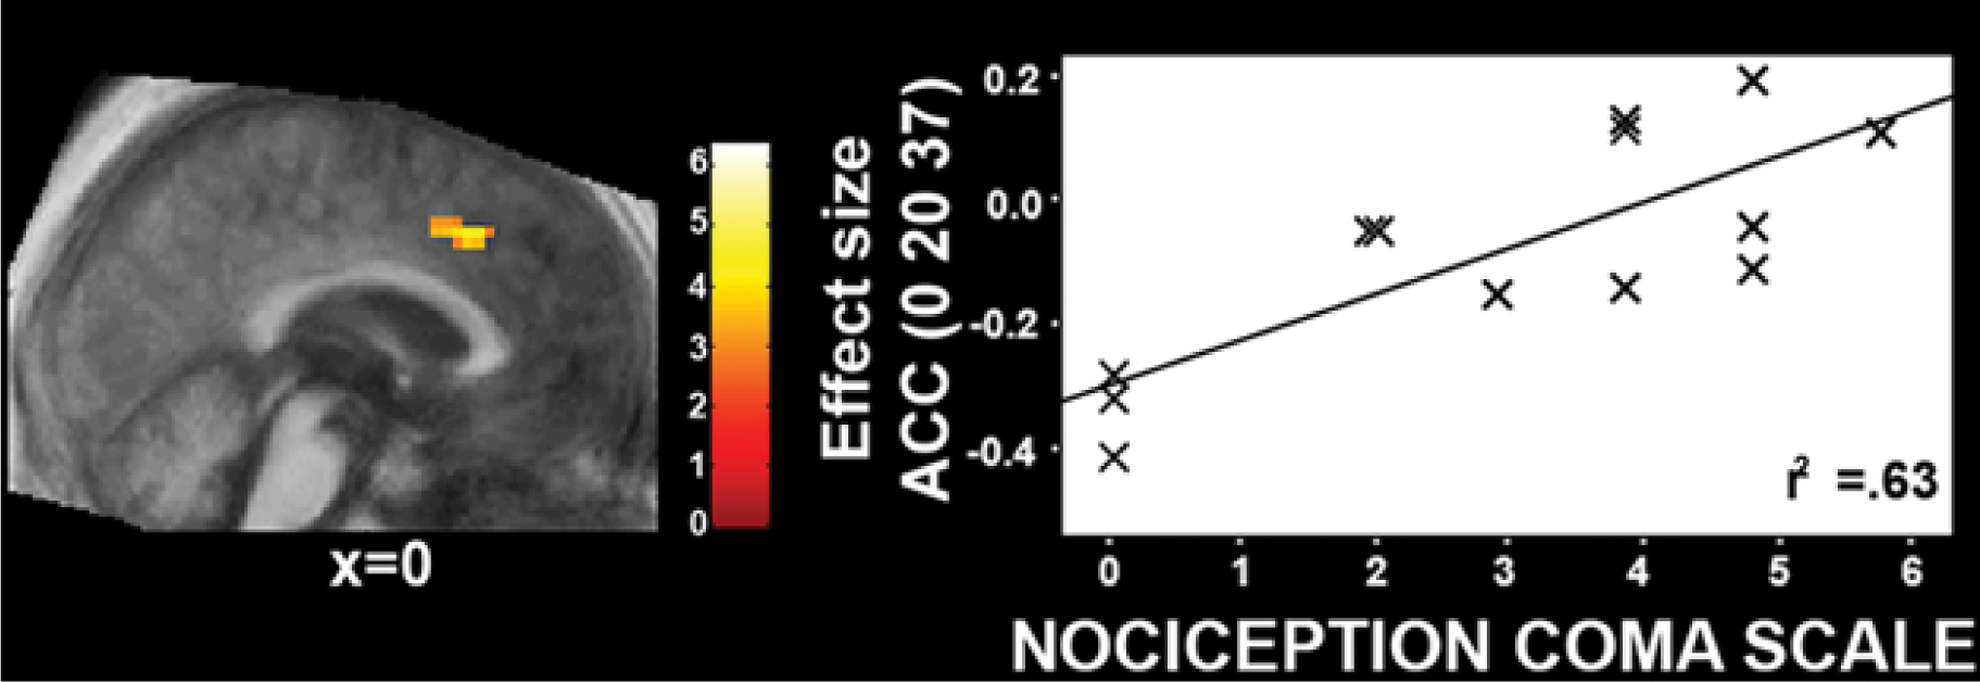
Question: fMRI functional connectivity studies in resting conditions (i.e., eyes closed, no task performance) do not require sophisticated experimental setup and surpass the need for subjects' active participation. Therefore, the resting state paradigm is a suitable means to study residual brain function in non-communicative patients with disorders of consciousness, such as coma, “vegetative state”/unresponsive wakefulness syndrome and minimally conscious state. We here aimed to assess fMRI connectivity in multiple cerebral networks in resting conditions, including the default mode and its anticorrelated network, the left and right frontoparietal, salience, sensorimotor, auditory and visual networks. As the issue of pain in patients with disorders of consciousness raise medical and ethical concerns, we further aimed to regress clinical “pain” scales scores (i.e., Nociception Coma Scale) with the functional integrity of the salience network.
Methods: Three hundred fMRI scans were obtained in 22 healthy volunteers, 2 locked-in, 11 minimally conscious, 12 “vegetative”/unresponsive and 5 comatose patients (11 women; mean age: 52±17 years; 15 of non-traumatic, 7 of anoxic etiology). Functional connectivity was investigated with a seed region correlational approach on a priori coordinates for each network.
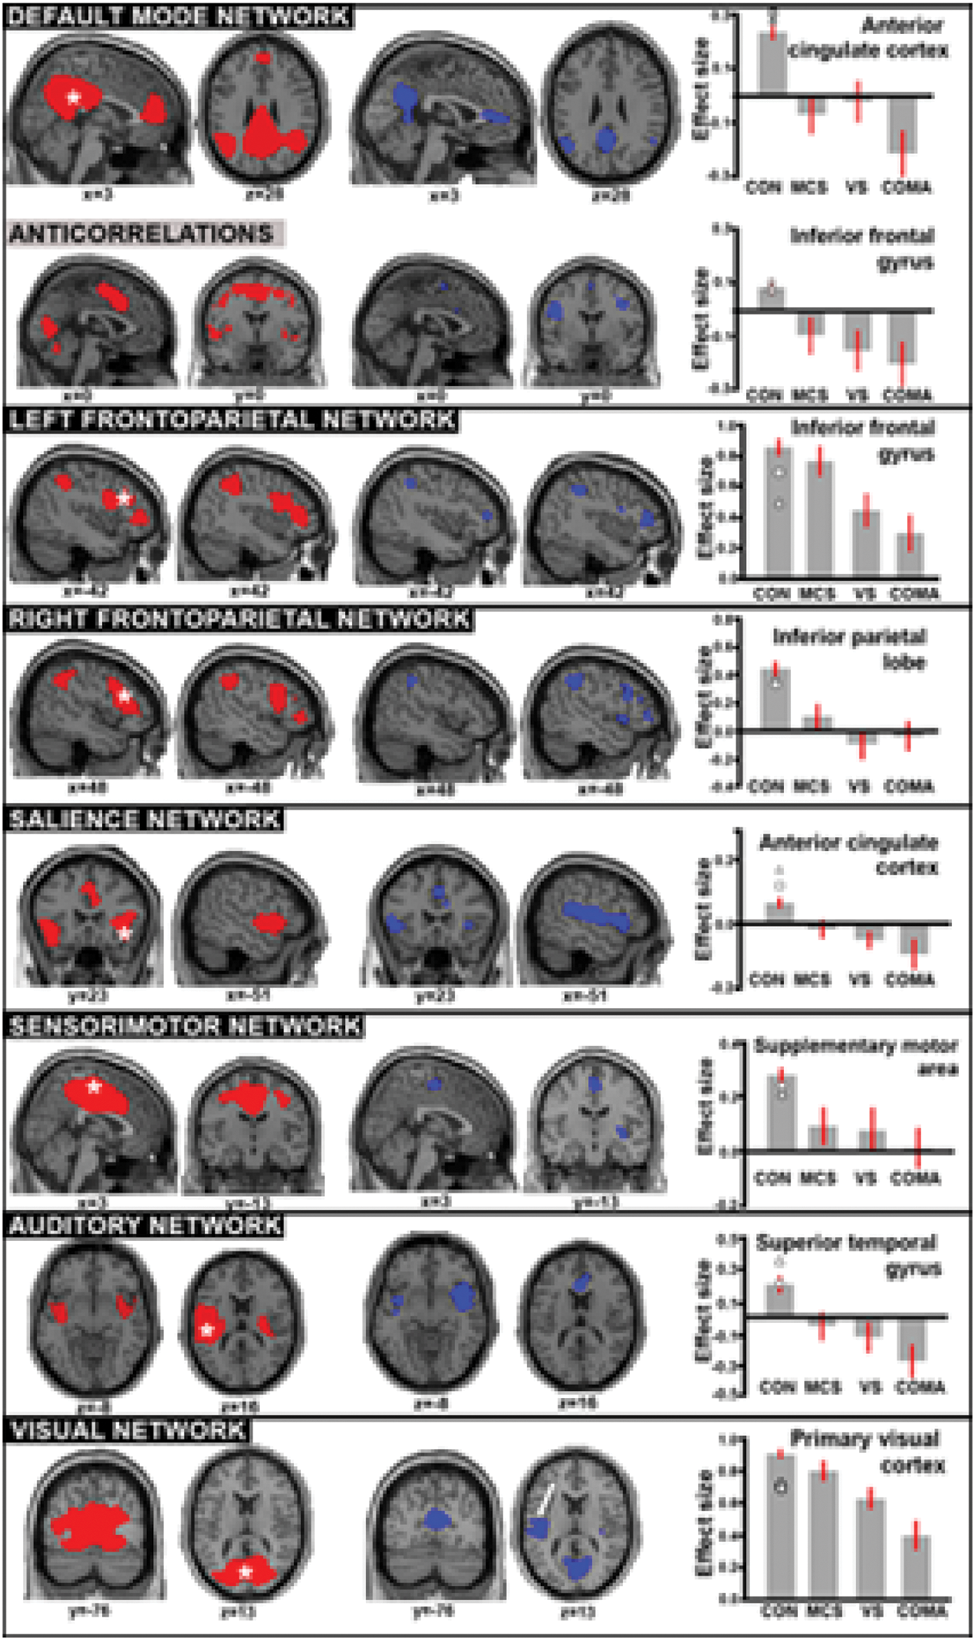
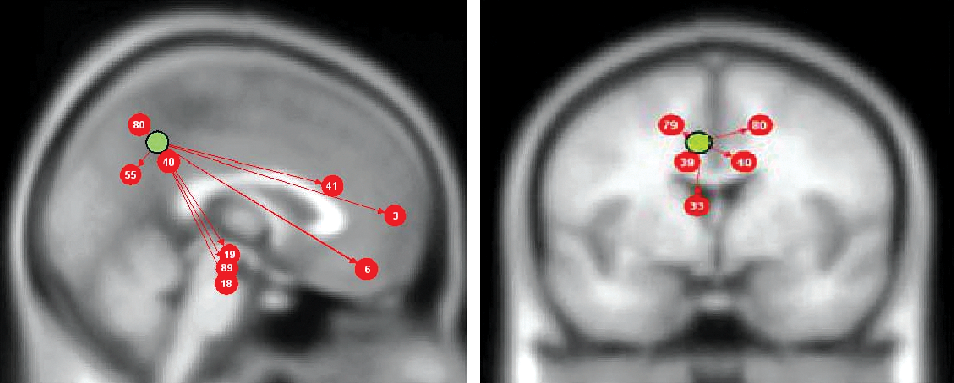
Results: Between-group comparisons showed both intra- and inter-network consciousness-level dependent decreases in functional connectivity, ranging from healthy controls and locked-in syndrome to minimally conscious, “vegetative”/unresponsive and coma patients. A disruption in crossmodal interaction between visual and auditory cortices as a function of the level of consciousness was further observed (Fig 1). “Vegetative”/unresponsive and minimally conscious patients' Nociception Coma Scale scores showed a positive correlation with the salience network functional connectivity (Fig 2).
FIG. 1.
FIG. 2.
Conclusions: Our results demonstrate a global breakdown in cortico-cortical connectivity in sensory and sensorimotor networks as well as “higher-order” networks, possibly accounting for patients' limited capacities for conscious cognition. The observed positive correlation between the Nociception Coma Scale scores and the salience network connectivity potentially reflects nociception-related processes in these patients measured in the absence of an external stimulus. Our results point to the utility of resting state analyses in clinical settings where short and simple setups are preferable to activation protocols with auditory visual or somatosensory stimulation devices.
Data Analysis
LohmannG.1MarguliesD.1SchaeferA.1TurnerR.1
Max Planck Institute for Human Cognitive and Brain Sciences, Leipzig, Germany
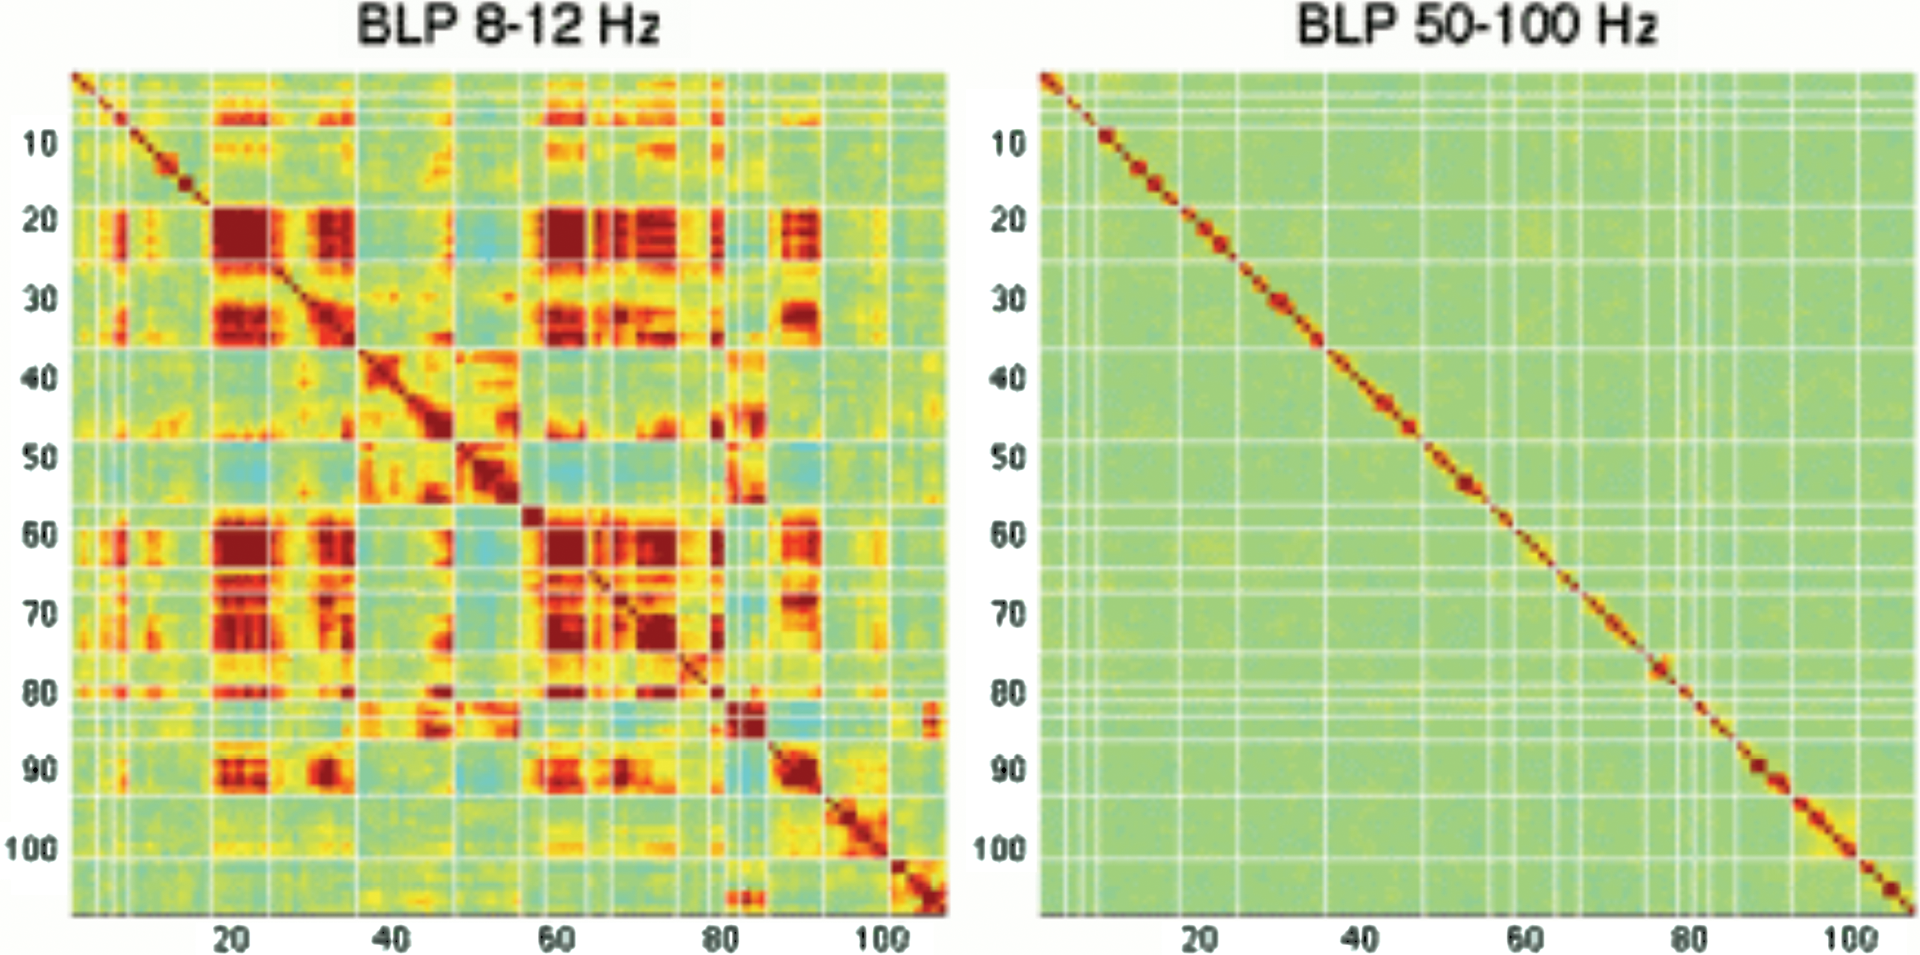
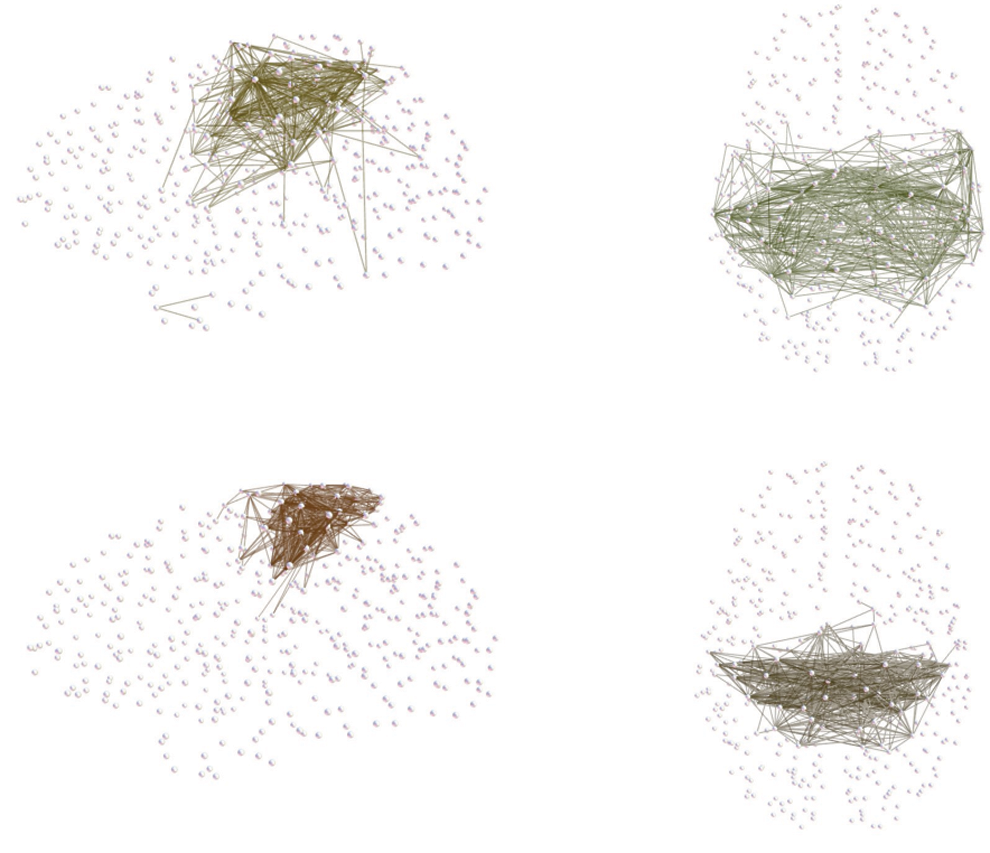
Non-negative matrix factorization of fMRI data using spectral coherence
Introduction: Factorization into independent components (ICA) has become a standard procedure in fMRI data analysis. Here we present an alternative factorization using non-negative matrix factorization (NMF). NMF can be seen as a form of blind source separation with non-negativity constraints. In contrast to ICA, the components obtained by NMF are not designed to be independent and may potentially overlap which may provide greater realism. It also allows various metrics for defining similarity. NM factorizations are generated by an iterative process and the resulting factorizations are not necessarily unique. Here, we apply NMF to matrices containing pairwise similarities between fMRI time courses with similarity defined by spectral coherence. We hypothesized that different spectral bands may lead to distinct decompositions. To test this hypothesis we applied NMF using a range of different starting values. Non-robust results would falsify this hypothesis.
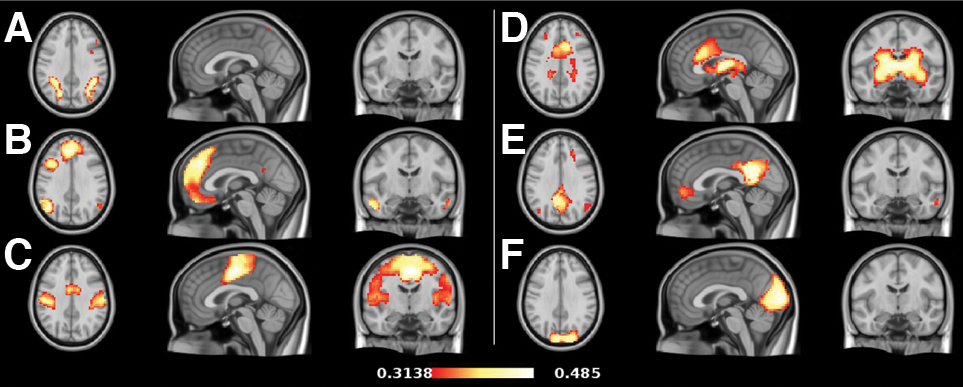
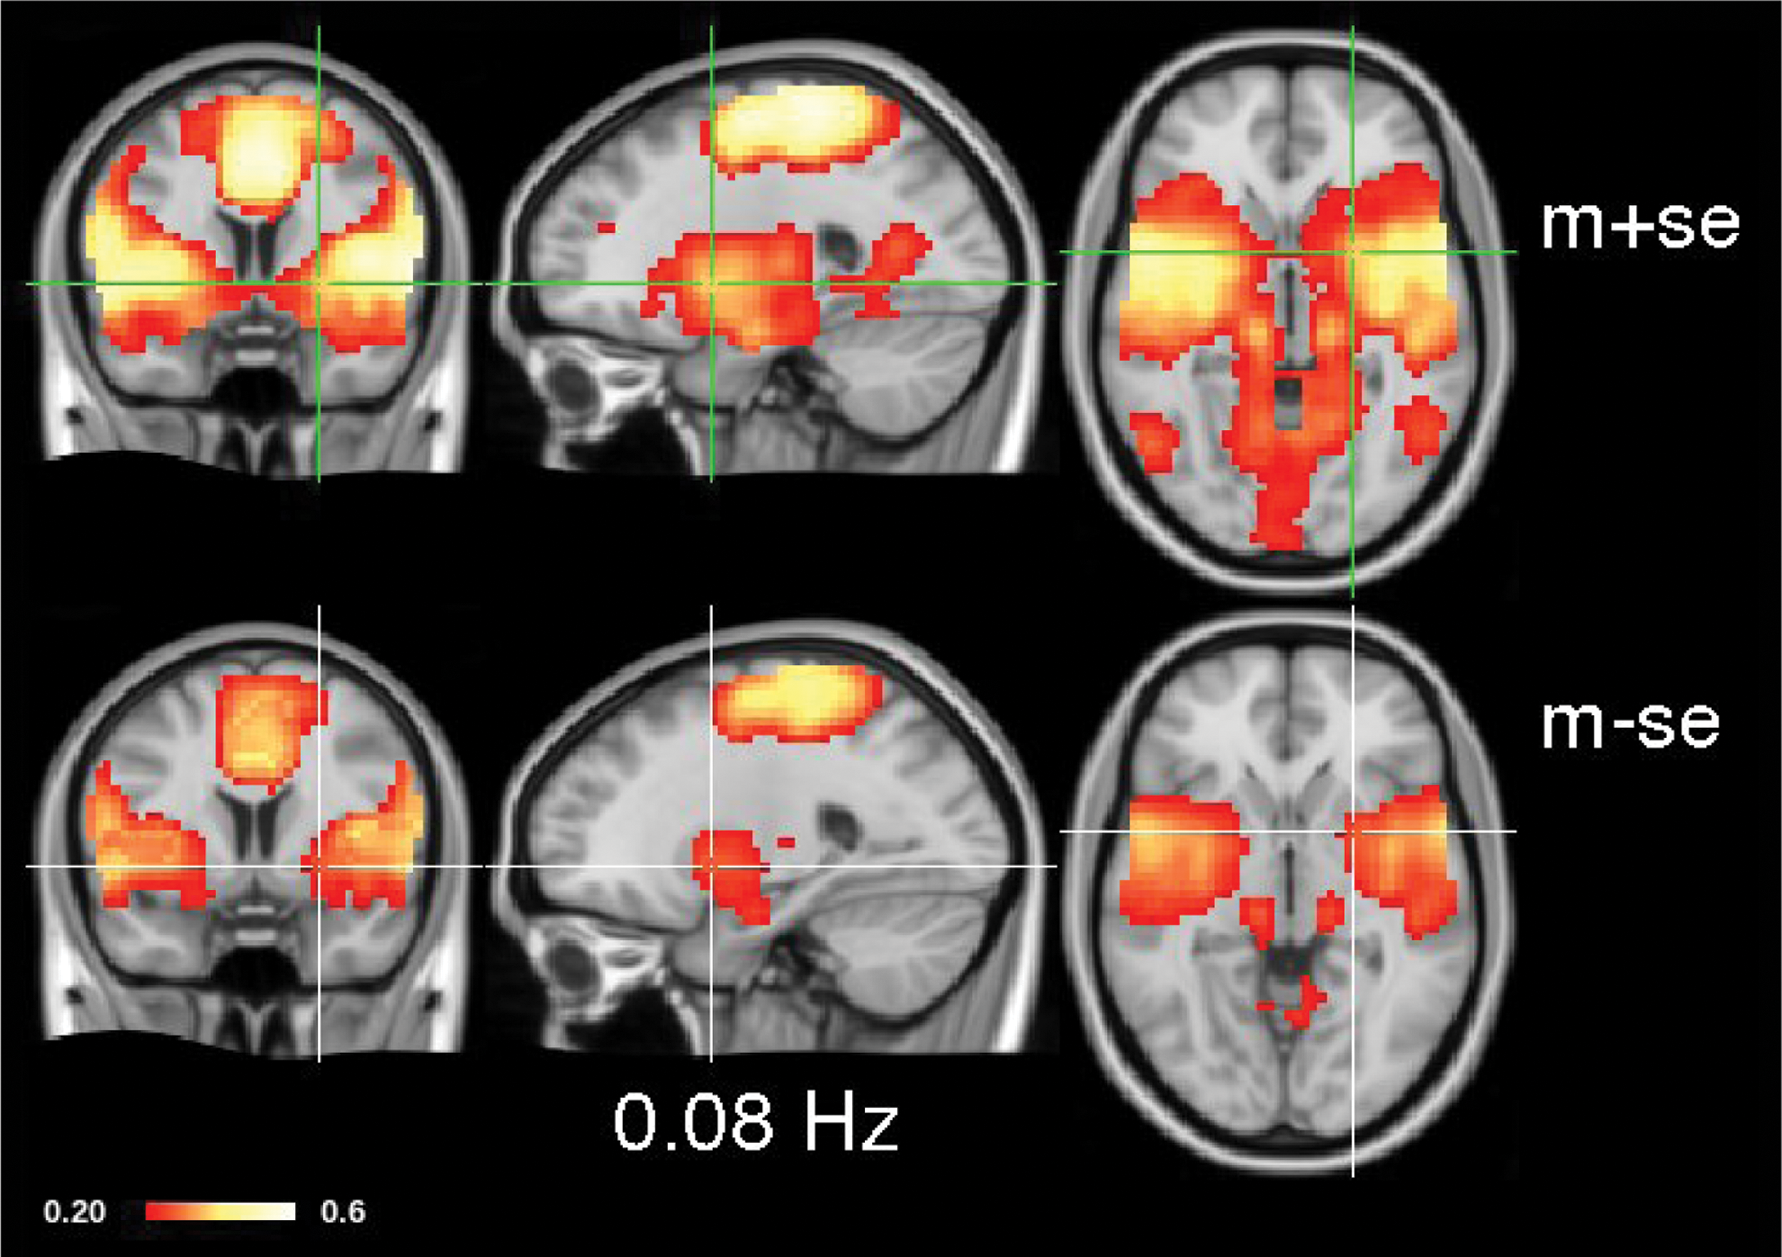
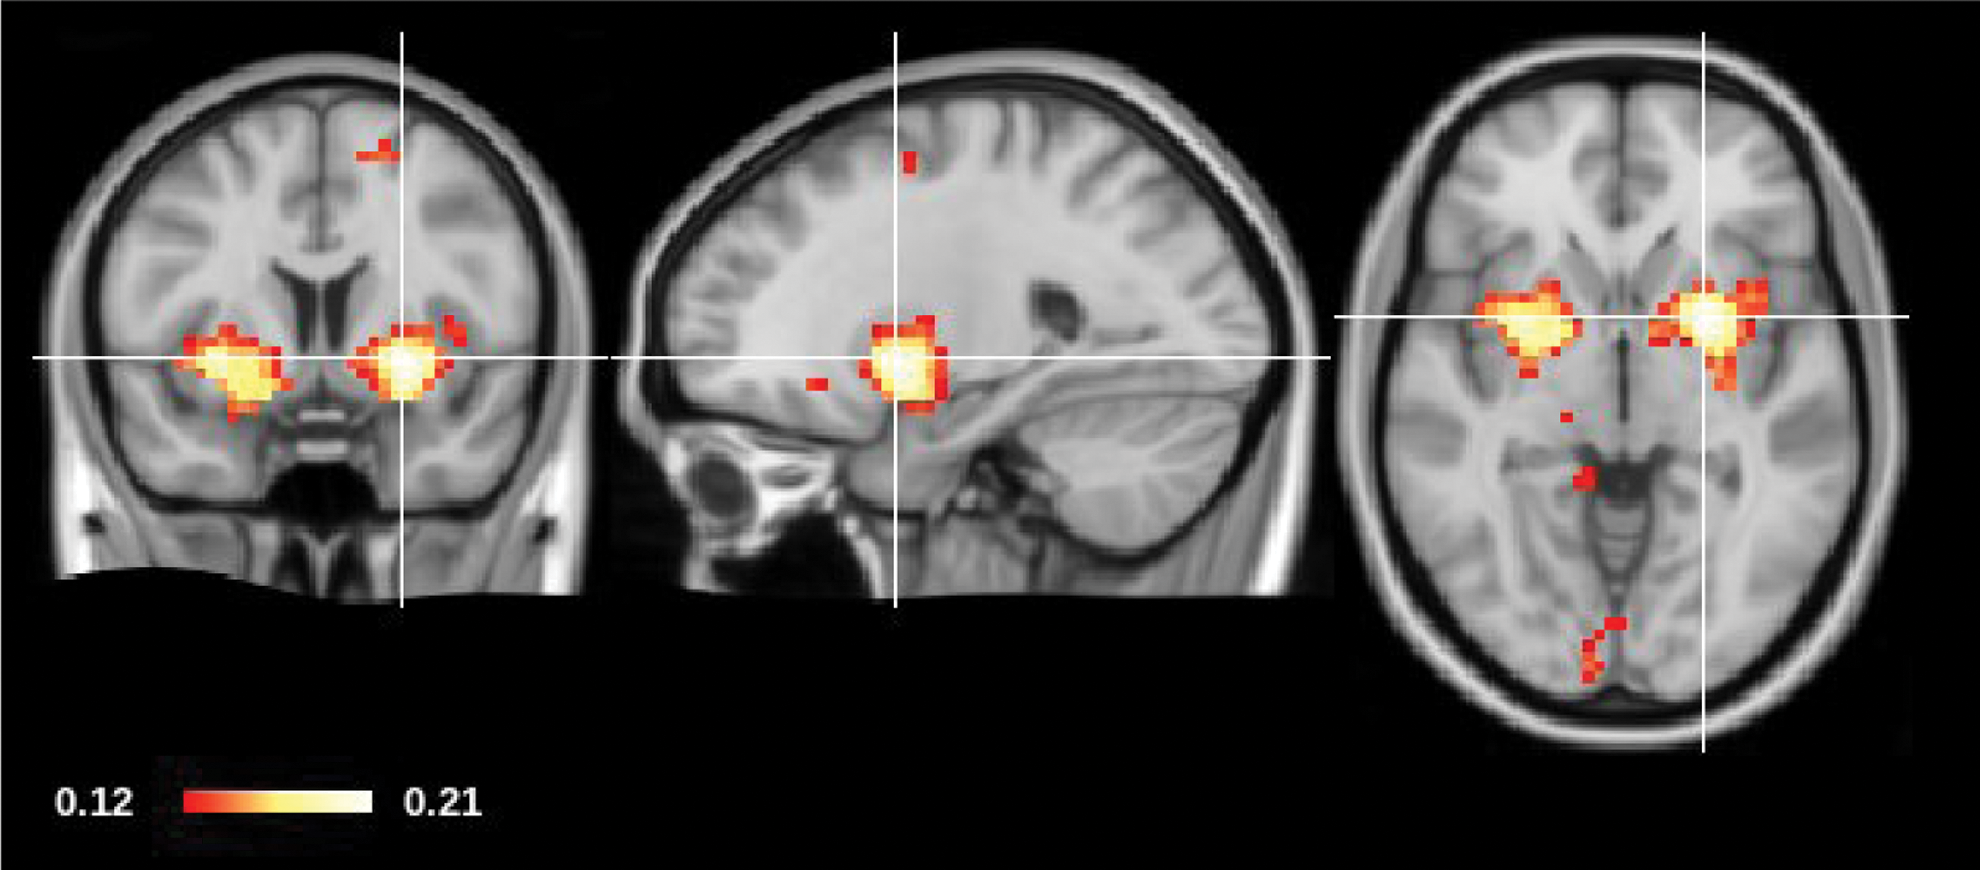
Methods and Results: Functional resting state MRI/EPI data were acquired of 22 normal volunteers on a 3T MRI scanner (Siemens Trio) using TR=2.3 sec, TE=30ms, 3×3 mm2 in-plane resolution, 3 mm slice thickness, 1mm gap between slices. Data were acquired for 6.5 minutes during which subjects were asked to fixate on a fixation point. All data sets were initially registered to an AC/CP coordinate system where the data were resampled to an isotropic voxel grid with a resolution of (3 mm)3. We manually defined a mask containing about 40,000 voxels covering the entire cerebrum. We then computed a similarity matrix V containing spectral coherence at 0.08 Hz and 0.04 Hz between fMRI time series computed pairwise within this mask and averaged across the 22 subjects. These two matrices were factorized using NMF so that V=W H+e, where W is a matrix of 6 basis vectors, H is a matrix of weights and e residual errors. We used the ALS algorithm with 15 different starting values. We analyzed the variation across different starting values and differences between the spectral bands. Results are shown in the figures.
Conclusion: In contrast to ICA, NMF allows investigation of a range of metrics defining components and allows component overlap. NMF may thus prove to be a valuable alternative. As hypothesized, we found striking differences between spectral bands. The standard error across repetitions was small, indicating that consistent results can be obtained.
All 6 NMF components averaged over 15 starting values using spectral coherence at 0.08 Hz.
Component C with 1.96 times the standard error added and subtracted.
Analogous to figure 2 with spectral coherence at 0.04 Hz.
Difference of the means of component C at 0.04Hz versus 0.08 Hz with maximum in putamen. Similar results were also found in other components.
Animal Imaging
CastellanosF.X.12ColcombeS.3BiswalB.34GuilfoyleD.3MilhamM.35SullivanR.16
NYU Langone Medical Center, Child & Adolescent Psychiatry, New York, United States
Nathan Kline Institute, Child & Adolescent Psychiatry Research, Orangeburg, NY, United States
Nathan Kline Institute, Center for Advanced Brain Imaging, Orangeburg, NY, United States
University of Medicine and Dentistry of New Jersey, Radiology, Newark, NJ, United States
Child Mind Institute, Center for Developing Brain, New York, NY, United States
Nathan Kline Institute, Emotional Brain Institute, Orangeburg, NY, United States
Development of amygdala intrinsic functional connectivity in a rat model of maternal maltreatment
Background and Objectives: Maltreatment from the caregiver induces vulnerability to later life psychopathology. Animal models of early life stress suggest this is due to disruption of neural development of long-distance circuits linking amygdala to prefrontal cortex.
Methods: We used a rat model of early life maltreatment to examine amygdala connectivity using resting-state functional magnetic resonance imaging (R-fMRI). Rat pups were reared by a mother provided with insufficient bedding for nest building or by one with abundant bedding from postnatal days (PND) 8 to 12. In adolescence (at PND 45) and in early adulthood (at PND 60), R-fMRI sessions were conducted under light (∼1%) isofluorane anesthesia. Behavioral tests were obtained in animals reared under identical conditions to model negative affectivity, including the Forced Swim Test, Sucrose Preference Test, and Social Behavior Test.
Results: Behaviors reflecting negative affectivity were seen in both adolescent and adult animals. Amygdala functional connectivity (FC) with frontal, parietal, and basal ganglia, including thalamus, increased significantly with increased age. By contrast, local amygdala FC decreased significantly with age. Additionally, we detected significant interactions between abuse condition and age. Local amygdala FC decreased between PND 45 and 60 in control rats, but increased significantly in abused rats. The reverse pattern was observed for amygdala FC with medial frontal cortex and parietal cortex.
Conclusions: Translation of an in vivo longitudinal imaging approach to a rodent model of early caregiver maltreatment revealed enduring evidence of differences in brain functional connectivity in adulthood that likely underlies negative affectivity and vulnerability to internalizing psychopathology in humans.
Applications: Neurology
AdriaanseS.1Sanz-ArigitaE.2BinnewijzendM.3OssenkoppeleR.1TolboomN.1van AssemaD.1WinkA.M.3BoellaardR.1YaqubM.1WindhorstA.1van der FlierW.4ScheltensP.4LammertsmaA.1RomboutsS.567BarkhofF.3van BerckelB.1
VU medical center, Nuclear Medicine & PET Research, Amsterdam, Netherlands
CITA-Alzheimer Foundation, Radiology, San Sebastian, Spain
VU medical center, Radiology, Amsterdam, Netherlands
VU medical center, Neurology, Amsterdam, Netherlands
Leiden University, Institute for Brain and Cognition, Leiden, Netherlands
Leiden University, Institute of Psychology, Leiden, Netherlands, 7LUMC, Radiology, Leiden, Netherlands
Amyloid and its association with default network integrity in Alzheimer's disease
The purpose of this study was to investigate the association between functional connectivity and amyloid depositions in the default mode network (DMN) in Alzheimer's disease (AD), patients with Mild Cognitive Impairment (MCI) and healthy elderly.
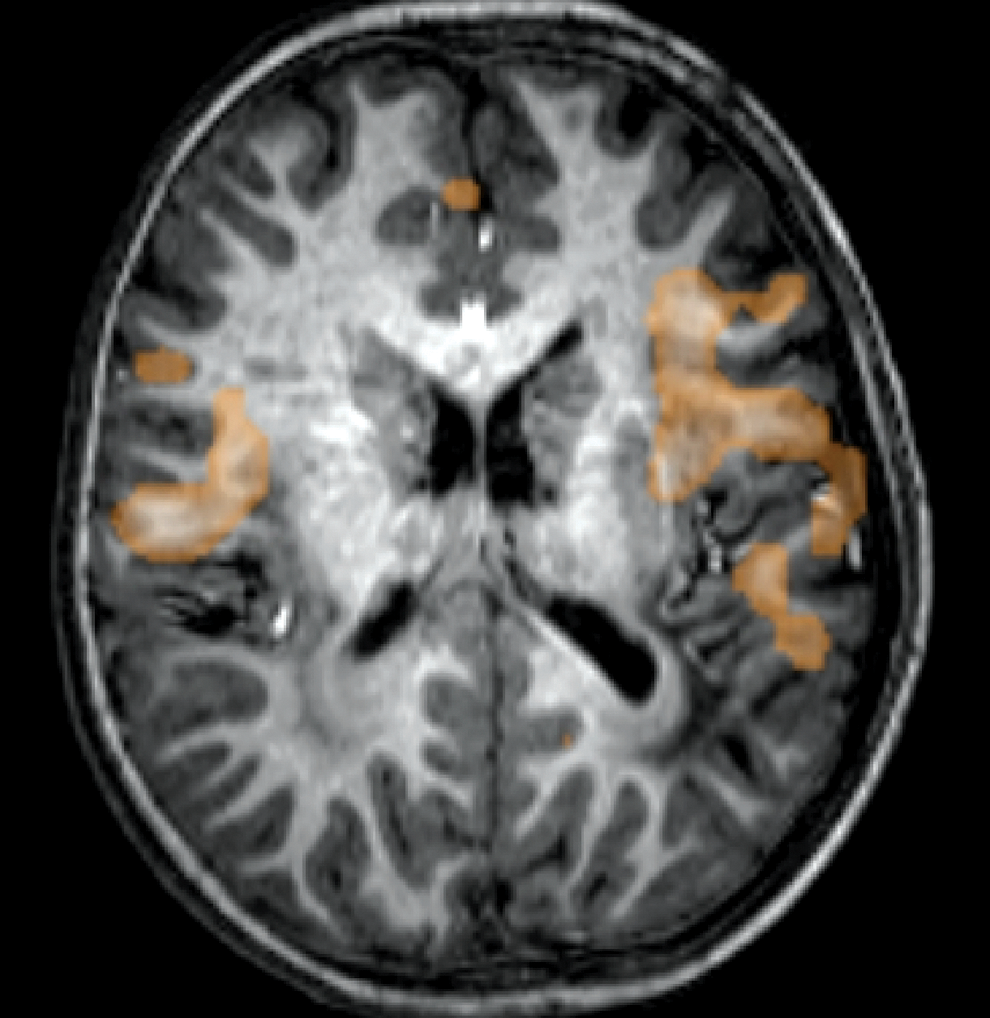
Dynamic, 90 minutes [11C]PIB scans, and resting-state fMRI scans were obtained in twenty-six AD patients, twelve MCI patients and eighteen healthy controls. For [11C]PIB, parametric images of binding potential (BPND) were generated using a basis function method implementation of the simplified reference tissue model. To identify the DMN, Independent Component Analysis (ICA) was performed. Next, dual-regression (back-projection) analysis was done in order to yield individual maps corresponding to the DMN.
A negative association was found between functional connectivity in the DMN and amyloid deposition within the DMN across all subjects, but not within diagnostic groups. MCI patients that converted to AD after one year follow-up showed DMN functional connectivity as well as amyloid burden in the range of AD patients at baseline.
No direct association was found between functional connectivity of the DMN and amyloid depositions within diagnostic groups. Longitudinal studies are needed to examine if amyloid depositions precede aberrant functional connectivity in the DMN.
Data Analysis
ChangC.1LiuZ.1DuynJ.1
NIH, Bethesda, United States
EEG correlates of non-stationary BOLD functional connectivity
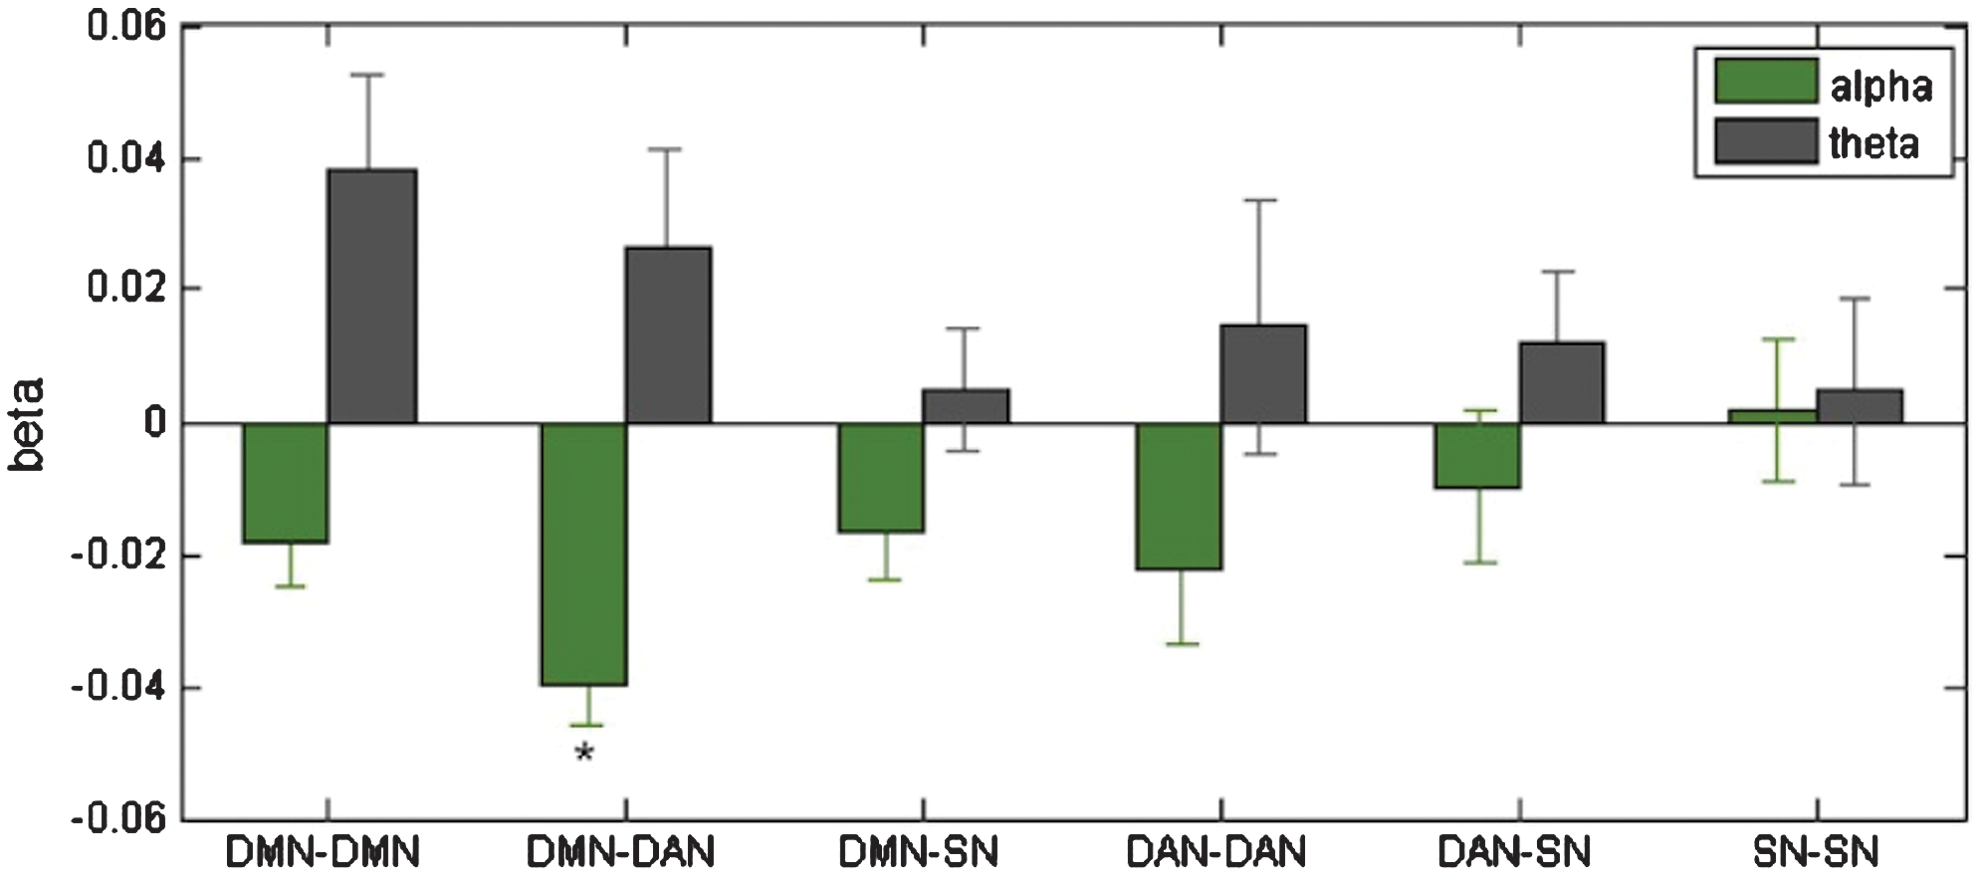
Recent work has shown that BOLD functional connectivity (FC) may undergo substantial changes across a several-minute resting-state scan. Yet, the origin and relevance of these more rapid shifts in network connectivity is unclear; while it may reflect neuronal dynamics and brain state, it may to some degree result from physiological noise or random fluctuation. Here, we examine the electrical correlates of within-scan FC variations during eyes-closed rest. Using a sliding window analysis of simultaneous EEG-fMRI data, we ask whether temporal variations in coupling between three major networks (default mode; DMN, dorsal attention; DAN, and salience network; SN) are associated with temporal variations in the amplitude of posterior alpha and frontal theta oscillations. We thus regard EEG power as a state variable with which to query the cognitive and electrical dependence of nonstationary functional connectivity.
Ten subjects underwent EEG-fMRI at 3T (eyes-closed rest, durations from 9.75-12.24 min). Network regions were defined from a functional atlas[1], and an aggregate measure of pairwise correlation between networks was computed in temporal sliding windows (width 40s, overlap 50%) across each scan. Time courses of EEG power in posterior alpha and frontal theta bands were computed in identical sliding windows, and were regressed against the sliding-window FC between each network pair, accounting for temporal autocorrelation.
Alpha power was inversely related to connectivity between DMN and DAN (t(8)=−6.37, p=0.0002, p<0.001 Bonferroni); the theta term did not reach significance, but tended to show an opposite effect (Figs 1, 2). The alpha term remained significant at p<0.05 corrected over window sizes of 30-60s. Network-level SN findings were not significant, but the thalamus and anterior insula nodes of SN showed alpha-dependent increased coupling (p<0.007 unc). We also formed an index of spatial anticorrelation (% negative values in the matrix of voxelwise correlations between networks), observing that alpha power also predicted increased anticorrelation between DMN-DAN (p=0.009), while theta was inversely related (p=0.049). Results suggest an electrical signature of the time-varying FC between the DAN and DMN, with potential contributions from neural and state-dependent variations.
Beta weights (mean±SE across subjects, N=10) of the multiple regression of EEG alpha and theta band power against the functional connectivity between nodes of the default mode, dorsal attention, and salience networks.
Time course of DMN-DAN functional connectivity predicted from a linear combination of EEG alpha and theta bands (red), superimposed on the actual time course of DMN-DAN functional connectivity, for each subject. Window size = 40s, overlap 50%.
Animal Imaging
ThompsonG.12PanW.-J.12MagnusonM.12JaegerD.3KeilholzS.12
Emory University, Biomedical Engineering, Atlanta, GA, United States
Georgia Institute of Technology, Biomedical Engineering, Atlanta, GA, United States
Emory University, Biology, Atlanta, GA, United States
Significant coherence between fMRI and low-frequency local field potentials in the anesthetized rat produces a filter that demonstrates a more consistent relationship between the two signals
(a) MSCOHERE between LFP and fMRI from S1FL of rat cortex. Darker gray areas are significant when corrected for multiple comparisons (Carvajal-Rodríguez et al., 2009, BMC Bioinformatics 10:209). (b) Derived empirical filters.
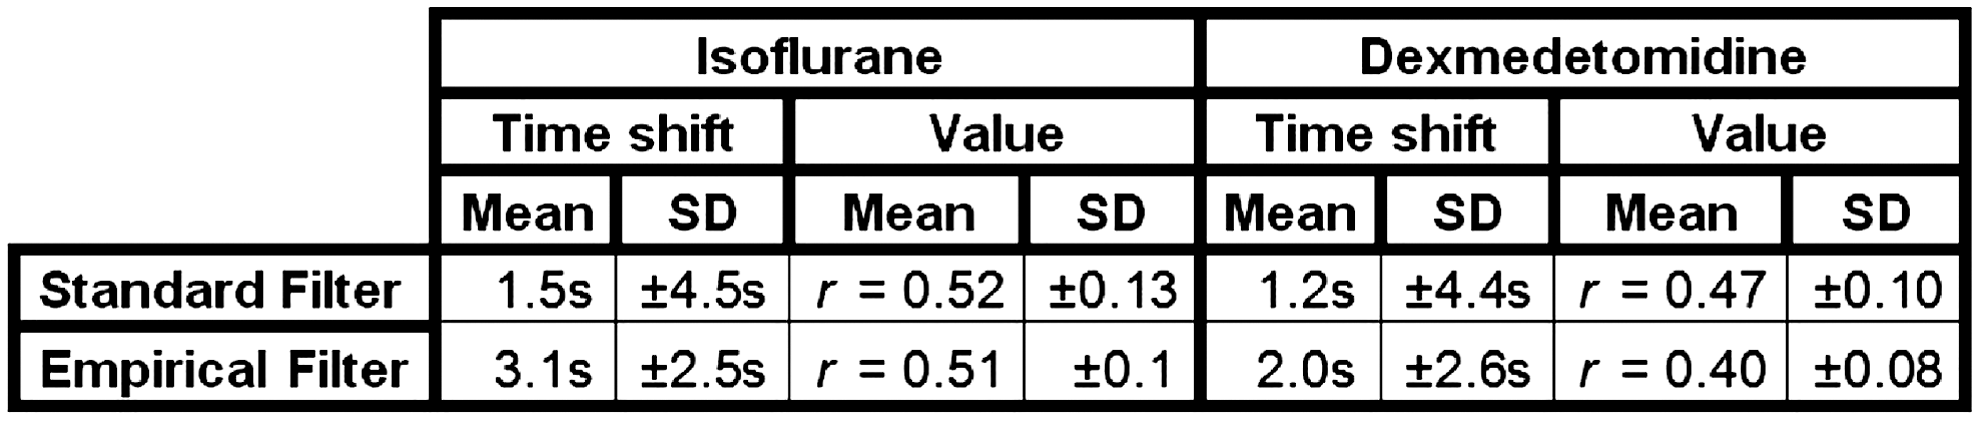
Table of mean and standard deviation of maximum r and time shift to maximum r for LFP/fMRI correlation. Positive time shifts indicate LFP prior to fMRI.
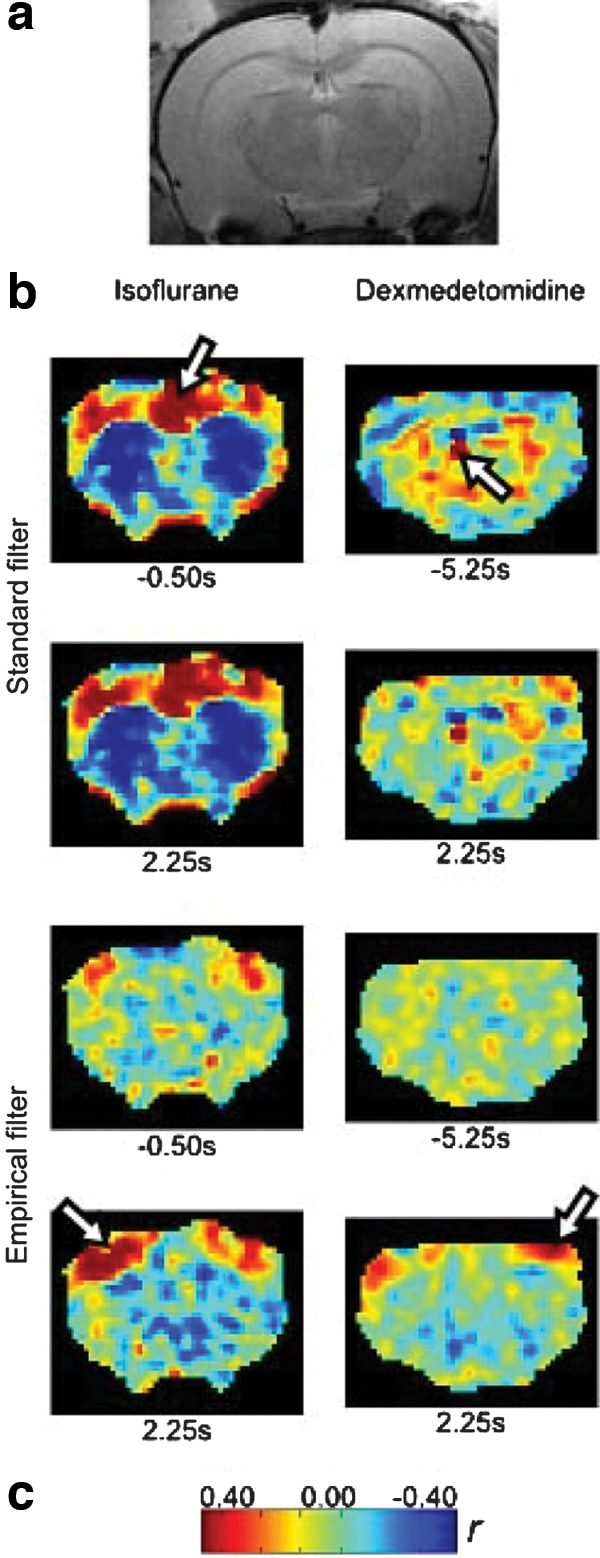
(a) Anatomical fMRI image. (b) Example from one rat per anesthesia, fMRI/LFP correlation at time shift of maximum r, indicated by the arrow. Shift to maximum r from both filters is shown for both. (c) Scale bar.
Numerous links have been found between spontaneous fluctuations in the brain and tasks and diseases. However, spontaneous fluctuations in humans have largely been measured using functional magnetic resonance imaging (fMRI) at frequencies under 1Hz, while spontaneous fluctuations in animals have largely been measured using electrophysiology at frequencies over 1Hz. Despite this, there is evidence for slow fluctuations in electrical potential in the brain (Lorincz et al., 2009, PLoS One 4:e4447).
We simultaneously recorded fMRI and local field potentials (LFP) from the primary somatosensory region of the rat cortex (S1FL, Pan et al., 2010, J Vis Exp 42:e1901). Ten rats were recorded under either 1.7-2.0% isoflurane (iso, rats 1-4) or dexmedetomidine (dex, rats 4-10) anesthesia. Low-frequency LFP was recorded using glass electrodes with silver/silver-chloride leads (Geddes et al., 2001, Ann Biomed Eng 29:181-6) and amplifiers with no highpass filter. Magnitude-squared coherence (MSCOHERE) was calculated between fMRI and LFP signals and tested for significance using bootstrapping. Significant areas of coherence were found from 0.038 to 0.184Hz (iso) and 0.045 to 0.304Hz (dex). When the coherence spectrum was used as an empirical filter for both LFP and fMRI, the variance for maximum LFP/fMRI Pearson correlation (r) and time shift to maximum r was smaller than when a standard filter (0.005-0.1Hz boxcar) was used. Visual inspection suggested that results from the empirical filter place maximum r closer to the electrode location.
Our results suggest that LFP may be related to resting state fMRI in the same, low frequencies and that use of empirical filters can better demonstrate this relationship.
Applications: Neurology
KusséC.1LehembreR.1ForetA.1MascettiL.1MaquetP.1BolyM.1
University of Liège, Cyclotron Reseach Centre, Liège, Belgium
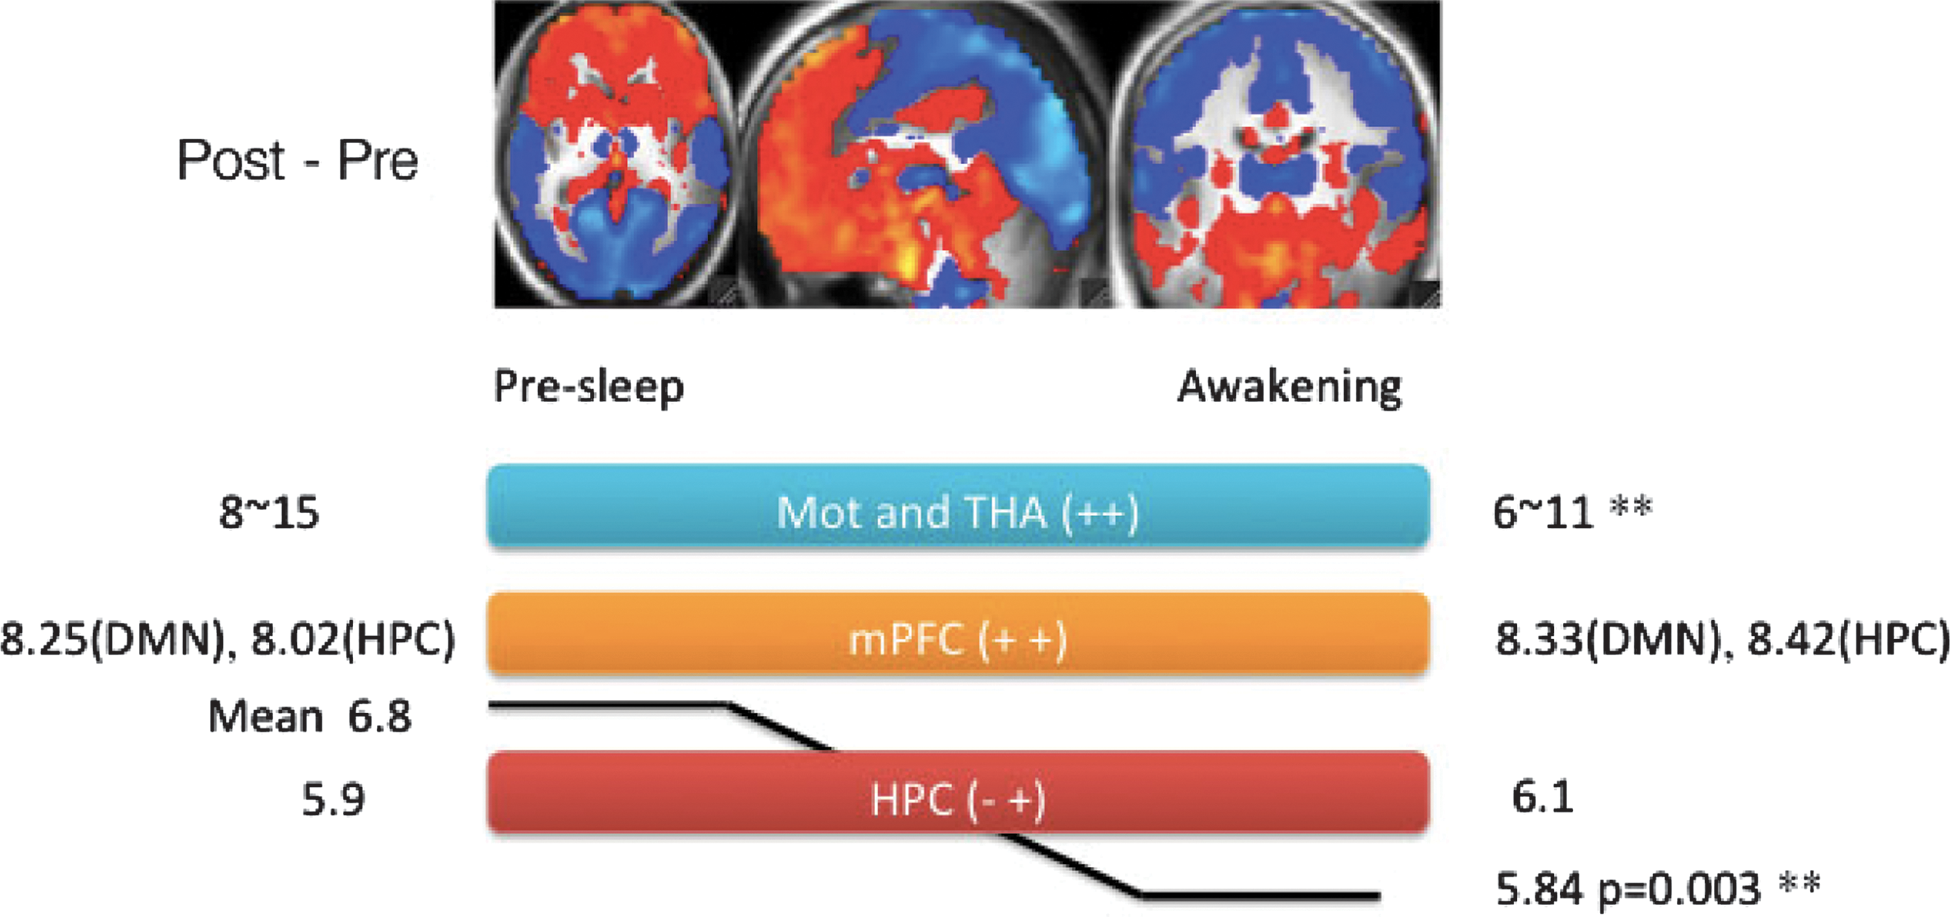
Increase in cortico-thalamo-cortical connectivity during human sleep slow wave activity
Objectives: Slow waves are the hallmark of non-rapid eye movement (NREM) sleep and are quantified by slow wave activity (SWA). The underlying neural mechanisms remain incompletely understood. Steady state dynamic causal modeling (DCM) uses a mathematical neural model to infer the changes in functional interactions between brain regions likely underlying observed changes in power spectrum. We used DCM to investigate changes in effective connectivity across vigilance states in default mode network areas involved in SWA generation.
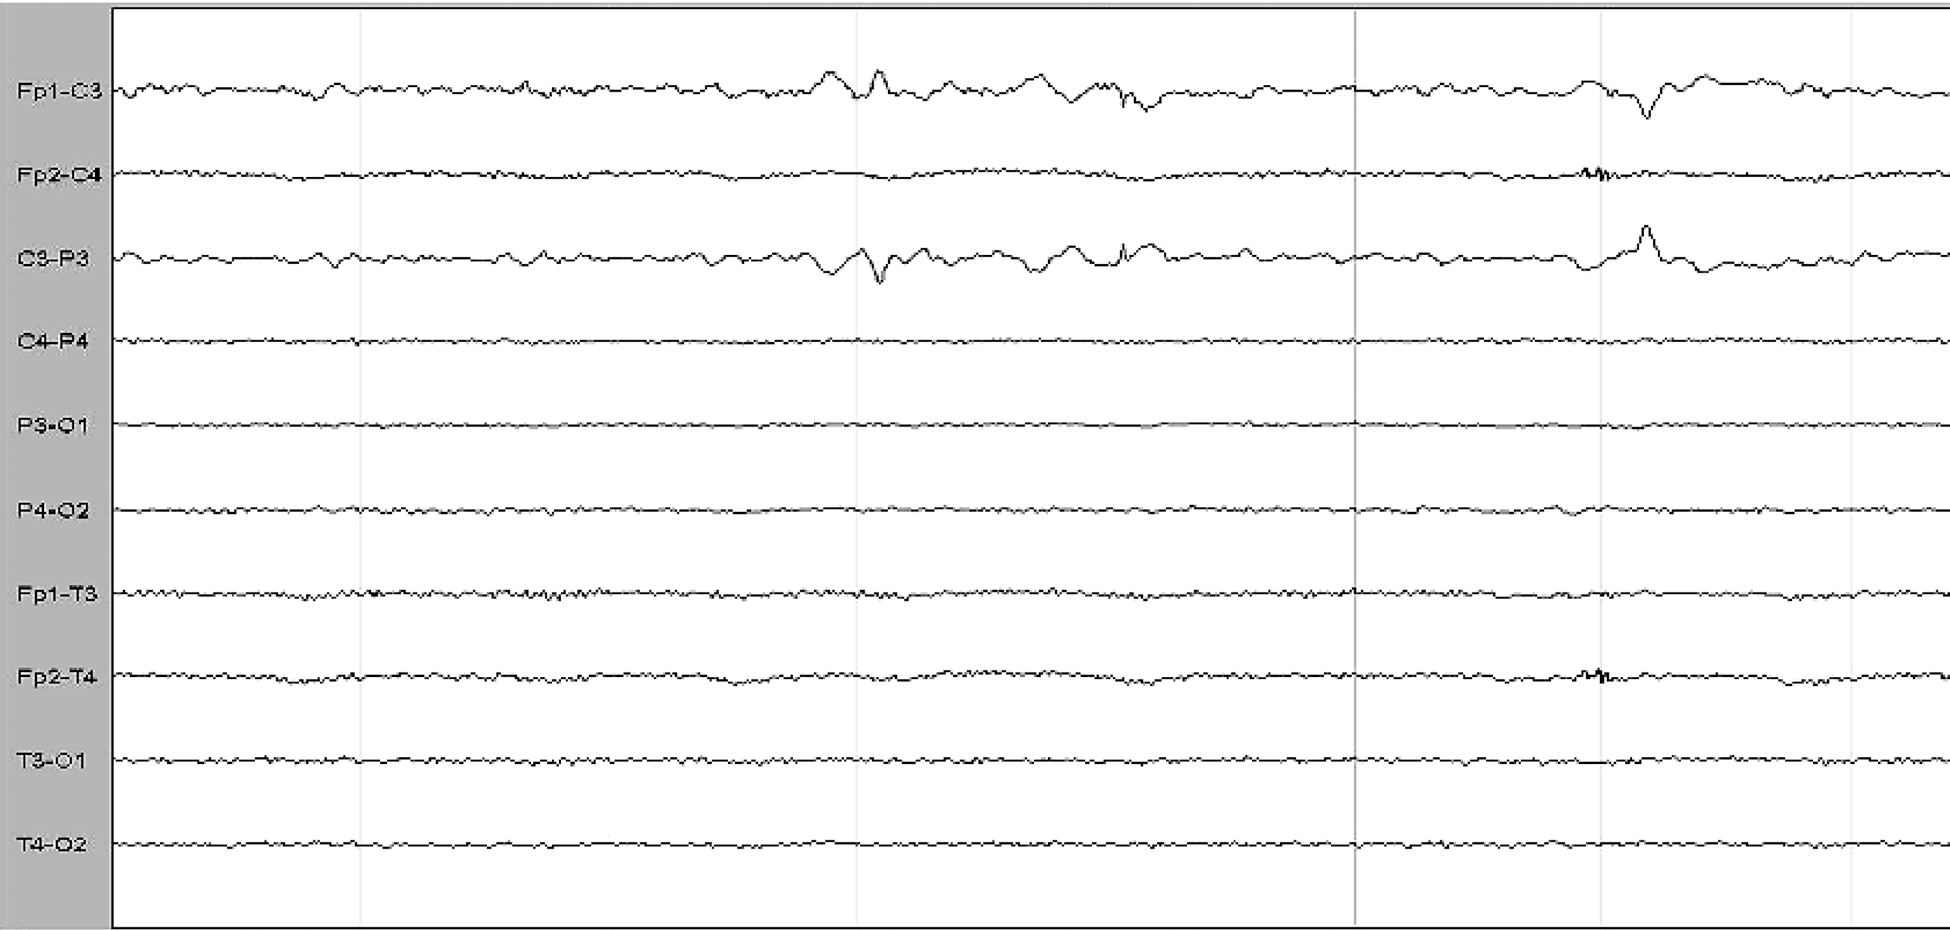
Methods: We recorded 64-channel electroencephalographic (EEG) night-time sleep in 20 healthy human volunteers. Five-minute clean EEG epochs from wakefulness, stage 2 and stage 3 NREM were selected for analysis.
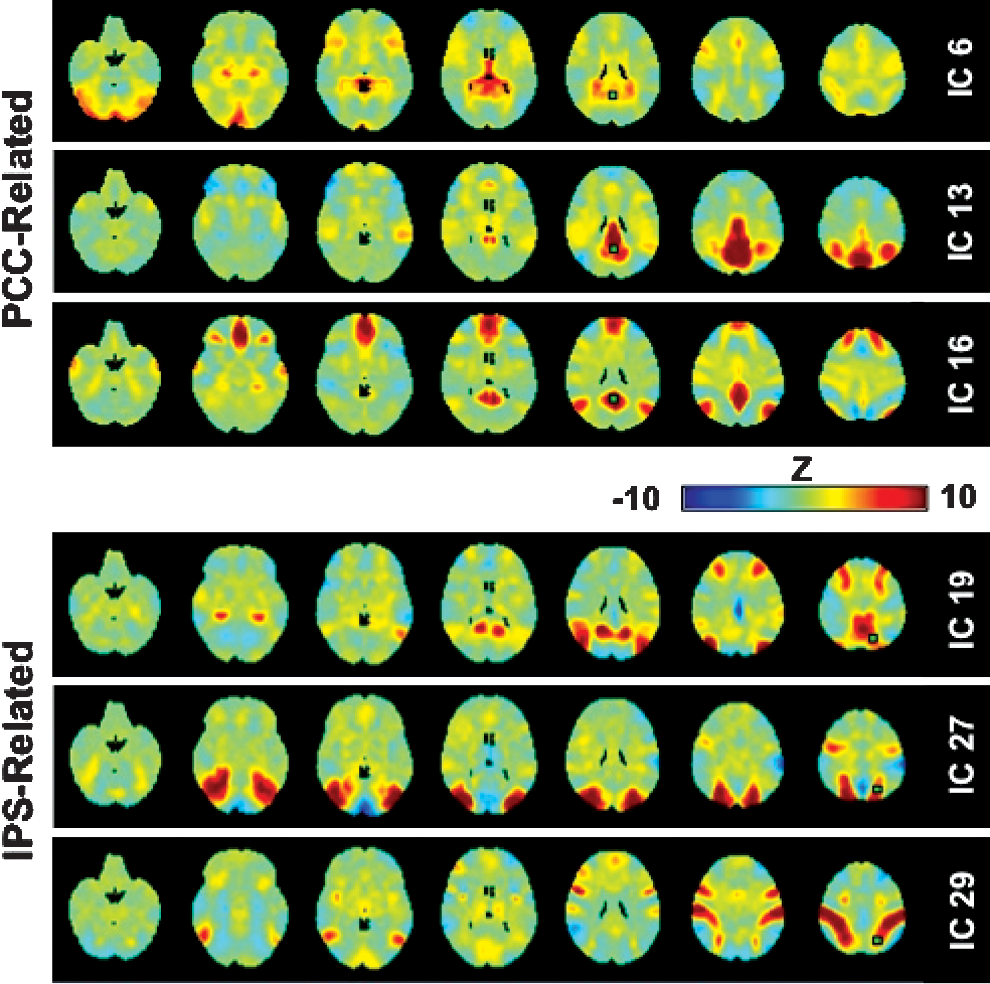
Results: The regions of interest selected from the source-reconstruction were located in posterior cingulate (PCC) and medial prefrontal/anterior cingulate (MPFC). Bayesian comparison revealed that the best model for explaining power spectral changes in our data across vigilance states contained both cortical areas and a reciprocally connected thalamus. Repeated measures analysis of variance revealed significant changes across vigilance states in connection strength from MPFC to thalamus and from thalamus to PCC (p
Conclusion: The effective connectivity changes identified during NREM sleep in the present study are reminiscent of the preferential anteroposterior spread reported for individual sleep slow waves. Our results suggest that the increased EEG synchronization during NREM is mediated through changes in cortico-thalamo-cortical rather than through corticocortical connections. These results are in line with a suggested role of thalamocortical interactions in NREM sleep slow wave generation.
Nathan Kline Institute for Psychiatric Research, Orangeburg, United States
Virginia Tech, School of Biomedical Engineering and Sciences, Blacksburg, United States
Virginia Tech Carilion Research Institute, Roanoke, United States
Bibliometric Analysis of Resting State Literature
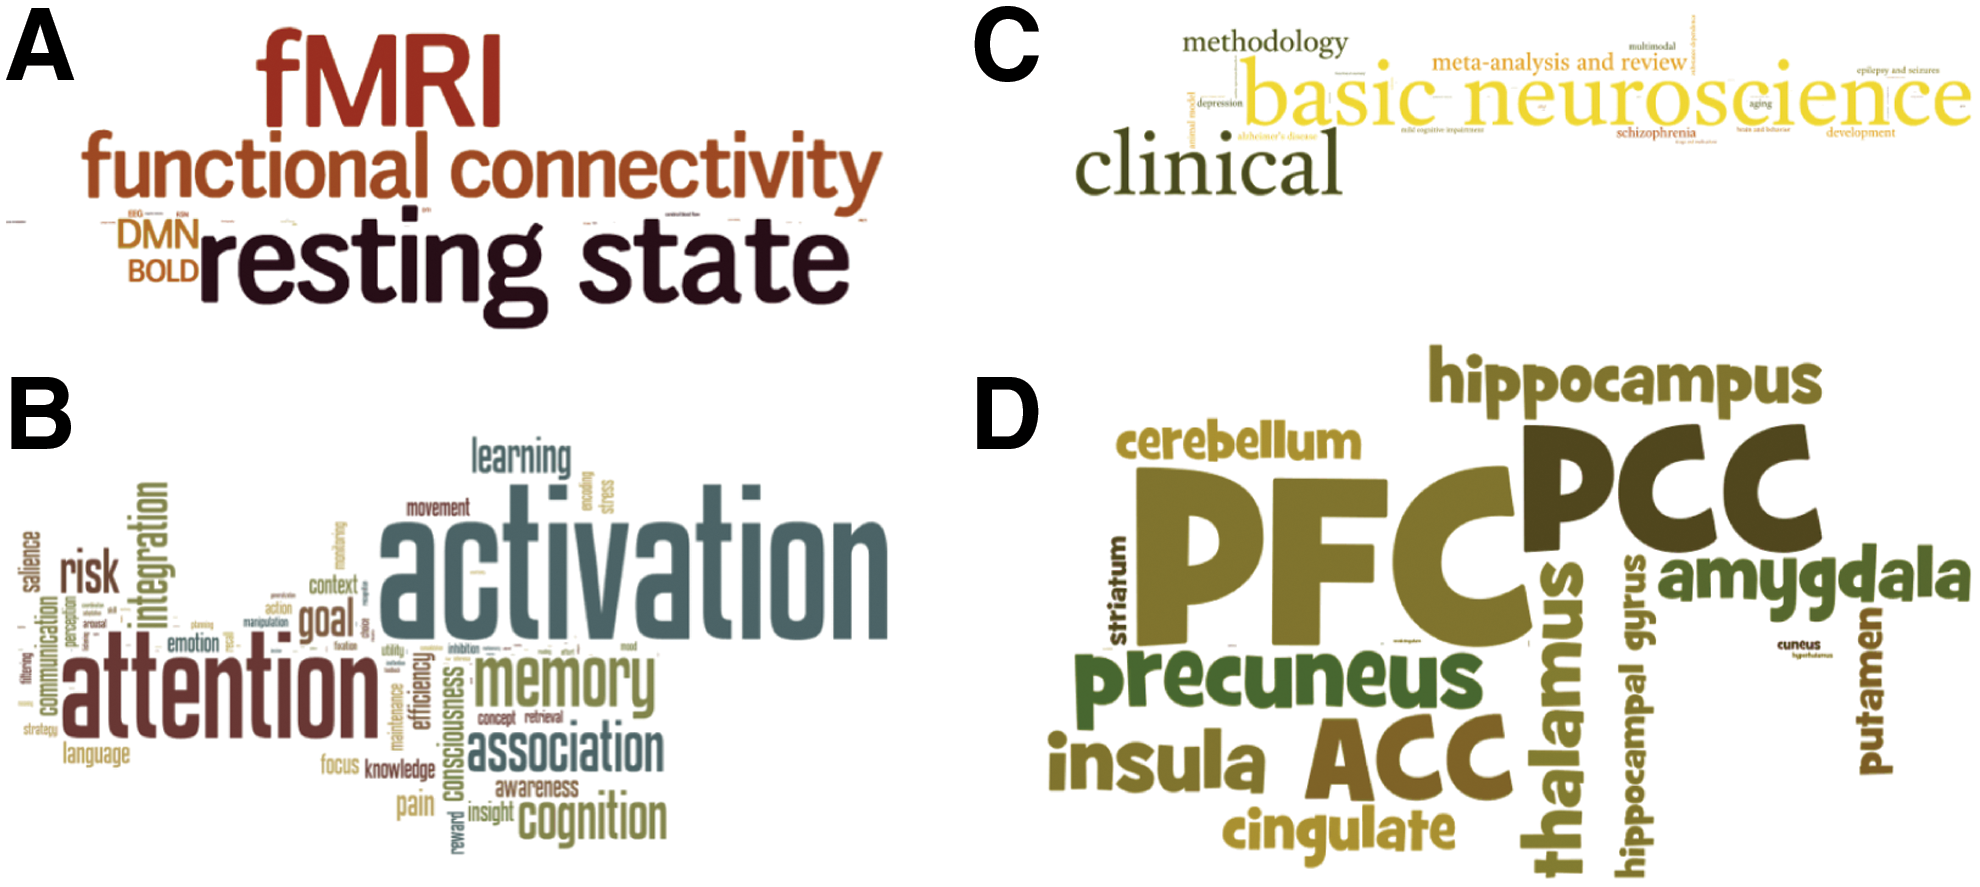
Introduction: The CMI Librarian resting state (RS) database is an invaluable tool for assimilating RS research. We used the database to perform a quantitative analysis of patterns within RS literature (bibliometric analysis) to glean publication trends, common experimental methods, and popular research topics.
Methods: The CMI Librarian provides a curated database of 1,150 RS publications. PubMed IDs were used to retrieve records for each paper [1]. Article title, abstract, and keywords were analyzed to identify trends in the literature. Word frequency analysis was performed on CMI Librarian tags, as well as terms appearing in the title and abstract from neuroimaging methods, cognitive ontology [2, 3], and the PubBrain lexicon [4].
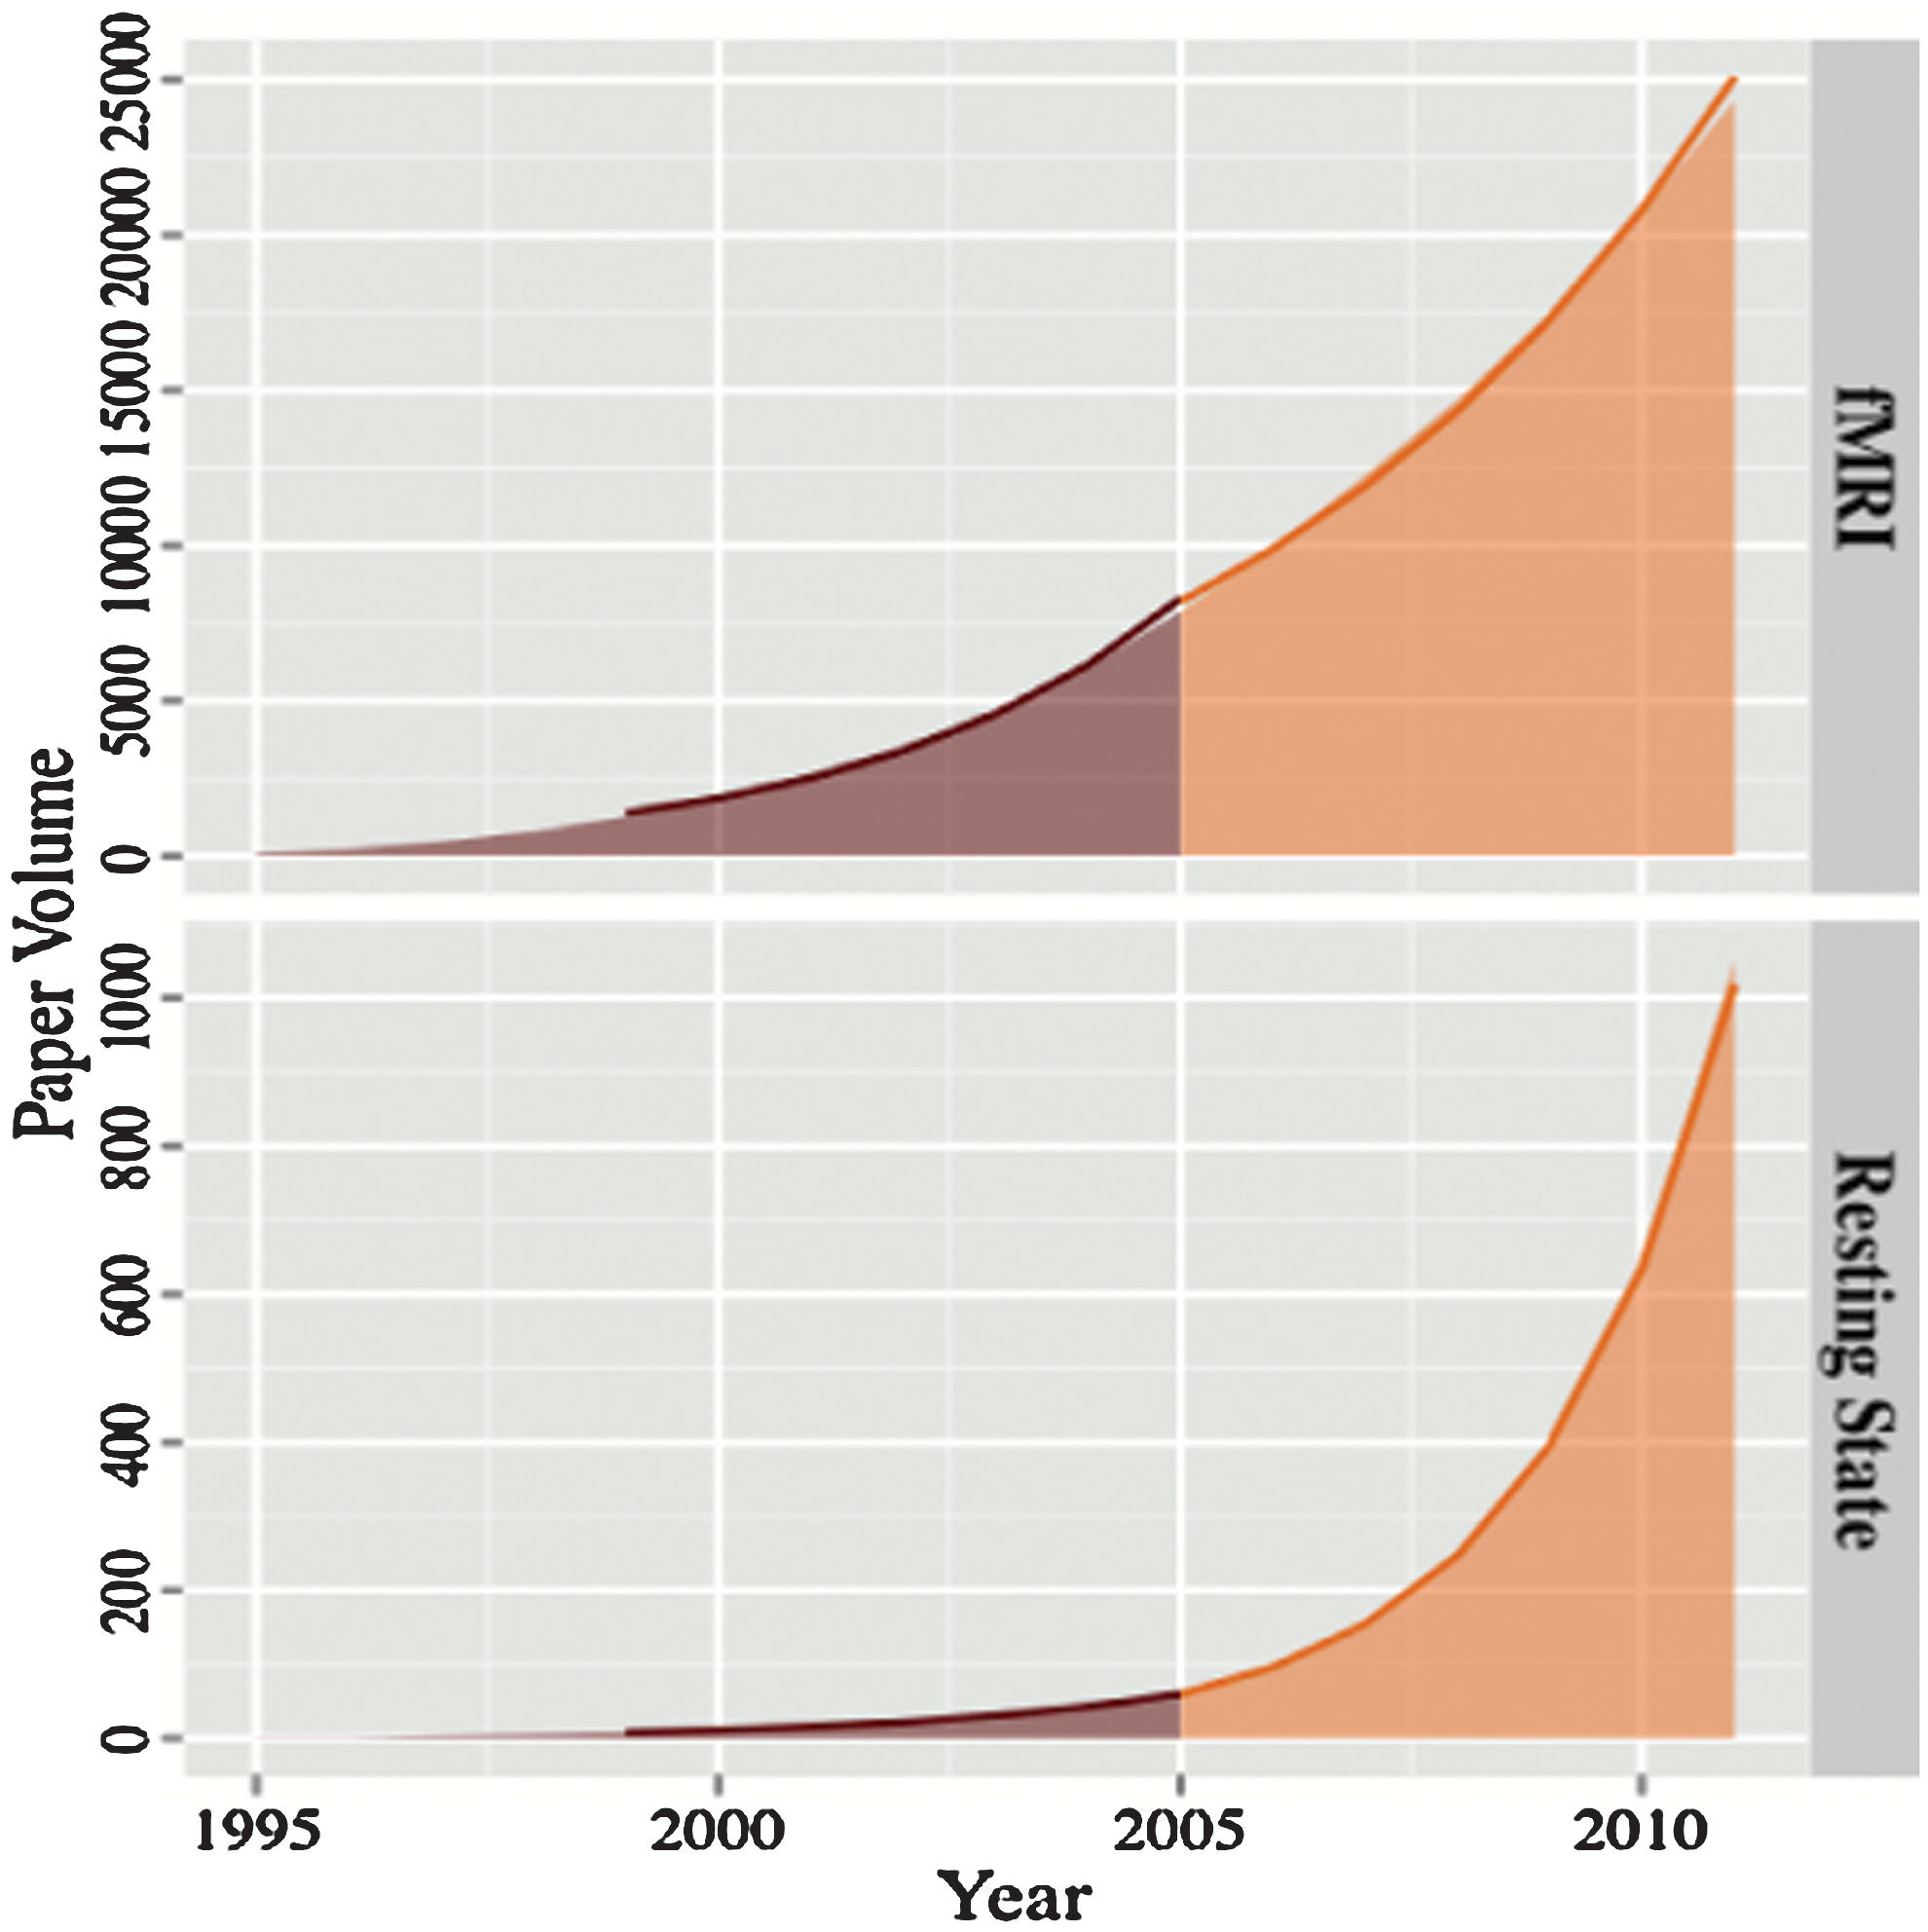
Results: Growth of RS literature is piecewise exponential with 33% growth prior to 2005 and 47% after (Fig 1 bottom). In comparison, growth of fMRI literature was 29% before 2005 and 18% after (Fig 1 top). 27% of RS literature was published in Neuroimage and HBM (Fig 2). The most frequent imaging modality is fMRI (Fig 3A). Similar volumes of literature are dedicated to basic neuroscience (434) and clinical applications (422) (Fig 3C). The PFC, PCC, and ACC are the most discussed brain regions (Fig 3D). The most investigated cognitive domain is attention (Fig 3B). 26% of RS publications are open access, compared to 22% in all of fMRI.
fMRI (top) and RS literature (bottom) paper volume by year with exponential fits overlaid. Growth rates differ before (maroon) and after (orange) 2005.
Top 20 publication outlets for RS.
Word cloud analyses: font size corresponds to frequency of neuroimaging (A), Cognitive Atlas (B), CMI Librarian tags (C) and PubBrain (D) terms.
Conclusion: Our bibliometric analysis of RS literature lends valuable insight into the current state of the field, demonstrating its strength, areas of focus, and future potential. The growth of RS literature is currently faster than fMRI, the most common imaging modality in RS research. The analysis identified a focus on PFC, responsible for executive function, as well as the PCC and ACC, which are central nodes of the DMN. Attention is the most discussed cognitive domain, reflecting a current research trend. Analysis of open access showed that it is not universal in resting state or fMRI, but has a strong foothold.
Animal Imaging
GassN.1SchwarzA.J.23SartoriusA.14CleppienD.1SchenkerE.5RisterucciC.6Meyer-LindenbergA.4Weber-FahrW.1
Central Institute of Mental Health, Neuroimaging, Mannheim, Germany
Eli Lilly and Company, Translational Medicine, Indianapolis, United States
Indiana University, Department of Psychological and Brain Sciences, Bloomington, United States
Central Institute of Mental Health, Department of Psychiatry and Psychotherapy, Mannheim, Germany
Institut de Recherches Servier, Croissy s/Seine, France
F. Hoffmann-La Roche Ltd, Pharmaceuticals Division CNS Research, Basel, Switzerland
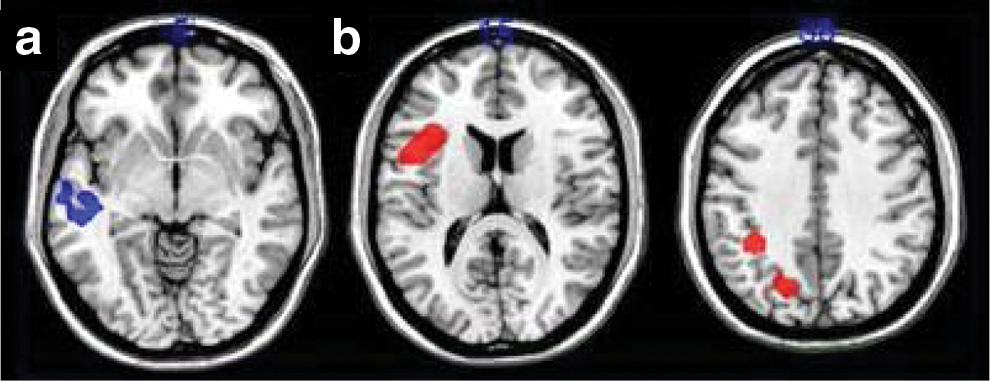
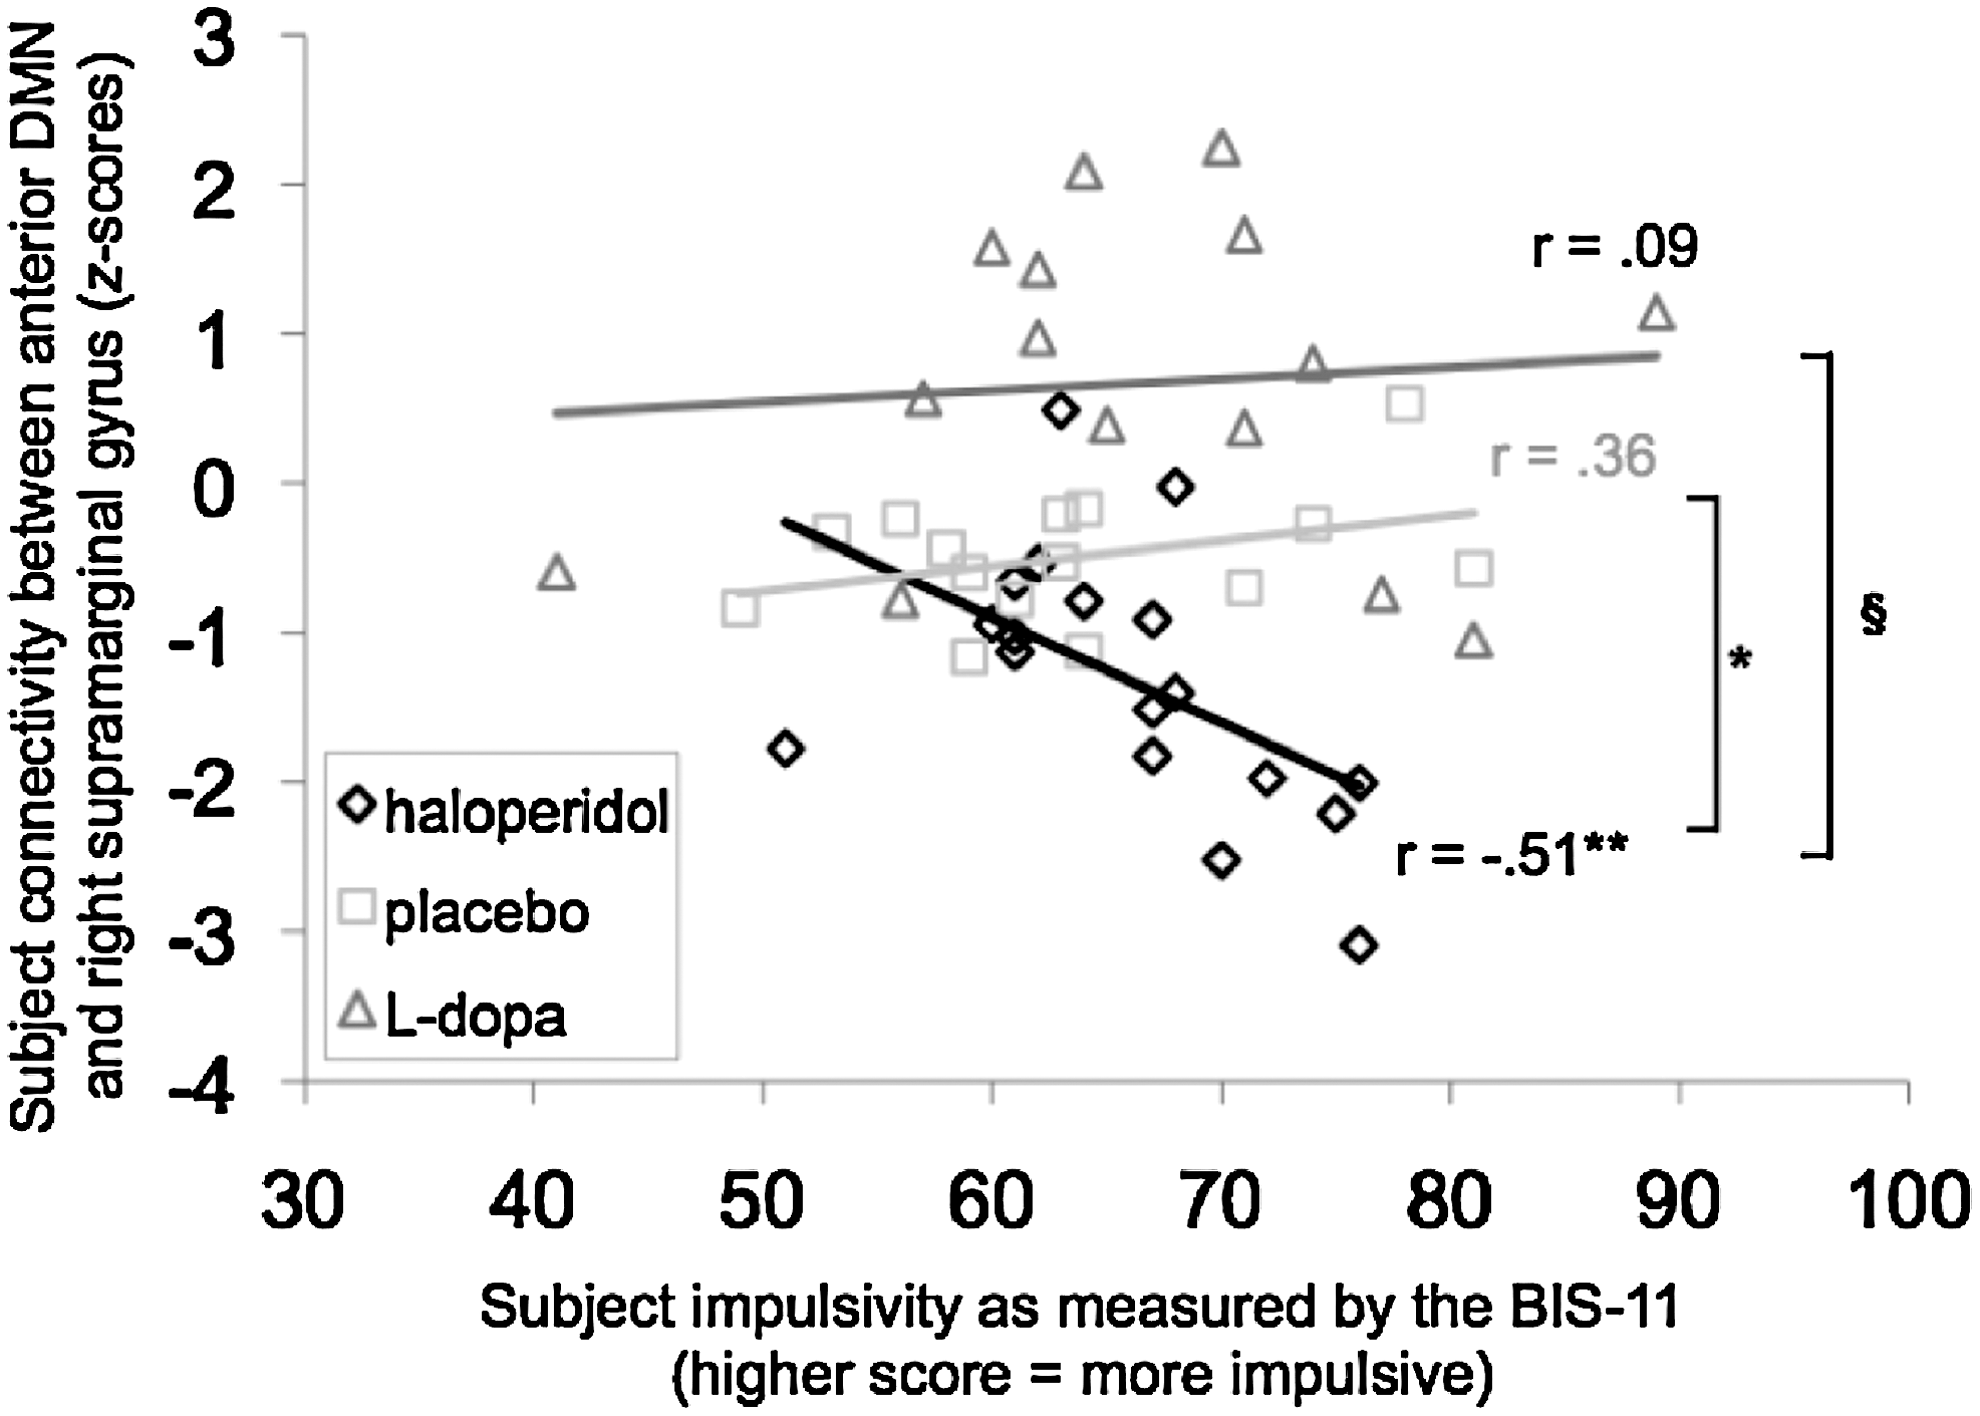
Haloperidol modulates functional brain connectivity in the rat
Question: Abnormal dopaminergic neurotransmission contributes to psychotic states in schizophrenia, since dopamine D2 receptor antagonists effectively reduce positive symptoms. Interestingly, schizophrenic patients show reduced connectivity between the dorsolateral prefrontal cortex (PFC) and the hippocampus. We hypothesized that haloperidol, a widely used antipsychotic and D-2 antagonist, would modulate functional connectivity in dopaminergic circuits and possibly change connectivity between the PFC and the hippocampus.
Methods: Nine male Sprague-Dawley rats received either haloperidol (1 mg/kg in 1 ml saline, s.c.) or the same volume of saline a week apart. Resting-state fMRI data were acquired 20 min after injection. Connectivity analyses were performed using two complementary approaches: correlation analysis between 45 atlas-derived regions of interest (ROIs), and seed-based connectivity mapping.
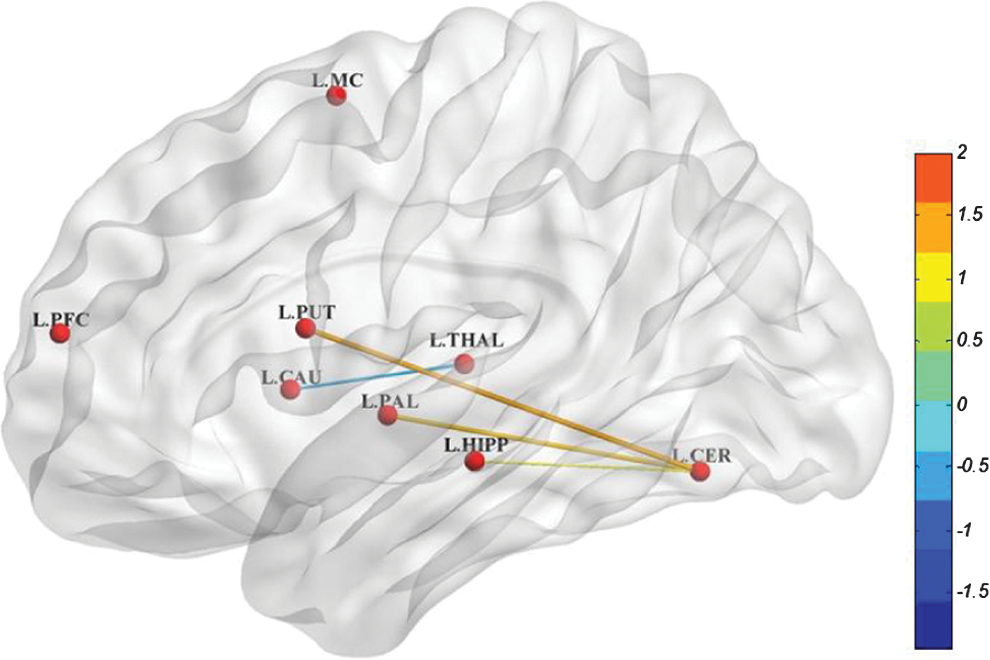
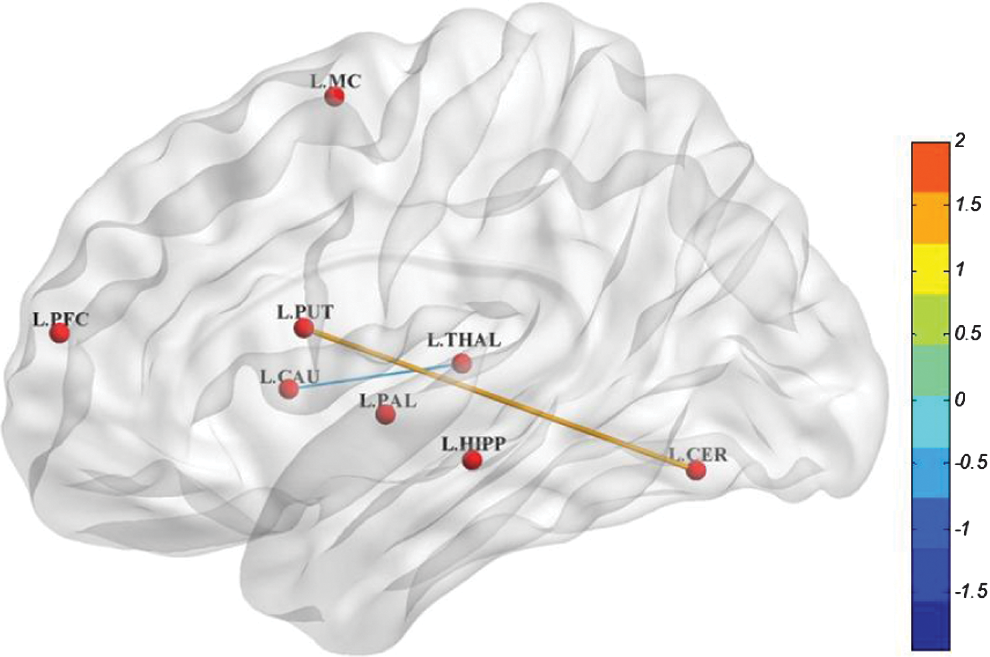
Results: Haloperidol-treated rats displayed lower correlation between the substantia nigra (SN) and several ROIs, notably the ventral pallidum, caudate putamen, and nucleus accumbens compared to the control group. A higher correlation was observed between the lateral habenula (LH) and olfactory tubercle, and ventral tegmental area (VTA) after haloperidol treatment. This was confirmed in seed-based correlation mapping using the SN as the seed. In contrast, we detected slightly higher unilateral correlation between the PFC and the hippocampus in haloperidol-treated animals.
Conclusions: These findings suggest that haloperidol modulates resting state functional connectivity in brain areas involved in emotional processing. The haloperidol-induced higher connectivity measured between LH and VTA may reflect antipsychotic efficacy through inhibition of the mesolimbic pathway. The decreased coupling measured in the nigrostriatal pathway may reflect dyskinesia as one of the side effects of haloperidol, whereas the increased coupling between PFC and hippocampus may suggest a normalization of the connectivity presumably weakened in schizophrenia. These data may help in further characterizing the functional brain connectivity modulated by antipsychotics that could be targeted by innovative drug treatments.
Applications: Neurology
BolaM.1GallC.1MoewesC.2HerrmannC.3SabelB.1
Otto von Guericke University, Institue of Medical Psychology, Magdeburg, Germany
Otto von Guericke University, Department of Computer Science, Magdeburg, Germany
Carl von Ossietzky University, Department of Experimental Psychology, Oldenburg, Germany
Functional connectivity alterations after pre-chiasmatic visual system lesion
Introduction: Damage occurring along the visual pathway results in visual field (VF) defect in the area processed by the damaged tissue, while other VF parts are considered intact. However, as perceptual deficits were proven to exist in the presumably “intact” VF (Rizzo & Robin, 1996; Paramei & Sabel, 2008; Schadow et al., 2009) we hypothesize that these are mediated by network effects, namely lesion-induced changes in regions remote from the lesion site. Therefore, to study if such alterations are present, we investigated functional connectivity in patients with visual system damage.
Methods: Patients with visual field loss due to pre-chiasmatic damage (optic nerve; n=18) and age-matched healthy controls (n=14) took part in the study. Visual field of patients was tested with perimetry, to determine location of the scotoma (Fig.1). Next, all subjects performed simple shape discrimination task, where stimuli were presented in patients' intact field and in respective parts of VF of healthy controls. During the task 32 channel EEG was recorded. Data were epoched and time locked to the stimulus. Multivariate autoregressive model (MVAR) was fitted to short (140ms), stationary (ensemble normalization) time windows and functional connectivity (spectral coherence) was estimated from the model. Coherence values were baseline corrected.
FIG. 1.
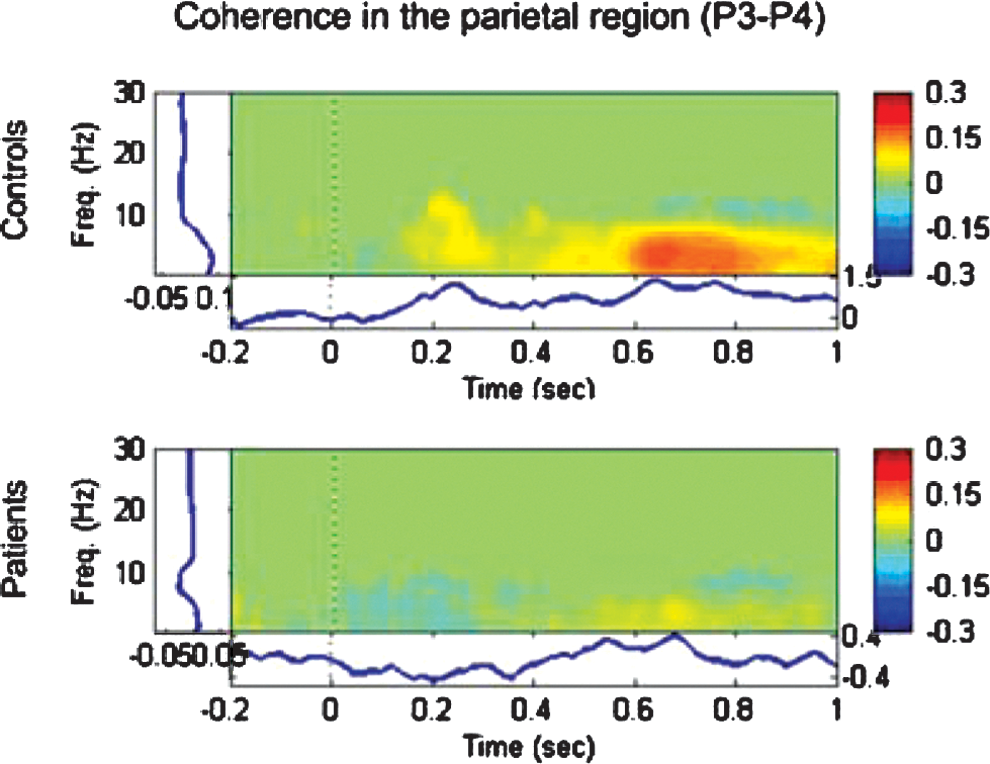
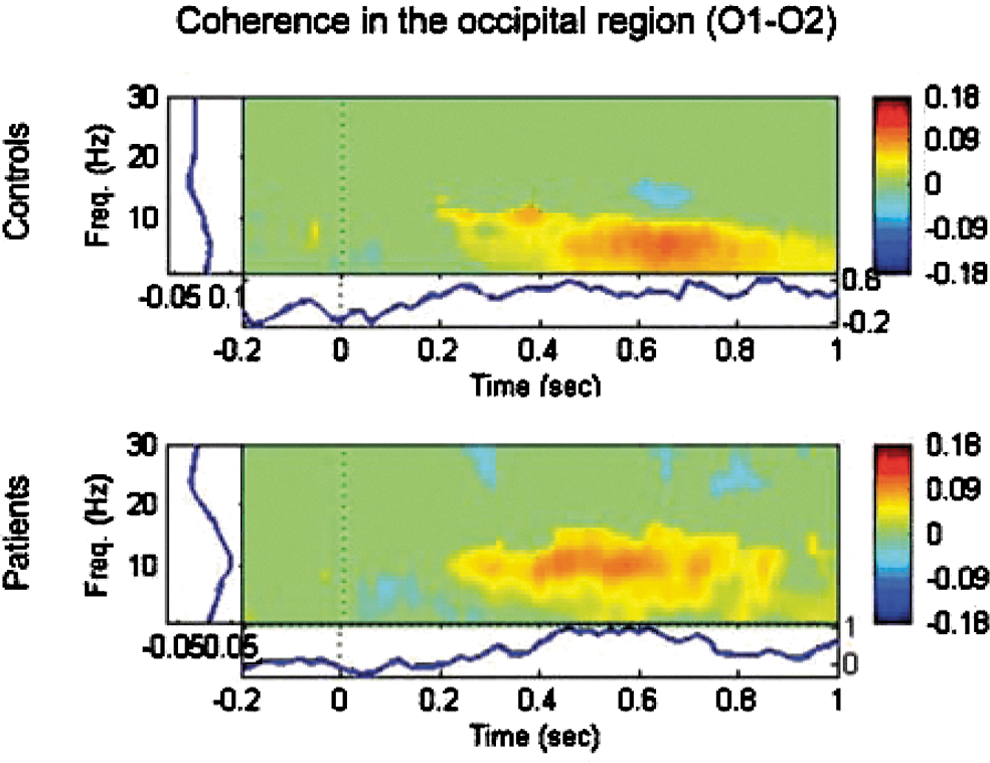
Results: Processing of the stimulus in the intact field of controls evoked increase of coherence in the parietal region at two time points - shortly after the stimulus (0.2-0.3 sec, 3-13Hz; Fig 2) and later around the response time (0.6-0.8 sec, 1-8Hz). Both coherence peaks were significantly weaker in the patients group (p<0.05). Further, we found a shift in coherence peak frequency in the occipital region. While in the control group coherence peaked at 5Hz, in the patients group the highest values were found at 11Hz (Fig 3).
FIG. 2.
FIG. 3.
Conclusions: Our results suggest that in patients with pre-chiasmtic visual system damage cortical functional connectivity is altered, even when the stimulus is processed in the presumably “intact” visual field. Therefore, local visual system lesions affect physiological functioning in areas much larger than the lesion site and this physiological dysfunction may explain processing deficits in non-damaged regions of the visual system.
Child Mind Institute, Center for the Developing Brain, New York, United States
Nathan Kline Institute for Psychiatric Research, Orangeburg, United States
Virginia Tech Carilion Research Institute, Roanoke, United States, 4Johns Hopkins University, Department of Applied Mathematics & Statistics, Baltimore, United States
Reproducibility: the impact of preprocessing resting state fMRI
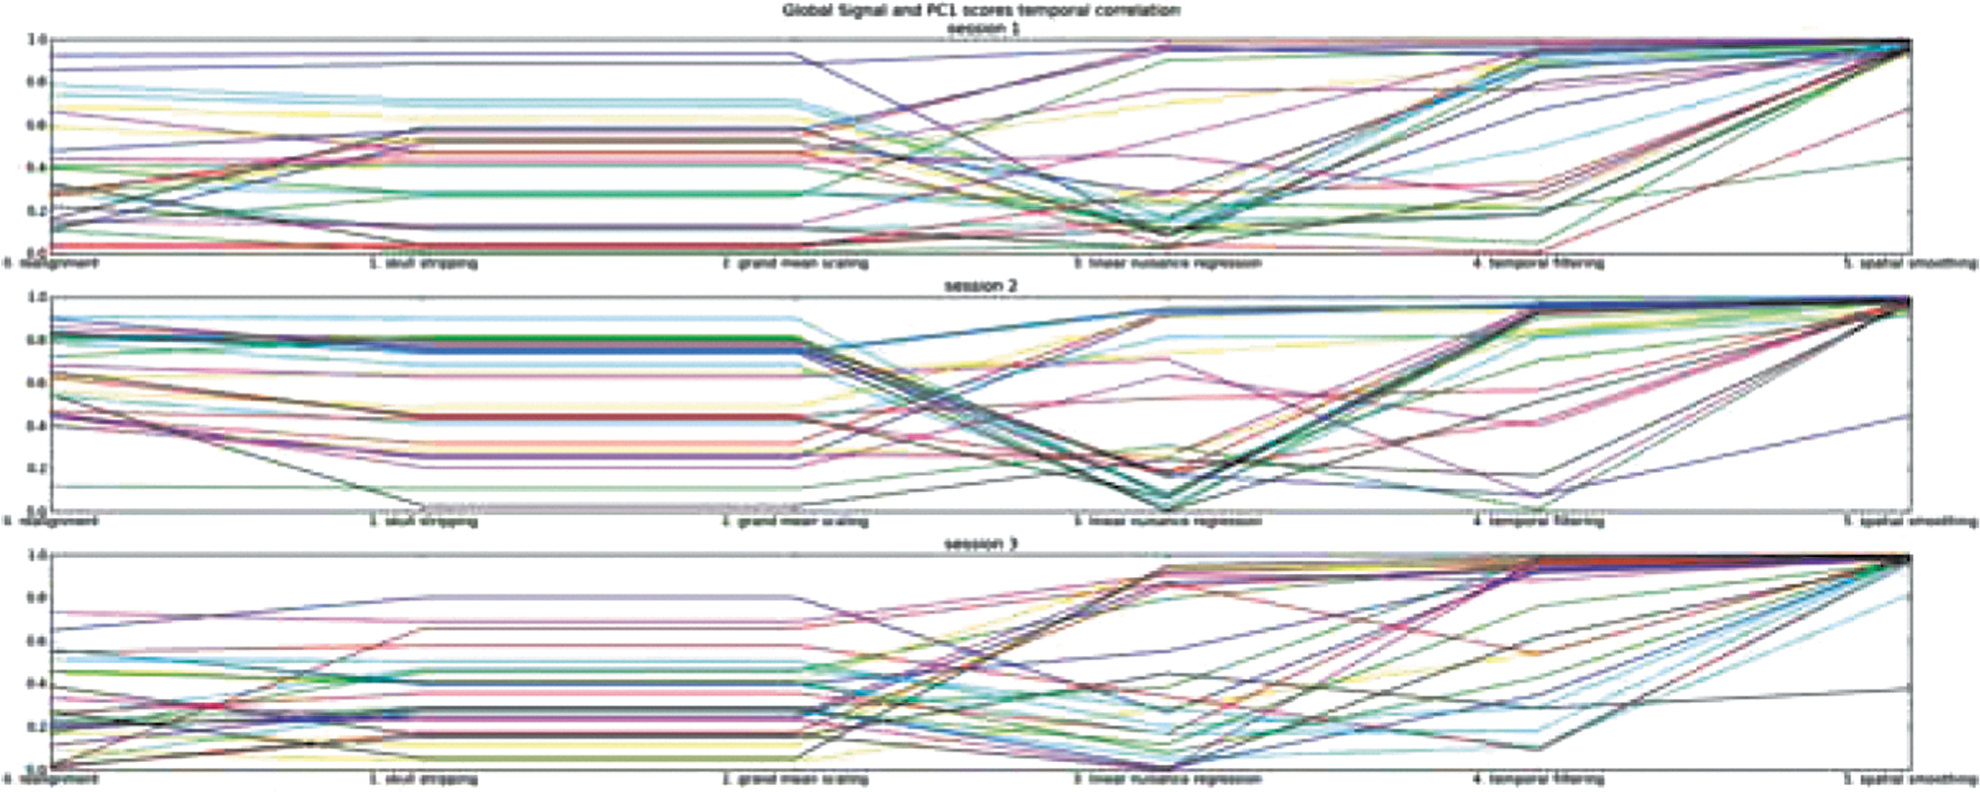
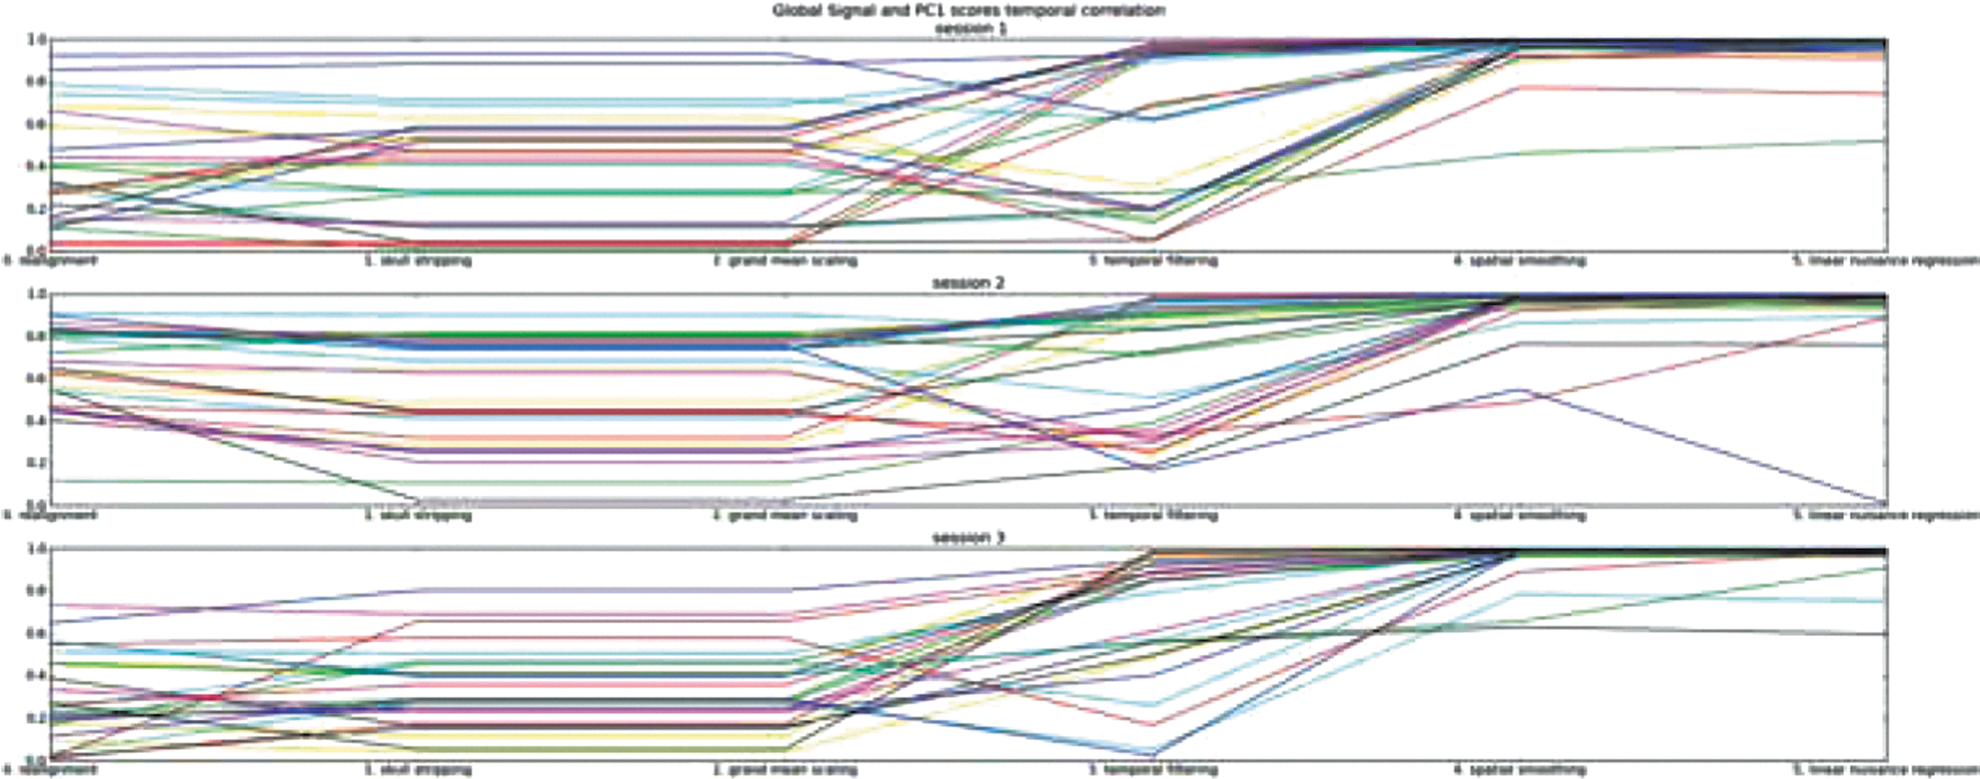
Objective: Prior research has found a significant correspondence of the global mean signal (GM) with the first principal component scores (PC1) in resting state (RS) fMRI scans (He and Liu 2011, Carbonell et al. 2009). Intuitively, this correspondence is expected as the GM represents a time series that is spatially present throughout much the brain (Scholvinck et al. 2010). A variety of methods to remove or mitigate the effects of such a signal have been simultaneously proposed and critiqued (Murphy et al. 2009). We find that this correspondence is heavily dependent upon the preprocessing steps used to analyze RS fMRI data and can change significantly for a given subject between consecutive preprocessing steps. Furthermore, we find that similar issues still occur when analysis is restricted to grey matter voxels.
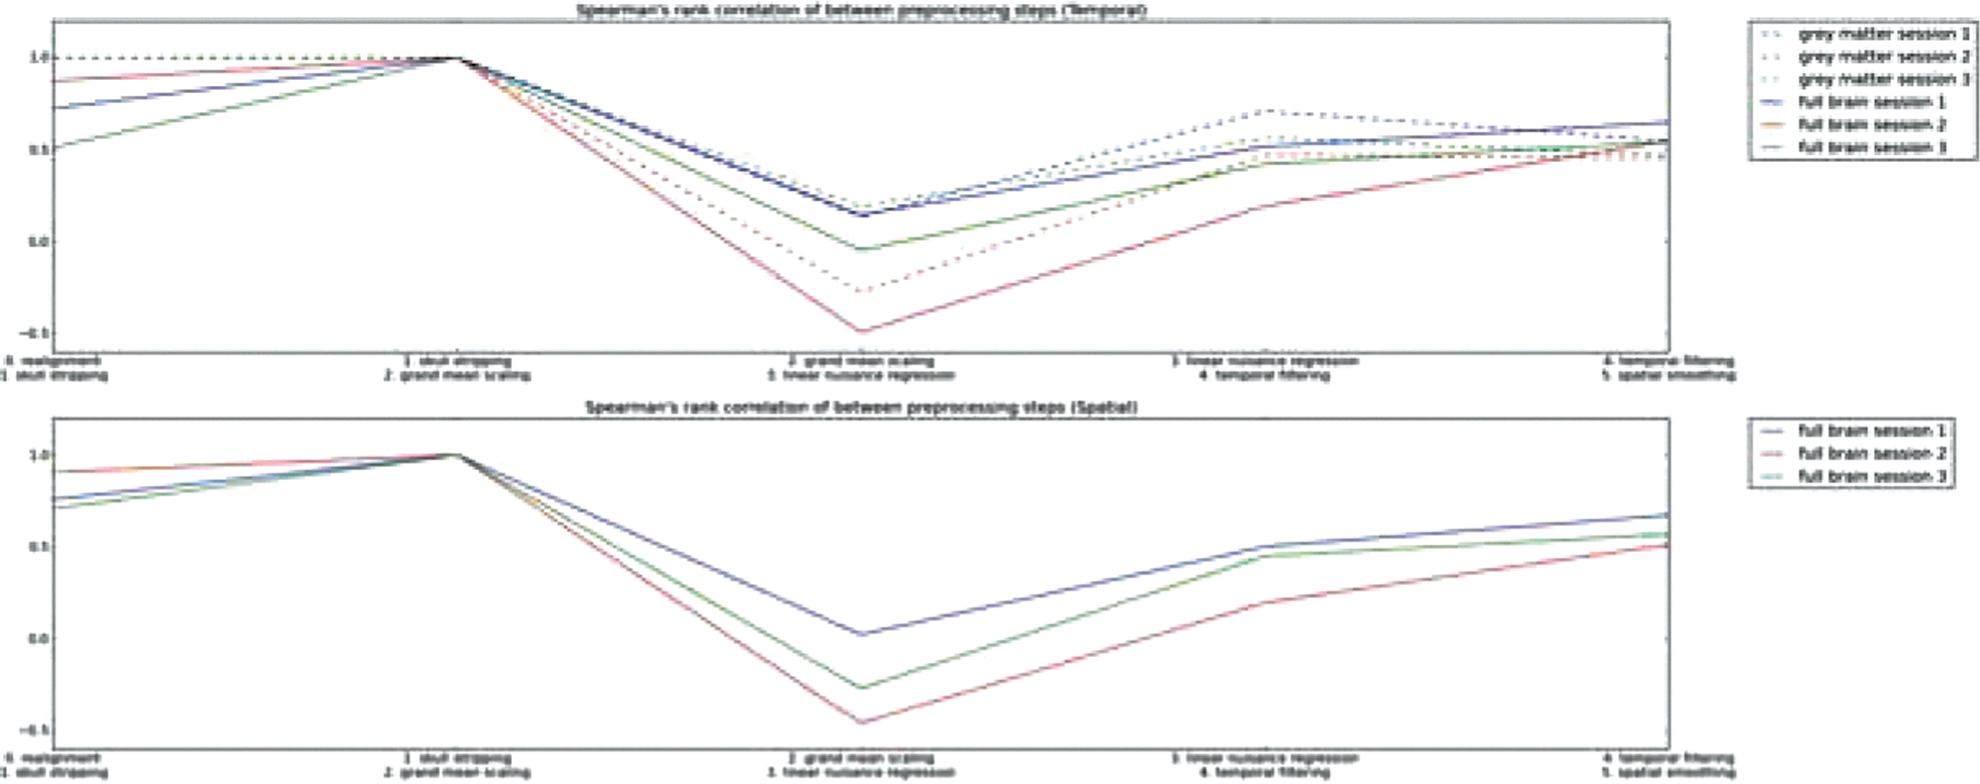
Method: We examine the impact of preprocessing steps commonly applied to RS data on the correspondence between GM and PC1. These steps include realignment (RA), skull stripping (SS), global mean scaling (GMS), linear nuisance regression (LNR), temporal filtering (TF) and spatial smoothing (SM). The LNR model linearly removes linear trend and head motion parameter effects. Two processing pipelines are compared (A (Fox et al. 2005) and B) using a publicly available dataset containing 25 subjects, each with 3 scan sessions (Shehzad et al. 2009). The differences between pipelines is the order of LNR with respect to TF and SM. For each pipeline, temporal correlation is calculated between the full brain PC1 and GM after each processing step. Furthermore, Spearman's rank correlation coefficient is calculated between consecutive steps to determine if the relative ordering of correlation values for the 25 subjects persists between steps.
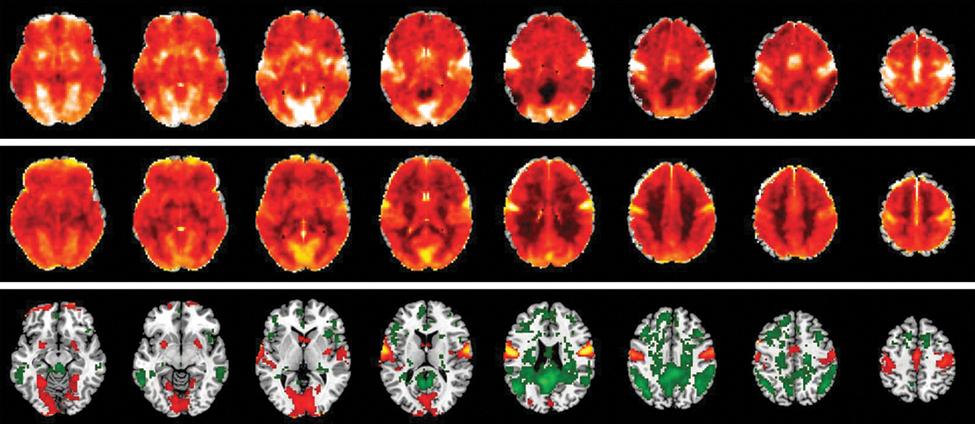
Results: As shown in Fig 1 and 2, the distribution of correlation values changes substantially between each step. As shown in Fig 3 the ordering is particularly affected between GMS and LNR in pipeline B. Fig 4 also shows a significant impact between GMS and TF in pipeline A. Fig. 2 illustrates a noticeable convergence of correlation values towards unity for a majority of subjects after SM step in both pipelines.
Global signal and first principal component scores temporal correlation of pipeline B (linear nuisance regression precede temporal filtering and spatial smoothing). Each line represents the correlation values of a single subject during each stage of the pipeline.
Global signal and first principal component scores temporal correlation of pipeline A (temporal filtering and spatial smoothing precede linear detrending and linear regression). Each line represents the correlation values of a single subject during each stage of the pipeline.
Spearman′s rank correlation coefficient calculated from the sampled correlation value of each subject between consecutive preprocessing steps steps of pipeline B.
Spearman′s rank correlation coefficient calculated from the sampled correlation value of each subject between consecutive preprocessing steps steps of pipeline A.
Conclusion: Preprocessing steps can have drastic effects on the data. Care must be taken when making subsequent inferences on preprocessed data.
Animal Imaging
HutchisonR.M.1GallivanJ.2CulhamJ.2GatiJ.1MenonR.1EverlingS.1
Western University, Robarts Research Institute, London, Canada
Western University, Psychology, London, Canada
Functional connectivity of the frontal eye fields in humans and macaque monkeys investigated with resting-state fMRI
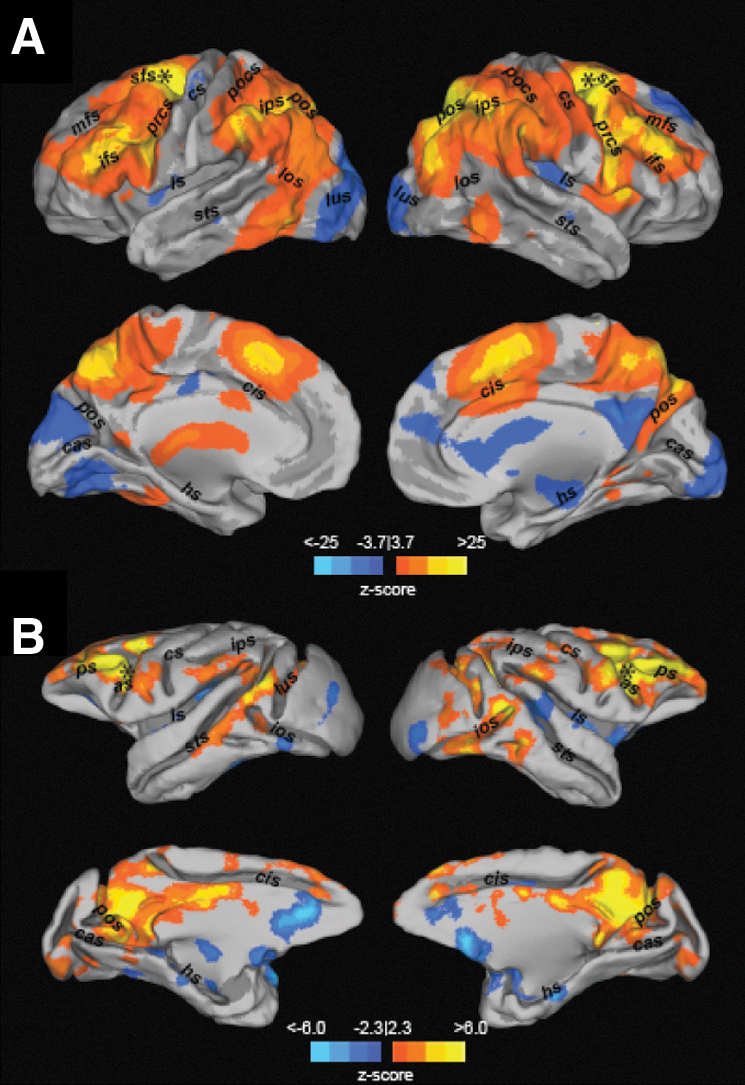
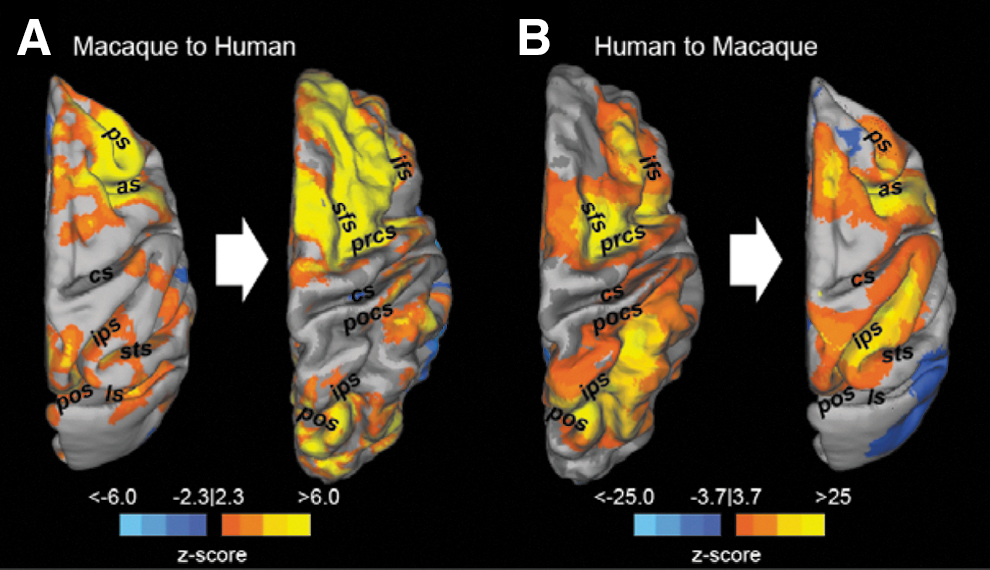
Although the frontal eye field (FEF) has been identified in macaque monkeys and humans, practical constraints related to invasiveness and task-demands have limited a direct cross-species comparison of its functional connectivity. In this study, we used resting-state functional MRI data collected from both awake humans and anesthetized macaque monkeys to examine and compare the functional connectivity of the FEF. A seed-region analysis revealed consistent ipsilateral functional connections of the FEF with fronto-parietal cortical areas across both species (Fig 1). These included the intraparietal sulcus, dorsolateral prefrontal cortex, anterior cingulate cortex, and supplementary eye fields. The analysis also revealed greater lateralization of connectivity with the FEF in both hemispheres in humans than in monkeys. Cortical surface-based transformation of connectivity maps between species further corroborated the remarkable similar organization of the FEF functional connectivity (Fig 2). The results support an evolutionarily preserved fronto-parietal system and provide a bridge for linking data from monkey and human studies.
FIG. 1.
FIG. 2.
Applications: Neurology
KippingJ.1SchaeferA.1VillringerA.1MarguliesD.1
Max Planck Institute for Human Cognitive and Brain Sciences, Neurology, Leipzig, Germany
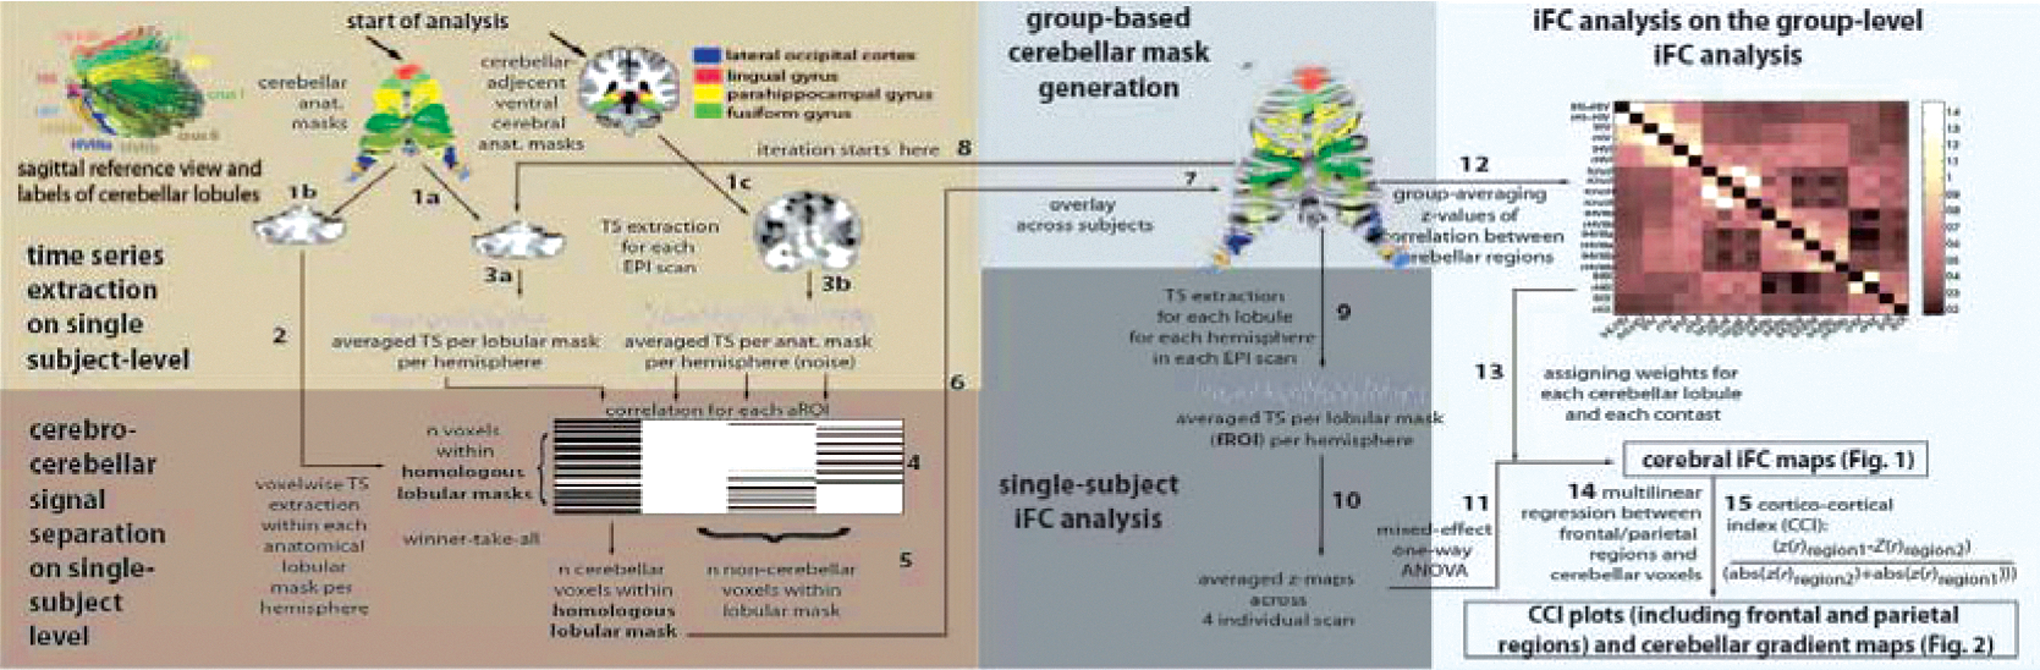
Functional dissociation of cerebello-frontal and cerebello-parietal networks on the individual and group level using intrinsic functional connectivity.
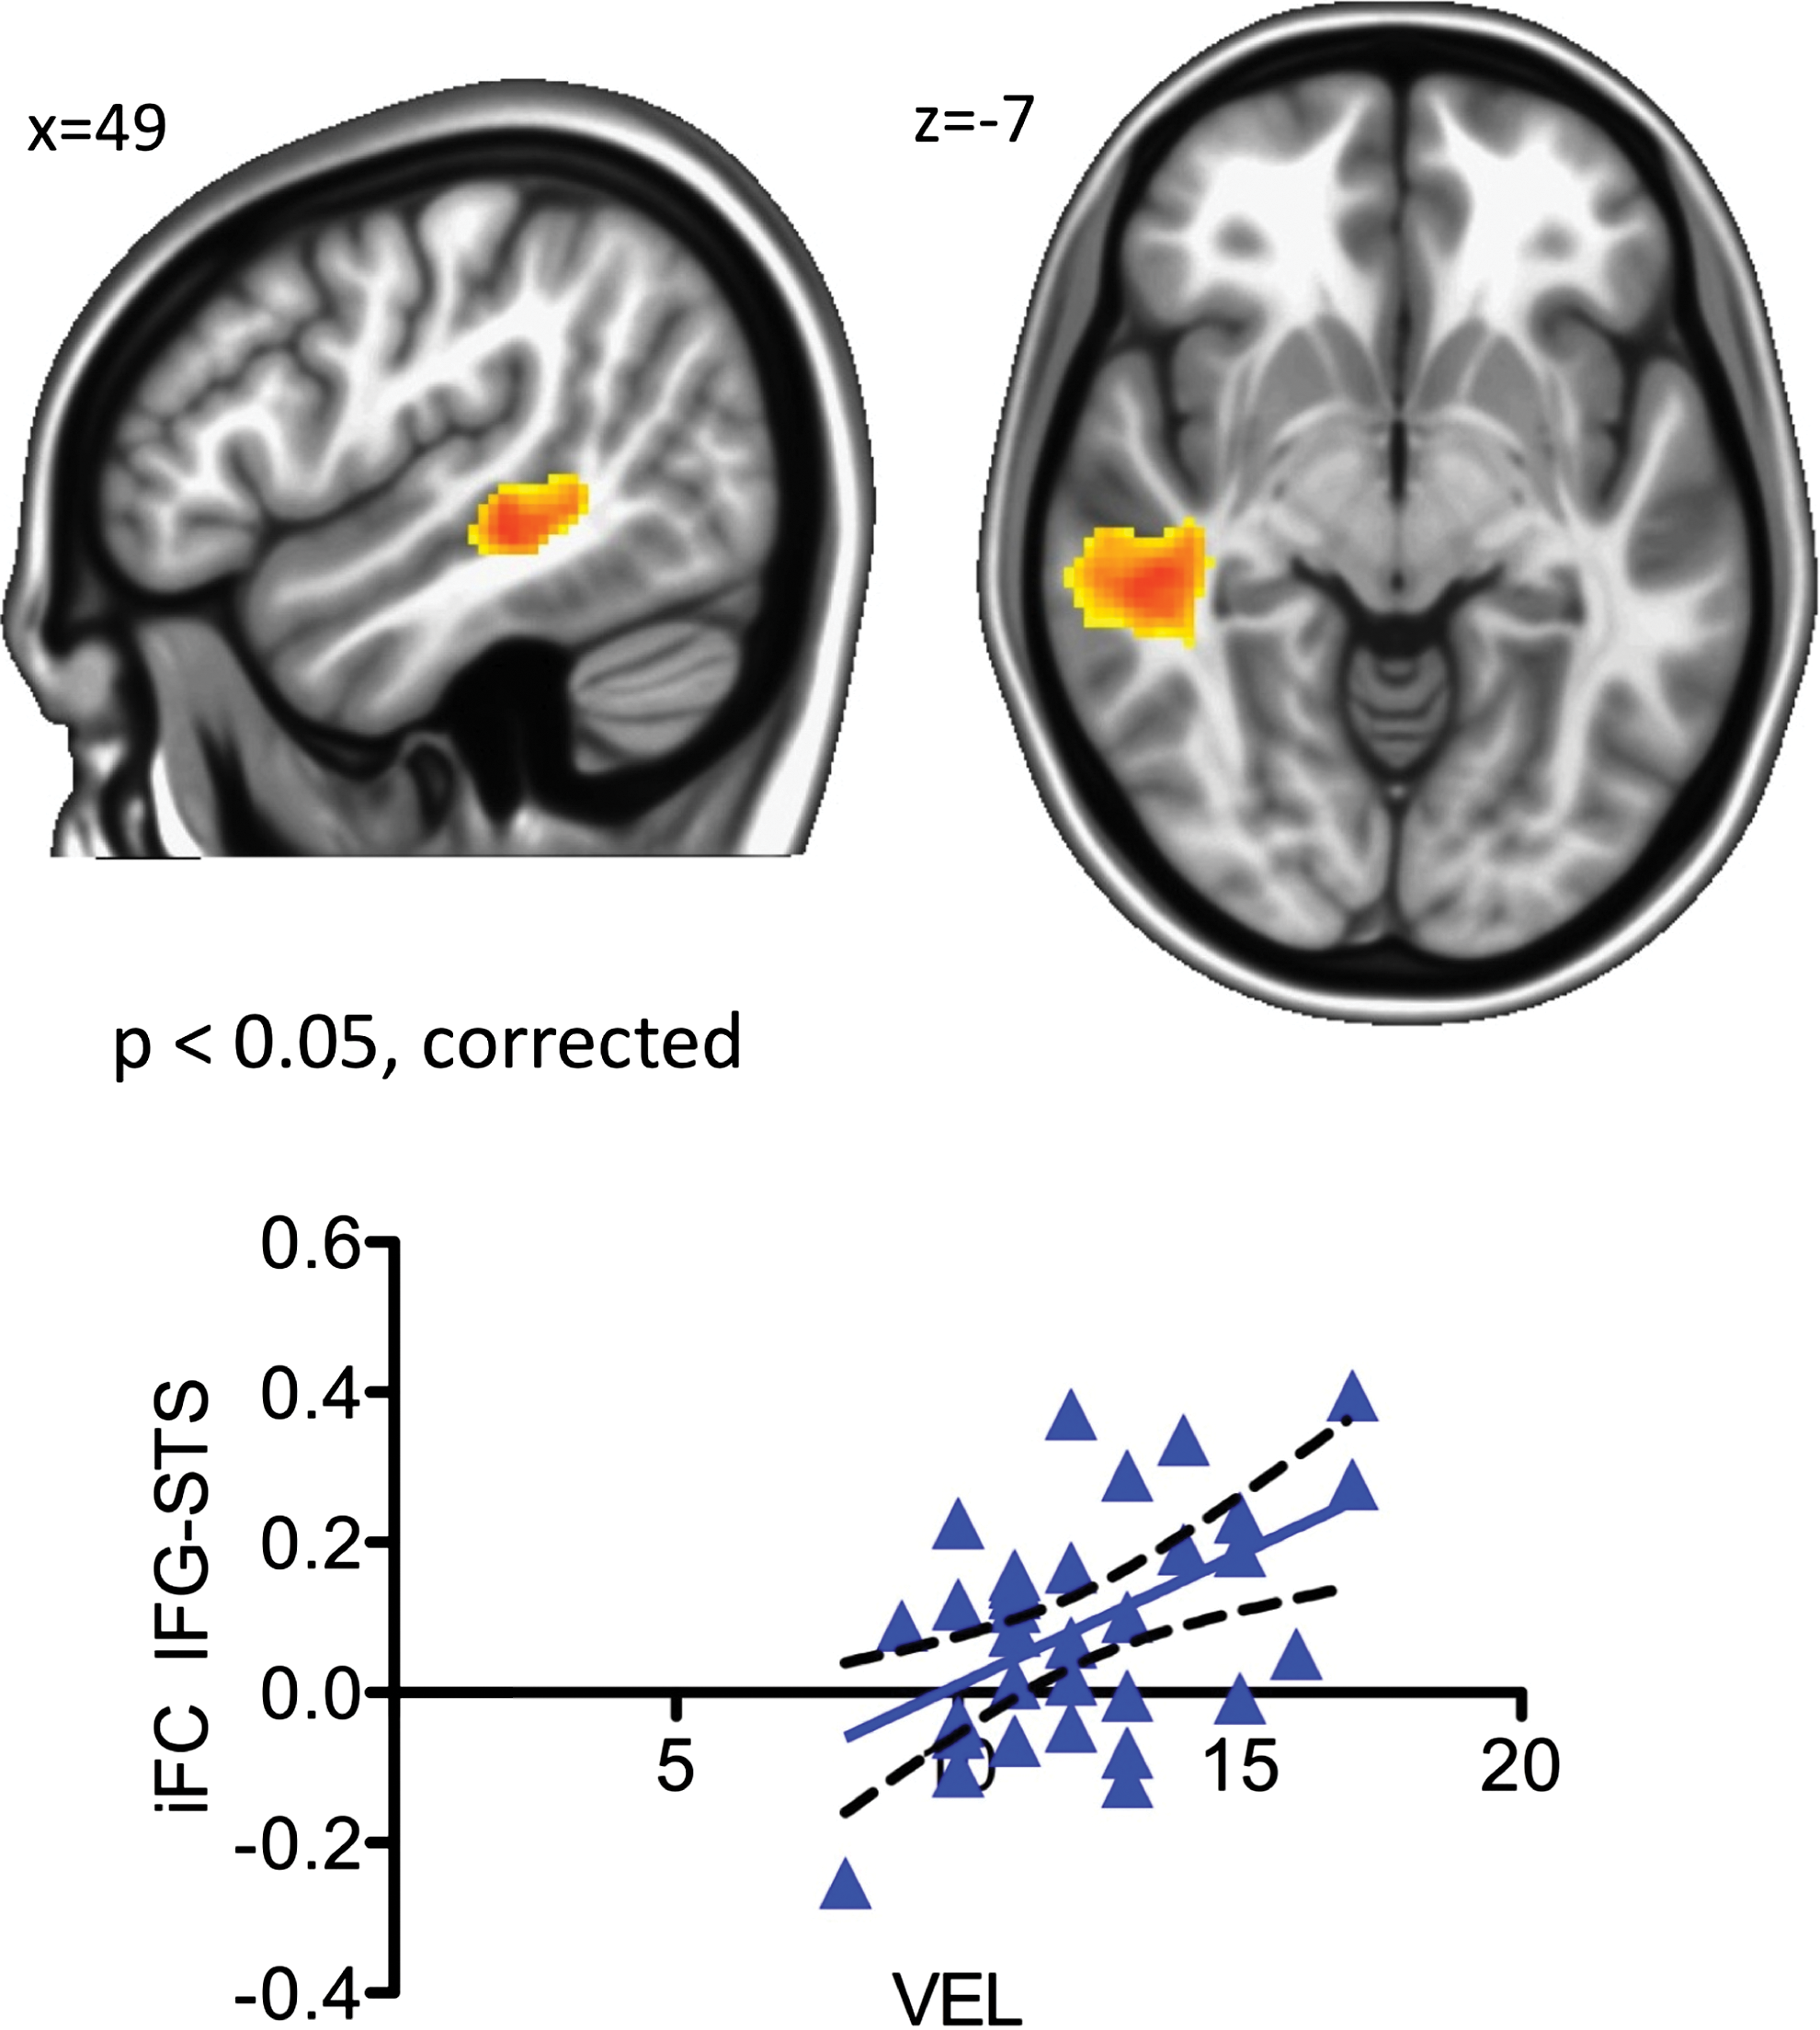
Question: Fronto-parieto-cerebellar fMRI activations were found in various cognitive tasks. Recent intrinsic functional connectivity fMRI (iFC-fMRI) studies differentiated between fronto-parietal and sensorimotor-related networks. However, animal studies propose: Superior cerebellar regions (sCb) are connected to prefrontal cortex (PFC) and inferior cerebellar regions (iCb) to posterior parietal cortex (PPC). Clinical data also suggest a functional dissociation between sCb (ataxia) and iCb (adaptive impairment). We hypothesize that sCb shows stronger iFC to prefrontal regions and iCb shows stronger iFC to parietal regions.
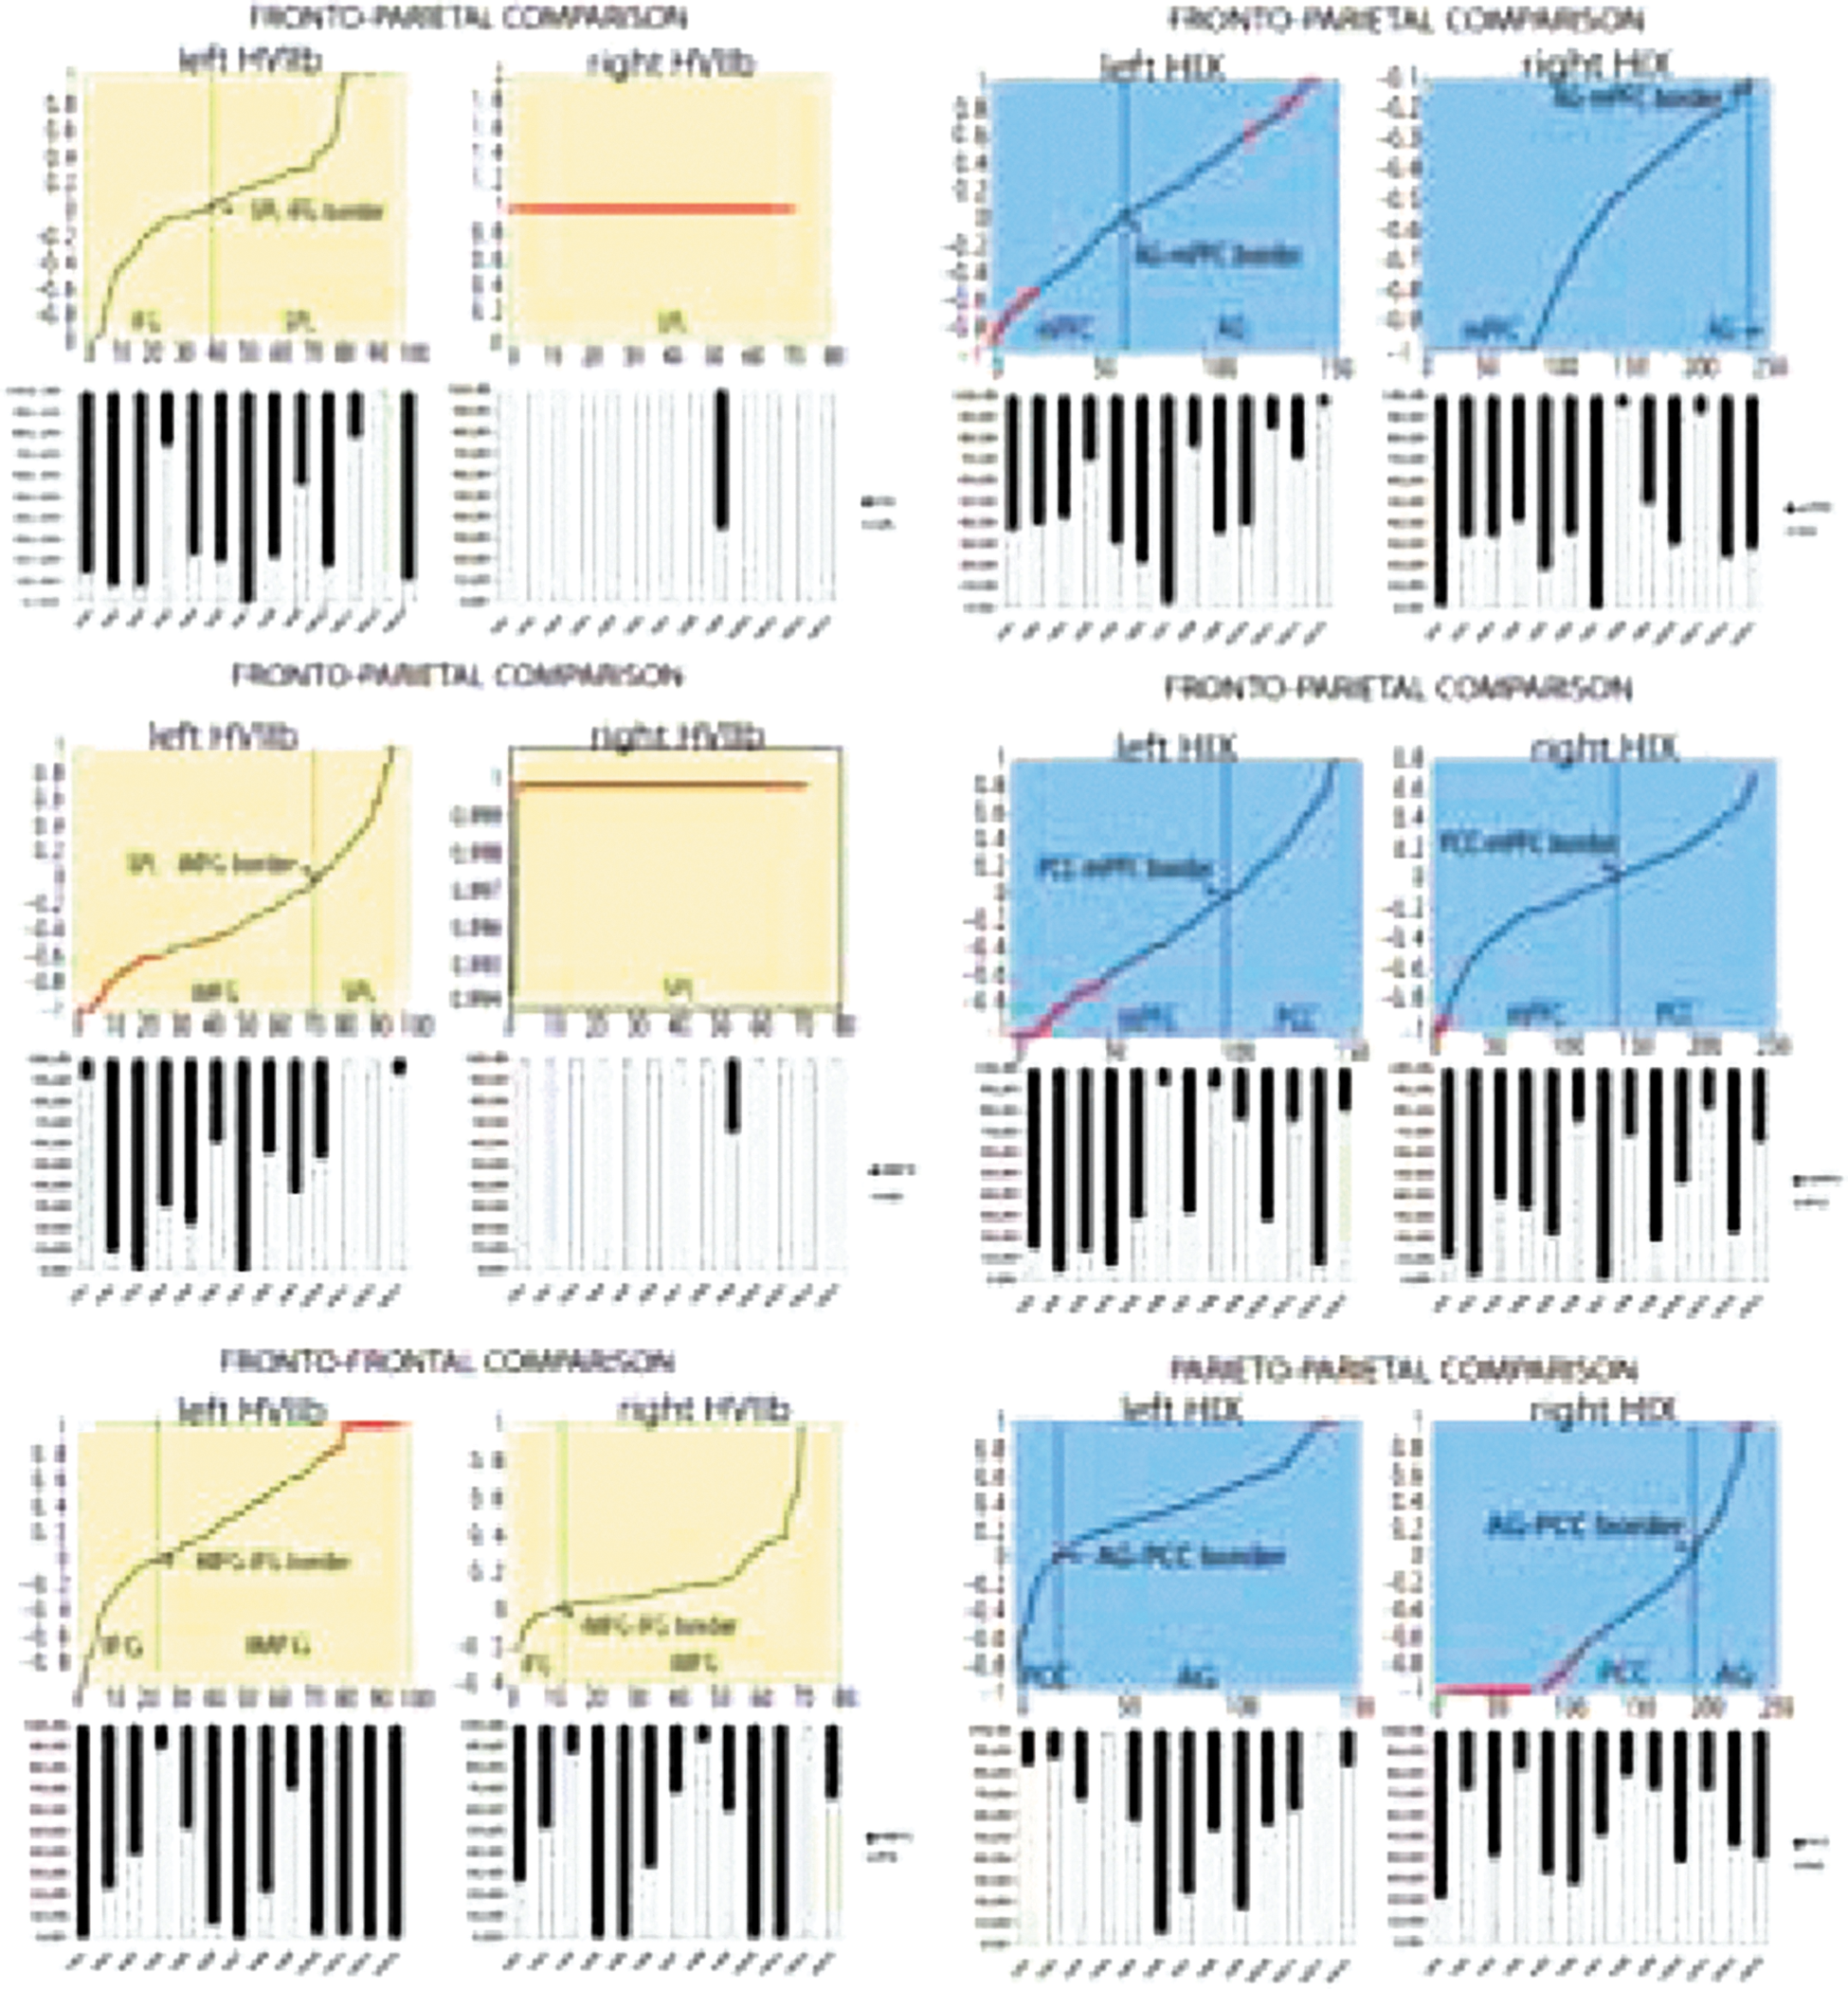
Methods: In 4 sessions functional and anatomical MRI data of 13 subjects were acquired and preprocessed using standard procedures. Further analysis is shown in Fig 1. Cerebellar regions which show iFC to both PFC and PPC were analyzed (color-coded lines in Fig 2). A regression between signals in PFC and PPC revealed residuals which were correlated with signals in cerebellar voxels (Fig 1, step 14). A cortico-cortical index (CCI, Fig 1, step 15) distinguished cerebellar voxels based on their iFC to PFC and PPC (Fig 3 and 4).
A novel seed selection process and iFC map generation.
iFC maps (top) of the 4 cerebellar lobules (bottom). For simplicity, left cerebral hemisphere shows iFC of right cerebellar hemisphere and vice versa.
Plots of group CCI over cerebellar voxels (in lobules of sCb) show dissected cerebro-cerebellar networks. Vertical line indicates the transition from one cerebral region (CCI0). Significantly stronger iFCs are indicated by red circles (p
Results: sCb (crus I and II) and iCb (HVIIb, HIX) showed fronto-parietal iFC (Fig 2). CCI plots show a significantly stronger iFC of sCb to PFC than to PPC. This was found in 12 individuals (except left crus I). iCb showed iFC to PFC and PPC. Stronger iFC to PPC was only found in right HVIIb.
Conclusion: iFC-fMRI is able to functionally dissociate fronto-parieto-cerebellar networks. Whereas sCb is connected to PFC, iCb is connected to both PFC/PPC. A functional dissociation between sCb and PFC, and iCb and PPC was only found for the right cerebellar hemisphere.
Data Analysis
BellecP.12OrbanP.1DansereauC.1DickinsonP.13PetersF.14BellevilleS.14CarbonellF.5
Institut de Gériatrie de Montréal, Centre de recherche, Montreal, Canada
Université de Montréal, Informatique et recherche opérationnelle, Montreal, Canada
McGill University, Neuroscience, Montreal, Canada
Université de Montréal, Psychology, Montreal, Canada
Biospective, Montreal, Canada
A multiscale approach to statistical parametric connectomes in resting-state fMRI
Introduction: Instead of focusing on a few selected regions, a statistical parametric connectome (SPC) analysis tests the association between a pathology and every connnections in the brain. With >108 connections at a typical rs-fMRI resolution, such a large multiple comparison problem is bound to have weak detection power. How to achieve an optimal trade-off between the spatial resolution and the number of multiple comparisons remains an open question. We propose here to systematically vary the resolution in a SPC via a cluster analysis in order to maximize the rate of discoveries.
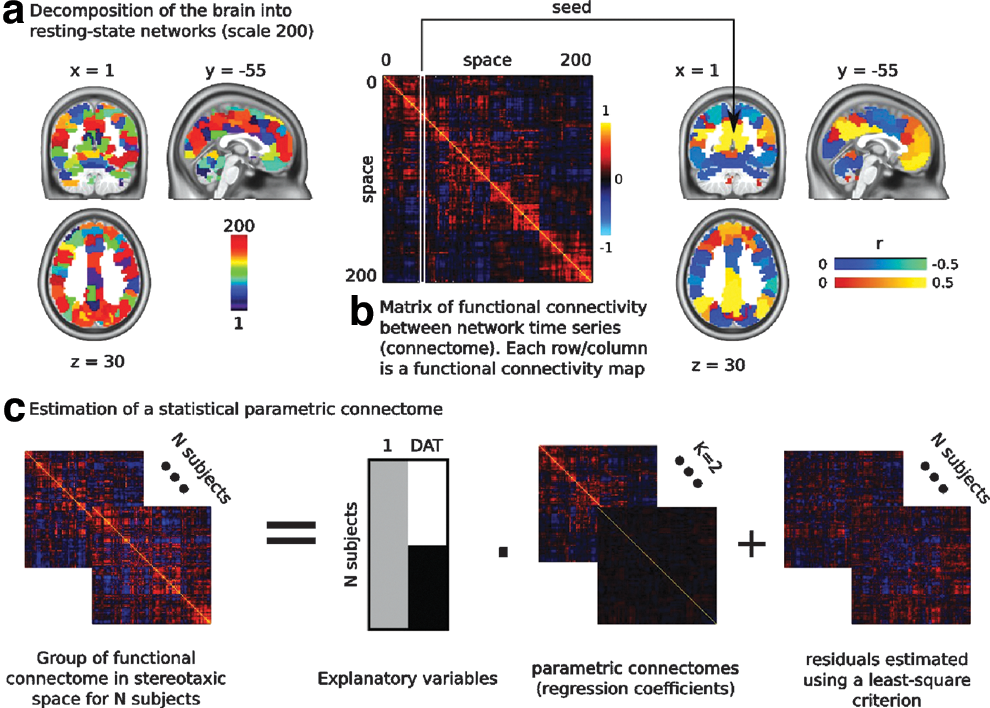
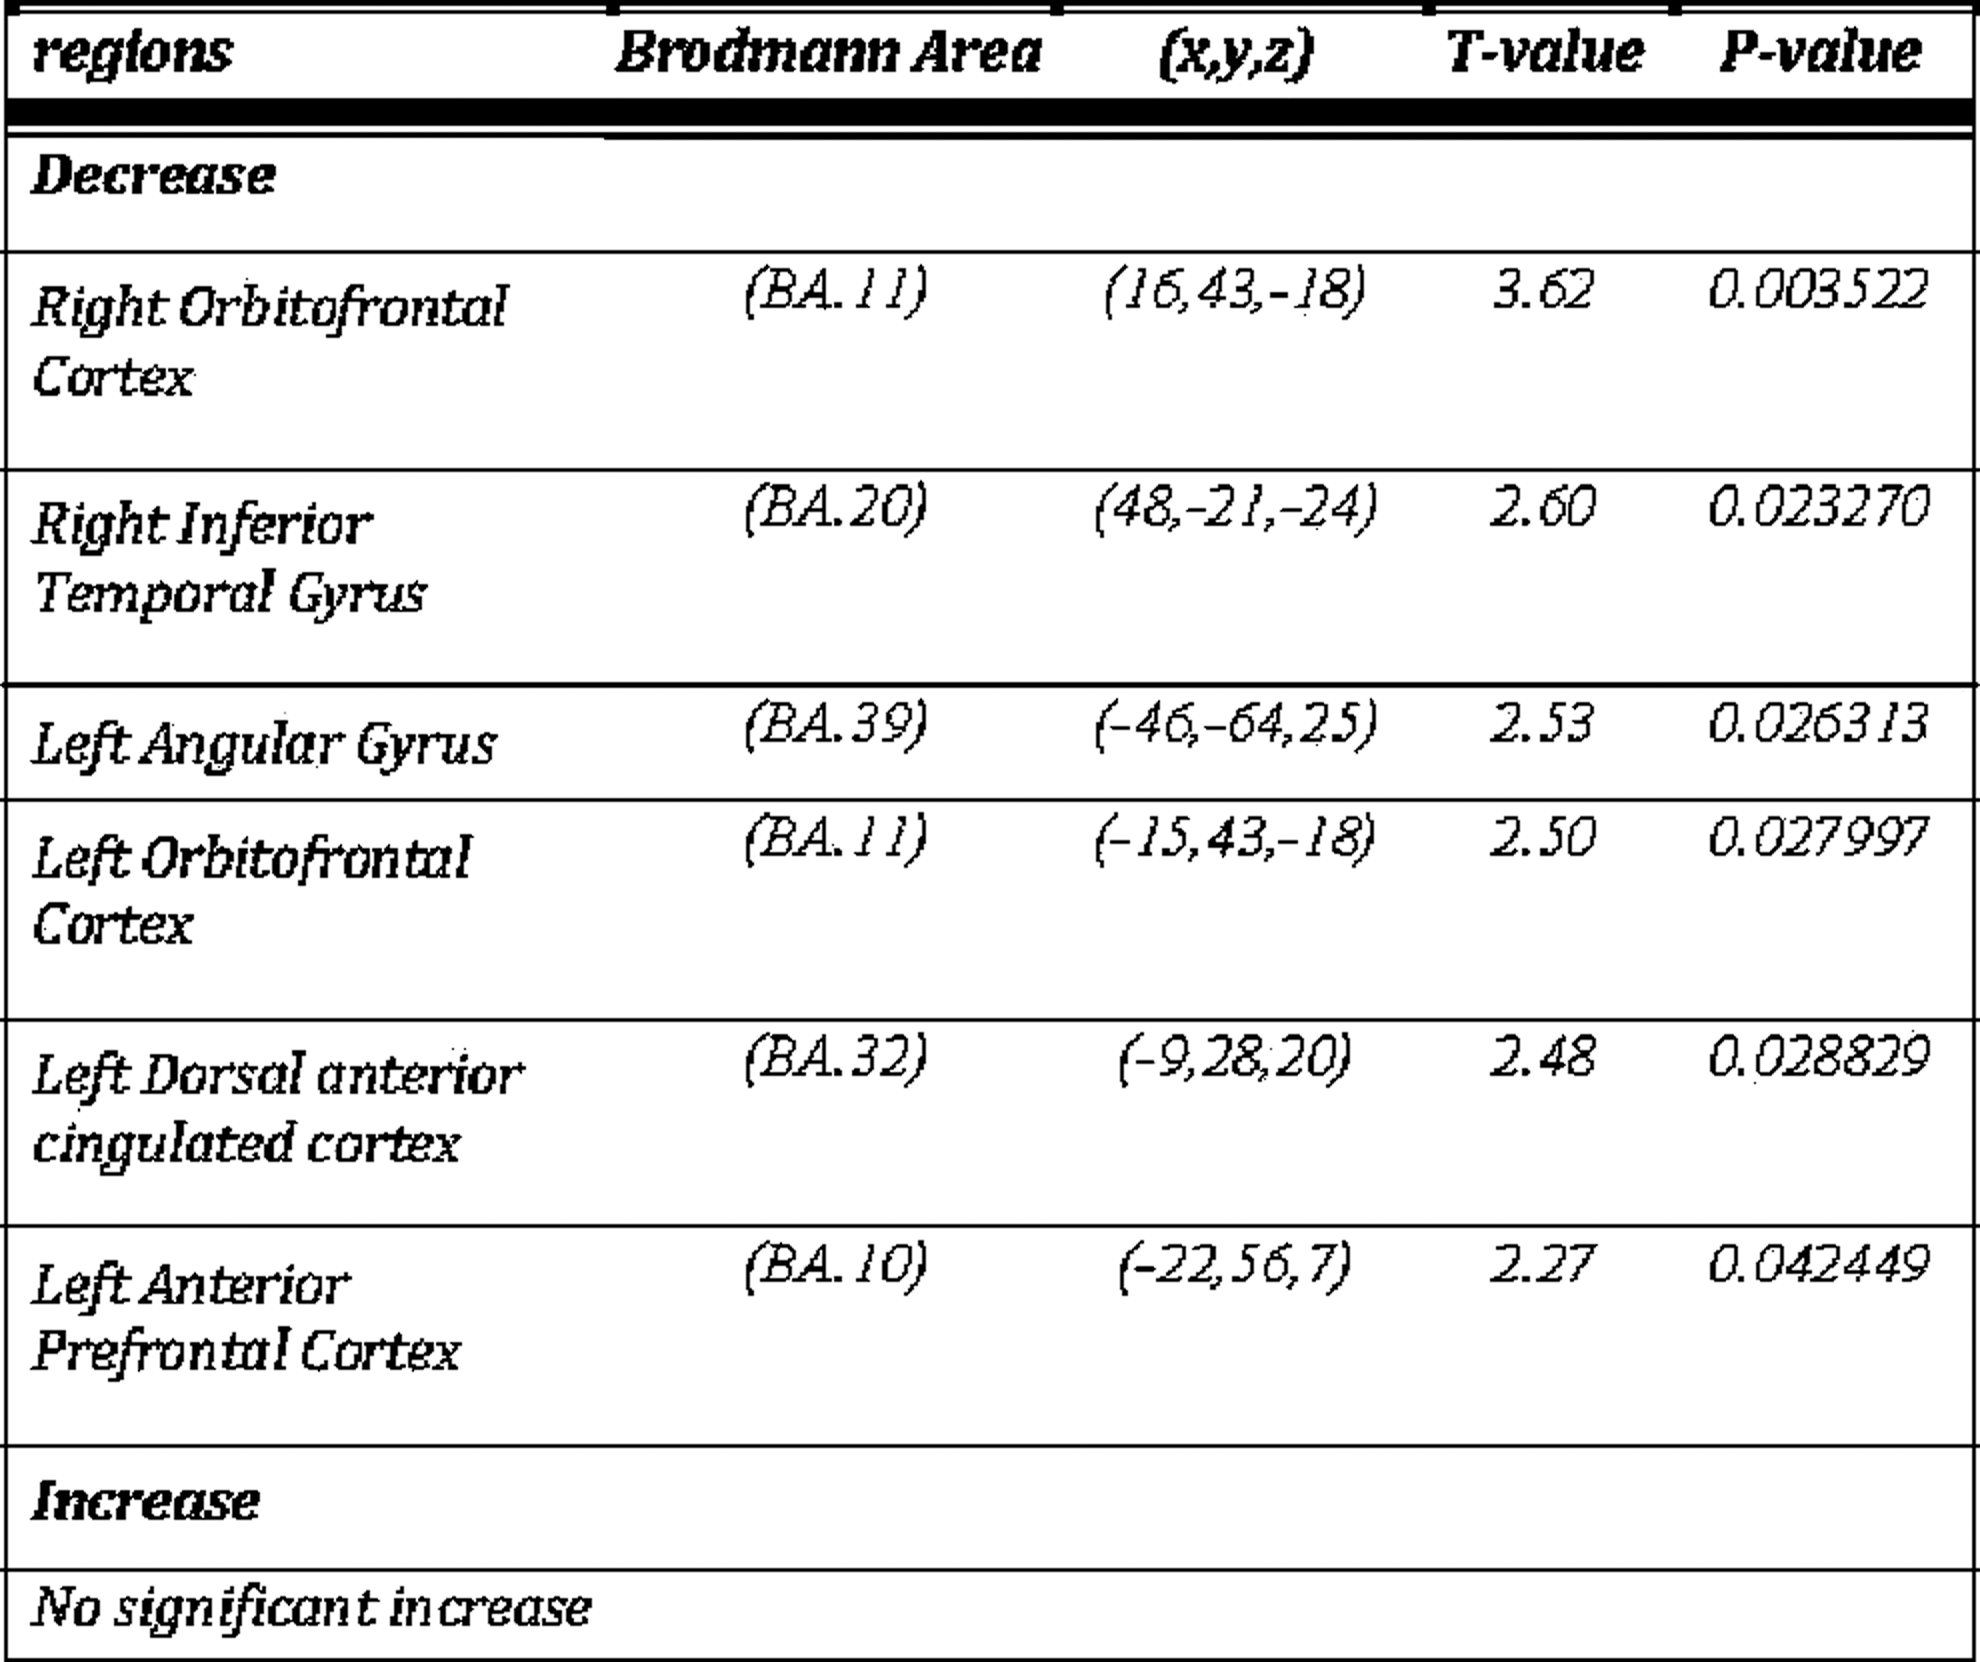
Methods: We contrasted a group of 8 patients with a dementia of the Alzheimer's type (DAT) against 8 healthy controls against (7 women per group, aged 63 to 85 years old). One rs-fMRI run (240 volumes, TR=2s) was acquired for each subject. A bootstrap analysis of stable clusters (BASC, [1]) was applied to build group resting-state networks at multiple scales (i.e. 10, 50, 100, 200, 500 networks). For each scale and each subject, a connectome of temporal correlations was derived (Figure 1a-b).
statistical parametric connectome.
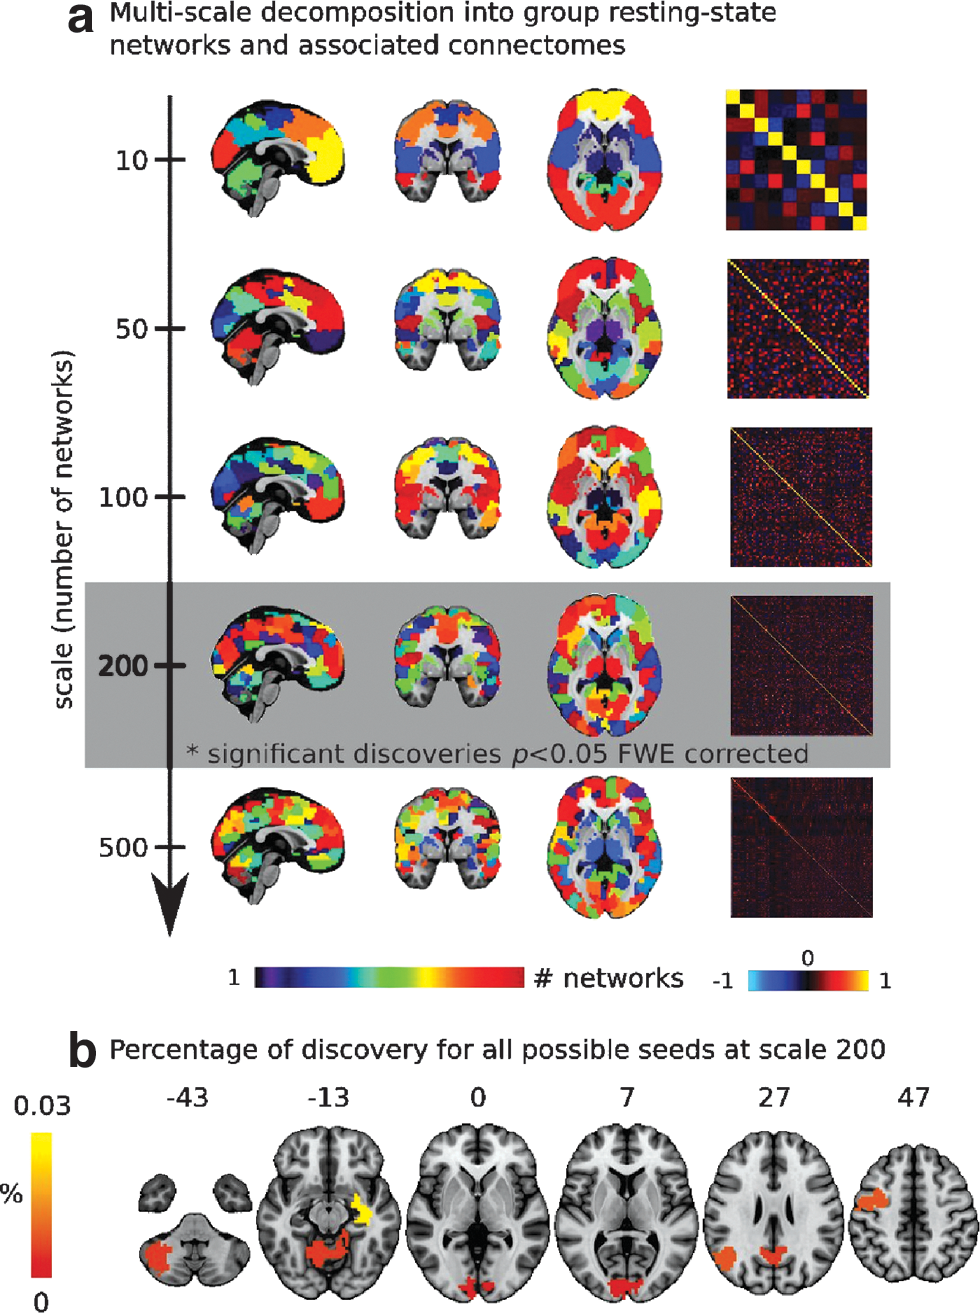
A general linear model analysis was used to test the effect of DAT on brain connectivity (Figure 1c). A group false-discovery rate procedure was used to detect significant effects of DAT repeated independently at all selected scales ((q<0.1, [2], Figure 2a). The significance of the number of discoveries at all scales was tested against the global null hypothesis of no association (permutation test with family-wise error <0.05).
multiscale statistical parametric connectomes.
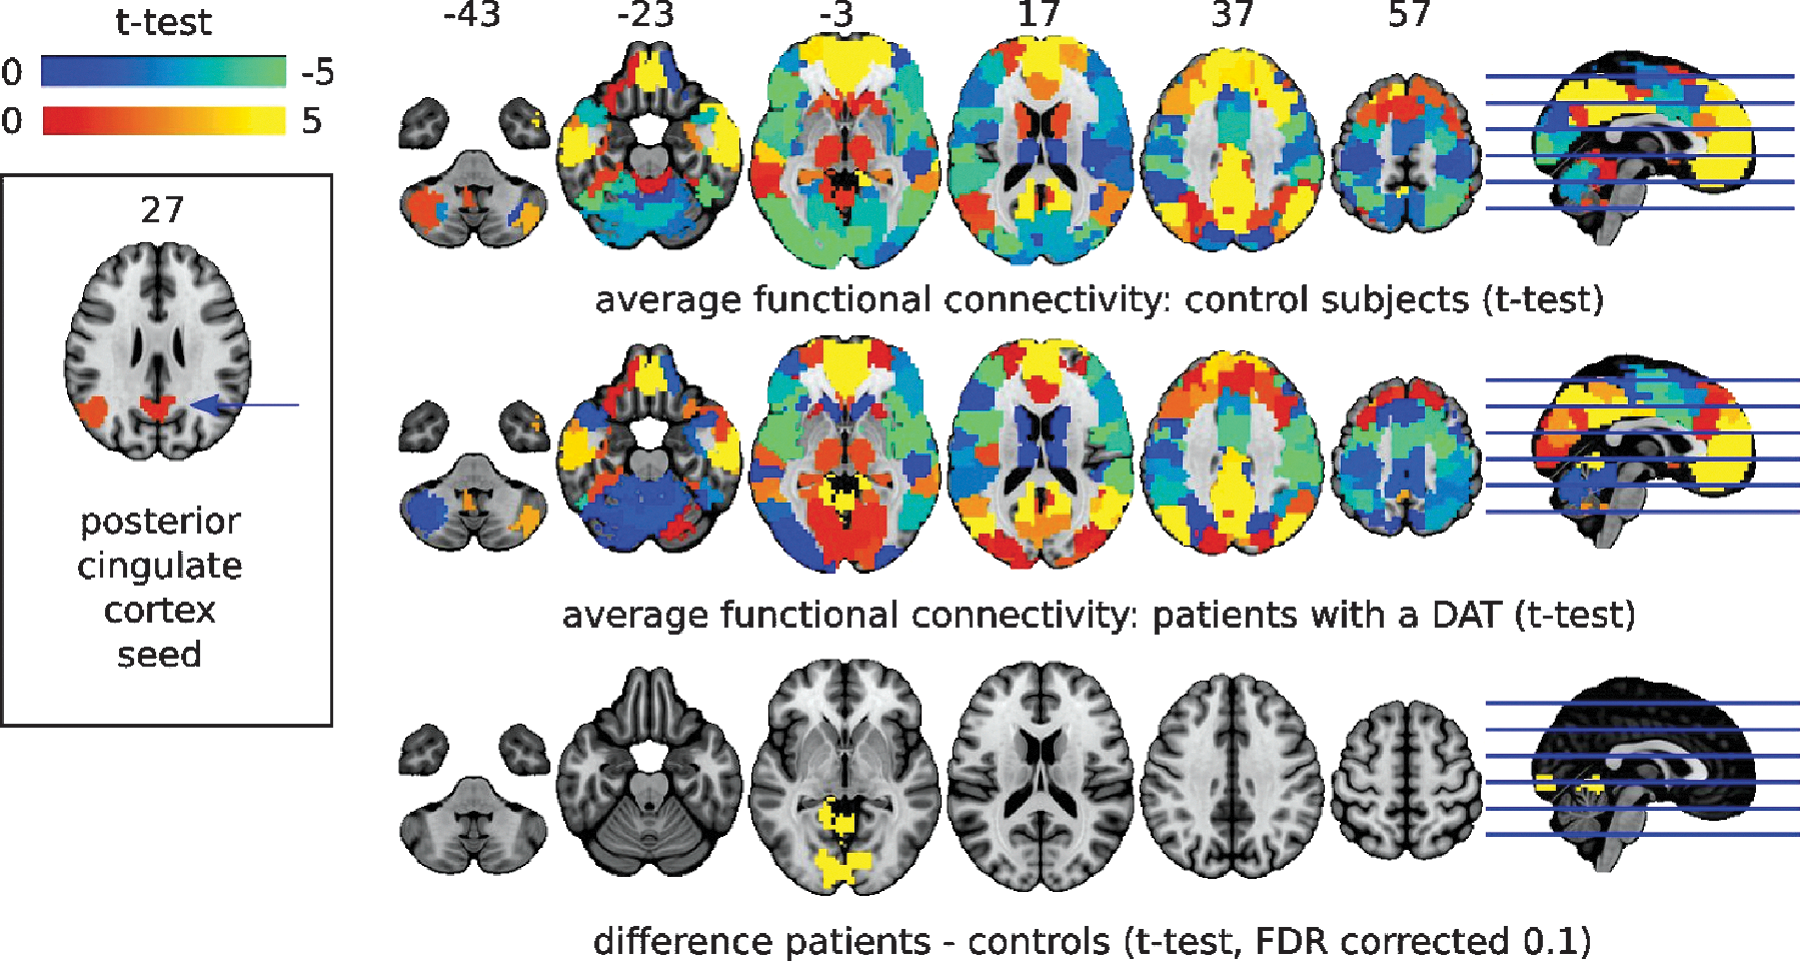
Results: Networks associated with significant discoveries could only be identified at scale 200 (Figure 2b). The highest number of discoveries was associated with the right hippocampus (e.g. decreased connectivity with the medial frontal cortex, Figure 3). The posterior cingulate cortex also showed important modulations in connectivity by DAT (Figure 4).
differences in connectivity with the right hippocampus seed.
differences in connectivity with the posterior cingulated seed.
Conclusion: The mutliscale approach to SPC was able to detect effects in a very small group sample where a single scale analysis could have resulted in no findings. We further confirmed the importance of multiscale detection on simulated datasets and larger group samples for other pathologies. The choice of the spatial scale is thus critical to optimize the statistical power in a SPC.
References
Bellecet al.Neuroimage, 2010.Huet al.JASA, 2010.
Animal Imaging
JonckersE.1ShahD.1BigotC.1VanhoutteG.1VerhoyeM.1AsselberghsB.2PeresonS.2Van BroeckhovenC.2Van der LindenA.1
Bio-Imaging Lab, Biomedical Sciences, Antwerp, Belgium
University of Antwerp, molecular genetics, Antwerp, Belgium
The use of resting state functional MRI to assess functional connectivity in a mouse model of Alzheimer's disease
Introduction: AD pathology is characterized mainly by the formation of amyloid plaques, tau-fibrils and neurodegeneration. Amyloid plaque deposition occurs at an early stage and is hypothesized to be the driving force behind AD. Resting state fMRI (rsfMRI) in human research has proven that subjects showing amyloid plaques but no other pathological hallmarks of AD exhibit altered functional connectivity (FC) in the brain1, suggesting a possible relation between altered FC and amyloid plaque deposition. Human rsfMRI studies are limited in studying these correlations, as AD is a complex disease with many different pathological alterations. Using a mouse model mimicking only certain aspects of AD would facilitate the assessment of these correlations. The hypothesis of this study is that the FC alterations in AD are associated with the presence of amyloid plaques.
Material and Methods: 10 male APPPS1 mice (APP-KM670/671NL, PS1-L166P) bred on a C57BL6 background and 9 male control C57BL6 mice of (18.9±1.3) months old were imaged on a 7T Pharmascan (Bruker BioSpin, Germany). APPPS1 mice show amyloid plaque deposition from 6 weeks onwards. The old age of the mice in this study ensures a heavy plaque load. Furthermore, these mice show no tau-pathology or neurodegeneration2. The rsfMRI data were acquired using a single shot gradient echo EPI sequence. For the analysis we opted for independent component analysis (ICA).
Results: The ICA analysis revealed differences in FC between both groups. The following components came out of the analysis: hippocampus, thalamus, hypothalamus, retrosplenial cortex, piriform cortex, entorhinal cortex, auditory cortex, visual cortex, somatosensory cortex and striatum. The regions that were affected were the hippocampus and cortical areas such as the piriform cortex. These results are in accordance with literature2 and histological data that demonstrate heavy plaque load in the hippocampus and cortex.
Conclusion: The results of this study suggest that amyloid plaque deposition and altered FC are related. The next step will be to study young mice longitudinally to find out how exactly FC changes in relation to the progression of amyloid plaque deposition.
Acknowledgements: The research leading to these results has received funding from the European Union's Seventh Framework Programme (FP7/2007-2013) under grant agreement n° 278850 (INMiND).
References
Shelineet al.2010. Biol. psych., 67,6:584–587.
Raddeet al.2006. EMBO reports, 7:940–946.
Applications: Neurology
JordanD.1RiedlV.2WohlschlaegerA.2HemmerB.3ZimmerC.2KochsE.1IlgR.3
Technische Universität München, Department of Anesthesiology, Muenchen, Germany
Technische Universität München, Department of Neuroradiology, Muenchen, Germany
Technische Universität München, Department of Neurology, Muenchen, Germany
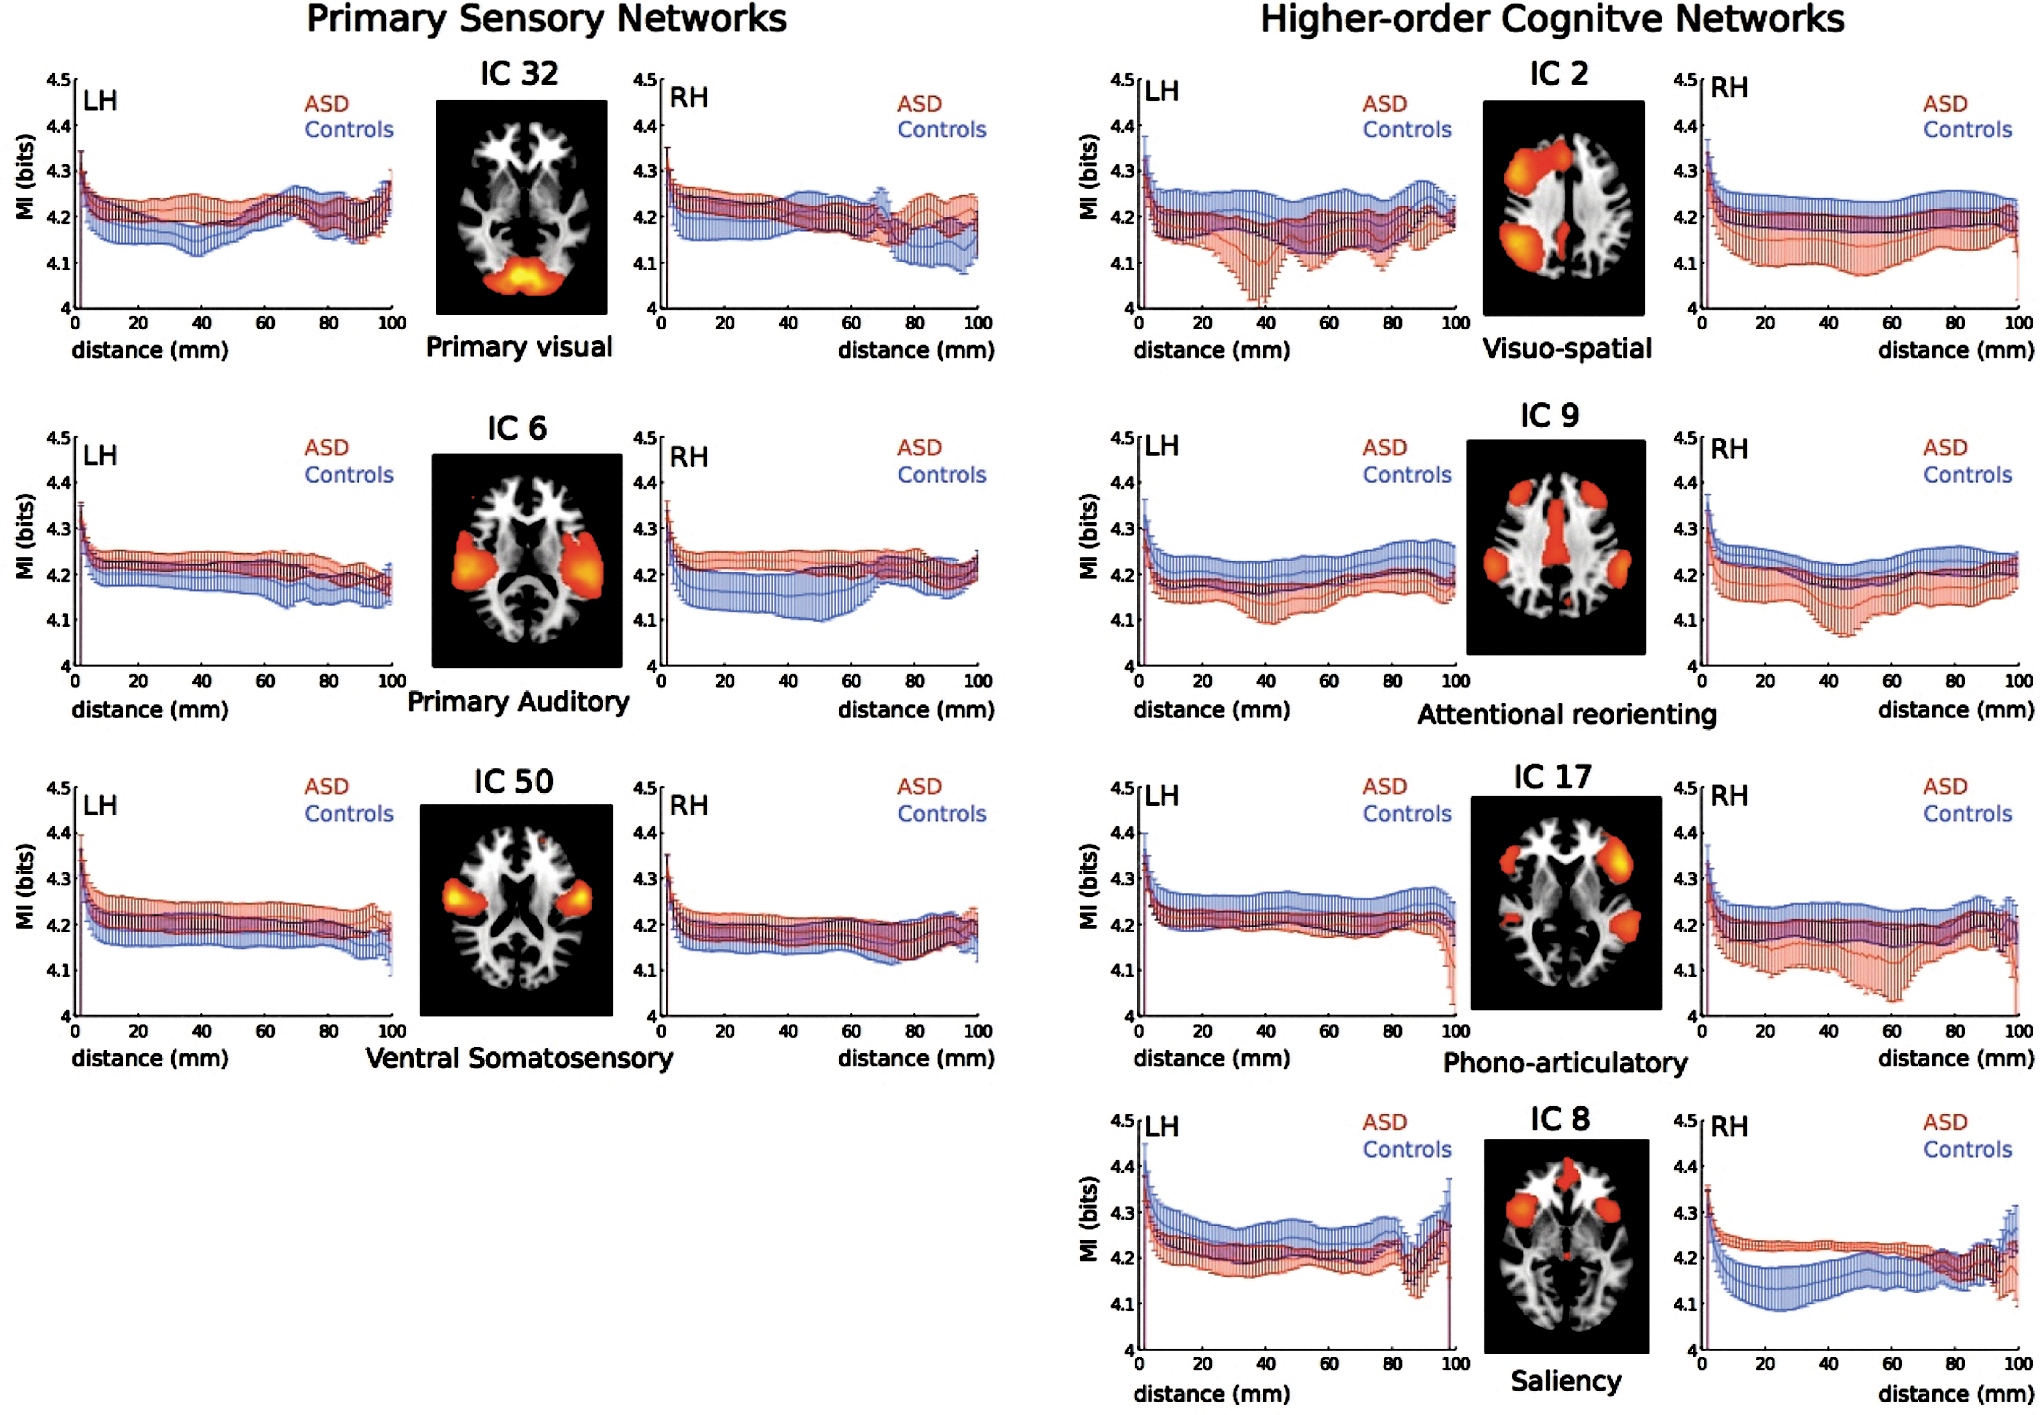
Opposite behaviour of resting state connectivity and stimulus-related activation under propofol-induced loss of consciousness
Introduction: Several studies reported changes in the functional connectivity (FC) of the brain under anesthesia-induced unconsciousness. To investigate the functional relevance of FC changes in resting state fMRI under anesthesia we performed a combined resting state and auditory stimulation fMRI experiment under propofol-induced unconsciousness.
Methods: 12 Volunteers were instructed to relax and close eyes while 3T-fMRI, 64-channel EEG and AEP (auditory evoked potential) recordings were performed. Propofol was infused by a target controlled infusion (TCI) pump until loss of consciousness (LOC). Independent components (ICs) of fMRI resting state networks were identified using independent component analysis based on a standard processing pipeline in SPM5 and GIFT. The FC between thalamus and primary auditory cortex was analysed by pearson's correlation coefficients between the average individual signal time-courses of the thalamus and primary auditory cortex. Periods of auditory stimulation and silence were presented in randomized order in 8 s gaps between scans. Activation by auditory stimulation was modelled by a finite impulse response basis function. EEG and AEP signal analyses were performed with BrainVision Analyzer 2 and sources of AEP peak Nb were estimated using LORETA.
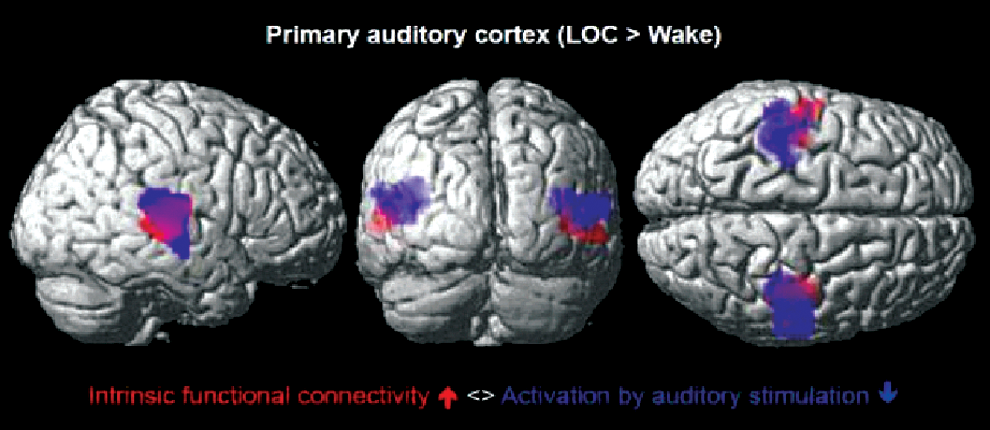
Results: While intrinsic FC within primary sensory networks (i.e., primary auditory and primary visual cortex) significantly increased, activation by auditory stimulation (AEP) within the auditory cortex significantly decreased (Figure 1). Cortical LORETA source localization of AEP peak Nb revealed a significant delay and decrease during LOC. Additional correlation analyses of the thalamocortical coupling revealed a significant uncoupling of thalamocortical connectivity under unconsciousness (two-way repeated measures ANOVA, r(BL)=0.12, r(LOC)=0.03, p=0.0035).
FIG. 1.
Discussion: As expected, the auditory cortex showed a significantly decreased activation by auditory stimulation under LOC which corresponded to a decreased amplitude and delay of mid latency AEP. At the same time, FC within the primary auditory cortex increased. Further analyses of individual signal time courses indicated that the opposite behavior of FC and stimulus-related activation may result from a thalamocortical decoupling.
Data Analysis
VenkataramanA.1KubickiM.2GollandP.1
MIT, Electrical Engineering & Computer Science, Cambridge, United States
Harvard Medical School, Psychiatry Neuroimaging Laboratory, Boston, United States
From Brain Connectivity Models to Identifying Foci of a Neurological Disorder
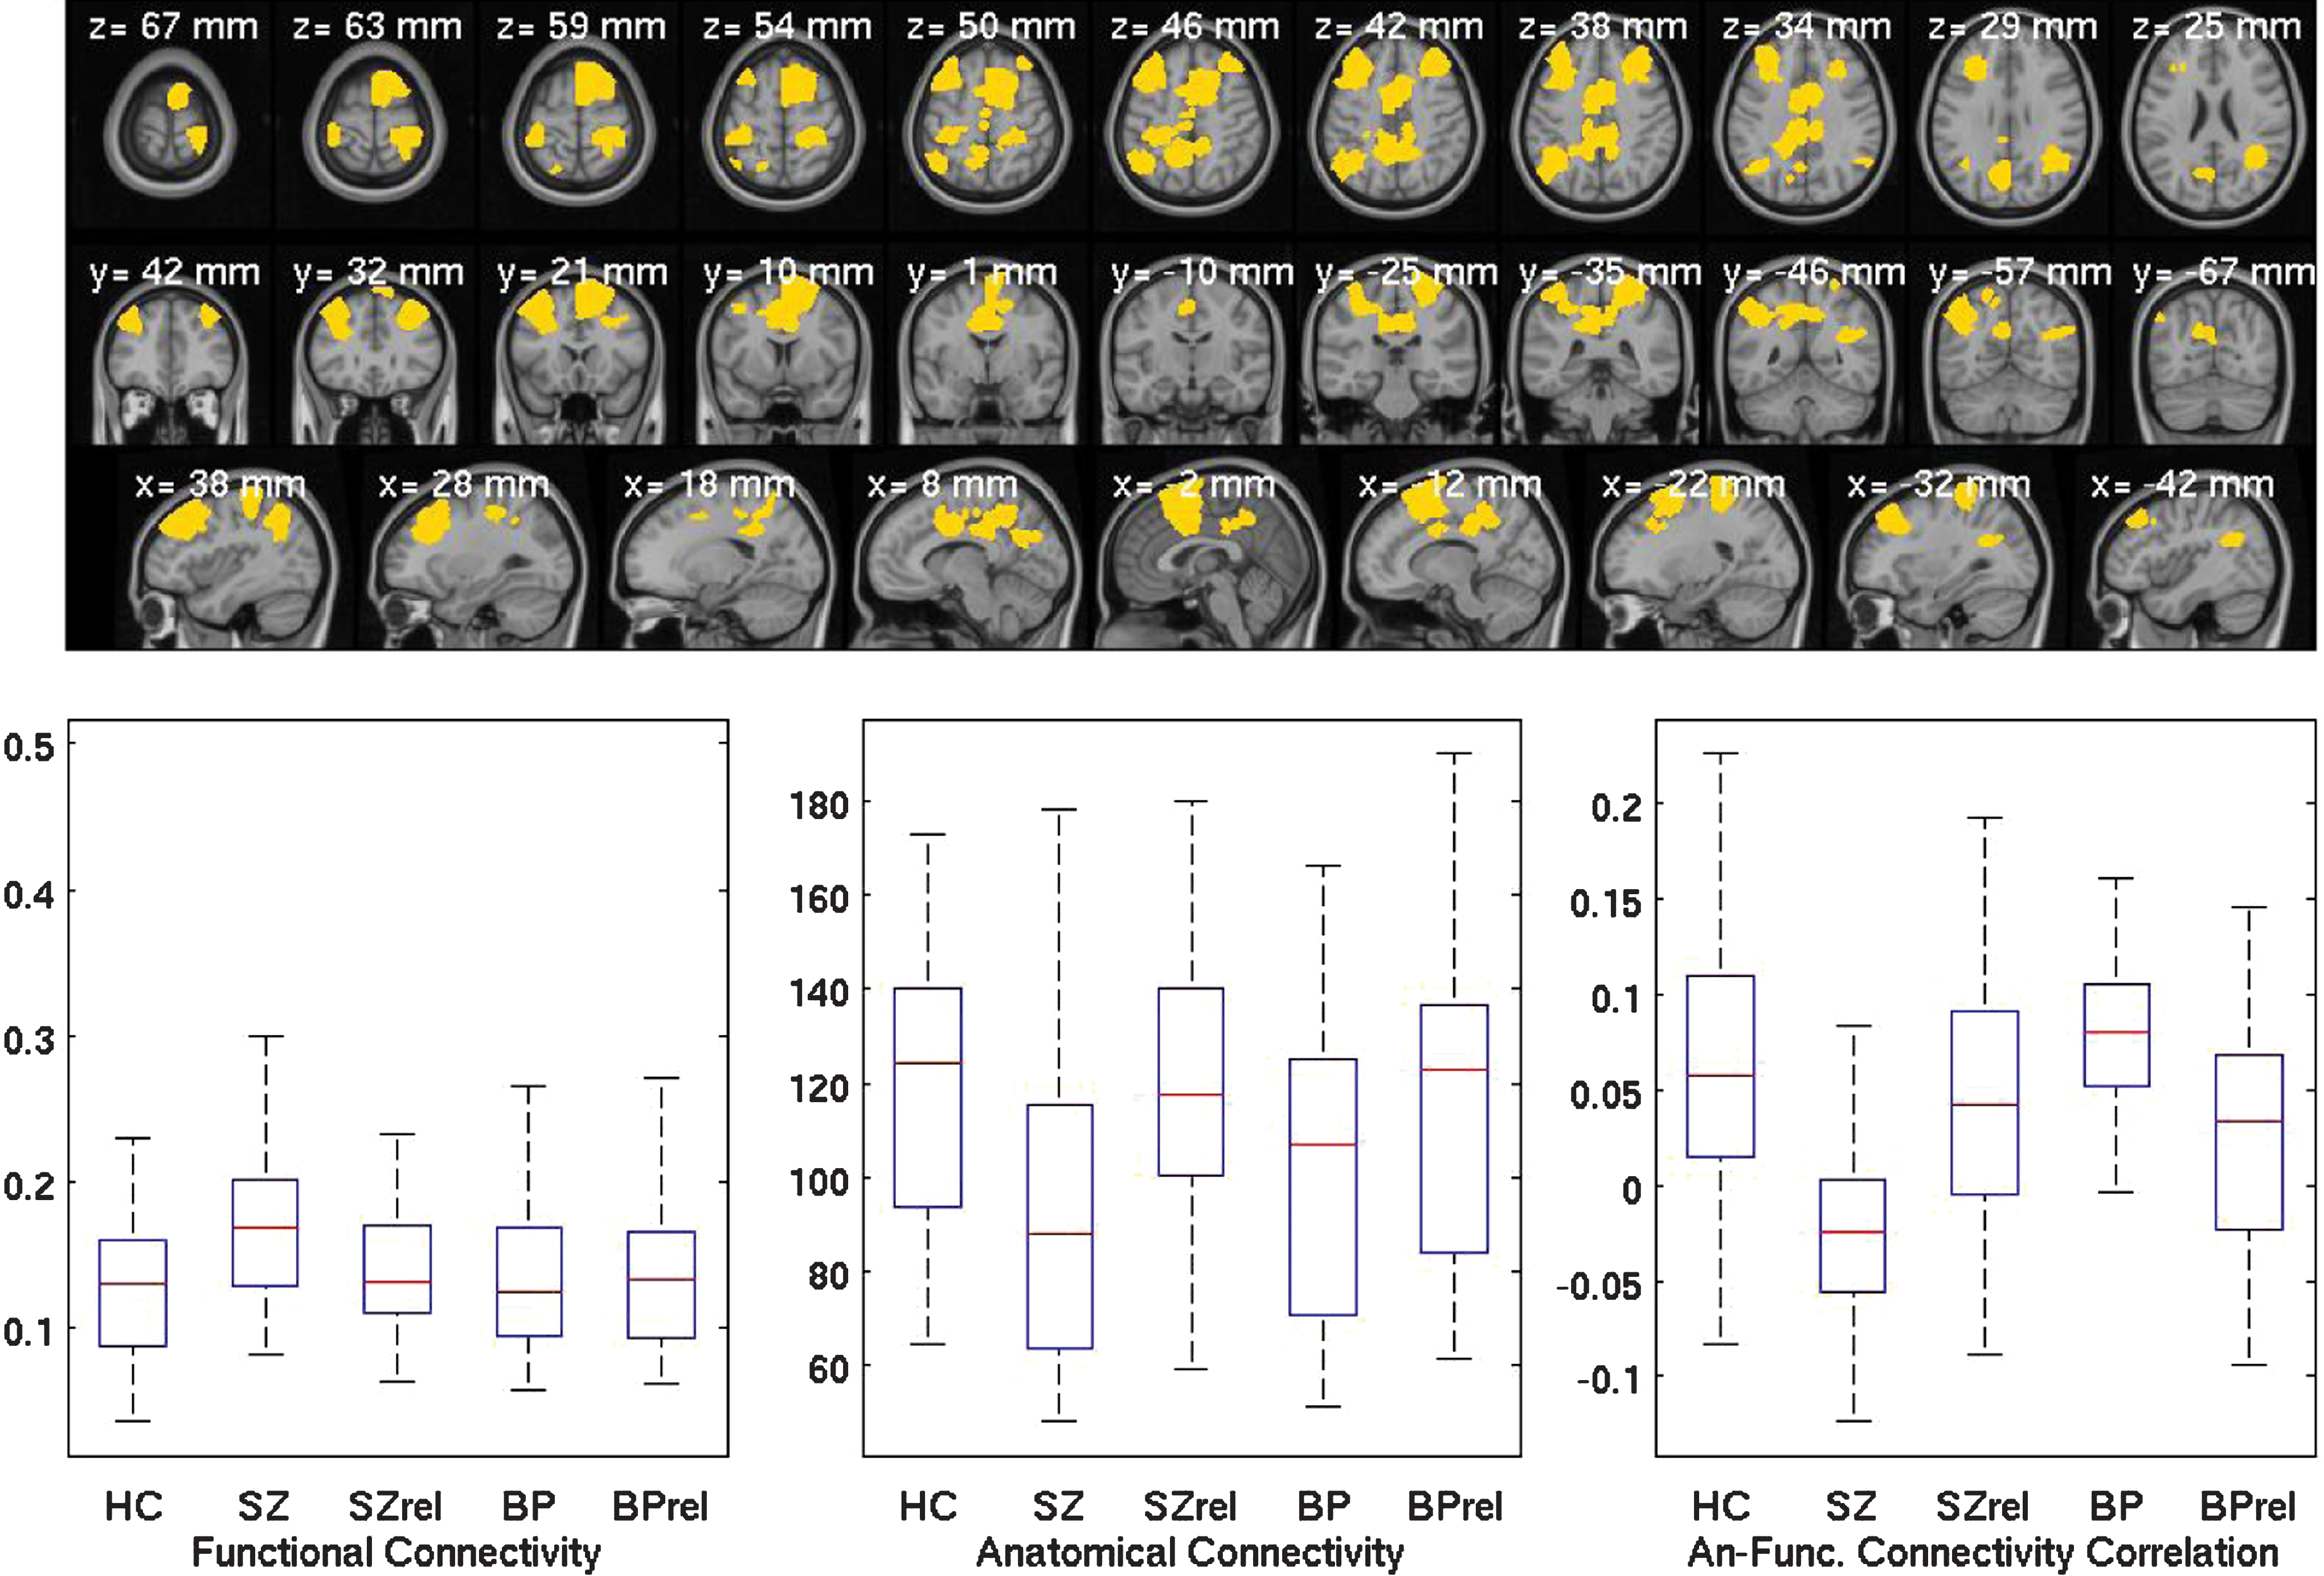
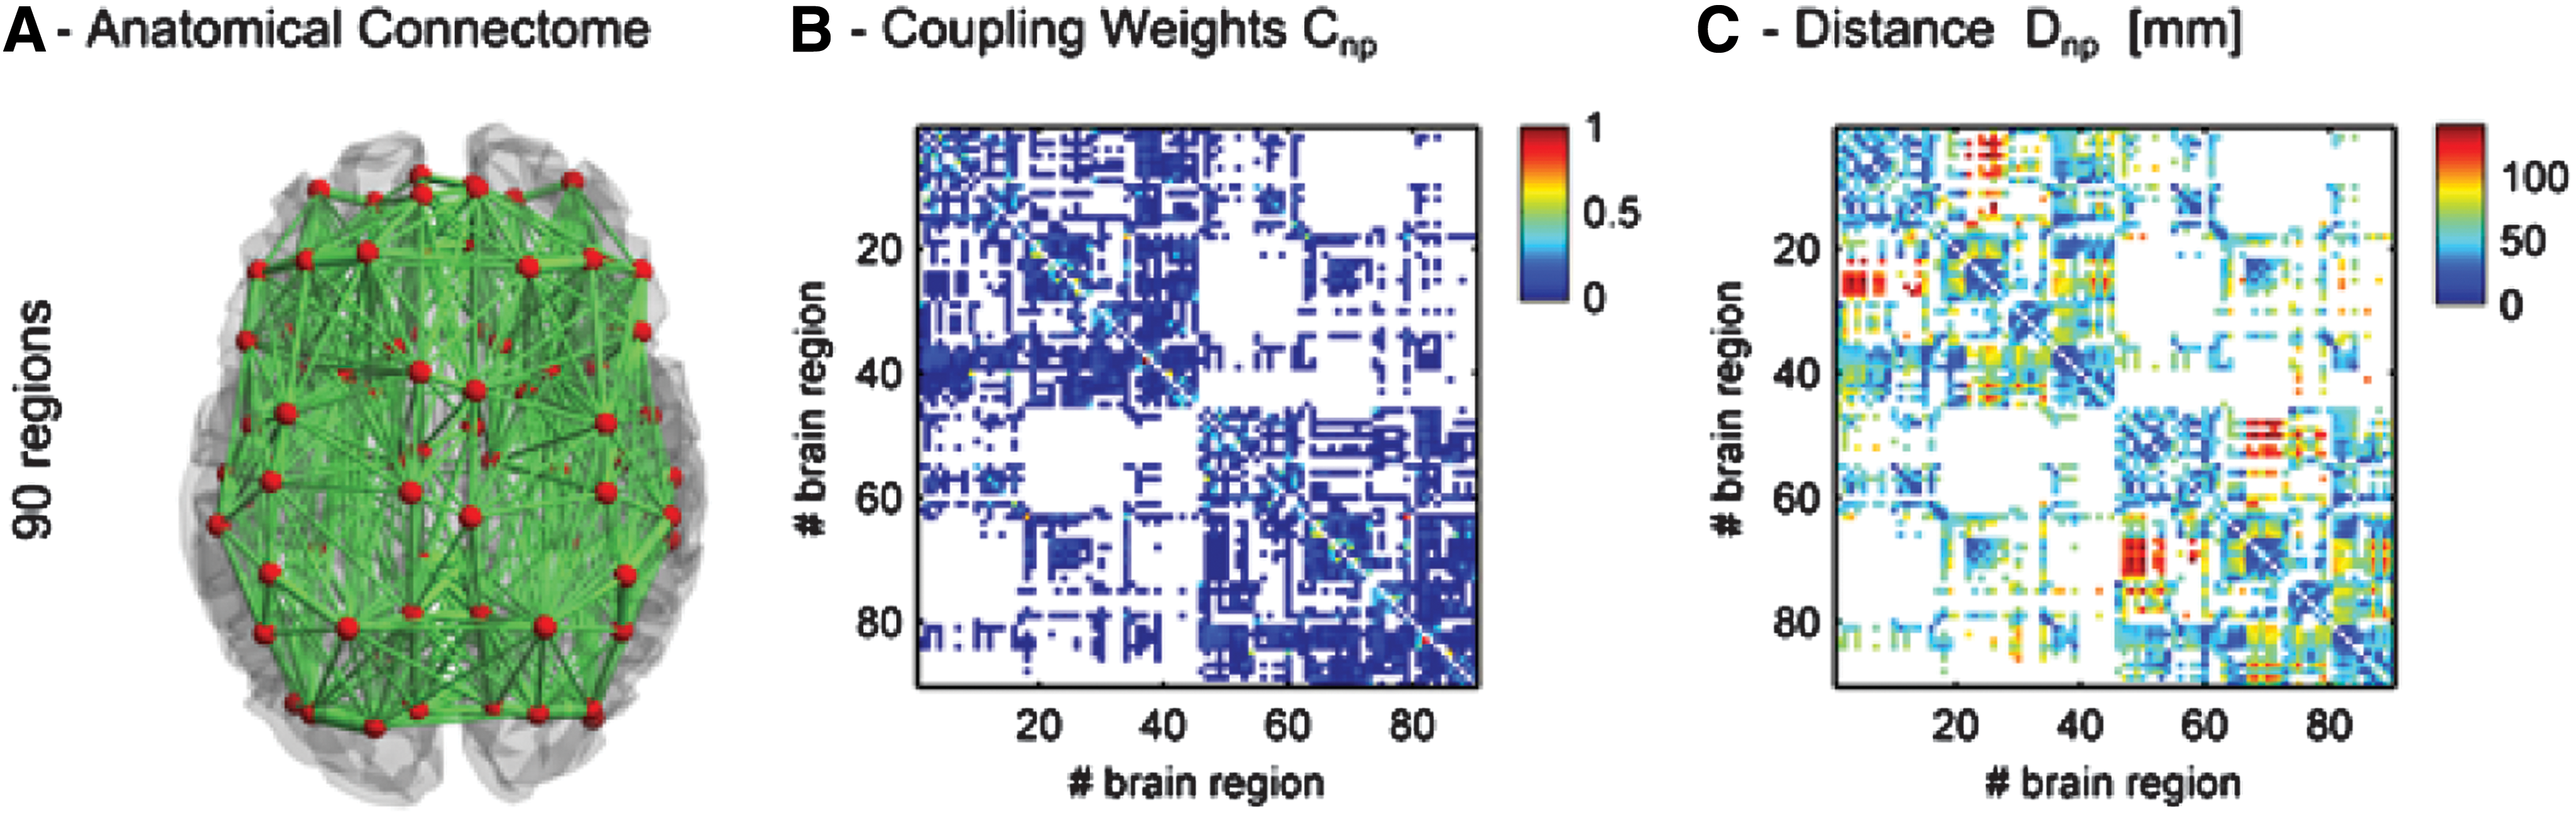
Research Question: Aberrations in functional connectivity are often correlated with neuropsychiatric disorders. We propose a unified probabilistic framework that aggregates population differences in connectivity to isolate foci of a neurological disorder. We use neural anatomy as a substrate for modeling functional connectivity. Since neural communication in the brain is constrained by white matter fibers, we hypothesize that the strongest effects of a disorder will occur along direct anatomical connections. Hence, Diffusion Weighted Imaging (DWI) tractography is used to estimate the underlying white matter fibers in the brain. The anatomical connectivity inferred from these fibers constrains the graph of abnormal functional connections.
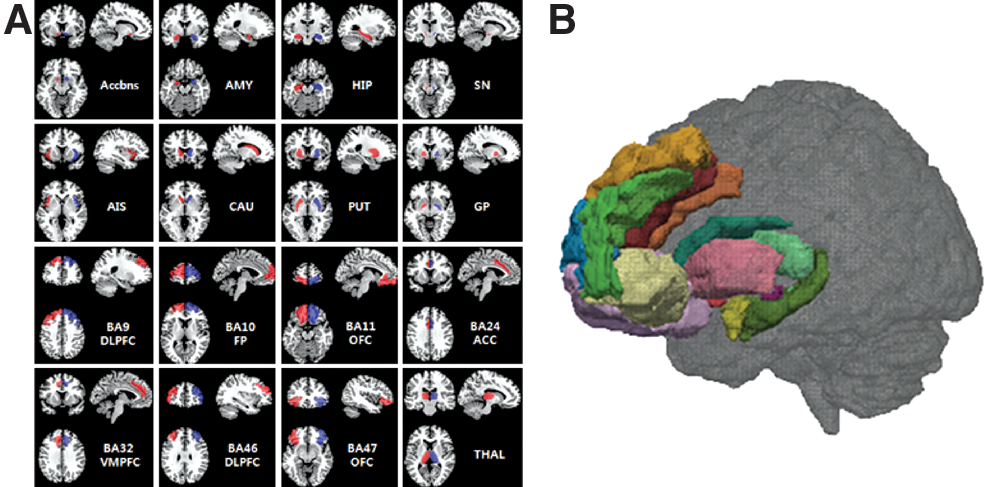
Methods: We assume that impairments of the disorder localize to a small subset of brain regions, which we call foci, and affect the neural signaling along pathways associated with these regions. Our model consists of a latent structure, which represents the underlying organization of the brain, and the observed fMRI and DWI measurements. Fig 1 presents a network diagram of our latent graph. The nodes in Fig. 1 correspond to regions in the brain. The green nodes are healthy, and the red nodes are diseased. The edges denote neural connections, which are captured by latent anatomical connectivity Aij. Specifically, the presence or absence of edge (i,j) in the network is governed by the binary value of Aij. The anatomical network structure is shared between the control and clinical populations.
A network model of connectivity. The nodes correspond to regions in the brain, and the lines denote anatomical connections between them. The green nodes and edges correspond to the normal regions and connections, respectively. The red nodes are foci of the disease, and the red edges specify pathways of abnormal functional connectivity. The solid lines are deterministic given the region labels; the dashed lines are probabilistic. Aij represents the latent anatomical connectivity between regions i and j. Fij denotes the corresponding latent functional connectivity.
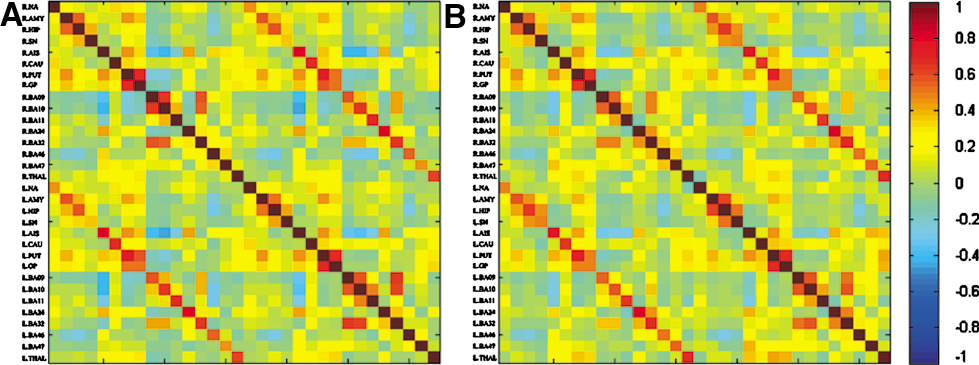
Based on the region assignments, aberrant functional connectivity along anatomical pathways is defined using a simple set of rules: (1) a connection between two diseased regions is always abnormal (solid red lines in Fig. 1), (2) a connection between two healthy regions is never abnormal (solid green lines), and (3) a connection between a healthy and a diseased region is abnormal with probability η (dashed lines). We use latent functional connectivity variables Fij and barFij to model the neural synchrony between two regions in the control and clinical populations, respectively. Ideally, barFij≠Fij for abnormal connections and barFij=Fij for healthy connections. However, due to noise, we assume that the latent templates can deviate from the above rules with some probabiliy. The observed DWI values and fMRI correlations are noisy measurements of the latent network structure.
We employ a maximum likelihood (ML) framework to fit the model to the data. The region assignments induces a complex coupling between pairwise connections. Therefore, we use a variational approximation for the posterior probability distribution when deriving the ML solution.
Results: We demonstrate our model on a study of 19 male patients with chronic schizophrenia and 19 male healthy controls. The control participants were group matched to the patients on demographics and clinical indicators. For each subject, an anatomical scan (SPGR, TR=7.4s, TE=3ms, FOV=26cm2, res=1mm3), a diffusion-weighted scan (EPI, TR=17s, TE=78ms, FOV=24cm, res=1.66×× 1.66×1.7mm, 51 gradient directions with b=900s/mm2, 8 baseline scans with b=0s/mm2) and a resting-state functional scan (EPI-BOLD, TR=3s, TE=30ms, FOV=24cm, res=1.875×1.875×3mm) were acquired using a 3T GE Echospeed system.
We segmented the anatomical images into 77 cortical and sub-cortical regions using FreeSurfer. The DWI data was corrected for eddy-current distortions, and two-tensor tractography was used to estimate the white matter fibers. We compute the DWI connectivity in each subject by averaging FA along all detected fibers between pairs of regions. The DWI value is set to zero if no tracts are found.
We discarded the first five fMRI time points and performed motion correction by rigid body alignment and slice timing correction using FSL. The data was spatially smoothed using a Gaussian filter, temporally low-pass filtered with 0.08Hz cutoff, and motion corrected via linear regression. We also removed global contributions from the white matter, ventricles and the whole brain. We compute the fMRI connectivity in each subject as the Pearson correlation coefficient between the mean time courses of two regions.
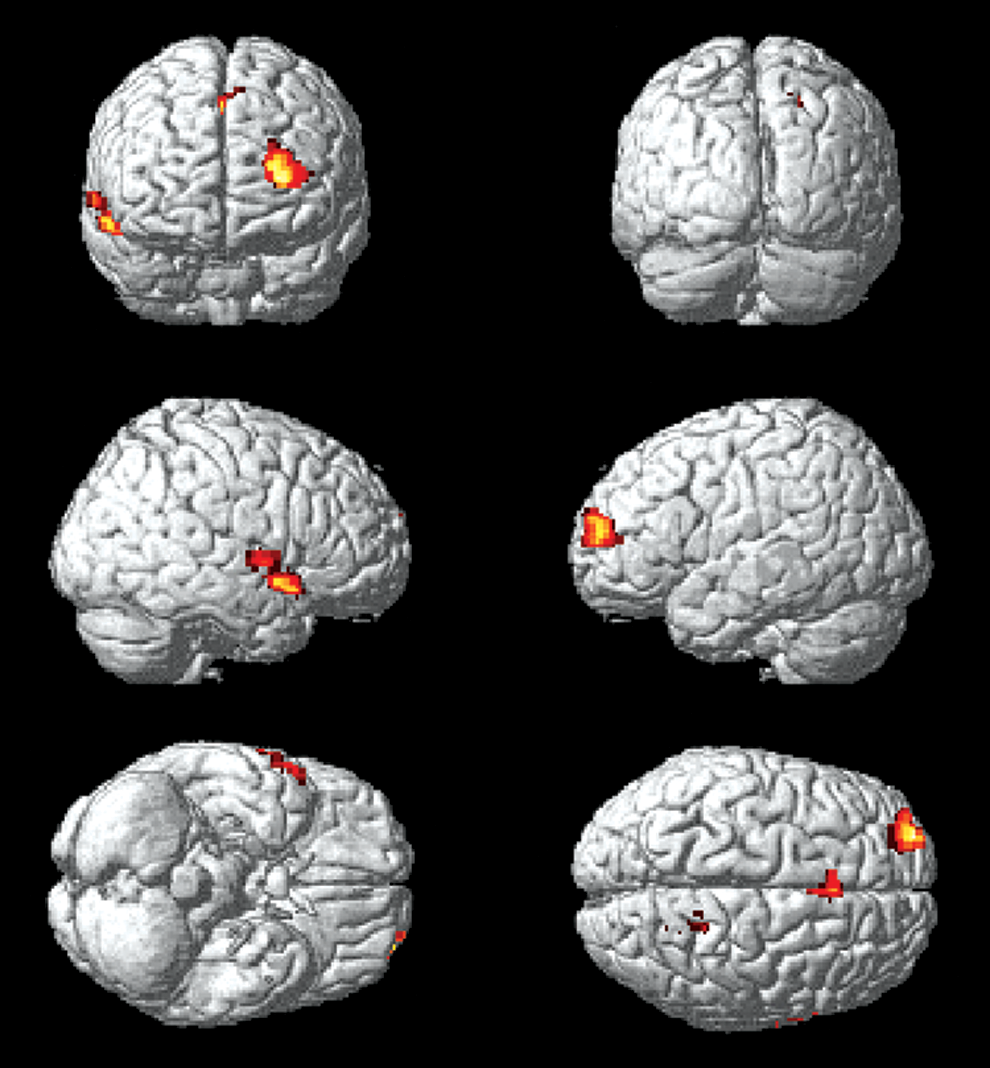
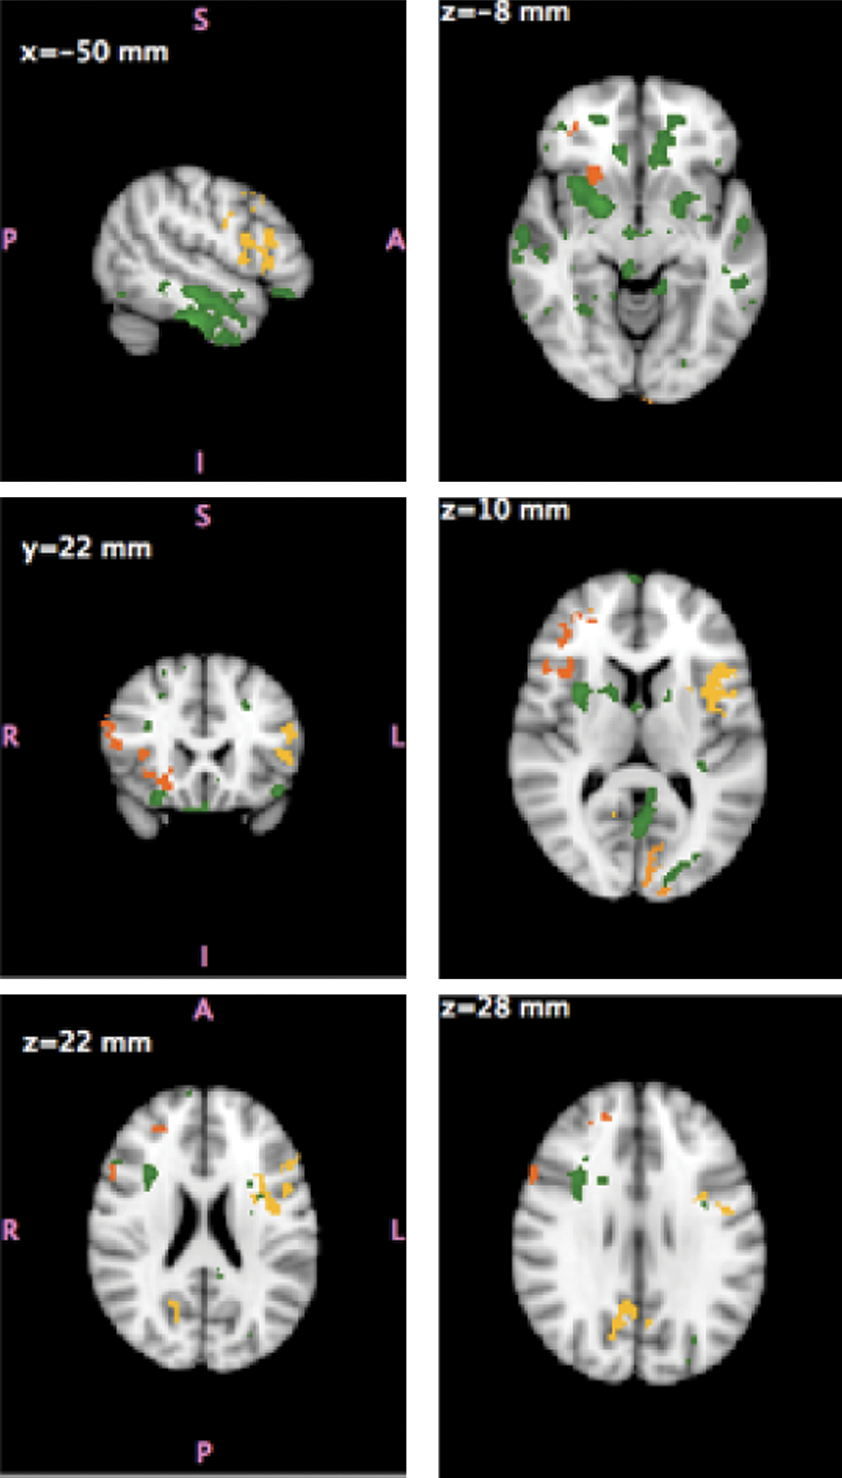
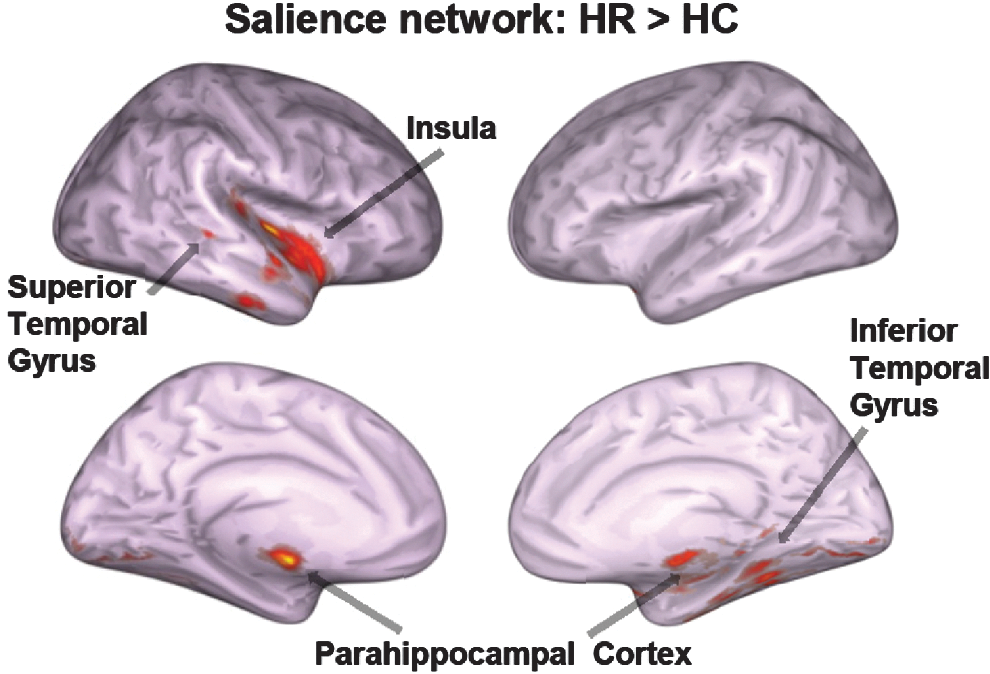
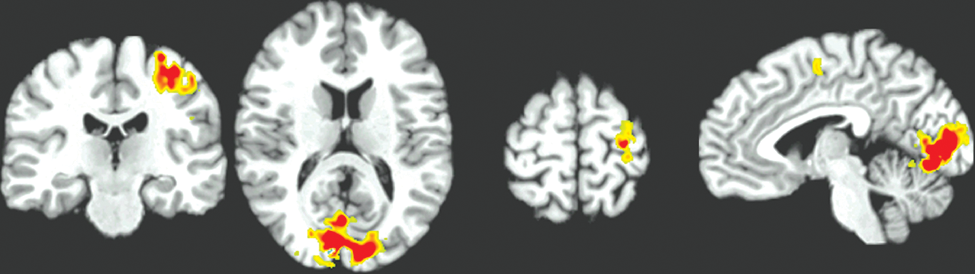
Our method identifies three disease foci, as displayed in Fig 2. Our results implicate the right posterior cingulate (p<0.004), the right superior temporal gyrus (p<0.014), and the left superior temporal gyrus (p<0.044). Prior studies have found abnormalities in the superior temporal gyri in schizophrenia. These impairments correlate with clinical measures of auditory hallucination and attentional deficits. The default network has been implicated in resting-state fMRI studies. Reducted connectivity in the posterior cingulate correlate with both positive and negative symptoms of schizophrenia.
Significant regions based on permutation tests (uncorrected p<0.044). The colorbar corresponds to the negative log p-value. We present the lateral and medial viewpoints for each hemisphere. The highlighted regions are the posterior cingulate (R PCC) and the superior temporal gyrus (L STG & R STG).
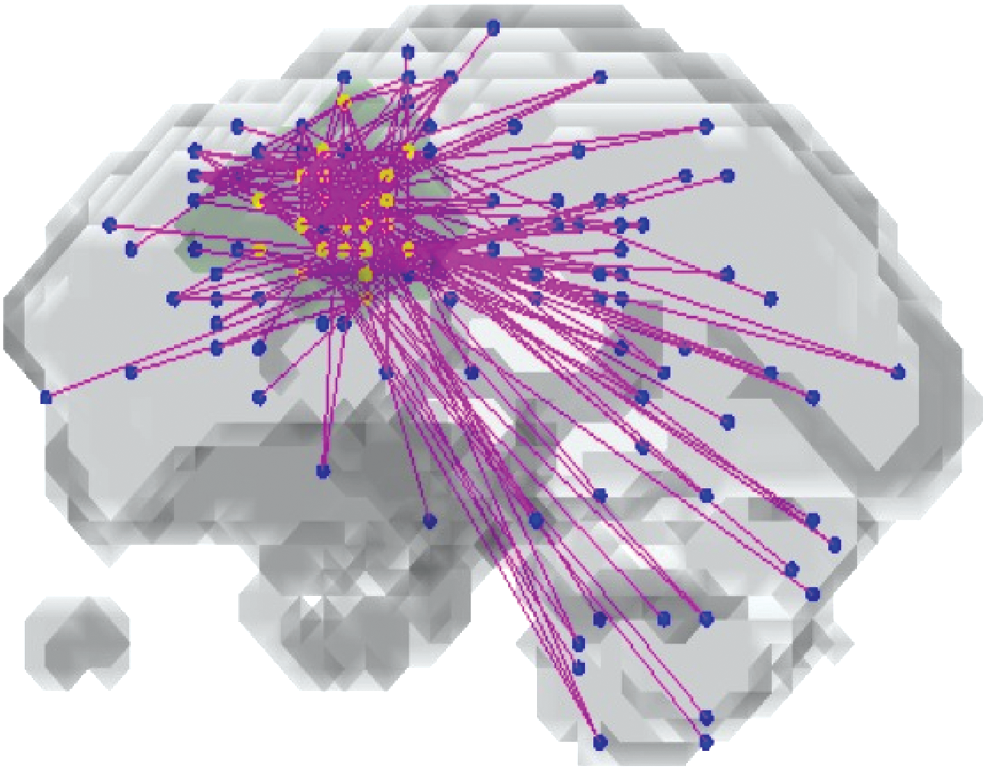
In Fig 3, we observe that functional abnormalities originating in the posterior cingulate project to the midbrain and frontal lobe, whereas abnormalities stemming from the right and left superior temporal gyri tend to span their respective hemispheres. Overall, schizophrenia patients exhibit reduced functional connectivity. Of notable exception are connections to the frontal lobe. This phenomenon has been reported in prior studies of schizophrenia and is believed to interfere with perception by misdirecting attentional resources.
Estimated graph of functional connectivity differences. The red nodes indicate the disease foci. Blue lines indicate reduced functional connectivity and yellow lines indicate increased functional connectivity in the schizophrenia population.
Fig 4 illustrates the results of varying a parameter β of our model that specifies the expected number of diseased regions. Empirically, we observe that sets of regions affected by the disease form a nested substructure as β increases. We color each of the selected regions according to the smallest value of β that implicates it as a disease foci. The yellow regions are always identified as foci, whereas the orange/red regions are selected for larger parameter values. The nesting property is a highly desirable feature of our model. It suggests an initial set of disease foci, identical to the significant regions in Fig. 4. We can then tune a single scalar to progressively include regions that exhibit some functional abnormalities but are not as strongly implicated by the data.
Evolution of the disease foci when varying the parameter β. The highlighted regions are the posterior cingulate (L PCC & R PCC), the superior temporal gyrus (L STG & R STG), the postcentral gyrus (R PC), the frontal pole (L FP), the caudal middle frontal gyrus (R CMF), the transverse temporal gyrus (L TTG), the pars orbitalis (L pOrb), the entorhinal cortex (R Ent) and the lateral occipital cortex (R LOcc).
Conclusion: We proposed a novel probabilistic framework for multimodal analysis of fMRI and DWI data that integrates population differences in connectivity to isolate foci of a neurological disorder. This is achieved by defining a network of abnormal connectivity emanating from the affected regions. We demonstrate that our method identifies a stable set of schizophrenia foci consisting of the right posterior cingulate and the right and left superior temporal gyri. Prior clinical studies have linked these regions to the effects of schizophrenia. Moreover, we uncover additional regions by adjusting the prior on the number of disease foci. These results establish the promise of our approach for aggregating connectivity information to localize region effects.
Animal Imaging
KalthoffD.1RiouA.1PoC.1WiedermannD.1HoehnM.1
Max-Planck-Institut für neurologische Forschung, In-vivo-NMR Research Group, Köln, Germany
Resting state fMRI in the rat brain revealed anesthetic regimes dependence on functional networks
Objectives: Applied in animal models, resting state fMRI has an enormous potential to track progression, recovery or therapy of various diseases. However, anesthesia, required for animal MRI, may confound functional connectivity results. The aim of this study was thus to compare functional connectivity networks in an established protocol of Medetomidine (MED) sedation vs. Isoflurane (ISO) anesthesia.
Methods: Resting state fMRI data were obtained from male Wistar rats (n=17) under 1.5% ISO anesthesia and then, subsequently in the same session, under MED sedation. Data were acquired using gradient echo planar imaging on an 11.7 T Bruker BioSpec system. After pre-processing (co-registration, filtering), functional data underwent independent component analysis (ICA) using FSL. Independent components were classified through hierarchical clustering. To complement ICA, a seed based analysis was performed before and after removing global signal fluctuations.
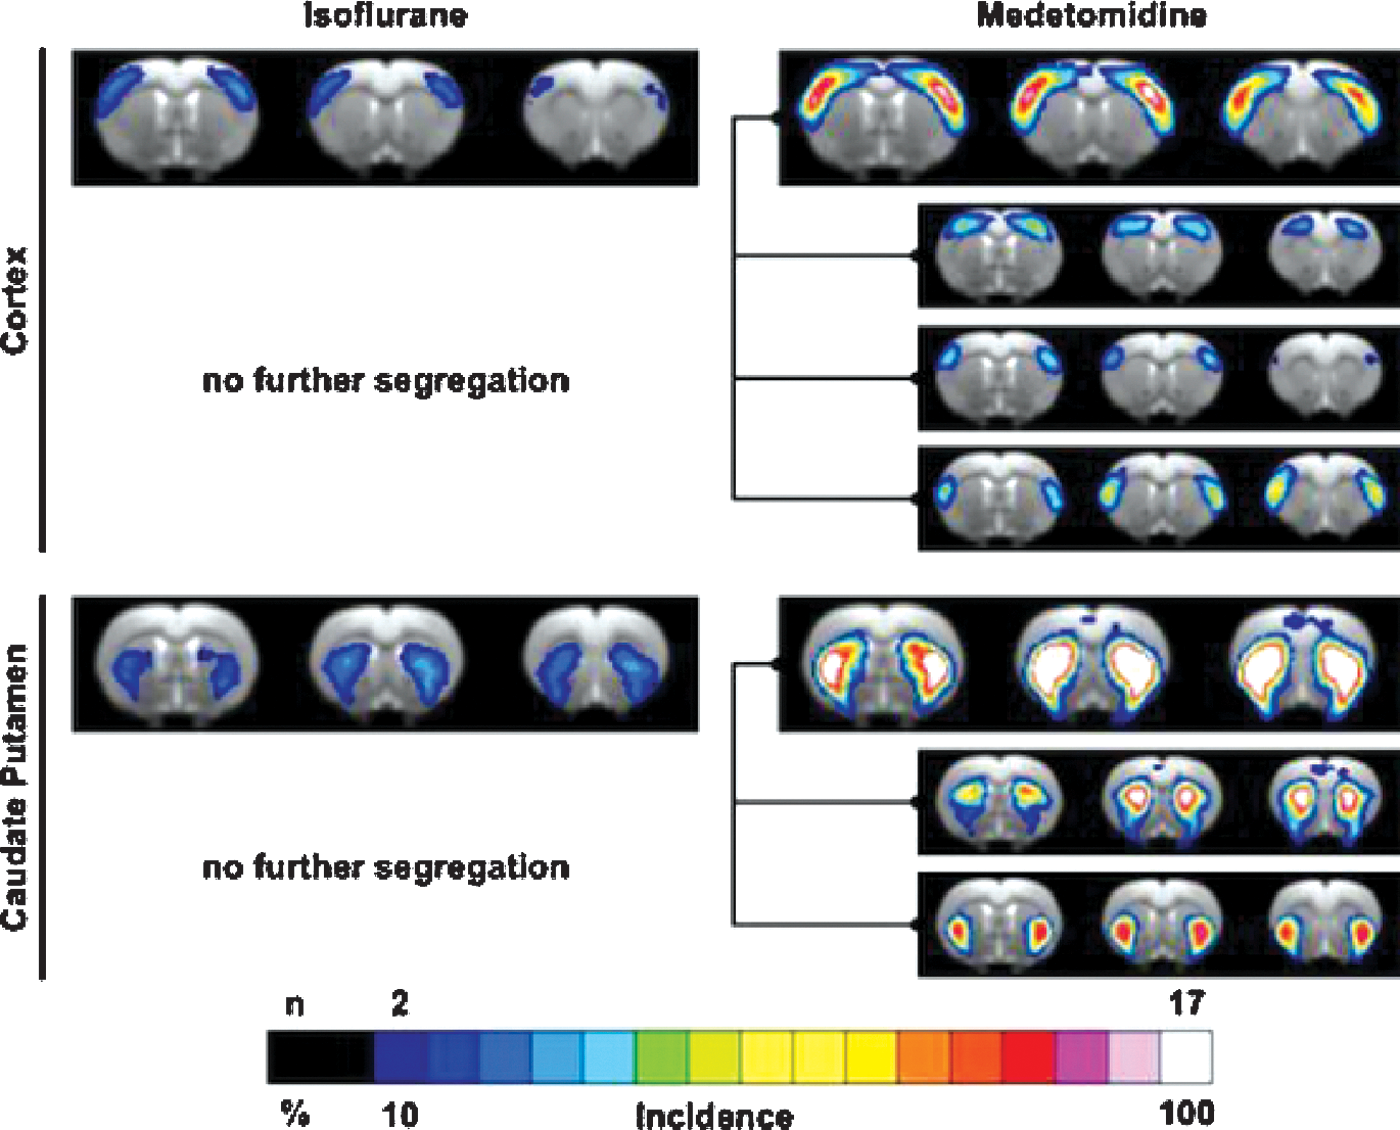
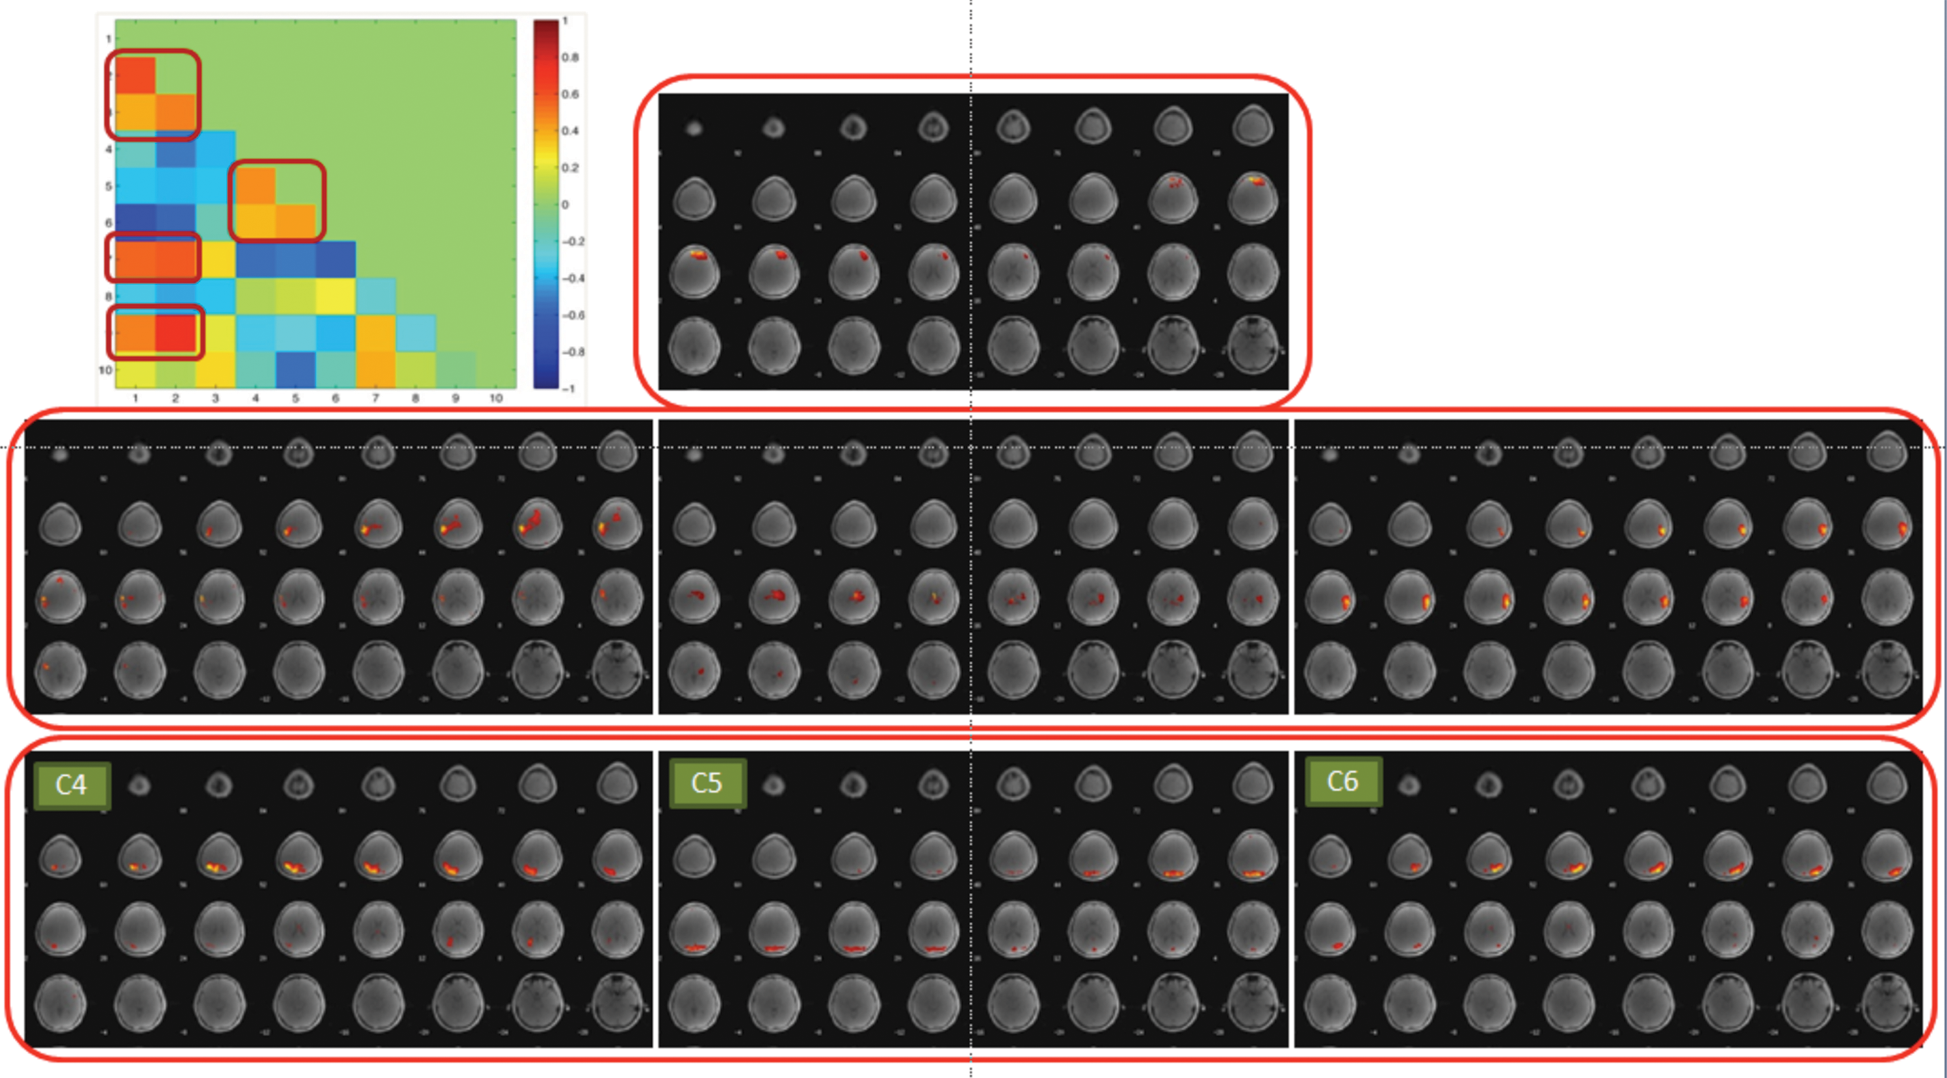
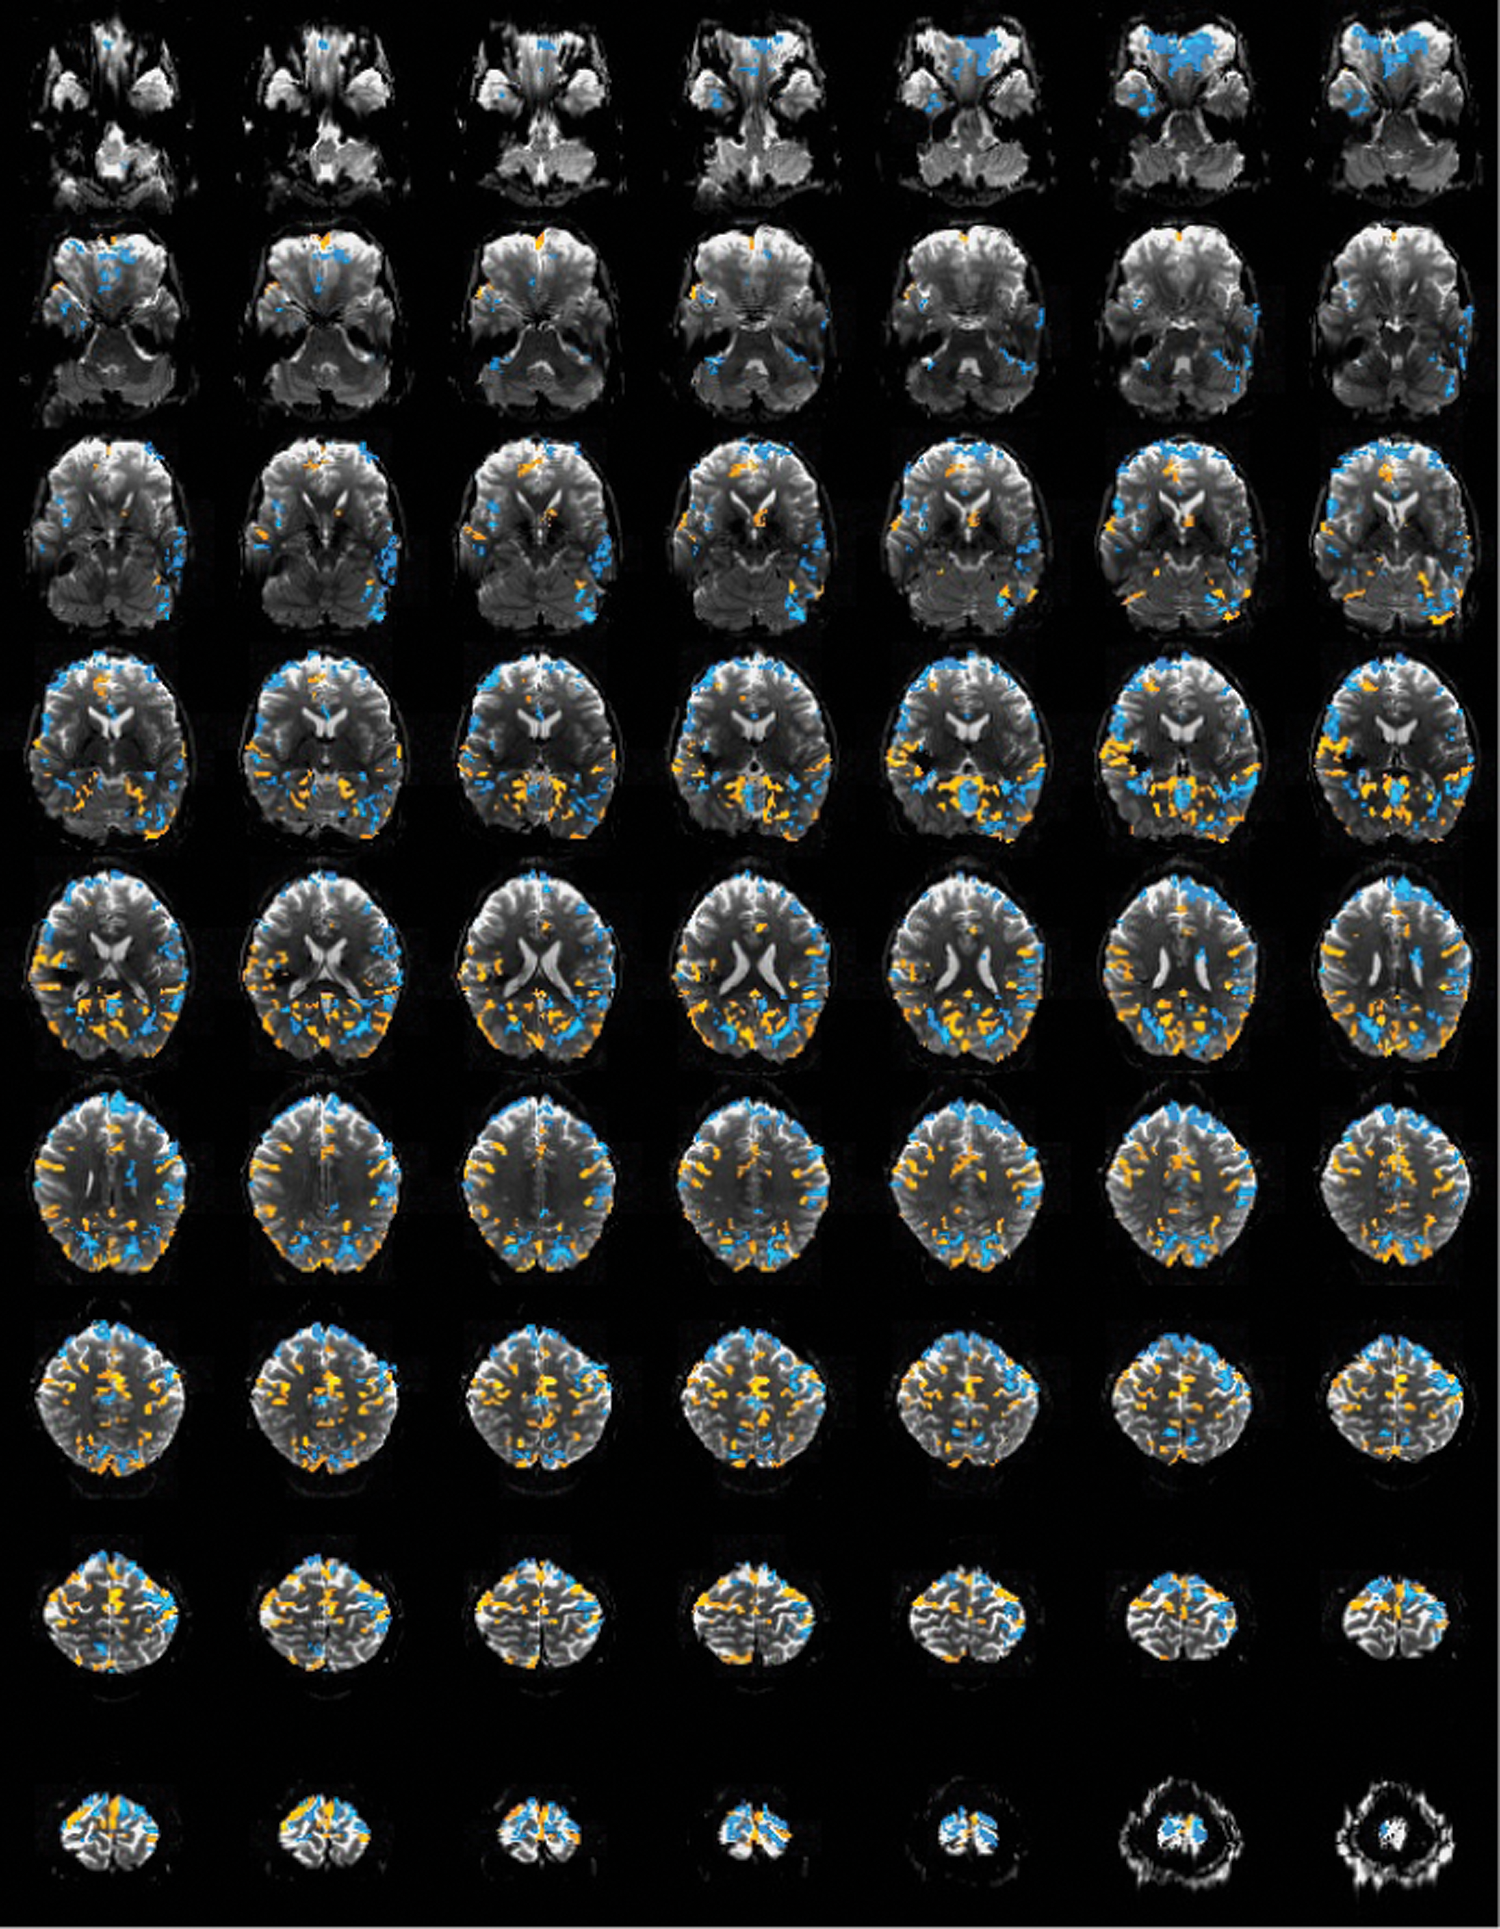
Results: ICA found 10-19 independent components (ICs) in each dataset (Median/SD: 15/3 ISO, 13/3 MED). Reproducible and distinct bilateral networks were identified under MED sedation, three in the cortex (medial, intermediate, lateral) and two in the striatum (dorsal / ventral). Under ISO, however, similar networks were observed in only a few datasets and were less distinct. Clustering of ICs via their spatial features revealed a bilateral cortical and bilateral striatal group. While those components were only present in <30% of ISO datasets, incidence was >75% in the MED regime. Moreover, ICs in the MED regime could be segregated into consistent subgroups that were often found in parallel within the subjects (Figure for illustration of IC networks incidence).
Conclusion: Our results show that connectivity networks in the rat brain, revealed via ICA, differ significantly in MED sedation vs. ISO anesthesia. Connectivity networks identified in the MED regime are stronger, more reproducible and spatially more coherent, which is supported by a recent report using a seed-based analysis approach and by comparison to other studies. We conclude that MED sedation of the rat should be favored over ISO anesthesia whenever functional connectivity networks are to be studied in their complexity and greater level of detail. Figure 1: Incidence maps of functional connectivity networks under Isoflurane and Medetomidine anesthesia, segregated into cortical and subcortical groups via hierarchical clustering.
University of Oxford, Nuffield Department of Clinical Neuroscience, Oxford, United Kingdom
An exploratory study on the effect of Natalizumab on resting state networks in Multiple Sclerosis patients
Cognitive impairment is frequent in multiple sclerosis (MS), occurs in early stages and affects everyday life. Whereas functional reorganization in the context of cognition is increasingly studied using conventional task-related functional MRI, equivalent research examining changes in resting state networks (RSN) due to disease progression is still scarce, and hithertho is largely based on extrapolation from cross-sectional observations. Changes in RSN bear potential to be used as a sensitive means to capture treatment effects on brain function in the context of CNS diseases, circumventing limitations of task-related fMRI.
In the presented exploratory, longitudinal study we thus attempted to assess the effects of a highly effective disease modifying drug (Natalizumab) used for escalation therapy in aggressive forms of MS on cognitive function and RSN function in patients with relapsing-remitting MS (RRMS).We longitudinally investigated seven RRMS-patients, using resting state fMRI and comprehensive neuropsychological testing (e.g. verbal and spatial memory, attention, processing speed, verbal fluency).
All patients were tested at baseline, three months and twelve months after the initiation of pharmalogical therapy (Natalizumab). We only included patients who participated in all fMRI and neuropsychological sessions, resulting in a final sample of five patients (mean age=33 years; SD=10; 3 male). Results of analyses aiming to identify changes in activity in six RSN (visual RSN, auditory RSN, somatosensory RSN, default mode network, fronto-parietal “attentional RSN and “executive control & salience” RSN) will be presented at the congress and set in relation to status of and changes in cognitive performance.
National Institute of Mental Health, Section on Functional Imaging Methods, Bethesda, United States
National Institute of Mental Health, Functional MRI Facility, Bethesda, United States
A non-neural explanation for some fMRI resting connectivity dynamics
Introduction: Neuronal interactions between brain regions obviously vary across time. There is also a growing literature showing dynamic changes in fMRI correlation magnitudes between brain regions. Given the many sources of noise and signal changes in fMRI, it is unlikely that all correlation fluctuations represent changes in neuronal interactions. We examine scenario that could create connectivity fluctations without corresponding fluctuations in neural interactions.
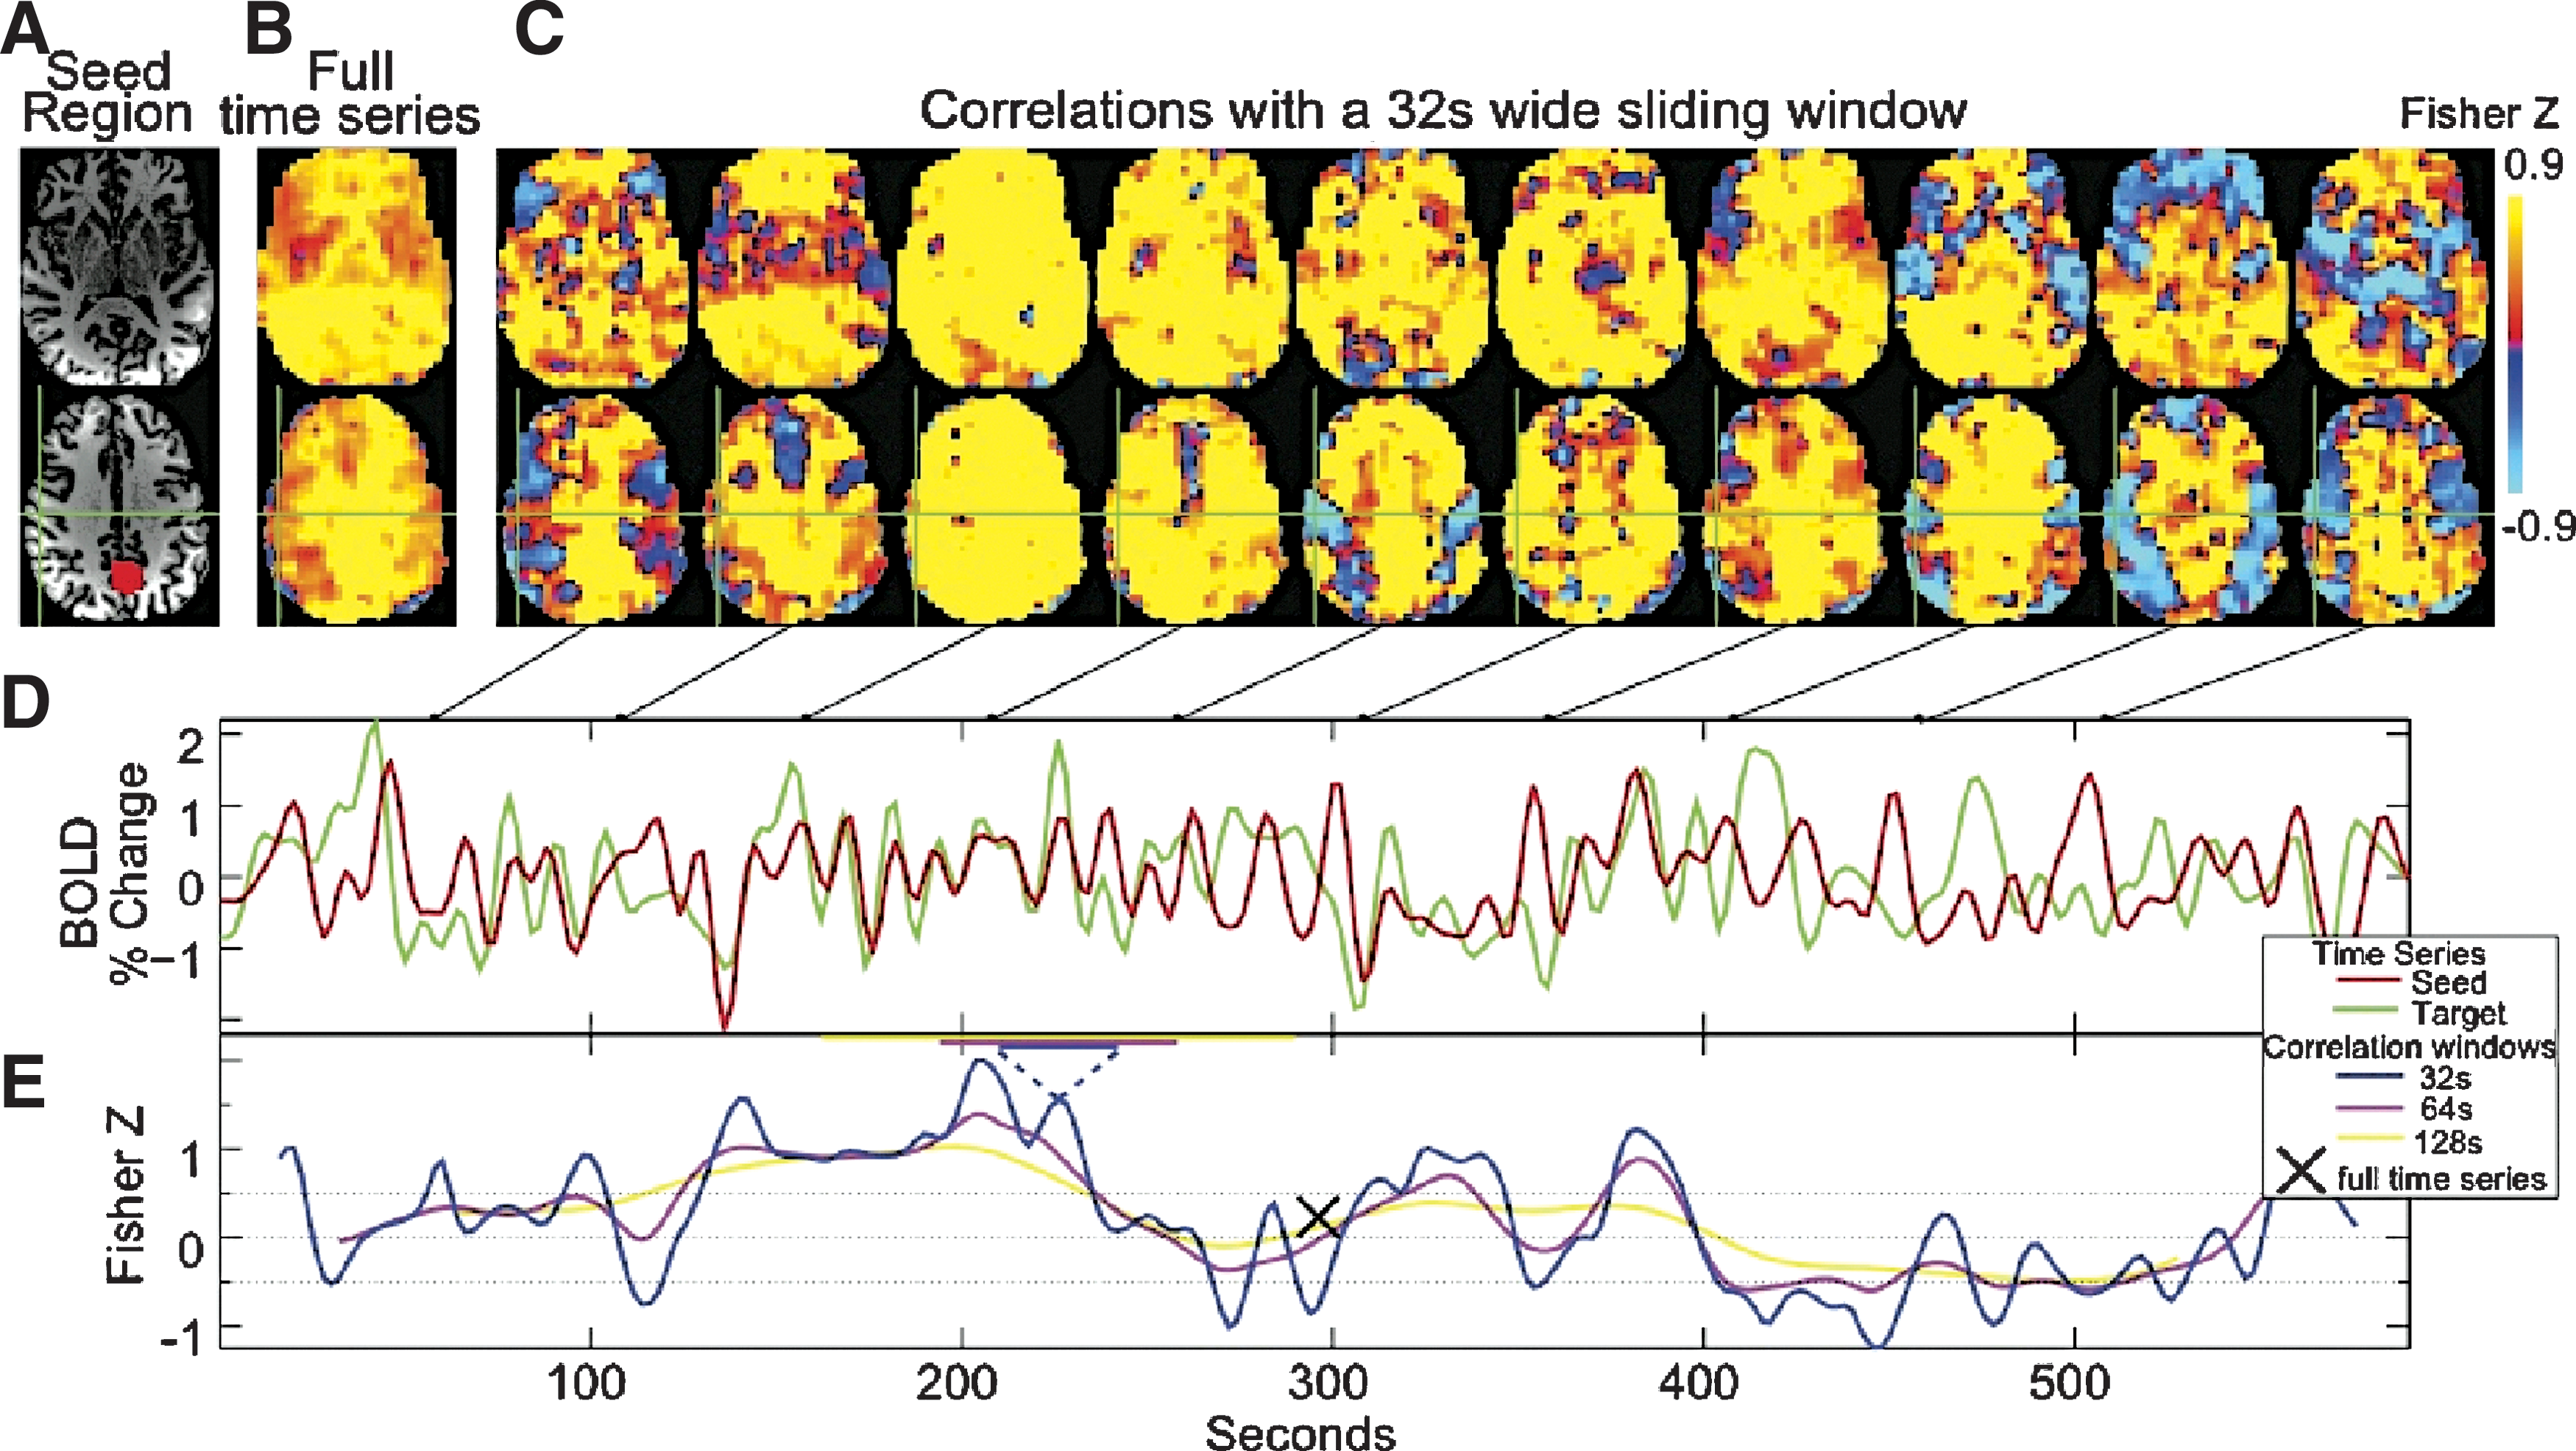
Methods: Data were collected from 12 healthy adults in a 3T GE HDx MRI (TR=2 sec, 10 min of data per rest run). Preprocessing included RETROICOR (Glover, Li et. al. 2000) and RVT (Birn, Diamond, et. al. 2006) corrections for cardiac and respiratory fluctuations, and regression of motion parameters and their first derivatives. Correlations were calculated from a posterior cingulate cortex (PCC) seed to the rest of the brain. Sliding window correlations were used to calculate correlation changes over time from the PCC. Figure 1 shows maps correlation changes over time along with a demonstration of how the time a pair of voxel time series is used to calculate correlations with different window sizes.
FIG. 1.
Power spectra for each voxel's correlation time series were calculated. Time series from spatially distinct voxels that showed periodic fluctuations were repeatedly phase randomized. The phase randomized time series were used to for sliding window correlations and power spectrum estimations.
Results:Figure 2 shows maps of relative power at 4 power spectrum peaks from one volunteer. Even though these correlations are based on a single seed, distinct brain regions have high power at different frequencies. Figure 3 shows that the frequency peak magnitudes from actual data almost always falls within 99.9% of the distribution of phase randomized data.
FIG. 2.
FIG. 3.
Discussion: We show periodic fluctuations of correlations that follow cortical structures. Periodic fluctuations of these magnitudes remain after phase randomization. Since phase randomization removes the temporal relationship between signal changes across time series, such results do not represent neuronal interactions. The observed correlation changes often have lower fluctuation changes than the phase randomized question. While we don't show any specific regional interaction is non-neural, this work highlights a challenge for distinguishing neural from non-neural connectivity dynamics using correlation.
University of Liège, Coma Science Group, Cyclotron Research Center & Neurology Department, Liège, Belgium
University of Liège, CHU Pain Clinic, Liège, Belgium
Functional connectivity changes in hypnotic state measured by fMRI
Question: We here employed functional MRI to better characterize hypnosis-related functional connectivity changes in large-scale cerebral networks.
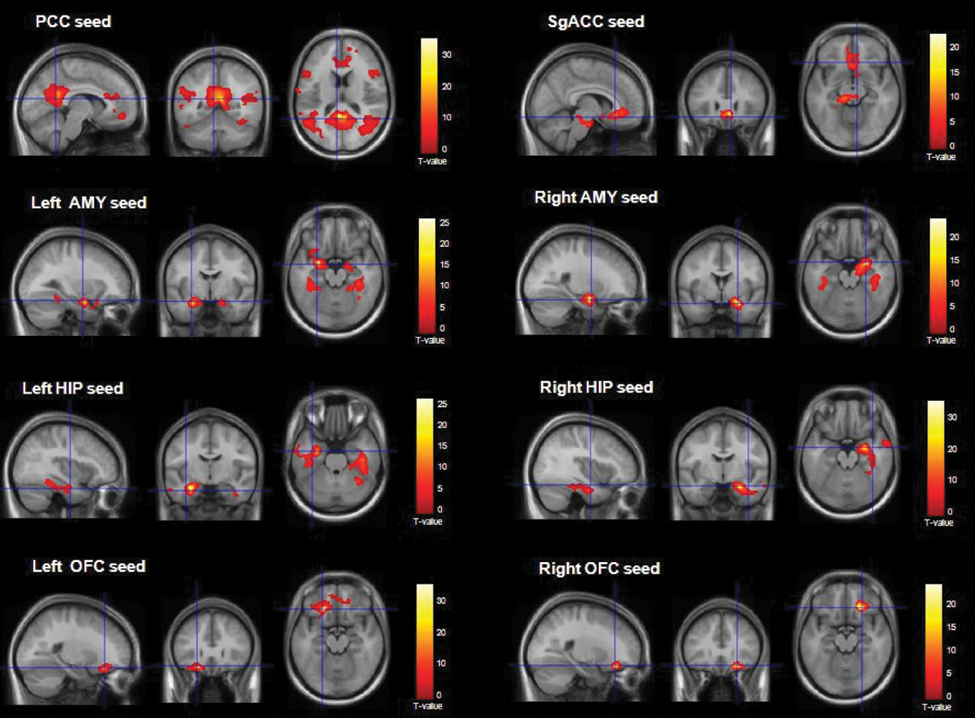
Methods: Twelve subjects were scanned in three conditions: (1) normal eyes-closed wakefulness, (2) during mental imagery of pleasant autobiographical memories (i.e., control condition), and (3) during hypnotic state (reviving pleasant autobiographical memories). Seven seed regions were used to identify functional connectivity patterns of the default mode, left and right frontoparietal, salience sensorimotor, auditory, and visual networks. Behavioral data concerning body sense modification, partial amnesia, and time sense modifications were collected at the end of eac fMRI session.
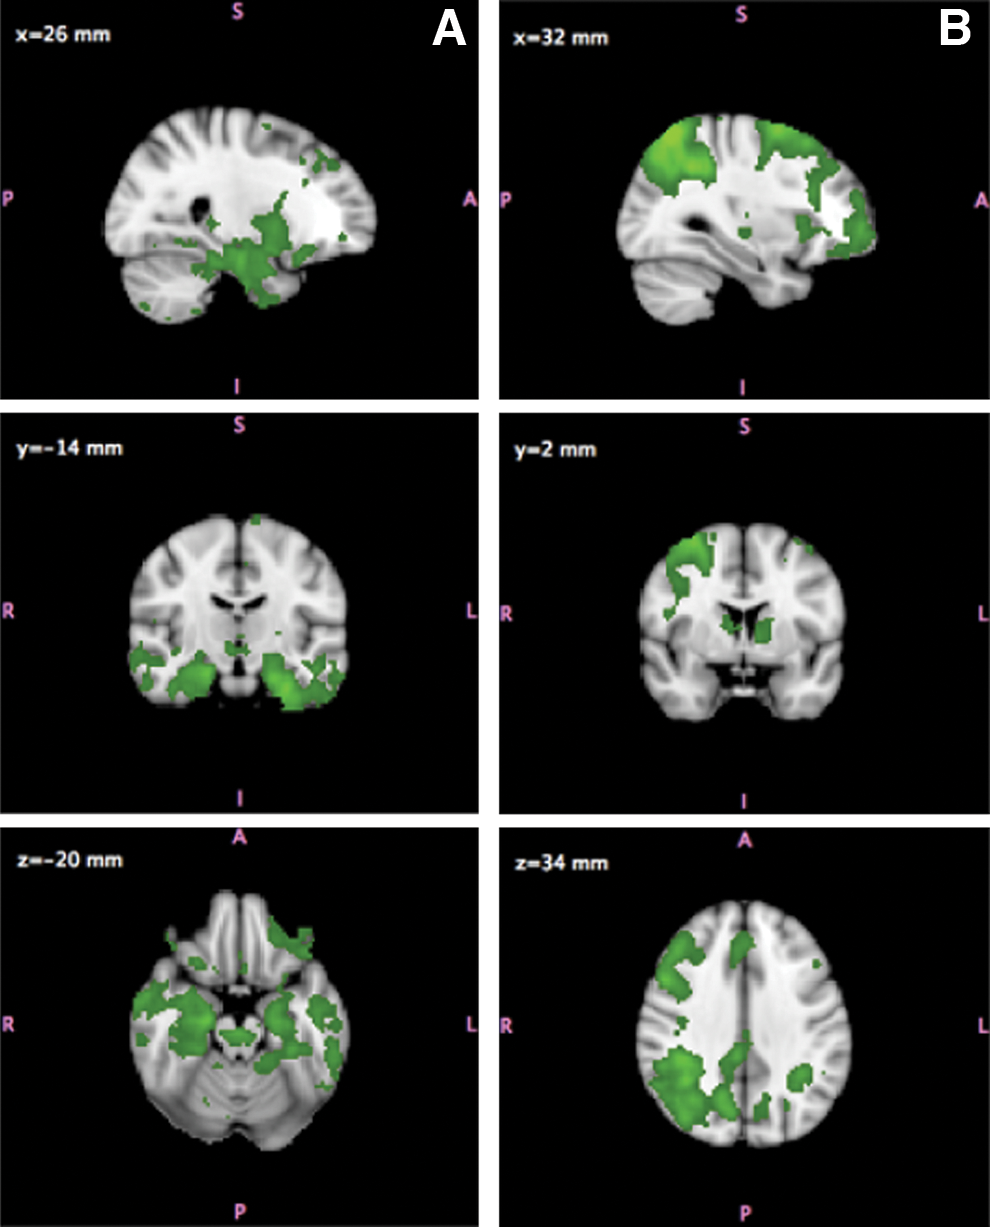
Results: Behaviorally, more subjects under hypnosis (as compared to the control condition) reported a modified sense of body and time as well as partial amnesia. Compared to the control condition of autobiographical mental imagery, we identified increased within-network functional connectivity for the default mode, left and right frontoparietal, salience, sensorimotor, and auditory networks; an enhanced cross-modal interaction between auditory and visual cortices was further observed (Fig 1). The visual network only showed decreases in functional connectivity in both within and between-network areas (i.e., hippocampus).
FIG. 1.
Conclusions: Hypnosis, compared to a control condition of revivification of pleasant autobiographical memories, leads to increases in functional connectivity in the default mode, left and right frontoparietal, salience, sensorimotor, and auditory networks, potentially reflecting lack of inhibitory cortico-cortical mechanisms. Additionally, hypnosis-related decreases in visual network functional connectivity and increases in cross-modal interaction between auditory and visual networks could be identified, hypothesized to reflect a revivification of hypnotic suggestions and not merely cognitively guided memory retrieval.
Applications: Neurology
HafkemeijerA.123Altmann-SchneiderI.1OleksikA.4MiddelkoopH.25van BuchemM.13van der GrondJ.1RomboutsS.123
Leiden University Medical Center, Radiology, Leiden, Netherlands
Leiden University, Institute of Psychology, Leiden, Netherlands
Leiden University, Leiden Institute for Brain and Cognition, Leiden, Netherlands
Leiden University Medical Center, Department of Gerontology and Geriatrics, Leiden, Netherlands
Leiden University Medical Center, Neurology, Leiden, Netherlands
Elderly with subjective memory complaints show smaller brain structures and higher functional brain connectivity
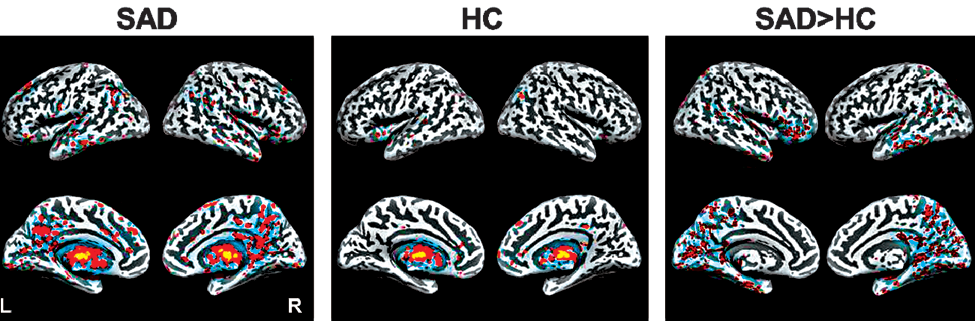
Background: Subjective memory complaints (SMC) are common among elderly. Although subtle changes in memory functioning can hardly be determined using neuropsychological evaluation, neuroimaging studies indicate regionally smaller brain structures in elderly with SMC. Imaging of resting state functional connectivity is sensitive to detect early changes in neurodegenerative diseases, but is currently underexplored in SMC. Here we investigate brain structure and resting state functional connectivity in elderly with SMC. Methods: We analyzed MRI data of 25 elderly with SMC (14 male) and 29 control elderly (17 male), both with a mean age of 71 years. Voxel-based morphometry and volume measurements of subcortical structures were employed on the structural scans using FSL. The dual regression method was used to analyze voxel-wise functional connectivity in relation to eight well-characterized resting state networks, taking regional volume differences in gray matter into account. Two-sample t-tests were used to obtain group differences (p<0.05, corrected).
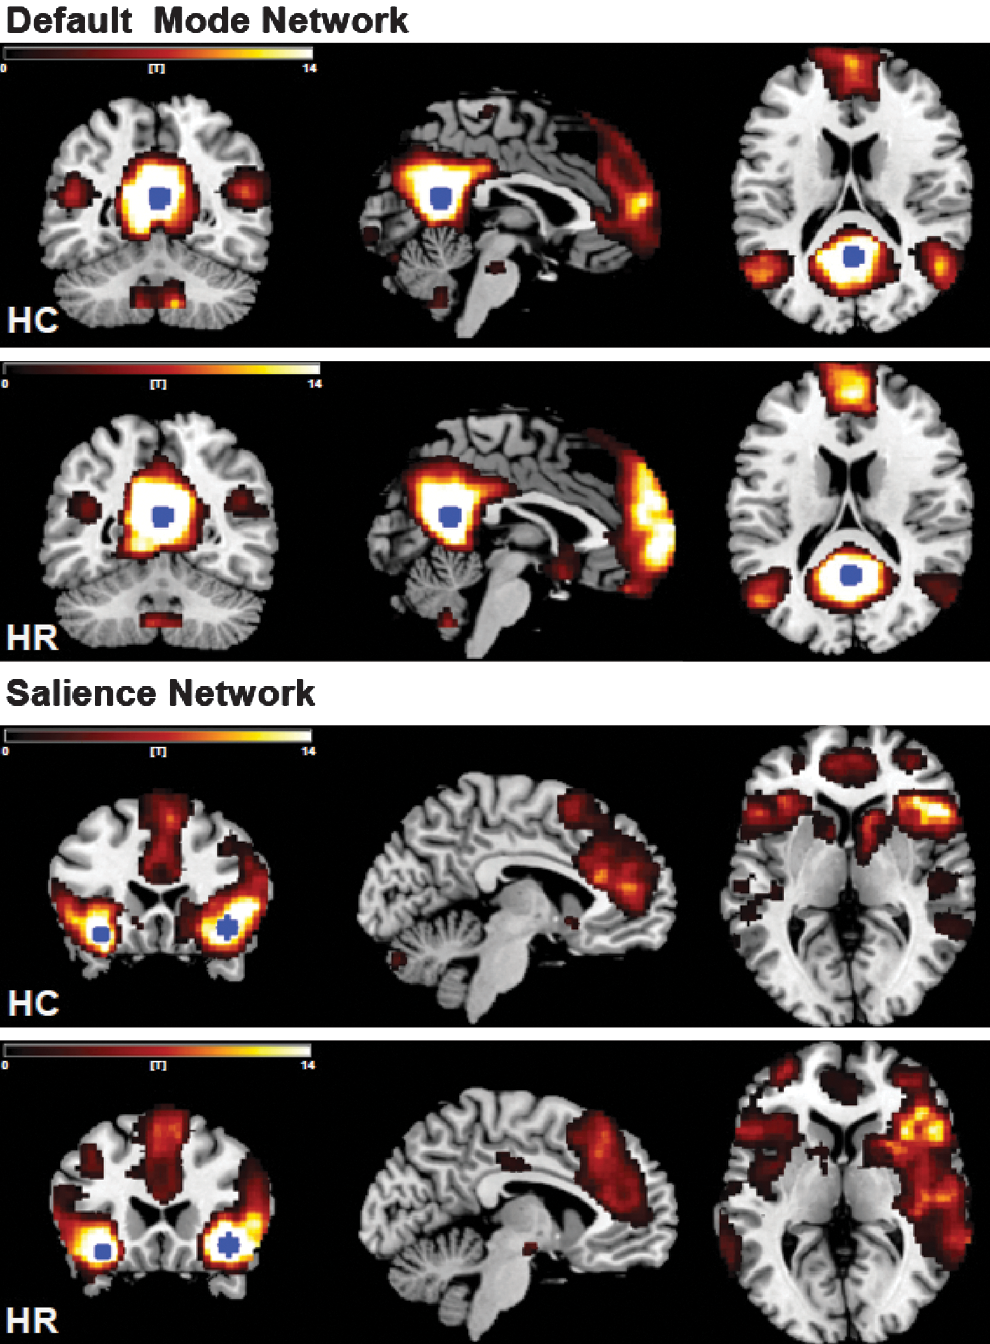
Results: Additionally to gray matter volume reductions (hippocampus, anterior cingulate cortex, medial prefrontal cortex, cuneus, precuneus, and precentral gyrus), elderly with SMC showed increased functional connectivity in the default mode network (fig. 1A; hippocampus, thalamus, posterior cingulate cortex, cuneus, precuneus, and superior temporal gyrus), the medial visual network (fig. 1B; anterior and posterior cingulate cortex, cuneus, and precuneus), and the executive control network (fig. 1C; medial prefrontal cortex). Conclusion: This study is the first to demonstrate that, additionally to smaller regional brain volumes, increases in functional connectivity are present in elderly with SMC. This suggests that self-reported SMCs are a reflection of objective alternations in brain function and might be a subclinical form of functional neurodegeneration. Furthermore, our results indicate that functional imaging, in addition to structural imaging, can be a useful tool to objectively determine a difference in brain integrity in SMC.
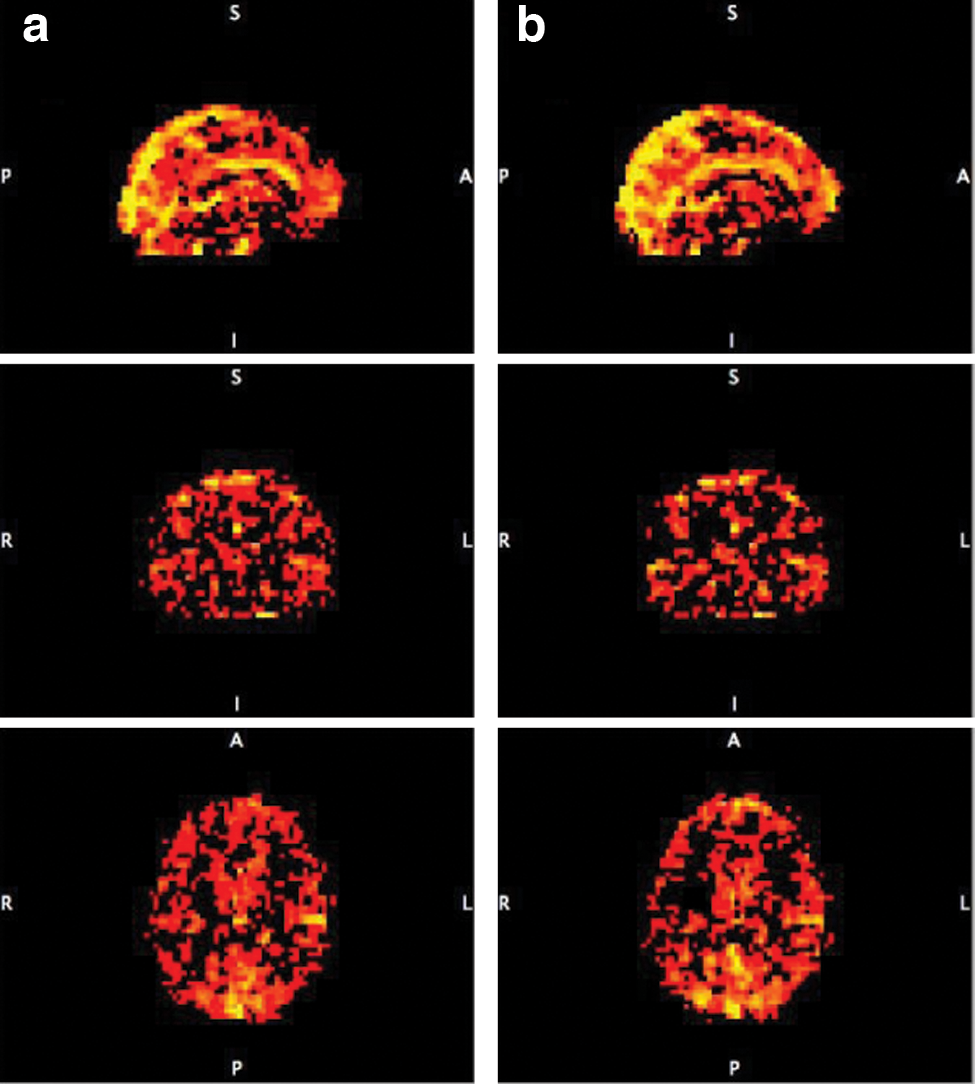
Increased functional connectivity in elderly with SMCThree resting state networks in healthy elderly (HC) and in elderly with SMC. Increased functional connectivity in elderly with SMC (SMC>HC).
Data Analysis
YanC.1CheungB.2ColcombeS.1CraddockC.3LiQ.2KellyC.4Di MartinoA.4CastellanosF.X.14MilhamM.12
The Nathan Kline Institute for Psychiatric Research, Orangeburg, United States
Child Mind Institute, Center for the Developing Brain, New York, United States
Virginia Tech Carilion Research Institute, Roanoke, United States
New York University Child Study Center, The Phyllis Green and Randolph Cowen Institute for Pediatric Neuroscience, New York, United States
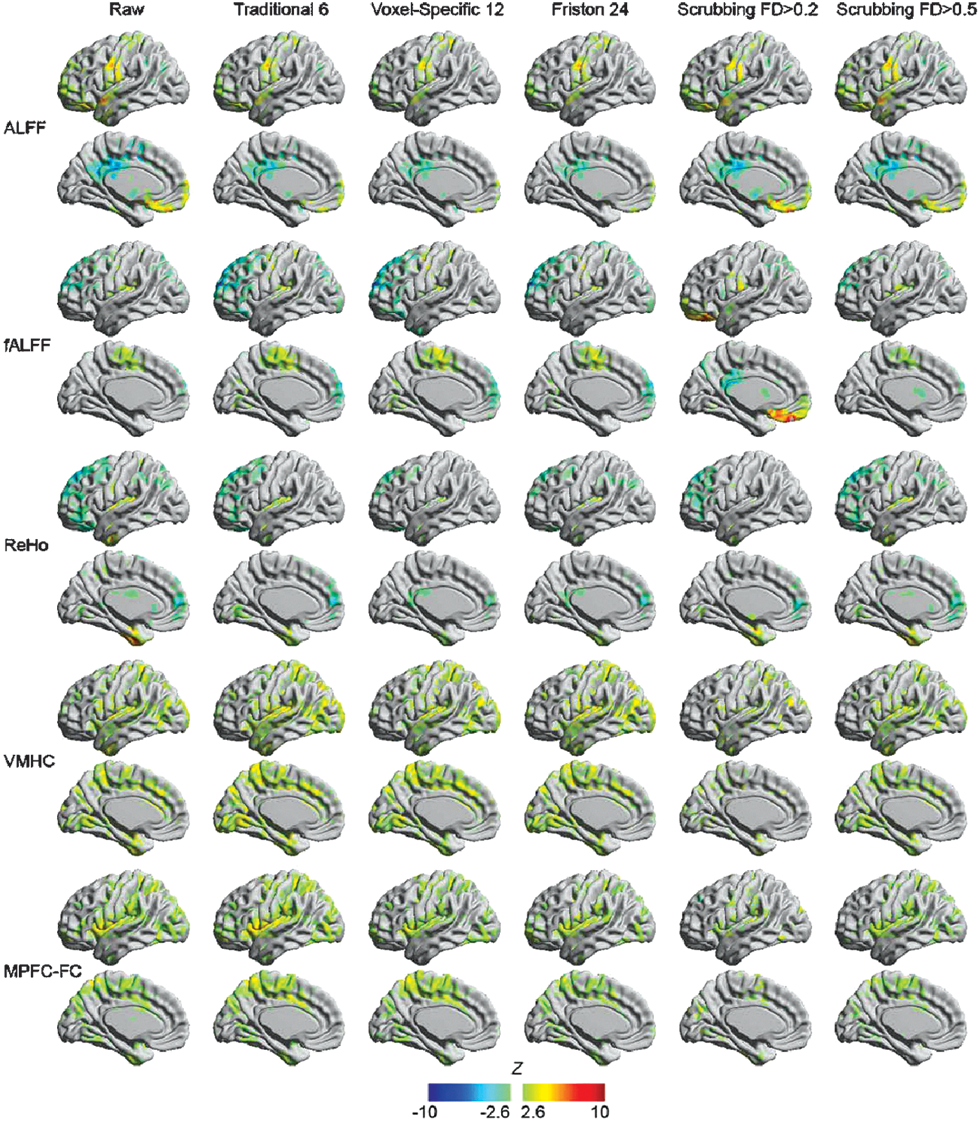
The Motion Crisis in Functional Connectomics: Damage Assessment and Control for Resting-State fMRI
Introduction: Recent work has demonstrated head motion contributes to artifactual differences in resting-state fMRI (R-fMRI) measures (Power et al., 2012a;Satterthwaite et al., 2012;Van Dijk et al., 2012). Here we explored how a broad array of R-fMRI-based intrinsic brain function measures are affected by head motion, and how such sensitivities and their test-retest (TRT) reliabilities are impacted by various motion correction strategies.
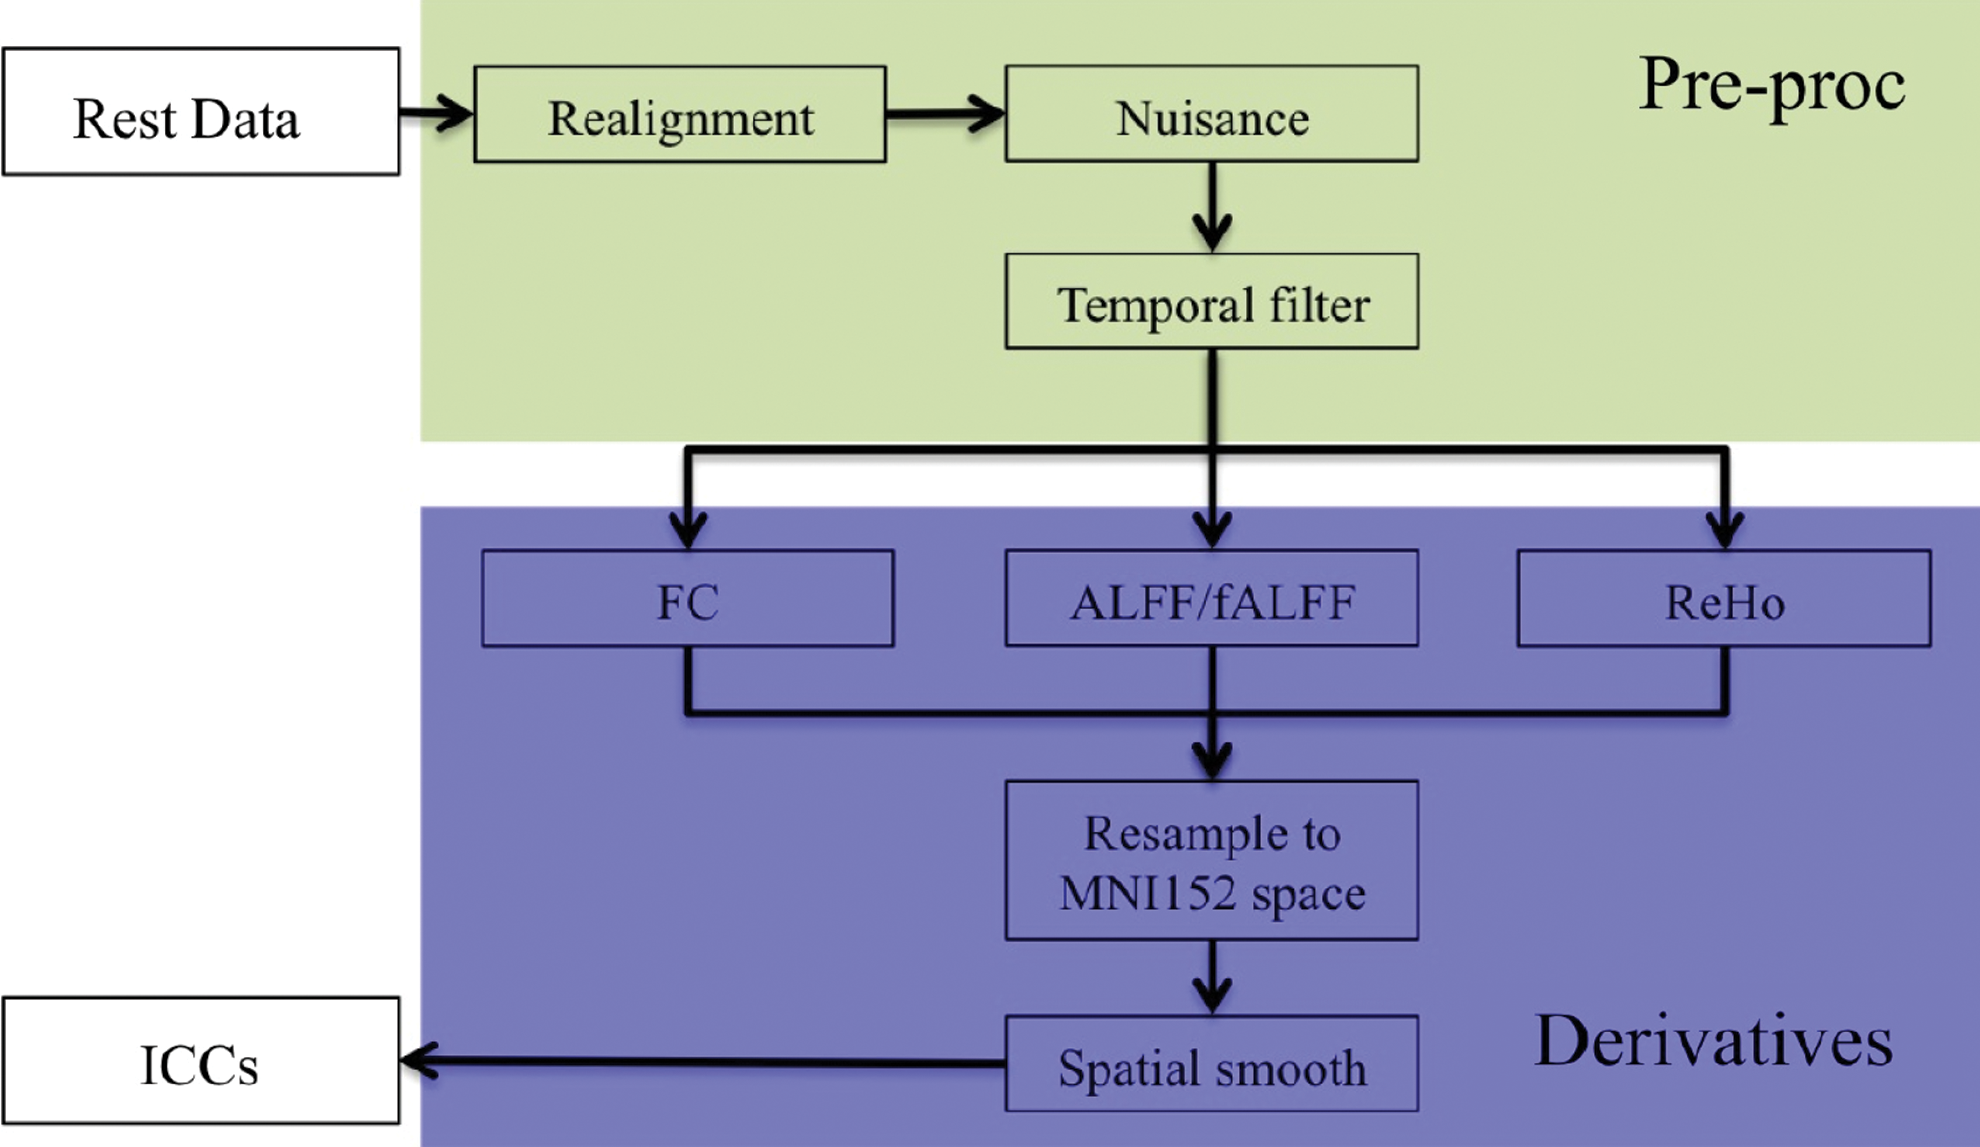
Methods: After preprocessing publicly released developmental, young adult and TRT datasets, the following strategies were applied to correct head motion effects: regressing out 6 head motion parameters (Traditional 6), regressing out autoregressive models (Friston et al., 1996) (Friston 24), regressing out voxel-specific head motion regressors (Voxel-Specific 12), and data scrubbing at framewise displacement (FD)>0.2 or 0.5mm. We then explored head motion effects and TRT reliability on amplitude of low frequency fluctuation (ALFF), fractional ALFF (fALFF), regional homogeneity, voxel-mirrored homotopic connectivity, and functional connectivity of medial prefrontal cortex.
Results: As previously suggested, head motion effects are stronger in developmental than adult data (Fig 1 vs. Fig 2). Among the measures, fALFF is least affected by head motion. Among head motion correction strategies, scrubbing at FD>0.2mm (Power et al., 2012b) cleared the most motion effect while creating artificial head motion effect in fALFF due to destruction of temporal structure. Scrubbing at FD>0.2mm also diminished TRT reliability dramatically (Fig 3); some subjects varied markedly in the number of time points excluded across sessions (e.g., 150 vs. 37). Importantly, head motion effects remained after all correction strategies (Figs. 1, 2) suggesting taking subject head motion into account at the group level is still necessary. Regressing out mean FD slightly decreased TRT reliability but preserved its structure (Fig 4).
The head motion effects (correlation to mean FD) on a broad array of R-fMRI-based intrinsic brain function measures (amplitude of low frequency fluctuation (ALFF) (Zang et al., 2007), fractional ALFF (Zou et al., 2008), regional homogeneity (ReHo) (Zang et al., 2004), voxel-mirrored homotopic connectivity (VMHC) (Zuo et al., 2010) and functional connectivity of medial prefrontal cortex (MPFC-FC, 6, 64, 3)) within typical developing children in NYU ADHD data set (N=89).
The head motion effects (correlation to mean FD) on a broad array of R-fMRI-based intrinsic brain function measures within young adults data (Harvard dataset, N=198).
The intra-session test-retest reliability measured (measured by intra class correlation) on a broad array of R-fMRI-based intrinsic brain function measures within NYU TRT dataset (N=25).
The intra-session test-retest reliability after regressing out mean FD on a broad array of R-fMRI-based intrinsic brain function measures within NYU TRT dataset (N=25).
Conclusion: Results suggest that head motion effects extend to all metrics when studying hyperkinetic populations. We suggest caution when using stringent scrubbing (e.g. FD>0.2mm as recommend by Power et al. 2012b), as test-retest reliability can be compromised and frequency metrics made immeasurable. Correction for inter-individual differences in motion at the group-level appears to be necessary regardless of individual subject correction strategy.
Applications: Psychology
MingoiaG.12LangbeinK.12DietzekM.12WagnerG.12SmesnyS.12GaserC.12SchloesserR.G.M.12BurmeisterH.P.12ReichenbachJ.12SauerH.12NenadicI.12
IZKF Aachen, Brain Imaging core facility, Aachen, Germany
University "F. Schiller", Klinik für Psychiatrie und Psychotherapie, Jena, Germany
Gender affects activity of the brain's default mode network at rest
Introduction: The default mode network (DMN) has been studied in a number of psychiatric and neurological conditions. The changes detected in these disorders are assumed to reflect task-independent basic alterations of brain function. However, there is little data on physiological variation, in particular effects of gender. Given the structural differences in male and female brains, it appears conceivable that basic functional differences might emerge even in the absence of cognitive task. In this study, we tested the hypothesis that DMN activity under resting state (RS) conditions differs between male and female healthy volunteers.
Methods: We obtained RS fMRI series (3T, 3×3×3mm resolution, 45 slices, TR 2.55s, 210 volumes) in 67 healthy, right-handed subjects: 33 females (mean age 31.6a±8.8), and 34 males (29.8a±7.9), matched for age (T-test: p=0.39). All subjects were asked to lie in the MRI scanner keeping their eyes closed with no further specific instructions. Data were first pre-processed using SPM5 (motion correction, co-registration/normalization and smoothing). We then applied FSL MELODIC software to perform a pICA yielding 30 independent components, and used an automated routine to select for each subject the component most closely matching the DMN component. This matching is quantitatively defined by the goodness of fit (Grecius, 2004). High pass (0.009Hz) and low pass (0.18Hz) frequency filters were applied. We then used SPM5 for second level analysis of DMN-specific statistical maps of each subject. We used two-sample T-tests to compare DMN functional connectivity between groups.
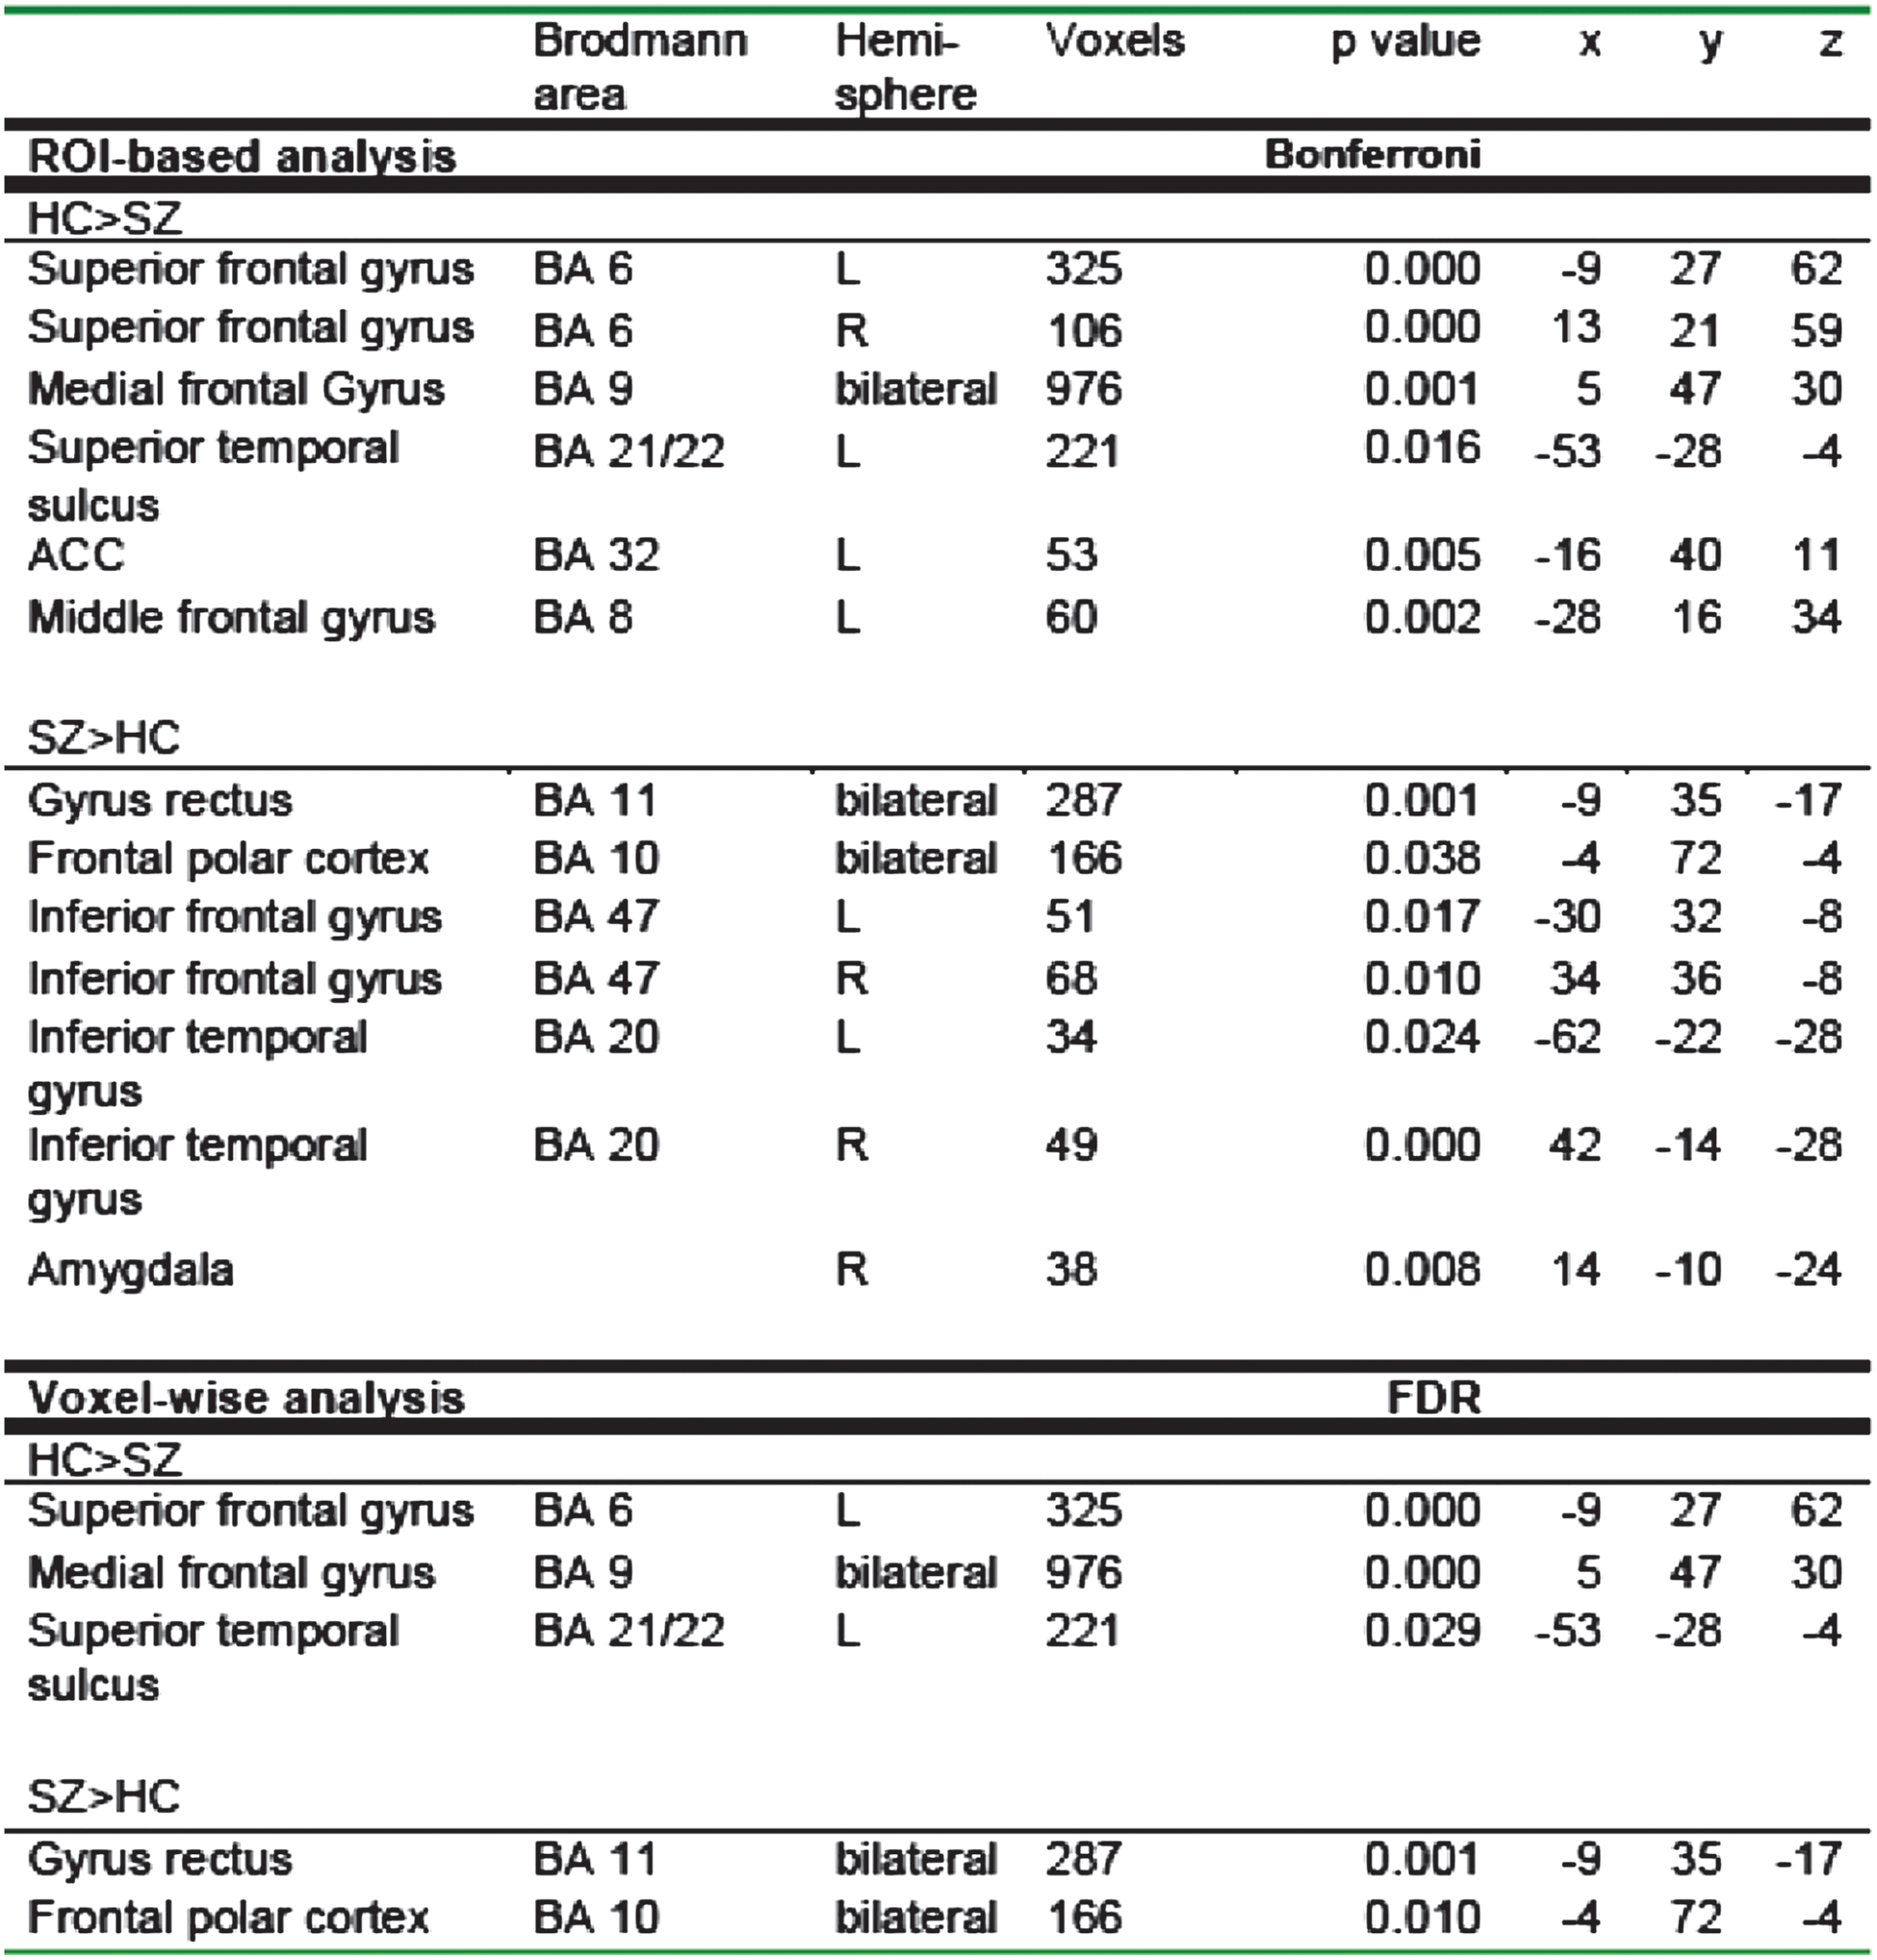
Results: Our method reliably identified a DMN component in every subject, with no differences of the goodness of fit between groups (p=0.77). We found significant differences (p<0.05 FDR) with males showing larger extent of the network in left middle frontal gyrus (BA10), left medial frontal gyrus (BA6), right precuneus (BA7) and right superior temporal gyrus (BA22).
Conclusions: Our findings provide robust evidence for gender-related modulation of DMN activity under RS. They contradict findings of a most recent study (Weismann-Fogel, 2010) suggesting that male and female brains show no difference in DMN activity. Our results suggest that sexual dimorphisms in the brain are detectable already under RS conditions.
FIG. 1.
FIG. 2.
Applications: Neurology
WolfV.1WilfongA.1BolloR.1
Baylor College of Medicine, Pediatric Neurology, Houston, United States
Whole Brain Resting State Sedated Functional MRI by Probabilistic ICA for Pediatric Epilepsy Pre-surgical Evaluation
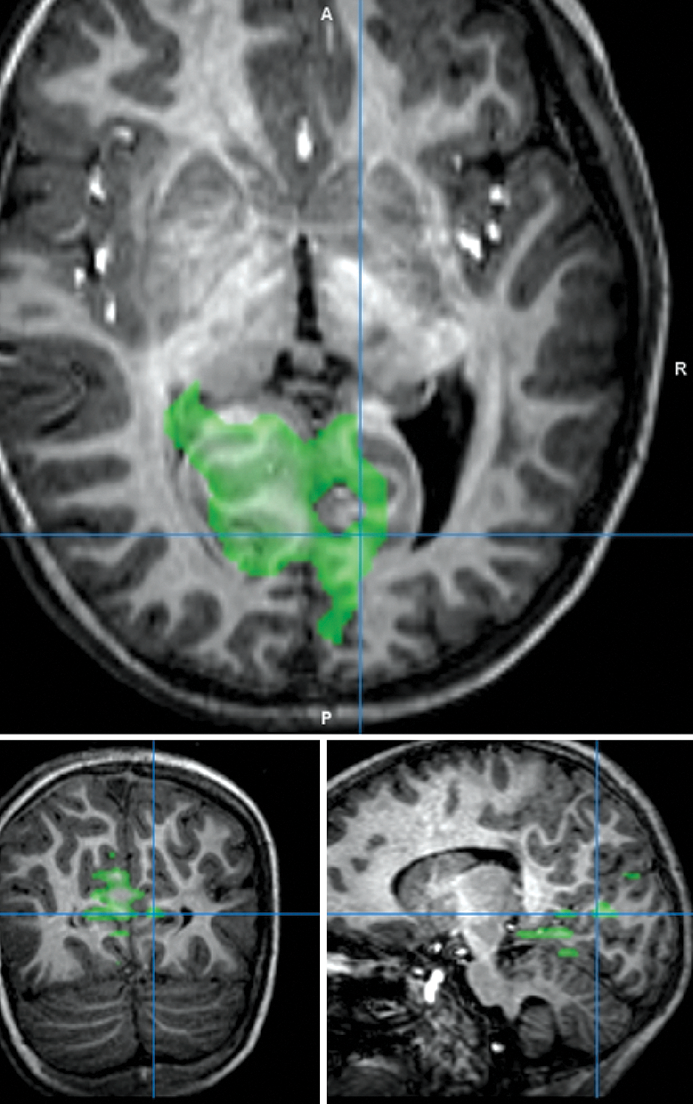
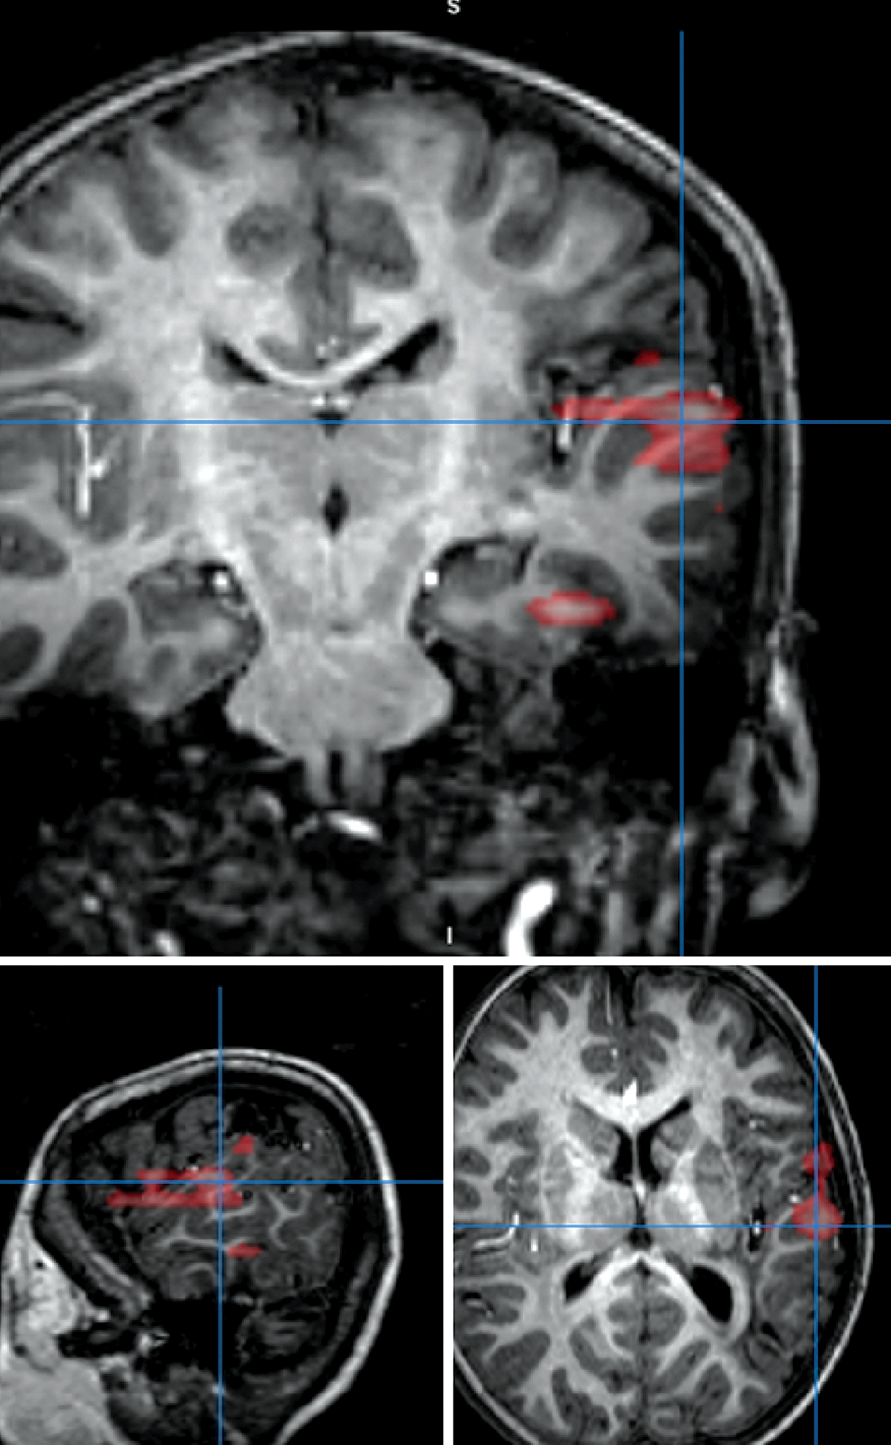
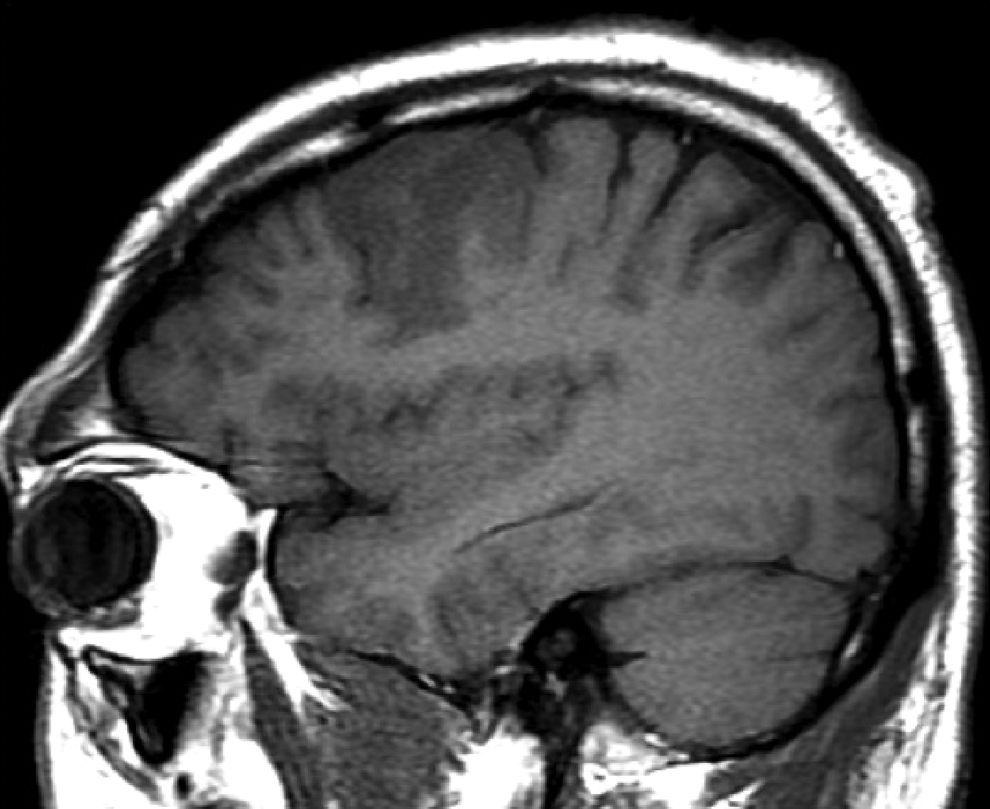
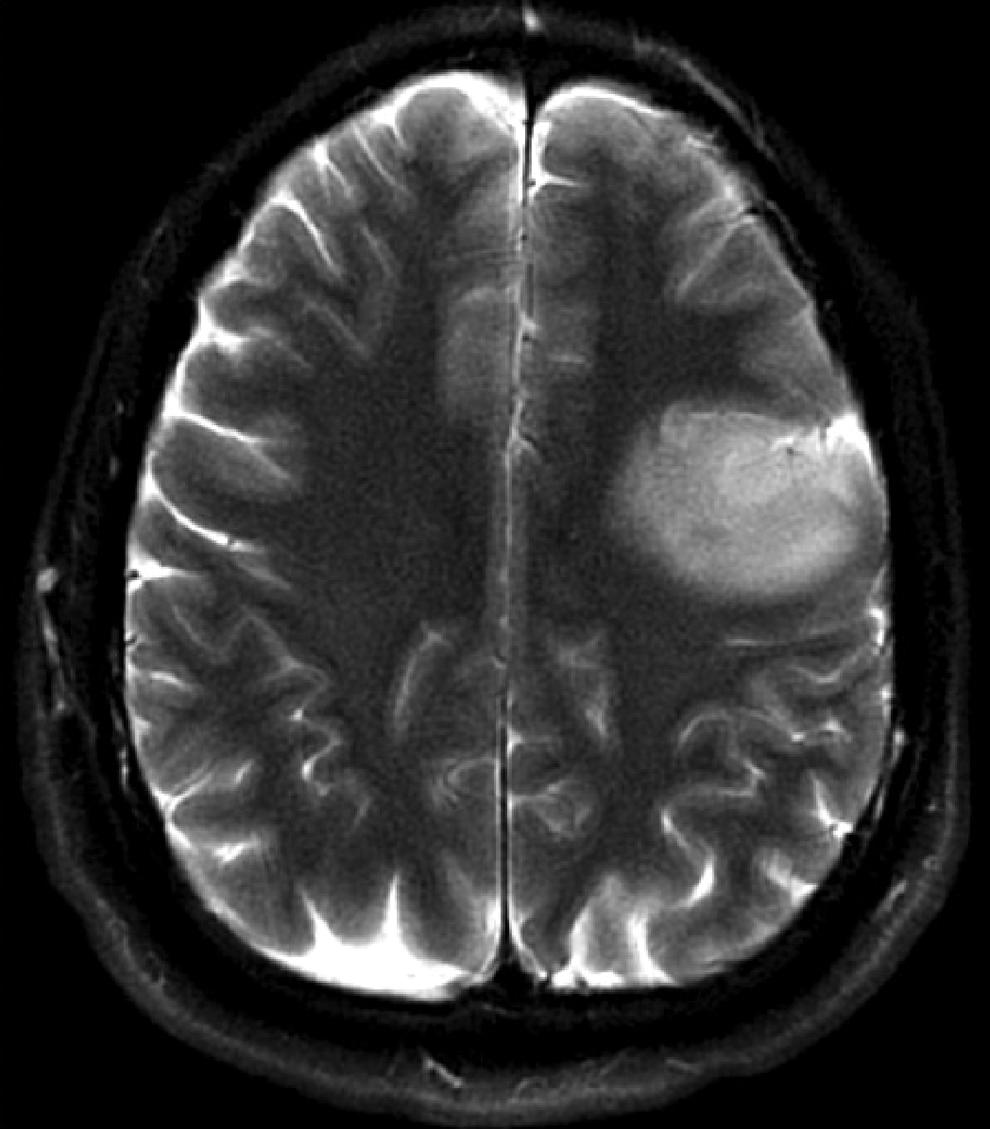
Question: In planning epilepsy surgery, it is important to assess the likelihood of loss of abilities secondary to removal of active brain tissue against improved quality of life from seizure reduction or cure. In this study, whole brain resting-state sedated functional MRI (rs-fMRI) of a developmentally delayed child was performed to determine optimum depth of left peri-rolandic and parietal located lesion resection for seizure freedom, avoiding right homonymous hemianopsia.
Methods: Whole brain rs-fMRI analyzed by probabilistic independent component analysis (PICA), and comparative passive activation (pa-fMRI) with checkerboard visual stimulation paradigm were collected on a sedated four year old child with intractable localization related epilepsy before surgery. Prior magneto encephalography demonstrated seizure foci localized to the left lateral peri-rolandic area.
Results: Both pa-fMRI and PICA methods were able to detect spatial distribution of bilateral visual network in relation to the lesion. But, PICA was also able to determine the atypical motor network location, anterior to lesion, as well as nearby left temporal receptive language.
Conclusions: This case report suggests that whole brain rs-fMRI analyzed by PICA may be more informative or complementary to standard approaches in epilepsy surgery, especially in patients who are not able to fully cooperate with standard testing, such as Wada or certain clinical exams such as visual perimetry, or may have altered anatomical distribution of cortical networks. This method yields the anatomical location of involved and neighboring neuronal networks with implications of network-associated functional ability to be considered by the surgical team and family.
1. Primary Vision Network by PICA
2. Receptive Language Network by PICA
3. Deactivation of Vision Network by GLM
4. Bilateral Motor Network by PICA
FIG. 1.
FIG. 2.
FIG. 3.
FIG. 4.
Data Analysis
LiuX.1DuynJ.1
NIH, NINDS, LFMI, AMRI, Bethesda, United States
Multiple Activity Patterns Uncovered by Temporal Decomposition May Explain Non-Stationary Network Dynamics
Objectives: Resting-State functional connectivity measured through blood-oxygenation-level-dependent (BOLD) signal correlations has been intensively investigated recently with attempt to understand dynamic organization of the brain. The functional connectivity has been shown to be non-stationary and vary significantly over time, even over the course of a typical scan session (∼ 10-15 minutes). However, such non-stationary variation in BOLD correlation may reflect solely the variation in the relative levels of signals and noise. In this study, we apply a novel technique to temporally decompose RSN patterns into multiple resting-state patterns (RSPs) with the purpose to understand the temporal dynamics of RSNs.
Methods: The resting-state data from 247 participants were selected from the “1000 functional connectomes project” (FCP). The RSN patterns obtained with conventional seed-based correlation maps were first replicated using a simplified point process analysis (PPA). It was then decomposed into multiple RSPs by applying classification analysis in the time domain. Each RSP is associated with a distinct set of time points.
Results: The group correlation map with respect to the posterior cingulate cortex (PCC, [0, −53, 26] in MNI coordinates) can be closely replicated by using our simplified PPA (Fig 1). This default mode network (DMN) pattern was then temporally decomposed into 8 PCC-RSPs (Fig. 2A), which demonstrate distinct spatial patterns (Fig. 2B). With similar processing, the dorsal attention network (DAN) pattern in the correlation map with respect to the intra-parietal cortex (IPS, [22, −58, 54]) was also divided to 12 IPS-RSPs covering distinct brain regions (Fig 3). In comparison, the group independent component analysis (ICA) on the same data set could not replicate most of the RSPs (Fig 4).
The DMN pattern shown in the group correlation map (the upper row) derived from a PCC seed region (green square) can be closely replicated with the simplified PPA method (the lower row). The spatial correlation between two maps is 0.995. The color scale for displaying was automatically adjusted for each map according to their map values.
The DMN pattern is decomposed into 8 PCC-RSPs associated with different sets of time points (A). Four PCC-RSPs strongly involving the PCC seed region (green square) are overlaid over each other to highlight their differences (B).
The DAN pattern extracted derived from a seed region in the right IPS (green square) is decomposed into 12 IPS-RSPs. The first 6 IPS-RSPs show strong activity at the bilateral IPS regions, suggesting their functional relevance to this brain region.
Six (out of 30) independent components (ICs) showing significant values (Z>3) at the posterior cingulate cortex (PCC) or left intra-parietal sulcus (IPS) seed regions. Four of them (IC 13, 16, 27, 29) show patterns significantly involving the PCC or IPS regions. Among them, the IC 16 and 29 display the DMN and DAN patterns, and the IC 27 covers parts of the visual cortex and the posterior IPS region.
Conclusion: The RSN pattern found with the conventional seed-based correlation map appears to be a summation of multiple distinct RSPs appearing at different time. These RSPs could not be identified using the ICA approach because their spatial patterns are not distinct from each other enough to satisfy its strict “independence” constraints. Switching between these RSPs over time may account for, at least partially, the non-stationary characteristic of the resting-state functional connectivity.
Applications: Psychology
KruschwitzJ.D.1VarikutiD.2JensenJ.1ErkS.1MohnkeS.1HeinzA.3KirschP.4Meyer-LindenbergA.4WalterM.2WalterH.1
Charité - Universitätsmedizin Berlin, Division of Mind and Brain Research, Department of Psychiatry and Psychotherapy, Berlin, Germany
University of Magdeburg, Department of Psychiatry, Magdeburg, Germany
Charité - Universitätsmedizin Berlin, Division of Neuroimaging Research, Department of Psychiatry and Psychotherapy, Berlin, Germany
University of Heidelberg, Central Institute of Mental Health, Mannheim, Germany
Neuroticism predicts resting-state functional connectivity between Amygdala and Fusiform Gyrus
Introduction: Neuroticism (N) is associated with the experience of negative affect as well as with mood and anxiety disorders. A potential neural substrate is the amygdala, which was shown to exhibit increased activity during facial emotion processing in anxiety-prone subjects (Stein et al., 2007;Am J Psychiatry). Dysfunction of the amygdala is associated with mood and anxiety disorders. Recent research investigated the relation of trait harm avoidance and resting-state functional connectivity (RSFC) of the amygdala (Ying et al., 2012;PlosONE). However, the influence of trait N on amygdala RSFC has not been studied. To that end, we used resting-state fMRI (rs-fMRI) to investigate the association of trait N and amygdala RSFC.
Methods: rs-fMRI data was collected from 276 healthy subjects from three independent scanner-sites. (1) Single subject data processing was carried out using the Data Processing Assistant for Resting-State fMRI (DPARSF) (Yan & Zang, 2010). For each subject functional connectivity maps with amygdala (bilateral) serving as seed locations were computed. (2) Whole-brain regression models with N (controlled for age, gender, site) serving as covariate were carried out using SPM8 to determine RSFC predicted by N for the whole sample as well as for each site separately.
Results: rs-fMRI results for the whole sample revealed that trait N positively predicted RSFC between the right amygdala and the bilateral Fusiform Gyrus (FG) (Fig 1) (among others). N predicted RSFC between these structures could be replicated in two scanner-sites (site one: right amygdala - bilateral FG, left amygdala - left FG; site two: left amygdala - left FG). Implications: These preliminary data suggest that trait N predicts RSFC between the amygdala and the FG. This rs-fMRI finding relates to recent fMRI findings that showed that the amygdala exhibits connections to the FG, and may thus strongly influence FG function during face perception (Herrington et al., 2011;NeuroImage). Regarding the assumption that FG activity is modulated by emotional expressions (Vuilleumier et al., 2001;Neuron) and findings of increased amygdala activity in anxiety-prone subjects during facial emotion processing, our result implies that trait N affects this critical connection between the amygdala and the FG, which in turn may account for altered processing of negative facial emotions in N.
Neuroticism predicted resting-state functional connectivity between the right amygdala (AAL Atlas volume-based seed: x: 27.32 y: 0.64 z: −17.50) and the bilateral fusiform gyrus in the whole sample (n=276).
Applications: Neurology
KoenigK.1RaoS.2LoweM.1LinJ.1HarringtonD.3LiuD.4SakaieK.1PaulsenJ.5
The Cleveland Clinic, Imaging Institute, Cleveland, United States
The Cleveland Clinic, Neurological Institute, Cleveland, United States
Veterans Affairs San Diego Healthcare System, Research, Neurology, and Radiology Services, San Diego, United States
The University of Iowa Carver College of Medicine, Department of Biostatistics, Iowa City, United States
The University of Iowa Carver College of Medicine, Psychiatry, Iowa City, United States
Resting-State Functional Connectivity in Prodromal Huntington's Disease
Introduction: Individuals in the prodromal phase of Huntington's disease (pre-HD) show evidence of abnormal brain activation patterns on task-activated fMRI in the absence of measureable changes on neuropsychological testing and structural brain imaging [1]. Functional connectivity MRI (fcMRI), measured from low-frequency fluctuations in the blood oxygen level dependent (BOLD) timeseries during rest, has the potential to identify disruptions in intrinsic brain connectivity in the prodromal stages of HD. fcMRI may be able to characterize disease progression and serve as a potential biomarker for future HD therapeutics, but to date has not been evaluated in this population.
Methods: 16 gene-positive (mean age 35.63, mean CAP score 342.11, 12 males) and 8 gene-negative participants (mean age 49.5, 6 males) were scanned in an IRB-approved protocol at 3T in a 12-ch receive head coil. Scans included T1-MPRAGE and a resting connectivity fcMRI scan. All participants performed a time discrimination task as described in [2]. A one-way ANOVA between the gene-positive and gene-negative subjects was used to identify potential seed regions for an fcMRI analysis. The greatest group difference was in the left insula [38 21 5] (p
Average fcMRI maps in the Negative, FAR, and CLOSE groups for the left insula.
Results: and discussion:Connectivity of the left insula to the anterior and posterior cingulate cortices is significantly stonger in the gene-negative group than the FAR group, and stronger in the FAR than in the CLOSE group (p
References
Zimbelmanet al. J of the International Neuropsychological Society, 2007; 13:758–769.Raoet al.Nat Neurosci., 2001; 4:317–23.Loweet al. Hum Brain Mapp., 2008; 29:818–27.
Data Analysis
ghasemiM.1MahloojifarA.1ZareiM.2
Tarbiat modares university, electrical and computer department, Tehran, Iran, Islamic Republic of
Institute of Cognitive Sciences Studies, Tehran, Iran, Islamic Republic of
Detecting dependency in the Motor Network from Resting State fMRI data of Parkinson Disease using Copulas
Objective: To examine changes of functional dependency between brain regions of interest associated with known anatomical pathology in Parkinson Disease (PD) using copula theory on resting state fMRI.
Methods: FMRI recorded from10 PD patients and 10 healthy subjects during rest.After preprocessing using FMRIB Software Library, the covariates (WM and CSF signal plus 6 motion parameters) were regressed out and the results were filtered (0.01-0.08 Hz). ROIs included: Thalamus (THAL), Caudate (CAU), Putamen (PUT), Pallidum (PALL), Hippocampus (HIPP), PreFrontal Cortex (PFC), Cerebellum (CERR) and motor cortex (MC). Functional connectivity between meantime series of each pair of ROIs were quantified using joint statistical distribution -Copula. Five types of copulas were tested: Gaussian and t (Euclidean), Clayton, Gumbel and Frank (Archimedean). The result was transformed to the copula scale using kernel estimator of the cumulative distribution function, deriving an efficient maximum likelihood procedure for estimating copula parameters. Goodness of fits were tested using root mean square error (RMSE) between each copula function and joint empirical cumulative distribution to test if the data could belong to a certain family. Control vs PD group comparison was also done on dependency parameter using two-sample t-test.
Results: The averages of estimated functions are shown in Fig 1 and the means of estimated parameters in each hemisphere are listed in Table 1. Significant group comparisons are shown in red. Fig 2 and 3 show connectivity network of significant parameters. The colors of connections represent T values of between-group analysis.
FIG. 1.
FIG. 2.
FIG. 3.
FIG. 4.
Conclusion: This study showed that changes in the functional relationship between cerebellum and basal ganglia in PD patients comparing to controls using copulas dependency analysis. Functional dependency between cerebellum and basal ganglia is much stronger in PD than in control. Different type of copula analysis was needed to demonstrate group differences depending on the anatomical site of study. We found that joint distribution characteristics could potentially provide information on nonlinear interactions and functional connectivity within regions.
Universitat Jaume I, Basic and Clinical Psychology and Psychobiology, Castellón, Spain
Universitat Pompeu Fabra, Department of Information and Communication Technologies, Barcelona, Spain
Universitat Pompeu Fabra, Departament of Technology, Barcelona, Spain
Resting State fMRI as an index of learning and ability: The case of Phonetic Training
Objectives: Our aim was to investigate the effect of phonetic training on the connectivity of neural networks in the brain. Data of an fMRI task and resting state fMRI (rs-fMRI) was obtained before and after a 2-week training session on a phonetic Hindi dental-retroflex non-native contrast. We hypothesized that this training session would result in changes in functional connectivity (FC) during rs-fMRI.
Methods: Nineteen right-handed participants (mean age 23.74±2.54, 9 males) completed the rs-fMRI and fMRI task on a 1.5T Siemens scanner before and after training (Figure 1). During the blocked-designed fMRI task, participants had to identify a non-native Hindi contrast (dental /da/ and retroflex /da/ sound) and a native contrast (/da/ and / ta/ dental sounds). Brain activation changes obtained from the comparison of pre and post training fMRI task were used as seed regions for rs-fMRI. We used REST toolkit to calculate FC. A pairwise linear correlations between seeds was computed obtaining the z-values for each subject. Furthermore, we performed independent component analysis (ICA) using GIFT software to obtain the FC networks before and after learning. A paired t-test was computed to evaluate changes in FC.
Schematic timing representation of experimental procedure.
Results: The following seed regions were derived from the fMRI non-native contrast analyses: Left Frontal Inferior Operculum/anterior Insula (LFO/aI), left Supramarginal Gyrus (LSMG) and left Superior Parietal Lobe (LSPL). On the other hand, the native contrast resulted in a seed region in the left middle temporal gyrus (LMTG) (Figure 2). The FC analysis showed a significant connectivity decrease between LFO/aI and LSPL after training (Figure 3). Additionally we performed ICA, which showed that there were two networks anchored by the LFO/aI and LSPL: the Left Fronto-Parietal Network (L FPN) and the Salience Network. The comparison post vs pre training showed a significant increase in FC of LFO/aI within the Salience Network and a significant decrease within the L FPN (Figure 4).
ROIs selected as seeds for the functional connectivity analysis. These ROIs were derived from an ANOVA (z-value >3) by identifying (a) brain areas involved in native contrast processing (in blue), and (b) brain areas involved in non-native contrast processing (in red).
Comparison of FC between rs-fMRI periods, pre-training (RESTpre) in light blue, and post-training (RESTpost) in dark blue. We only observed a significant decrease in correlation of LFO/aI and LSP [t(18)=3.27 p<0.004].
Comparison of FC of the LFO/aI seed within the Salience Network and L FPN, and of the LSPL seed within L FPN between rs-fMRI periods. After training, the LFO/aI showed a significant decrease of FC within L FPN and a significant increase within Salience network, while no change were observed for LSPL.
Conclusion: Phonemic learning was associated with functional changes in LFO/aI, LSPL and LSMG. Importantly, rs-fMRI revealed post-training changes involving a reduction of FC between LFO/aI and LSPL. This reduction was associated with an increased activity of LFO/aI within the Salience network after training, that decouples its activity from LSPL within the L FPN.
Applications: Neurology
LiaoW.1ZhangZ.2DingJ.-R.3XuQ.3ZangY.1LuG.2
Hangzhou Normal University, Center for Cognition and Brain Disorders and the Affiliated Hospital, Hangzhou, China
Nanjing University School of Medicine, Department of Medical Imaging, Jinling Hospital, Nanjing, China
University of Electronic Science and Technology of China, Key Laboratory for NeuroInformation of Ministry of Education, School of Life Science and Technology, Chengdu, China
Dynamic changes intrinsic functional connectivity in childhood absence epilepsy
Question: The intrinsic functional connectivity (iFC) was used to assess neuro-pathophysiological mechanism of function impairments in patients with childhood absence epilepsy (CAE). Little is known about, however, dynamic changes of iFC representing time-resolved seizures.
Methods: A total of 12 patients with CAE (8 female, age: 8.30±2.06 yrs) were recruited. All patients underwent simultaneous EEG (a 10/20 systems with 32 Ag/AgCl electrodes) -fMRI (Siemens Trio 3T scanner) recording at Jinling Hospital, Nanjing, China. The EEG was processed offline. The determined seizure onset and end time were tagged with time points of occurrence. The time-varying dynamics used a slide window (50 volumes) correlation of seed at posterior cingulate gyrus/precuneus (PCC/PCUN). For each slide window, we gain the seed-based iFC map in which the r values have been Fisher z-transformed. The slide window iFC maps of the preictal, ictal, and postictal periods (all last from −22s to +32s) were temporally aligned across seizures. To determine significant changes in the iFC maps across all intervals, we apply a one-way ANOVA within-subjects analysis.
Results: The positive correlation maps of seed at PCC/PCUN were primarily found in brain regions of default mode network; while the anti-correlation maps were mainly observed in task positive network (Fig 1). We then compared functional connectivity maps for all subjects and seizures across preictal, ictal, and postictal intervals using one-way ANOVA within-subjects analysis (Fig 2). The significant altered iFC regions across the intervals were located at the bilateral caudate nucleus, cuneus, pre/post-central gyrus, and the right thalamus and fusiform gyrus (all P
Group intrinsic functional connectivity maps.
One-way ANOVA within-subjects analysis across all intervals.
Conclusion: Our findings suggest the extent to which iFC is dynamic and flexible, rather fixed and invariant. In this respect, a dynamic changes iFC across seizures could contribute to the understanding of initiation, maintenance, and termination of CAE.
Data Analysis
ScheelN.123HeldmannM.2HagenahJ.2Al-KhaledM.2MünteT.2MamloukA. Madany1AndersS.2
Universität zu Lübeck, Institut für Neuro- und Bioinformatik, Lübeck, Germany
UKSH - Campus Lübeck, Klinik für Neurologie, Lübeck, Germany
Universität zu Lübeck, Graduate School for Computing in Medicine and Life Sciences, Lübeck, Germany
Local connectivity patterns of resting-state fMRI can serve as biomarkers for neurodegenrative diseases.
The intrinsic functional organization of the human brain, assessed by resting-state fMRI, has gained increasing attention as a possible, predictor for neurodegenerative diseases.
Neuroinformatics provide machine-learning tools such as Support Vector Machines, which can be used to test the predictive value of different features of spatio-temporal brain activity. Previous studies have commonly used seed-based correlations, global connectomes based on averaged time series, or components from ICA/PCA as descriptors of connectivity.
We tested the usefulness of regional fine-scale (local) connectomes to classify brain states associated with neurodegenerative diseases, in particular Parkinson's Disease (PD).
Recent findings [e. g. Berg et al. Arch Neurol. 2011 Jul; 68(7):932-7] suggest a possible link between the hyperechogenicity of the Substantia nigra (SN) and the progression of Parkinson's Disease.
So far, it has been unknown how this SN-hyperechogenicity relates to neurodegenerative processes in PD, as established resting-state fMRI measures are able to differentiate between PD-patients and controls but fail to separate classes of PD-patients with differences in SN-echogenicity. Here we examine whether these are associated with differences in local intrinsic functional connectivity as assessed by our SVM assisted Multi-Voxel-Connectivity-Analysis (MVCA).
Our results suggest that fine-scale connectivity-based classification is possible in single cortical regions, e. g. olfactory gyrus.
The finding that fine-scale connectivity in the olfactory gyrus differentiates between classes of different SN-echogenicity is particularly interesting, as olfactory deficits are an early indicator for Parkinson's Disease.
FIG. 1.
Applications: Psychology
GordonE.1BreedenA.1BeanS.1VaidyaC.1
Georgetown University, Washington DC, United States
Working memory-related changes in functional connectivity persist beyond task disengagement
Objectives: Research has indicated that resting-state functional connectivity is not stable. Compared to a pre-task resting state, connectivity measured after sensorimotor and language tasks was altered within and between task-relevant networks. However, it is not known whether 1) such post-task effects on connectivity can also be observed after a cognitively effortful task such as working memory (WM); and 2) whether post-task connectivity alterations affect connectivity-behavior relationships observable during the “baseline” resting state.
Method: 50 healthy young adults were scanned using fMRI during a baseline resting state, during an Nback WM task, and during a post-task resting state. Default mode network (DMN) and task-positive network (TPN) nodes were identified respectively as regions positively and negatively correlated with a posterior cingulate cortex (PCC) seed during the baseline resting state. Within-DMN, DMN-TPN and within-TPN connectivities were calculated for each run. StateXNode ANOVAs were conducted to identify effects of State (baseline rest, Nback, post-task rest). Finally, in each run, PCC connectivity was correlated against a behavioral measure of Inattentiveness.
Results: Effects of State were observed in within-TPN and DMN-TPN connections, but not in within-DMN connections. Compared to the pre-task resting state, within-TPN connectivity was reduced across all nodes during WM and remained reduced in the post-task resting state. Similarly, DMN-TPN connectivity was less negative in all nodes during WM and remained less negative after the task. Correlations between PCC connectivity and Inattentiveness scores were observed in DMN regions before and during WM, but were eliminated during the post-task resting state.
Conclusions: Performance of an effortful WM task results in a less efficient network configuration (reduced within-TPN and less negative DMN-TPN connectivity), and this persists after task conclusion, possibly reflecting continued cognitive resource depletion. Further, connectivity-behavior relationships are obscured in this altered resting state. These findings have implications for models of brain recovery following transient effortful cognition, as well as for study designs investigating connectivity relationships with behavior.
Analysis of Oculomotor Networks in Parkinson's Disease Comparing Resting-State fMRI Functional Connectivity and Videooculographic Results
Objective: It ist known that oculomotor networks comprising of midbrain, cerebellar and basal ganglial structures are affected in patients with Parkinson's Disease (PD). In addition, there is an increasing evidence of the involvement of non-motor symptoms in oculomotor control that is functionally associated with the frontal cortex which appears to be contributed in executive control. Oculomotor performance and the functional connectivity between brain regions of interest (ROI) associated with the pathology of PD was investigated. Therefore videooculography (VOG) and resting-state fMRI (RS-fMRI) were performed to assess a group analysis between PD patients and controls.
Methods: Twenty-five patients with PD and 9 controls underwent oculomotor examination and RS-fMRI. VOG was performed by means of Eye-Link System I. The data were analyzed by an in-house developed software. Reactive saccades and smooth pursuit eye movement as well as visually triggered delayed saccades and alternating voluntary gaze shifts were examined. The RS-MRI protocol (1.5 T scanner) consisted of 120 volumes, in-plane resolution 3.27×3.27 mm2, slice thickness 3mm (TR=3080 ms, TE=28 ms). RS-fMRI functional connectivity analysis was calculated by the REST-software utilizing 9 distinct ROIs: frontal cortex, parietal cortex, thalamus, cerebellum, basal ganglia, striatum, midbrain, pons and medulla oblongata.
Results: Executive control of oculomotor performance as well as functional connectivity within the oculomotor networks in the brain stem, basal ganglia and thalamus significantly differed between PD and the control group. Projections from the basal ganglia into the parietal cortex and into the cerebellum were affected. RS-fMRI results did not propose an altered connectivity of the frontal cortex.
Conclusion: RS-fMRI showed a disturbed functional connectivity of basal ganglia, brain stem, and thalamic circuits that play a crucial role in oculomotor function. The close relation of these findings to oculomotor performance in PD patients gives evidence for electrophysiologic and neuropathological findings by the in vivo imaging method of RS-fMRI. Nevertheless, evidence for a possible role of the frontal cortex in the executive control of oculomotor function could not be elicited and needs further investigation.
Data Analysis
De MunckJ.C.1McAsseyM.2BijmaF.2De GunstM.C.M.2
VUmc, Physics and Medical Technology, Amsterdam, Netherlands
VU University Amsterdam, Mathematics, Amsterdam, Netherlands
fMRI correlates of micro states within the alpha band
Simultaneous recording of EEG and fMRI is a way to provide new insights into the generators of EEG phenomena. EEG/fMRI is clinically used to find the underlying sources of inter-ictal epileptic discharges in patients that are candidates for brain surgery. The generators of the alpha band have been studied by correlating the time variations of occipital alpha amplitudes to the fMRI time series. A limitation of these simple EEG-informed analyses is that the available EEG information is used only partly to construct regressors for the correlation analysis. As a first step towards a more complete integration of EEG and fMRI we here propose to construct regressors of interest by clustering the (normalized) spatial maps within the alpha band.
Simultaneous EEG and fMRI were recorded from 16 healthy subjects in eyes-closed resting-state condition during 30 min. A TR of 3 s was used on a 1.5 T Siemens Sonata scanner. EEG data were subdivided into 3 s epochs, corresponding to the fMRI volumes. Gradient and heart beat artifacts were removed from the EEG using in-house developed software, as were outlying channels and epochs. For each electrode and epoch the data power was computed in the frequency band ranging from 8.6 to 11.6 Hz. Normalized power maps were subjected to hierarchical clustering analysis using four to five clusters (fig 1). Cluster memberships (fig 2) were convolved with standard HRF and used as regressor of interest in the general linear model applied to all fMRI voxel time series.
FIG. 1.
FIG. 2.
It was found that the clusters generally could be interpreted as low, intermediate or high frequency or non-specific parts of the alpha band (fig 3). In a pilot study we found that for one of the subjects, the voxels that correlated significantly with the cluster memberships were very similar to those found in the occipital alpha power method (fig 4). For the other subjects, a systematic comparison is ongoing.
FIG. 3.
FIG. 4.
The proposed cluster analysis of EEG maps is expected to give a physiologically more plausible interpretation than the alpha power method, because it is more directly connected to the concept of EEG micro-states. Furthermore, it is based on all electrodes rather than on a small subset. The preliminary finding that the fMRI correlation patterns are nevertheless very similar is quite unexpected because the ways the regressors were constructed are complementary in many respects.
Humans tend to devote consciousness to rational and emotional reflection on past or imagined experiences when they rest or engage in low-demand tasks. Given the importance of these non-sensory, endogenous cognitive processes to the human condition and their (putative) impairment in brain disorders, it is imperative to understand their neural correlates. Interestingly, whereas neuroimaging of brain activity during rest has advanced rapidly over recent years, remarkably few studies have tested whether cognition can be related to brain activity during resting-state neuroimaging.
In the present study, resting-state functional magnetic resonance imaging (RS-fMRI) data were acquired from 68 healthy adults in two sessions. Each session was immediately followed by completion of a Resting-State Questionnaire (RSQ) with 50 items for rating thoughts and feelings on a five-point Likert scale. We here report on within-subject variation in two dimensions of RS cognition derived from the RSQ, sleepiness and somatic awareness, and how this variation related to the changes in RS-fMRI functional connectivity (FC) within ten commonly described functional brain networks.
The RSQ data revealed intra-individual changes in sleepiness and somatic awareness experienced by the participants over the two sessions. To test whether changes in these two factors were associated with FC changes, we performed within-subject testing using the so-called dual-regression approach (Filippini et al., PNAS 2009) with predefined spatial masks derived from an ICA analysis of BrainMap data (Smith et al., PNAS 2009). Results show that increased sleepiness is associated with increased FC within sensorimotor and visual resting-state networks. In contrast, increased somatic awareness is associated with decreased FC within visual, auditory and executive resting-state networks.
We propose that the observed associations between resting-state cognition and the expression of intrinsic connectivity networks can parsimoniously be explained by a framework in which cognitive processing leads to more differentiated and spatially confined hemodynamic responses, whereas disengagement gives rise to widespread non-specific (idling-like) low-frequency hemodynamic oscillations within functional brain networks.
Applications: Neurology
DingJ.-R.12AnD.3LiaoW.4ZhouD.3SpornsO.2ChenH.1
University of Electronic Science and Technology of China, School of Life Science and Technology of China, Chengdu, China
Indiana University, Department of Psychological and Brain Sciences, Bloomington, United States
West China Hospital of Sichuan University, Department of Neurology, Chengdu, China
Hangzhou Normal University, Center for Cognition and Brain Disorders, Hangzhou, China
Decreased Coupling between Functional and Structural Networks in Psychogenic Non-epilepsy Seizures
Introduction: Psychogenic non-epileptic seizures (PNES) resemble epileptic seizures, but lack epileptiform discharges (1). Recent evidence from resting-state functional MRI (fMRI) (2) and EEG synchronization (3) indicate abnormal functional connectivity in cognitive-emotional attention system (4). Functional connectivity and structural connectivity are complementary and the relationship between them is disrupted in disease states (5,6). However, whether the relationship of functional-structural connectivity is altered in PNES is unknown.
Methods: Nineteen PNES patients (6 males, 19.63±7.76 years) and 20 healthy controls (8 males, 21.85±1.70 years) underwent resting-state fMRI and diffusion tensor imaging scanning on a 3T siemens Trio system (Erlangen, German) in West China Hospital of Sichuan University. Using 90 regions defined by AAL template, we constructed weighted functional networks using Pearson's correlation, and structural networks via Fiber Assignment by Continuous Tracking (FACT) algorithm, following a definition of weighted edges similar to our previous study (6). The coupling analysis was constrained by the edges with non-zero structural connectivity, similar to our previous study (6). Then, coupling of functional-structural connectivity was compared by using permutation tests (5000 permutations). Finally, we investigated the relationship between coupling strength and duration of disease.
Results: The coupling strength of functional-structural connectivity were significantly decreased (r=−3.8098, p=0.0004) in PNES patients (0.2636±0.0410) compared with healthy controls (0.3213±0.0525). Furthermore, the decreased coupling strength of functional-structural connectivity was negatively correlated with duration of disease (r=−0.4801, p=0.0375).
Conclusions: Decreased coupling strength suggests loss of coalescence of functional and structural connectomes in PNES patients. Furthermore, the negative correlation between the coupling strength and durations of disease indicates that the decoupling of functional-structural connectivity might be related to the progress of long-term impairment in patients, which could improve our understanding of the disorder's pathophysiological mechanisms.
Coupling of functional-structural connectivity in PNES patients and healthy controls.
Correlation between coupling strength of functionalstructural connectivity and duration of disease in PNES.
Data Analysis
HsiehH.-L.12ChenP.-Y.2JawF.-S.1TsengW.-Y.I.2
Institute of Biomedical Engineering, National Taiwan University, Taipei, Taiwan
Center for Optoelectronic Biomedicine, National Taiwan University, Taipei, Taiwan
An objective and automatic denoising method applied to resting state functional magnetic resonance imaging data
Introduction: Blood-oxygen-level dependence functional magnetic resonance imaging (fMRI) suffers from various artifacts and physiological noise. Band-pass filtering (BPF) is a common step to reduce noise however it cannot eliminate aliasing problems. Several noise reduction methods were proposed using regression, component analyses, or machine learning. Still, there exists debate on using regression, and the identification of noise component and training dataset often involve visual inspection. To avoid visual inspection bias and better reduce noise than BPF, we proposed an objective and automatic denoising method applied for resting fMRI data using independent component analysis (ICA) and normalized cuts algorithm (Ncuts).
Methods: The functional images were preprocessed before noise reduction. The spatial ICA was employed to obtain independent components. Our denoising proceeds as follow: (1) five indices are calculated as the features for each component; (2) two level binary classifications based on the features divides components into noise and resting state component using Ncuts; (3) the denoised data is obtained by removing components reflecting noise from the fMRI data. In the end we used our experimental resting fMRI data containing 40 healthy subjects to evaluate the performance of our denoising algorithm comparing to BPF.
Results: Our denoising algorithm automatically distinguished nuisance signals such as motion and physiological noise from fMRI data [Figure 1]. Stronger partial correlation coefficient in diagonal was found in denoised data compared to temporal filtered data [Figure 2]. Also, decreasing activations in ventricles was found in denoised data compared to temporal filtered data [Figure 3]. Furthermore, more accurate and specific activation maps were obtained after denoising than filtering [Figure 4].
Two level binary classifications, C1 and C2, based on the features of each component were performed to divide components into artifact/noise and resting state component (RSC) group using Ncuts.
The histogram of the partial correlation coefficient of the experimental resting fMRI datasets.
Result of GLM with posterior cingulate cortex (PCC) as seed using the experimantal resting fMRI datasets. Activation map was thresholded with corrected p<0.05. FEW: Familywise error.
The changes of Z score of the activation maps using group ICA (GICA). DN: denoising; BPF: band-pass filtering
Conclusions: Our objective and automatic denoising offers a potentially useful approach to eliminate the sources of noise and consequently improve the contrast of statistical analysis and the strength of functional connectivity.
Applications: Psychology
González-RoldánA.M.1SitgesC.1CifreI.1BornasX.1MontoyaP.1
Research Institute on Health Sciences - IUNICS, Psychology, Palma de Mallorca, Spain
Altered dynamic of EEG oscillations in chronic pain patients at rest
Pain processing is associated with the activation of a widespread network including several brain regions such as insula, anterior cingulate cortex, and prefrontal cortex. Previous fMRI findings have shown that chronic pain patients display an altered activation and functional connectivity of this brain network even when subjects are at rest. The aim of the present study was to analyze several parameters of EEG dynamics in chronic pain patients (n=20) and healthy controls (n=18) at rest. Spectral power density, source current density (sLORETA), and intra- and inter-hemmispheric coherence were analyzed from 64 EEG channels during 5 minutes with eyes-closed. Results indicated that chronic pain patients displayed reduced power density of the deltaEEGband (1–4 Hz), whose source generators were located in right insula, right superior and middle temporal gyri as compared with healthy controls.Chronic pain patients also exhibited greater power density than healthy controls in two segments of the beta EEG band (17–21 Hz and 23–30 Hz), whose source generators were located in right middle frontal lobe and anterior cingulate gyrus. Chronic pain patients also displayed greater intra-hemispheric coherence at the left than at the right centro-parietal electrodes for delta and beta3 (23–30 Hz) EEG band, whereas the opposite effect was observed in healthy controls. All these findings add further support for the existence of an altered dynamic of brain activity at rest in chronic pain patients as it has been already revealed by fMRI studies in brain regions related to pain processing. Moreover, our findings provide further support for the feasibility of resting-state EEG analyses in the clinical characterization of chronic pain states.
Applications: Neurology
Ovadia-CaroS.123MarguliesD.12VillringerK.4JungehülsingG.J.4Van der MeerE.13VillringerA.124
Humboldt University, Berlin School of Mind and Brain, Mind and Brain Institute, Berlin, Germany
Max Planck Institute for Human Cognitive and Brain Sciences, Leipzig, Germany
Humboldt University, Institute of Psychology, Berlin, Germany
Charité University, Center for Stroke Research, Berlin, Germany
Dynamics of functional connectivity following lacunar stroke
Background: Stroke has been shown to alter functional connectivity even in areas that are structurally intact and far from the lesion site. This phenomenon has been demonstrated in several networks, such as the motor and attention networks. However, in order to address this effect on a general stroke population, characterized by heterogeneous lesions, a more global, whole brain approach is needed.
Objective: Our aim was to test the longitudinal effect of lacunar stroke on functional networks in heterogeneous stroke population. Specifically, we hypothesized that lesions located in a specific network will cause a functional change restricted to the affected network.
Methods: 16 patients (age 65.75±11.7 years) following lacunar ischemic strokes were included in the analysis. Longitudinal resting-state fMRI scans were acquired at three consecutive time points (day 1, 7, and 90 post stroke). Lesion location was determined based on diffusion weighted imaging and/or FLAIR. Standard resting-state preprocessing was applied including global signal regression and band-pass filtering (0.01–0.1Hz). Lesions were mapped into affected/unaffected networks based on individual drawing of the lesions area and a template of eight independent networks previously computed in healthy controls (N=10) by Beckmann et al., 2005. In order to assess the stability of the functional networks over time for each individual, we used dual regression based on the same templates. Correlation concordance coefficient was used to determine spatial similarity over the time points.
Results: We found that networks containing lesions demonstrated decreased concordance over time as compared to unaffected networks (p<0.05). A change in the spatial patterns of the network was reflected in lower concordance over time. The change in the patterns of functional connectivity was significantly related to networks containing lesions, thus reflecting the fact that the longitudinal change is more pronounced in affected networks.Conclusions: We suggest that these processes are related to the clinical well-known phenomenon of diaschisis and are limited by the functional architecture of spatially independent networks in the brain.
Data Analysis
MeyerM.C.1van OortE.S.B.12BarthM.13
Radboud University Nijmegen - Donders Institute for Brain, Cognition and Behaviour, Nijmegen, Netherlands
University of Twente - MIRA Institute for Biomedical Technology and Technical Medicine, Twente, Netherlands
University Duisburg-Essen - Erwin L. Hahn Institute for Magnetic Resonance Imaging, Essen, Netherlands
Correlated electrophysiological frequency patterns of resting state networks in concurrent EEG-fMRI.
In this study we investigated the relationship of RSNs and their Electrophysiological Correlation Patterns (ECPs) using a long resting state scan per subject. This allowed us to study ECPs on group as well as on single subject level, and to examine the temporal stability of ECPs within each subject.
Resting state data (34 minutes, eyes open) of 12 healthy subjects were acquired on a 3T Siemens scanner (32 channel head coil using a multi-echo EPI sequence: TR=2000 ms, five echoes, 3.5 mm isotropic voxels). Simultaneously EEG data were recorded with a 32 channel cap (ANT), using a BrainAmp amplifier. After standard preprocessing, group independent component analysis (ICA) was performed on the fMRI data to obtain 30 ICs. A dual regression approach was used to derive subject specific RSN maps and time courses. The EEG signal (preprocessed using Analyzer2) was split into 2s segments corresponding to the TR used. For every segment the mean frequency power over all channels for four frequency bands (δ: (2–4)Hz, θ: (4–7)Hz, α: (8–12)Hz, β: (12–30)Hz) was calculated, resulting in one time series for each frequency band. These were convolved with a hemodynamic response function (HRF) and correlated with the RSN time courses taking into account common variance (partial correlation). ECPs were calculated for each subject and averaged for group analysis (Fig 1). Additionally, each data set was split in to five subsets and corresponding ECPs were calculated (Fig 3).
RSNs at group level shows 11 group fMRI RSNs as maximum intensity projection on the central slices and their groups ECPs, representing the average Z scores (12 subjects) for the four EEG frequency bands. Only clusters larger than 15 voxels were plotted. The large standard errors indicate the large variability of the subject-specific ECPs.
We found reproducible RSNs across subjects and significant correlations with EEG in four of the twelve analysed subjects, three of them showed negative alpha correlation with visual RSNs which is in good agreement with previous findings (Fig 2). However, we also observed large inter-subject variability in the ECPs. Besides a clear inter-individual difference in EEG patterns, we found temporal variability of the ECPs within a subject, which could be caused by the temporal dynamics of the RSNs. Due to volume conduction several RSNs contribute to the actual EEG on scalp level so that fluctuations of RSNs result in temporally unstable ECPs. An alternative explanation would be that the different RSNs do not have a specific ECP, but that different states of one RSN lead to different ECPs. In any case it explains a part of the observed inter-subject variability in the ECPs.
RSN2: Occipial pole component at subject level depicts RSN 2 (one of three occipital components) after dual regression on single subject level as maximum intensity projection on the central slices and the subject specific ECPs for all 12 subjects, showing the high inter-subject variability of the ECPs but also significant negative alpha correlation in subject 1, subject 4 and subject 8.
RSN2: split into 5 parts for every subject shows the ECPs of RSN 2 (occipital pole component) for all five parts of the split datasets for all 12 subjects. The ECPs show higher Z scores at these shorter time intervals and the pattern change over time.
Applications: Psychology
ServaasM.1RieseH.2RenkenR.1MarsmanJ.-B.1OrmelJ.2AlemanA.1
Neuroimaging Center Groningen, University of Groningen/University Medical Center Groningen, Cognitive Neuropsychiatry, Groningen, Netherlands
Interdisciplinary Center of Pathology of Emotion, University of Groningen/University Medical Center Groningen, Groningen, Netherlands
Cluster analysis of functional connectivity patterns related to criticism
Neuroticism is an established risk factor for psychopathology, specifically affective disorders (Lahey, et al., 2009). A recurrent finding in fMRI research on neuroticism is the heightened emotional reactivity to especially negative events (Canli, 2008). Furthermore, neurotic individuals tend to be more self critical (Clara, et al., 2001) and for this reason, we expect them to be more sensitive to criticism.
We used a novel resting-state paradigm to investigate the effect of criticism on functional brain connectivity and associations with neuroticism. We selected brain regions associated with self-reflective processing and stress regulation as regions of interest. First, forty-eight participants completed the NEO-PI-R (NEO Personality Inventory Revised) to assess neuroticism. Next, we recorded resting-state functional MRI during two sessions. We manipulated the second session before scanning by presenting three standardized critical remarks through headphones, in which the subject was urged to please lay still in the scanner. A seed-based functional connectivity method was used to calculate a voxel-wise correlation with the extracted time-series of our regions of interest. In addition, cluster analysis was performed to examine whether functional connectivity patterns related to the selected seed regions would cluster together into separate modules of neural processing.
The findings robustly showed extensive reductions in functional connectivity in three clusters, related to self-reflection, episodic memory and social-emotional processing. Furthermore, we found that women with higher scores on neuroticism showed enhanced functional coupling of emotion-related brain areas in response to criticism.
The results suggest that the brain operated less cohesively during a situation of negative social evaluative threat, compromising abovementioned processes (Buckner, et al., 2008; Liston, et al., 2009; Olson, et al., 2007; Vanhaudenhuyse, et al., 2010). Furthermore, we found that women with higher scores on neuroticism reacted more emotionally to the critical remarks. This may help explain why especially neurotic women are more prone to develop affective disorders (Medford and Critchley, 2010; Olsen, et al., 2007).
Universidad Nacional Autónoma de México, Instituto de Neurobiología, Querétaro, Mexico
Hemispheric asymmetries of the Default Mode Network in children
Resting state networks (RSN) are brain regions presenting strong temporal coherence in low frequency fluctuations of the BOLD signal, and have been widely described. One of these networks is the Default Mode Network (DMN) (Raichle et al. 2001), which includes the prefrontal (PFG), anterior (ACG), and posterior cingulate (PCG), the lateral parietal (LPG), and inferior/middle temporal gyri (MTG), the precuneus, thalamic nuclei, and regions extending to the medial temporal lobe (Boly et al. 2008), nevertheless little is known about hemispheric asymmetry. Recent studies in adult subjects have shown lateralization (Saenger et al. 2012). We investigated such hemispheric asymmetries in children's DMN.
50 healthy children (28 female, age range 7–9) participated after their parents informed signed consent. Imaging was done in a G.E. Discovery MR750 3.0T with a 32 channel head coil, using an EPI sequence with TR/TE=2000/40 ms, in 4×4×4 mm3 spatial resolution. The data were analyzed using FSL's MELODIC module (V 4.1.3, Smith et al. 2004). Standart preprocessing was done with registration to an age-appropriate atlas (Fonov et al. 2011). Data was temporally concatenated in a single 4D data set and decomposed into resting state patterns of functional connectivity using ICA. The DMN was identified from previous studies. Each DMN map was flipped in the L-R direction, to determine functional laterality a paired two-sample t-tests with randomized permutation methods between the flipped and un-flipped was made (Saenger et al. 2012).
The medial frontal gyrus (medFG), PCG, cingulate gyrus (CG), angular gyrus (AG) as well as the precuneus, LPG, and MTG were identified as part of the children's DMN. Greater functional connectivity in the left hemisphere (leftward asymmetries) was observed and comprise the PCG, CG, and precuneus. These results suggest that functional connectivity in children's DMN is not equally distributed between hemispheres.
The Default Mode Network for children is shown in blue. Common hemispheric asymmetries of functional connectivity are shown in red-yellow, greater leftward connectivity is in the left hemisphere.
References
BolyMet al.2008. Ann N Y Acad Sci, 1129:119–129.a-426FonovFVet al.2011. NeuroImage, 54:313–327.a-428RaichleMEet al.2001. Proc Nat Acad Sci USA, 98:676–682.a-425Saengeret al.2012. Neuropsychologiain press.a-427a-429
Data Analysis
JanssenR.J.1MeyerM.C.1BarthM.12
Radboud University Nijmegen, Donders Institute for Brain, Cognition and Behaviour, MR-Methods for Cognitive Neuroscience, Nijmegen, Netherlands
University Duisburg-Essen - Erwin L. Hahn Institute for Magnetic Resonance Imaging, Essen, Netherlands
A framework to estimate electrophysiological dynamics of fMRI derived sources
Combined electroencephalography (EEG)/functional magnetic resonance imaging (fMRI) provides a way to study the brain with high spatio-temporal resolution. Combined analysis is not straightforward, however, due to the unclear relationship between EEG and fMRI. This can be examined by treating one modality as an independent and the other as dependent variable.
Approaches using EEG as independent variable show large inter-subject variation. We propose a novel, fMRI driven approach, i.e. defining putative EEG sources based on fMRI analysis. We tested this model on a combined EEG/fMRI recording of visual evoked responses for two subjects (checkerboard wedge, 17 ms duration; 240 trials).
EEG from 62 scalp positions (international 10–10 system) and an electro-oculogram were recorded. EEG preprocessing was done in BrainVision Analyzer2. Functional imaging was performed using a gradient echo Echo Planar Imaging sequence (repetition time, 1400 ms; echo time, 30 ms; voxel size, 3.5 mm isotropic). Functional images were preprocessed and analysed using FSL. A T1-weighted data set was acquired using an MPRAGE sequence to obtain the structural information.
Sources were defined from the thresholded Z-statistic fMRI activation map. The orientation for each dipole was determined by the adjacent surface normal of the corresponding cortical orientation. Scalp representations (SRs) of these sources were computed using the Boundary Elements Method approach incorporating a 4-layer headmodel with realistic surfaces based on the subject's structural scan. SRs were subsequently fitted to each timepoint in the visual evoked potential (VEP).
SRs of three fMRI clusters common to both subjects illustrate the individual differences in scalp representation of these sources. Moreover, fitting these representations to VEPs suggests that activity can at least partly be attributed to the regions represented in these clusters.
We conclude that fMRI driven integration of EEG and fMRI data accounts for individual differences in anatomy affecting EEG and that it is capable of explaining variance in the EEG. Moreover, we believe that this approach can also be applied to resting state recordings.
Common fMRI clusters (A and C) and corresponding SRs (B and D).
Beta values over time for linearly fitted SRs.
Applications: Psychology
KoenigK.1BeallE.1LinJ.1MathewB.1StoneL.2BermelR.2RaoS.2TrappB.3PhillipsM.1LoweM.1
The Cleveland Clinic, Imaging Institute, Cleveland, United States
The Cleveland Clinic, Neurological Institute, Cleveland, United States
The Cleveland Clinic, Neurosciences, Cleveland, United States
Increased connectivity to rostral prefrontal cortex is correlated with poor task performance in Multiple Sclerosis
Introduction: A common symptom in the demyelinating disorder Multiple Sclerosis (MS) is loss of cognitive abilities [1]. The mechanisms by which some patients experience cognitive decline and others do not is still unclear. Several studies have pointed to stronger task-related activation in MS patients as evidence of a compensatory mechanism [2,3]. Recently, it has been suggested that differences in resting state functional connectivity MRI (fcMRI) in MS may also be related to compensatory mechanisms [4]. The current study compares resting state fcMRI of the left dorsal lateral prefrontal cortex (DLPFC) in MS and controls.
Methods: 47 MS patients (mean age 43.13 (9.16), mean EDSS 2.45, 13 male) and 24 healthy controls (mean age 40 (9.11), 9 male) were scanned in an IRB-approved protocol at 3T using a bitebar to reduce head motion, in a 12-ch receive head coil. Scans included T1-MPRAGE and a resting connectivity fcMRI scan. A subset of 10 MS subjects and 10 controls performed a verbal memory retrieval task as described in [5]. Student's t-maps were averaged and the left DLPFC voxel with the highest average activation was taken as the center of a nine-voxel in-plane ROI (Figure 1). A one-way ANOVA between patient and control student's t-maps revealed a significant difference in activation level in right BA 10 (Figure 1). The left DLPFC ROI was used to seed individual whole-brain correlation fcMRI maps as described in [5]. Correlations of low-pass filtered reference timeseries were converted to z-scores. fcMRI measures between the left DLPFC and right BA 10 were compared with cognitive scores in patients and controls.
Results and Discussion: In patients, connectivity strength from the left DLPFC to the right rostral prefrontal cortex was inversely correlated with performance on the PASAT (r=−0.629, p=0.000003), SDMT (r=−0.479, p=0.0006), and CO-WAT (r=−0.475, p=0.0008) (Figure 2).
The inverse correlation suggests that an increase in functional connectivity may not always be advantageous. It is possible that individuals with MS experience abnormal increases in connectivity related to compensatory mechanisms.
A. Right rostral prefrontal cortex and B. left DLPFC ROIs.
Correlations between left DLPFC to right rostral prefrontal cortex fcMRI and SDMT, PASAT, and CO-WAT.
JiG.1ZhangZ.2ZhangH.3WangJ.3LiuD.3LiaoW.3LuG.2ZangY.13
Beijing Nomal University, National Key Laboratory of Cognitive Neuroscience and Learning, Beijing, China
Jinling Hospital, Nanjing University School of Medicine, Department of Medical Imaging, Nanjing, China
Affiliated Hospital, Hangzhou Normal University, Center for Cognition and Brain Disorders, Hangzhou, China
Abnormal Causal Effect Between Cortical and Subcortical Regions in Mesial Temporal Lobe Epilepsy: A Resting-State fMRI Study
Question: To investigate causal effect between the epileptic focus and subcortical structures in patients with mesial temporal lobe epilepsy (mTLE).
Methods: Twenty-three left mTLE patients and 23 sex/age-matched controls underwent a 500s-RS-fMRI scanning (TR=2s). We compared the differences of amplitude of low frequency fluctuation (ALFF) between the two groups in the whole brain. Peak voxel within the left mesial temporal lobe (mTL) mask (from AAL template) was selected as a seed for the following coefficient-based Granger causality analysis (GCA). We conducted both mTL-to-others and others-to-mTL bivariate GCA. The one-sample t-tests maps of each group (p(p<0.05 AlphSim corrected) were combined and taken as a mask for the following two-sample t-tests between groups.
Results: Increased ALFF was found in left mTL in patients, with peak voxel at MNI (−21, −15, −30) (Fig. 1). Compared to controls, we found abnormal mTL-to-others and others-to-mTL effects in widespread cortical and subcortical regions in patients (Fig. 2). Both the positive effect from mTL to subcortical (Fig. 3) and negative effect from subcortical to mTL (Fig. 4) in controls disappeared in patients.
Regions showing abnormal ALFF in patients (p<0.05, AlphSim corrected). Warm color indicates higher ALFF in patients than controls. The crosshair shows the peak voxel within left mTL.
Regions showing abnormal casual effects with mTL. Altered mTL-to-othres (a), and others-to-mTL (b) of patients compared to controls (p<0.001, AlphSim corrected).
Mean causal effect of the peak voxel in subcortical regions between patients and controls. Asterisk indicates the causal effect is significantly different from zero in corresponding group (p<0.05).
Mean causal effect of the peak voxel in subcortical regions between patients and controls. Asterisk indicates the causal effect is significantly different from zero in corresponding group (p<0.05).
Conclusions: The increased ALFF in mTL may indicate increased spontaneous activity in the epileptic focus. The decreased inhibitory effect from subcortical structures to the epileptic focus may play a pathological role in mTLE.
Data Analysis
Ponce-álvarezA.1LechónM.1GriffaA.2HagmannP.2DecoG.1
Universitat Pompeu Fabra, Theoretical and Computational Neuroscience, Barcelona, Spain
Lausanne University Hospital, Department of Radiology, Laussane, Switzerland
How anatomical connectivity determines the spatiotemporal patterns of ongoing cortical activity at rest.
As in the spontaneous activity of local networks, the large-scale ongoing activity of the brain at rest is astonishingly highly structured into spatiotemporal patterns (STPs) (Arieli et al., 1995; Kenet et al., 2003; Biswal et al., 1195; Fransson et al., 2005; Fox et al., 2007). How and to which extent such patterned activity emerges from the anatomical connectivity remains an open question. To address this issue, we need to consider analysis techniques to characterize the STPs and theoretical models that enable us to study the link between anatomical structure and resting-state dynamics. We tackled this problem by studying large-scale networks of spiking neurons, whose connection are constrained by DTI/DSI-derived human neuroanatomical connectivity matrices (Deco and Jirsa, 2012). To validate the models we compared the simulated STP to the ones observed in empirical fMRI BOLD signals. We analyzed the data using both the Projection Pursuit Method (PPM) and Hidden Markov Models (HMMs). The HMM clusters the data in a predetermined number of states which represent the multivariate distribution of the BOLD signals. The states are linked by a state transition probability matrix. Importantly, the distributions and the transition matrix are estimated from the data, via a expectation-maximization (EM) algorithm. HMM has several advantages: i) it detects the moments of transitions between states; ii) it is a probabilistic model that allows to treat noisy systems, possibly emerging from stochastic dynamics; iii) it allows a direct study of dynamic changes in first (mean) and second order statistics (variances and correlations). In addition, PPM is able to find low-dimensional subspaces maximizing the multimodality of the fMRI time series. We compared the patterns and their statistics (such as state lifetime distributions) in both empirical and simulated data from the spiking network in order to get further insight about the dynamic working point of the brain during rest. Specifically, we studied the STPs in two different dynamical regimes: when the network's activity fluctuates around a stable fixed point and when it undergoes noisy excursions among multiple metastable attractors.
Universidad Complutense, Madrid, Spain
Ayuntamiento, Madrid, Spain
Hospital Clínico San Carlos, Madrid, Spain
The connectivity patterns of the Default Mode Network. A MEG study in Mild Cognitive Impairment
The default mode network (DMN) has received growing attention in recent years because it seems to be involved in the neuropathology of psychiatric and neurodegenerative disorders such as autism, schizophrenia and Alzheimer Disease. It has been defined as a task negative network, because the activity of all its brain regions is increased during the resting state and suspended during external or goal directed tasks.
The DMN is particularly relevant for aging and dementia since its structures are vulnerable to atrophy, deposition of the amyloid protein and show reduced glucose metabolism. Several functional studies have found that the task-induced deactivation pattern and its functional connectivity are progressively decreased along the continuum from normal aging to Mild Cognitive Impairment (MCI) and to clinical Alzheimer Disease (AD). In order to provide more information about the connectivity changes in the DMN in normal and pathological aging, we have used the magnetoencephalography (MEG) with 40 healthy people and 70 mild cognitive impairment (MCI) subjects (35 with amnestic MCI, 35 with multidomain MCI) comparing a resting state condition with eyes closed with a mental arithmetic task with two levels of difficulty. Additionally an extensive neuropsychological battery has been applied to all subjects in order to assess their cognitive state. To analyze the connectivity we have applied different methods as Mutual Information (MI), Phase locking value (PLV) and Phase locking index (PLI). Our results are in line with previous studies, finding differences in connectivity and task- induced deactivation, depending on the difficulty of the task, although with differences between the MCI and the control group, suggesting that the alteration of the DMN could be considered as an early marker of AD pathology.
University Hospital Lübeck, Neurology, Lübeck, Germany
International Neuroscience Institute (INI), Hannover, Germany
Abnormal Brain Networks in Parkinson's Disease
We used a graph theoretical approach to investigate properties of human brain networks in individuals with idiopathic Parkinson's disease (PD; n=40) compared to age- and gender-matched healthy controls (n=21). A second, independent data set with 15 PD patients and 14 healthy controls was used to replicate results found in the main data set. Brain networks were derived from resting-state fMRI functional connectivity between 90 cortical and subcortical regions. The clustering coefficient was computed to characterize the brain network on a local level, whereas the mean clustering coefficient and the characteristic path length were used to characterize the brain network on a global level. The clustering coefficient Ci of a node i is defined as the fraction of a node's neighbors which are neighbors of each other. The characteristic path length L is defined as the average shortest path length in the network. While the mean clustering coefficient is a measure for the segregation of the network, the characteristic path length is a measure for the global integration and thus the efficiency of the network. On a global level, we found a significantly higher mean clustering and a significantly higher characteristic path length for patients compared to controls. This indicates a less efficiently organized brain network for individuals suffering from PD. The higher mean clustering coefficient mainly originated from higher clustering coefficients found in sub-cortical structures, including the putamen and thalamus, and in the occipital lobe. We replicated the significantly higher local clustering in the occipital lobe with the second independent sample. The increased clustering coefficient observed for the right thalamus was found to result from increased functional connectivity between brain regions involved in motor control, i.e. thalamus, pallidum, dorsal cingulate cortex and the SMA. The results suggest that graph metrics can be used to characterize altered functional brain networks in Parkinson's disease. More research is needed to better understand functional and clinical correlates of the identified network topology changes.
Data Analysis
TobiaM.1
University Medical Center, Hamburg-Eppendorf, Systems Neuroscience, Hamburg, Germany
Long-Range Temporal Pattern Repetition of the BOLD Signal During Resting State
Question: Examining the temporal characteristics of the BOLD signal may elucidate the dynamic correlation structure of spontaneous fluctuations. The objective of this investigation was to assess the complexity of the BOLD signal during resting state using sample entropy. Sample entropy quantifies the complexity of a physiological time series by computing the inverse log probability of observing repeating segments (m) of similar states constrained by a tolerance threshold (r).
Method: High temporal resolution resting state fMRI data (TR=645 ms) were acquired from the NKI Enhanced Rockland test-retest database. Data from 17 healthy (4 female) participants (21–57 years) were included. EPI data were aligned and smoothed (6 mm FWHM). Nuisance variance associated with white matter and CSF signals, and head movement was removed with linear regression. Time series were bandpass filtered (.008–.2 Hz) and the signal was standardized. Sample entropy was computed with parameters: m=2 and r=.15.
Results: Sample entropy values ranged from .74 to 1.83 within and across participants. There was a mean global sample entropy value of 1.34 (SD=.17). Global sample entropy values were not significantly correlated with age. The spatial distribution of group averaged sample entropy for the cortical surface shows that sensory-motor systems (posterior) have greater regularity and that complementary cognitive systems (anterior) show greater complexity. A similar spatial pattern was observed for all participants. Sample entropy was strongly inversely correlated with the intrinsic BOLD AR1 process. However, for all participants, sample entropy of surrogate time series matched for AR1 coefficients was significantly greater than actual complexity. This suggests that pattern repetition induces long-range order in the resting BOLD signal that cannot be explained by short-range autocorrelation. Sample entropy computed at higher bandwidths of the BOLD signal was significantly greater and near uniformly distributed at an asymptotic value (approximately 2.4), and had weak AR1 coefficients, resembling a random signal.
Consulusion: Spontaneous brain networks are comprised of voxels whose signals are non-random and yet vary in the complexity of long-range structure and pattern repetition, which may play a role in the dynamic reconfiguration of network connectivity.
Center for Biomedical Technology, Laboratory of Cognitive and Computational Neuroscience., Madrid, Spain
Servicio de Neurología. HUSC, Madrid, Spain
Servicio de Geriatría. HUSC, Madrid, Spain
Universidad Complutense, Madrid, Spain
Resting state functional connectivity patterns. A MEG study in Amnesic Mild Cognitive Impairment and Multidomain Mild Cognitive Impairment.
Alteration of brain communication due to abnormal patterns of synchronization is nowadays one of the most suitable mechanisms for having a better understanding of brain pathologies. Very recently, it has been proved that abnormal changes in both local and long range functional interactions underlie the cognitive deficits associated with different brain disorders. Mild cognitive impairment (MCI) is a state characterized for cognitive dysfunction, such as the memory. The study of the spatial and dynamic alterations in MCI subjects' functional networks could provide important evidences of the brain mechanisms responsible for such impairment.
Here we use magnetoencephalography (MEG) to record resting state activity of healthy elderly people and patients with MCI, with both eyes closed and eyes open. Additionally, the subjects had a neuropsychological test done to determine their MCI subtype. Our database consists in 30 healthy elderly people and 60 MCI patients (30 with amnestic type and 30 with multidomain type). In order to provide a functional connectivity pattern, we calculate the Mutual Information and Phase Locking Value of the MEG time series. The analysis is done for the classical frequency bands, via a statistical test to search for differences between groups with different diagnosis.
Our result shows an increased connectivity in DCL when compared with Control and an increased connectivity in DCLa when compared with MCIm.
JARA Juelich Research Alliance, Juelich, Germany
Research Centre Juelich, Institute of Neuroscience and Medicine INM-4, Juelich, Germany
University Muenster, Neurology, Muenster, Germany
Disturbed fronto-striato-thalamic resting state connectivity in Huntington's Disease
Questions: There has been a significant surge in resting state functional magnetic resonance imaging (rs-fMRI) in clinical settings, recently. In particular, notable changes in resting state functional connectivity (rs-fc) in neurological and psychiatric disorders have been identified (Fox et al., Front Sys Neurosci 2010). However, there are no data on rs-fc in symptomatic Huntington's Disease (HD), a lethal, but until now untreatable neuropsychiatric disorder.
Methods: We examined 17 genetically confirmed symptomatic HD patients (age 45+/−10y, 7m) and 19 age- and sex-matched controls (age 47+/−10y, 8m) in an rs-fMRI paradigm at 3 Tesla using a Siemens Trio MRI (TR 2.2s, 270 volumes). Data were analysed by temporal concatenation ICA followed by Dual Regression, corrected for age and atrophy by including VBM data as a confound (Beckmann et al., Phil Trans Royal Soc 2005, Zuo XN et al., Neuroimage 2010).
Results: 30 common rs-fMRI components were identified by ICA. Of these, 25 were affected by the disease. In particular, caudate nucleus, thalamus and prefrontal/frontal/motor areas were altered significantly (p=0.001 TFCE corrected). Parietal maps were affected to a lesser degree (0.01
Conclusions: Our data demonstrate a severe disturbance of rs-fc in HD, independently of atrophy-related changes with an emphasis on fronto-striato-thalamic networks. Further studies will focus on prognostic value and correlations with functional markers.
Nathan S. Kline Institute for Psychiatric Research, Orangeburg, United States
Phyllis Green and Randolph Cowen Institute for Pediatric Neuroscience, New York, United States
Center For the Developing Brain, Child Mind Institute, New York, United States
McGovern Institute for Brain Research, Cambridge, United States
Johns Hopkins University, Applied Mathematics and Statistics, Baltimore, United States
Johns Hopkins University, Department of Computer Science, Baltimore, United States
Virginia Tech Carilion Research Institute, Roanoke, United States
Donders Institute for Brain, Cognition and Behaviour Functional Brain Imaging, nijmegen, Netherlands
Towards Automated Analysis of Connectomes: The Configurable Pipeline for the Analysis of Connectomes (C-PAC)
Once a distant goal, discovery science for the human connectome is now a reality. Researchers who previously struggled to obtain neuroimaging data from 20–30 participants are now exploring the functional connectome using data acquired from thousands of participants, made publicly available through the 1000 Functional Connectomes Project and its International Neuroimaging Data-sharing Initiative (INDI). Beyond access to data, scientists need access to appropriate tools to facilitate data exploration - particularly those who are inexperienced with the nuances of fMRI image analysis, or lack the programming support necessary for handling and analyzing large-scale datasets.
Here, we announce the creation of the Configurable Pipeline for the Analysis of Connectomes (C-PAC) - a configurable, open-source, Nipype-based, automated processing pipeline for resting state fMRI (R-fMRI) data, for use by both novices and experts. C-PAC brings the power, flexibility and elegance of Nipype to users in a plug-and-play fashion - without any programming. Using an easy to read, text-editable configuration file, C-PAC users can rapidly orchestrate automated procedures central to R-fMRI analyses, including:
• quality assurance measurements
• standard image-preprocessing based upon user specified preferences
• generation of connectome graphs at various scales (e.g., voxel, parcellation unit)
• generation of local R-fMRI measures (e.g. regional homogeneity, voxel-match homotopic connectivity, frequency amplitudes)
C-PAC makes it possible to use a single configuration file to launch a product set of pipelines that differ with respect to specific parameters in each set (e.g., spatial/temporal filter setting, global correction strategies, motion correction strategies) though conserve computational and storage resources. Additionally, C-PAC can handle any systematic directory organization and distributed processing via Nipype. C-PAC maintains key Nipype strengths, including the ability to (i)interface with different software packages (e.g., FSL, AFNI), (ii)protect against redundant computation and/or storage. The C-PAC beta-release will be distributed via INDI in the summer 2012. Future updates will include a graphical user interface, advanced analytic features (e.g. support vector machines, cluster analysis) and diffusion tensor imaging.
Applications: Psychology
WojtowiczM.1MazerolleE.1FiskJ.D.2
Dalhousie University, Department of Psychology and Neuroscience, Halifax, Canada
Dalhousie University, Psychiatry, Halifax, Canada
Resting State Connectivity in the Default Mode Network is related to Performance Variability in Multiple Sclerosis
Patients with Multiple Sclerosis (MS) demonstrate slower and more variable performance on attention and information processing speed tasks. High within-subject variability in performance is associated with poorer cognitive functioning and neurologic status in a variety of neurodegenerative populations. Within-subject variability has also been associated with alterations in default mode connectivity in healthy young and older adults. This study investigated potential changes in default mode connectivity associated with performance variability in MS.Methods: Relapsing-remitting MS patients and matched healthy controls completed test of information processing speed and resting-state fMRI scans. Within-subject variability in reaction time performance was calculated from tests of simple reaction time (SRT), choice reaction time (CRT), and semantic search reaction time (SSRT). Functional connectivity in the default mode network (DMN) was investigated with seed-based analyses using anterior (i.e. anterior cingulate/medial frontal gyri) and posterior seeds (i.e. posterior cingulate gyrus). The effects of within-subject variability on connectivity in the DMN were also evaluated.Results:MS patients demonstrated greater within-subject variability on the SRT and SSRT cognitive tasks compared to healthy controls (SRT:F(1, 32)=4.22,p=.048; SSRT:F(1, 32)=4.25,p=.047). The DMNs were similar for the anterior and posterior seeds (Figures 1 and 2). For MS patients, lower within-subject variability (i.e. greater stability) on the SSRT task was associated with greater resting state connectivity in the frontal pole when the anterior seed was used (Figure 3). This relationship was not found using the posterior seed. These findings suggest that among patients with MS, greater frontal pole connectivity at rest may be associated with greater performance stability on complex speed-dependent information processing tasks.
Functional connectivity in all subjects associated with anterior seed.
Functional connectivity in all subjects associated with posterior seed.
In MS patients, greater functional connectivity between the anterior seed and the frontal pole was associated with lower within-subject variability on a semantic search reaction time task.
Applications: Neurology
JesserJ.1LäerL.2BirbaumerN.2GharabaghiA.1
Universitätsklinikum, Klinik für Neurochirurgie, Tübingen, Germany
Universität, Institut für Medizinische Psychologie und Verhaltensneurobiologie, Tübingen, Germany
Evidence for altered connectivity patterns in undamaged brain regions of chronic stroke patients, a resting state fMRI study
Objective: Stroke patients undergo neuroplastic changes of functional brain connections [1]. In our study we examined network changes of undamaged brain regions in a group of chronic stroke patients.
Materials/Methods: 48 chronic stroke patients and 18 control subjects were included in the study. The patients suffered from a subcortical or cortical infarction at least 6 months ago and did not recover from a substantial loss of finger extension in the stroke affected hand. BOLD-EPI time-series were recorded at 3T. After preprocessing images were parcellated into 71 regions using automated anatomical labeling, including brain regions contralateral to the stroke lesion and the cerebellum. The correlation matrices obtained from each control subject and patient were tested for differences. Graph theoretical analysis was conducted on a network of regions showing significant correlations in the healthy volunteer and the patients' matrix[2,3]. Data processing and analysis was performed in Matlab, SPM 8, REST and BCT (Brain connectivity toolbox).
Results: Several pairs of regions showed significantly lower correlations in patients than in healthy controls. Most significant connections were altered from intrahemispheric cingulate gyrus to the cerebellum and striato-, thalamocerebellar connections. Graph analysis showed a higher characteristic path length and a higher average clustering coefficient in the patient group. This provides evidence for the loss of small world topology in chronic stroke patients' brain networks.
Discussion: Our results show that neuroplastic changes occur in brain regions remote from the focal infarct lesion resulting in an altered network organization in stroke patients. The altered cortico-, striato- and thalamocerebellar connections are likely to reflect a secondary modulation of existing pathways. In a following analysis we will investigate how these findings relate to individual motor outcome and stroke rehabilitation capacity.
FonteijnH.12NorrisD.2
Max Planck Institute for Psycholinguistics, Nijmegen, Netherlands
The Donders Institute for Brain, Cognition and Behaviour, Nijmegen, Netherlands
On the temporal stability of whole-brain parcellations of resting-state fMRI data.
Resting-state fMRI (rs-fMRI) has led to new insights into brain organization by parcellating the brain into networks and, more recently, into individual brain regions. However, parcellations at the individual subject level could be affected by the non-stationary nature of the rs-fMRI signal, leading to low within-subject reproducibility. Here, we use the Normalized cuts (Ncuts) algorithm and a sliding-window approach to investigate the effect of its parameters on within-subject consistency. We also study the effect of window size (tw).
We randomly selected 12 subjects from a database of 75 subjects. For each subject, a T1 image was acquired and a rs-fMRI data set, using a multi-echo EPI sequence with 5 echoes (TE=6.9, 16.2, 25, 35 and 44 ms), flip angle 80°, TR=2000 ms, 1030 volumes, in-plane resolution 3.5×3.5 mm, slice thickness 3 mm with a 0.5 mm slice gap, GRAPPA factor 3. We segmented each subject's T1 image and used the grey matter (excluding the cerebellum) as a mask for subsequent analyses. We formed nuisance regressors by combining the first 10 principal components of the first 3 spatially concatenated echoes with the subject's motion parameters.
In the first analysis, we created 13 data sets by shifting a time windows (tw=256) in steps of 64 time points over the complete data set. The Ncuts algorithm uses a similarity metric wi,j, which is based on the functional distance between voxelsIandj and a weighting factor σ. The similarity matrix W is filtered to only retain each voxel'sknearest neighbours (in terms of temporal similarity). We parcellate each window using k=[50, 400, 800], σ=[0.5, 1, 2] and the number of parcels N=[10, 50, 75]. In the second analysis, we varied tw=[64, 128, 256, 384] and fixed the other parameters to k=800, σ=1 and N=10.
Figure 1 shows that kand σ only have moderate effect on within-subject consistency. At N=10, the default mode network does not include the medial frontal cortex for k=50, but it does for k=800. The parcellations at high Nshow somewhat decreased consistency. Figure 2 shows that even at tw=64, the DMN shows high within-subject consistency. This is however not true for the dorsal visual stream network, which only stabilizes at tw=128. In conclusion, we have shown that rs-fMRI parcellations have moderate to high within-subject consistency for a wide range of parameter settings.
University of Bonn, Center for Economics and Neuorscience, Bonn, Germany
University of Bonn, Life and Brain Center, Bonn, Germany
University Clinics Bonn, Epileptology, Bonn, Germany
Assessing the function of the fronto-parietal attention network: Insights from resting state fMRI and the attentional network test.
The analysis of fMRI time series has revealed that brain regions that are routinely deactivated and those that are usually activated in demanding task conditions form two distinct networks in the resting brain. The former network is labeled default mode (DMN) or task-negative network while the latter is called fronto-parietal (FPN) or task positive network. In the absence of any task, both networks still show coherent BOLD fluctuations. While the DMN has received considerable attention in the past years, the FPN is less well explored. The functional role of the FPN is subject of the here presented research.
Question: The FPN has been labeled ‘attention network’. The evidence for this claim, however, is primarily based on the activation of the FPN in attention demanding tasks. A relationship between properties of the FPN at rest and individual attentional skills has not been addressed yet.
Methods: With the present study we seek to assess the assumed attentional function of the FPN at rest by means of an individual differences approach. N=23 participants underwent an fMRI scan at rest. Outside of the fMRI environment all participants performed the attentional network test (ANT). The ANT is a behavioral protocol that quantifies an individual's attentional capacity in three different domains: alerting, orienting and executive control.
Results: We modeled the FPN as a graph based on a functional connectivity analysis of time-series from sixteen regions of interest that were derived from the literature. Three different centrality measures (node degree, eigenvector and betweenness centrality) were computed for all sixteen regions. In a next step, we used stepwise multiple regression analysis to examine whether any of the centrality measures relate to attentional task-performance in any of the attentional domains. We found strong multiple correlations with the FPN and the alerting and executive control scores. The results regarding the orienting score did not survive a correction for multiple testing.
Conclusion: In sum, individual differences in functional connectivity within the FPN covary with an individual's attentional capacity. This findings indicate that the FPN in the resting brain can indeed be labeled an attentional network.
Institute of Cognitive Neuroscience, UCL, London, United Kingdom
Weizmann Institute of science, Neurobilogy, Rehovot, Israel
University of Wisconsin - Madison School of Medicine, Psychiatry, Madison, United States
Hebrew University of Jerusalem, Psychology, Jerusalem, Israel
Resting state functional connectivity reflects abnormal response patterns in human visual cortex
Even in the absence of specific tasks the cerebral cortex shows an incessant pattern of ultra slow fluctuations termed resting-state activity. The resting state coherent (also termed functionally connected) patterns are not random but appear to be similar, in a number of systems, to the large scale organization of task-induced functional networks. However, it is not clear to what extent this similarity occurs in cases of abnormal functionality. We have previously found that LG, a sighted individual suffering from developmental object agnosia, has no apparent cortical structural abnormality, yet upon visual stimulation shows an abnormal response pattern along the hierarchy of visual areas. Specifically, LG's intermediate visual areas (V2, V3) show a paradoxical inactivation upon visual stimulation. Here, examination of LG's resting state functional connectivity revealed the same abnormality- including a strong atypical decorrelation of areas V2–V3. Thus, our results demonstrate that the resting-state connectivity also reflects functional abnormalities in task-induced cortical activation. These results suggest that resting state connectivity could provide a powerful tool for detecting abnormalities in cortical activations during task performance.
Data Analysis
VuksanovicV.12HovellP.123
BCCN, Berlin, Germany
Technical University, Berlin, Germany
Northeastern University, Boston, Germany
Resting state functional connectivity of the human cortex: large-scale neural model
Question: Here, we aim to address questions of functional connectivity (FC) between anatomically unconnected areas of the human cortex, studying topology and dynamics of empirically derived resting state networks (RSNs) from fMRI data.
Methods: Our RSNs are comprised of 64 functionally connected network nodes/regions of interest (ROIs), as adapted from the study of Kiviniemi et al. (2009). Correlation matrices, characterizing FC between these regions, are used for exploration of the network topology and dynamics. The network topologies are characterized by graph theory methods and its dynamics is modelled as system of 64 neural oscillators, describing individual network node, and coupled by time-delayed interaction terms.
Results: Thresholded correlation matrices are used to create graphs for the cortex functional networks. We investigate how network topologies change for different levels of correlation and found that they diverse from comparable random networks. Similarly, networks dynamics simulated for different spatiotemporal networks, which are created after thresholding correlation matrices, enabled us to characterize parameters important for the emergence of the coherent fluctuations in the network. From a stability analysis of the networks dynamics we demonstrate that time-delay play significant role in emergence of different networks.
Conclusion: Combination of the networks topology and different time-delays could account for the presence of the so-called functional connectivity between anatomically unconnected regions in human cortex.
Charité – Universitätsmedizin Berlin, Division of Mind and Brain Research, Department of Psychiatry and Psychotherapy, Berlin, Germany
University of Heidelberg, Central Institute of Mental Health, Mannheim, Germany
University Hospital of Magdeburg, Department of Neurology, Magdeburg, Germany
Charité – Universitätsmedizin Berlin, Division of Neuroimaging Research, Department of Psychiatry and Psychotherapy, Berlin, Germany
Personality relates to differences in small-world properties of intrinsic functional brain connectivity networks
Introduction: Personality is an established research area but little is known about the neural correlates. To address this we used an integrative neuroimaging approach (task fMRI and resting state fMRI (rs-fMRI)). Graph theory provides a powerful way to describe the topological organization of brain connectivity for rs-fMRI data. Changes in statistical properties such as small-worldness and the clustering coefficient (ClustCoef) have been associated to neuropsychiatric diseases (Basset et al., 2009;Curr Opin Neurol), but research is lacking on whether differences in personality may also relate to altered small-word properties.
Methods: (1) 280 healthy subjects completed an emotional faces task during fMRI that was analyzed using whole-brain regression models with NEO-FFI measures serving as covariates to determine potential ROIs associated with each personality trait. For a sub-sample (n=235), network metrics (characteristic path length and ClustCoef) were computed from a 90-node undirected graph derived from resting state fMRI. (2) Correlations between whole-brain network metrics and NEO-FFI measures were computed to later on (3) examine local small-world properties of fMRI derived ROIs for traits that showed an association in this analysis.
Results: (1) fMRI results showed a positive association between the personality factor Conscientiousness (C) and activation in the right Superior Frontal Gyrus (SFG), left Postcentral Gyrus (PCG), and left Middle Temporal Gyrus (MTG) among others. (2) rs-fMRI results indicated that among NEO-FFI measures only C showed an association to whole-brain network metrics in particular to the ClustCoef (r=0.17; p=0.009). (3) The local ClustCoef of the right SFG (r=0.16; p=0.016), left PCG (r=0.18; p=0.005), and left MTG (r=0.22; p=0.001) showed associations to this personality trait as well.
Implications: These preliminary presented data suggest that differences in personality do relate to altered small-word properties, specifically trait C and ClustCoef. As C has been implicated as a risk factor for Alzheimer disease (Wilson et al.,2007; Arch Gen Psychiatry) the reduced ClustCoef in the SFG and MTG for subjects scoring low in C partly overlap with findings of altered small-world properties in this disease (He et al.,2009;Neuroscientist) since SFG and MTG dysfunctions have been reported in Alzheimer's disease.
Friedrich Schiller Univerität Jena, Neurology, Jena, Germany
Friedrich Schiller University Jena, Otolaryngology, Jena, Germany
The time course of cortical plasticity after facial nerve palsy.
How does the brain reorganize in order to support functional recovery from transiently decreased motor control? An understanding of the underlying processes requires detailed knowledge of the time course of cerebral reorganization. Here, we longitudinally studied voxel-based morphometry and resting state functional magnetic resonance imaging (MRI) 10 times in one patient during the course of Bell's palsy (idiopathic facial nerve palsy) up to complete clinical recovery. Morphometric analysis revealed a significant alteration in the face area of the primary motor cortex (MI) contralateral to the paretic face, with an initial increase in gray matter concentration. Functional connectivity analysis between the MI and other parts of the facial motor network revealed acutely disrupted intrahemispheric connectivity but unaltered interhemispheric connectivity. The disrupted connectivity was most pronounced on the day of the onset of symptoms, with a subsequent increase during the course of recovery. This time course was found to differ between the selected parts of the facial motor network. However, the increase in connectivity strength preceded clinical recovery in all areas and reached a stable level before the patient fully recovered. These results demonstrate that recovery from facial nerve palsy is complemented by cortical reorganization, with pronounced changes of connectivity that precede clinical recovery.
Data Analysis
StiersP.1GoulasA.1SamaraZ.1UylingsH.B.12
Maastricht University, Neuropsychology and Psychopharmacology, Maastricht, Netherlands
VU University Medical Center, Anatomy and Neuroscience, Amsterdam, Netherlands
Intrinsic functional connectivity parcellation and task activation in human lateral prefrontal cortex
Questions: fMRI studies during cognitive task performance show that prefrontal cortex (PFC) activity is functionally segregated in distributed foci. This is in line with cyto-architectonic studies showing that the cortex is divided in discrete functional areas. The relationship between task activation and functional areas is not clear because the latter can only be studied in vitro, whereas task activation is studied in vivo. The current aim was to study how lateral PFC functional modules delineated with an fMRI based parcellation method (Goulas et al., submitted) relate to brain activity during a cognitive task.
Method: Thirty-two participants underwent a rest-task-rest sequence, 10 minutes each, in a 3.0 T scanner. After preprocessing, detrending and 0.01–0.1 Hz filtering was applied. Task effects (2nd phase) were regressed out. Grey matter voxels overlapping with a lateral PFC mask were used to create an undirected dichotomized graph matrix, which was entered in theLouvainmodule detection algorithm (Blondel et al., 2008).
Results: First, we established 0.0.2 to be the best density at which to dichotomize the correlation matrix, yielding an optimal trade-off between high modularity (>0.75), across data set reproducibility (nMI=0.885 (0.037), and module number (12.27 (1.53)). Next we assigned individual modules obtained from the second rest period to functional areas based on similarity in functional connectivity profile and spatial location with the group data in Goulas et al. (submitted). We quantified per area the average BOLD response during execution of the cognitive task. This learned that the most prominent areas of the task positive network were areas 44, 8Av, FEF and to a lesser extend 46. Task deactivated areas are 8Ad, 9/46d, and to a lesser extend 45 were deactivated by the task.
Conclusion: These results show that it is possible to directly study the relationship between task actiavtons and specific functional areas in the prefrontal cortex.
References
BlondelVD, GuillaumeJL, LefebvreE. 2008. Fast unfolding of communities in large networks. J. Stat. Mech., P10008.a-616GoulasA, UylingsHBM, StiersP(submitted)Unravelling the intrinsic functional organization of the human lateral frontal cortex: a parcellation scheme based on resting-state fMRI.
Charité – Universitätsmedizin Berlin, Division of Mind and Brain Research, Department of Psychiatry and Psychotherapy, Berlin, Germany
Charité – Universitätsmedizin Berlin, Division of Neuroimaging Research, Department of Psychiatry and Psychotherapy, Berlin, Germany
University of Heidelberg, Central Institute of Mental Health, Mannheim, Germany
Personality as reflected in activation patterns during an active reward task does not reflect regional intensities of spontaneous brain activity
Introduction: Recent research suggested that inter-individual differences in the Big Five personality dimensions (Costa&McCrae) are reflected in intensities of spontaneous low-frequency fluctuations during rest (Kunisato et al., 2011;Neurosci Lett.). However, it remains unclear whether differences in personality as reflected in activation patterns during task fMRI may also reflect differences in intensities of regional spontaneous brain activity during rest in specific task associated regions. Therefore, we used rs-fMRI to explore whether regional low-frequency fluctuations during rest may relate to differences in the Big Five in regions activated by task fMRI.
Methods: (1) 281 healthy subjects completed a reward-anticipation task during fMRI that was analyzed using whole-brain regression models with NEO-FFI measures serving as covariates to determine potential regions associated with each trait. (2) For a sub-sample (n=200), rs-fMRI derived ALFF (Song et al., 2011; PLoS ONE) was then used to obtain measures of the intensity of regional brain baseline activity during rest for the regions derived from the findings in the reward fMRI task. Using correlational analyses we determined the association of NEO-FFI measures and ALFF values.
Results: (1) Reward fMRI results revealed a negative association between the personality factor Conscientiousness and activations in the right Caudatus Nucleus and the right Putamen. Agreeableness was positively associated with activity in the left Precentral Gyrus (PCG) and the right Supramarginal Gyrus. Openness was positively associated to activity in the left PCG. Extraversion and Neuroticism did not show any associations. (2) No significant associations between ALFF values and NEO-FFI related ROIs obtained in the reward task were found for any personality dimension.
Implications: It was shown that several of the Big 5 dimensions were associated with activity in different brain regions in a functional reward task. However, amplitudes of regional low frequency fluctuations in these brain regions were not associated to the personality traits. Thus, this study suggests that inter-individual differences in the Big 5 reflected in activation patterns during an active reward task do not reflect regional intensities of spontaneous brain activity.
University of North Carolina, Biomedical Research Imaging Center, Chapel Hill, United States
UNAM, Mexico City, Mexico
Universidad Veracruzana, Instituto de Neuroetologia, Xalapa, Mexico
Resting state connectivity in Spinocerebellar Ataxia type 7: an fMRI study.
Introduction: We recently documented gray and white matter changes in Spinocerebellar ataxia type 7 (SCA 7), which is a progressive neurodegenerative disorder characterized by cerebellar ataxia and visual loss. Currently there are no reports on the neurophysiological impact of SCA7. The aim of this study was to measure differences in “resting state networks” (RSNs) using fMRI in SCA7 genetically confirmed patients relative to normal controls.
Methods: Nine patients with genetically confirmed SCA7 and nine healthy volunteers participated in this IRB approved protocol. Genetic and clinical data were described in Alcauter et al. (2011). Images were acquired with a 3T Philips Achieva MR scanner. Whole brain standard functional images were collected by using an Echo Planar Imaging Single Shot sequence (TR=2000 ms, TE=35 ms). Structural imaging included a T1 Fast Field-Echo sequence (1×1×1 mm3). Subjects kept their eyes closed but remained awake.
Image processing: After standard preprocessing, functional images were co-registered to MNI template registered structural images. Nine regions of interest (ROI) were defined in MNI template space as spheres with ∼8 mm diameter, to define the Dorsal Attention, Default Mode, Fronto Parietal Control, Sensory Motor, and Visual networks, and two spheres centered in the Cerebellum. ROIs where warped back to functional space to extract the mean time series within them, correlation values between these and each voxel time series were computed voxel-wise for whole brain for each subject. To compare between groups, a two tailed t test was performed voxel-wise for each network (FDR, P
Results: We found SCA7 affecting all networks. The disease led to larger correlation values in some areas, as well as smaller correlation values in others. With some exceptions (i.e. posterior cingulate), we found a correlation increase near the selected ROIs, while a correlation decrease for distant areas.
Conclusion: These results suggest that neurodegeneration in SCA7 patients lead to increases in short distance functional connectivity of the remaining tissue. Analyses including 20 more patients already identified will allow us to make correlations with other data measured from the participants.
DMN greater coactivation in SCA7 patients (red), and controls (blue).
Data Analysis
DiazB.A.1HardstoneR.E.1PoilS.-S.1MansvelderH.D.1Linkenkaer-HansenK.1
Center for Neurogenomics and Cognitive Research, Integrative Neurophysiology, Amsterdam, Netherlands
EEG correlates of resting-state cognition
The human brain generates complex patterns of activity and cognition during wakeful rest, yet their relationship remains elusive. Despite great advances in characterizing resting-state neurophysiology, linking (electro)physiology to cognition has received scant attention. To assess resting-state mental activity, we developed a self-report Resting-State Questionnaire (RSQ) of 50 items for rating feelings and thoughts experienced during wakeful rest. Using factor analysis, the RSQ can be reduced to seven factors of resting-state cognition (Discontinuity of Mind, Theory of Mind, Self, Planning, Sleepiness, Comfort, and Somatic Awareness). Here, we investigate relationships between cognition and brain activity during the resting state using the RSQ and electroencephalography (EEG).
We recorded >140 subjects (77 males) using 128-channel EEG during a five minutes eyes-closed rest session, yielding data with both high temporal and comparatively good spatial resolution. The RSQ was used to explore cognitivecontent of the participants directly after the session. EEG data were analyzed using the Neurophysiological Biomarker Toolbox (NBT, http://www.nbtwiki.net/), which is dedicated to the computation of a wide range of classical and novel biomarkers, and correlated these with the average factor sum scores derived from the RSQ data.
We found significant (p<.05) negative correlations between normalized alpha-power [8–13 Hz] in fronto-central regions and the factor “Discontinuity of Mind” as well as significant positive correlations between normalized occipital theta-amplitude [4–7 Hz] and the factor “Sleepiness”.
Our results show that the RSQ could prove useful for shedding light on functional implications of genetic or disease related variation by successfully combining electrophysiological and cognitive measures. Future analyses with novelEEG-biomarkers and measures of functional connectivity may reveal an even more detailed view on the link between electrophysiology and cognition.
Applications: Psychology
HjelmervikH.1OsnesB.1SpechtK.1
University of Bergen, Biological and medical psychology, Bergen, Norway
Sex differences in resting state activity within the inferior frontal gyrus is only evident when women are in the follicular phase
Introduction: Menstrual cycle hormones have been suggested to modulate functional hemispheric asymmetry through the reduction of interhemispheric inhibition. In a recent fMRI study, it was demonstrated that the right inferior frontal gyrus (IFG) was less inhibited by the left during the follicular phase, when participants performed a verbal decision task. The current study aims to investigate whether this hormone-dependent reduction in inter-hemispheric inhibition within the IFG is also present in resting state activity.
Method: 16 women and 15 men were tested three times whereby the women were tested in their menstrual, follicular, and luteal phase. The participants were asked to relax and keep their eyes closed during the session. The data were collected with a 3T GE-Signa MRI scanner. EPI; TR 2.8 s.; 96×96 matrix. SPM8: Realign and unwarp, normalization, and smoothing. GIFT: independent component analysis (ICA) with 40 components which were spatially sorted after activation in IFG triangularis. SPM8: ANOVA was done with the variables sex and phase explored with an uncorrected threshold of p<0.001. The ANOVA was followed up with t-contrasts explored with threshold of FDR p<0.05.
Results: The ANOVA resulted in a main effect of sex with an activation pattern in left IFG, superior parietal gyrus, paracentral lobule, and precuneus driven by stronger activation for the men. Also an activation in the right middle frontal gyrus was detected which was stronger for women. Additionally, the ANOVA resulted in an interaction between sex and phase within the right IFG, driven by a stronger activation for women in the follicular phase compared to men.
Conclusion: The results suggest that women in the follicular phase have a stronger right sided frontal involvement during rest as compared to men. Whether the activation reflects an especially low inhibition from the left hemisphere onto the right, as previously found, needs to be further explored with a connectivity analysis.
UCSF Memory & Aging Center, Department of Neurology, San Francisco, United States
Helen Wills Neuroscience Institute, UC Berkeley, Berkeley, United States
Dementia Research Centre, UCL Institute of Neurology, London, United States
Massachusetts General Hospital, Harvard Medical School, Harvard, United States
Functional connectivity networks in healthy subjects predict regional atrophy patterns in different variants of Alzheimer's disease
Question: Neurodegenerative diseases such as Alzheimer's disease (AD) target large-scale neural networks, however, little is known about networks specifically affected in different AD variants. We aimed to assess functional networks in healthy subjects by seeding regions that are specifically atrophied in 3 common AD syndromes: early-onset AD (EOAD), language variant AD, and visual variant AD.
Methods: 112 healthy controls (age 66.6 (3.5) years, 36% male) underwent task-free functional magnetic resonance imaging. Regions specifically atrophied in each AD variant were: right middle frontal gyrus in EOAD, left superior temporal sulcus in AD-language, and right middle occipital gyrus in AD-visual. 4mm spheres were drawn around the peak atrophy voxels (Figure 1). The average time series in these seeds were used as covariates of interest in a whole-brain regression analysis to determine correlations with each voxel's spontaneous BOLD signal time series.
4mm seeds used for the seed-based functional connectivity analysis.
Results: Each seed produced specific functional network maps that greatly overlap with AD syndrome-specific regional atrophy patterns (Figure 2). Activity in the EOAD seed correlated with activity in bilateral (right more than left) frontal, insula, anterior cingulate, right precuneus and lateral parietal regions, greatly overlapping with the executive control network. The network map of the AD-language seed involved mainly regions of the language network, including bilateral (left more than right) middle and superior temporal, and parietal lobe regions, with some involvement of left inferior and middle frontal lobe regions as well. Finally, activity in the AD-visual seed correlated with regions involved in primary and higher visual networks, including bilateral lateral and medial occipital lobe regions, extending anteriorly into the fusiform gyrus and superior parietal lobe regions.
Task-free functional connectivity networks in healthy individuals produced by seeding 3 different regions. Shown are statistical p maps after correction for multiple comparisons (FWE p<0.05).
Conclusion: Our data show that syndrome-specific atrophy patterns in AD mirror functional networks in the healthy brain. We hypothesize that AD syndromes are associated with degeneration of specific functional networks.
Data Analysis
JinS.-H.1ChungC.K.12
Seoul National University Hospital, Department of Neurosurgery, Seoul, Korea, Republic of
Seoul National University College of Medicine, Department of Neurosurgery, Seoul, Korea, Republic of
Functional brain networks in eyes-closed and eyes-open resting states: MEG study in source space
Human brain network can be regarded as a brain graph that is a model of a nervous system as a number of nodes interconnected by a set of edges, and as a complex network of local and long-range connections. It seems to be a reasonable approach, because the brain is the most complex system in nature that might be pursued with a complex network theory. Since it is easily expected that the brain even in the resting state should be functioning, studies on functional connectivity in the resting state of the human brain has also been in the spotlight so as to look at intrinsic brain activities. In addition, concerning the brain functional networks by using magnetoencephalogram (MEG), most of the studies have been focused on the sensor-level functional networks in the resting state or during the task. Thus, in the present study, we aimed to look at the source-level functional brain networks in the resting state to figure out how different functional brain networks are in eyes-closed and eyes-open resting states. We hypothesized that the eyes-closed and -open resting states could be characterized by different topological modularity and hubs depending on the temporal dynamics in source space networks. To this end, a whole-head MEG were recorded from 9 healthy volunteers during eyes-closed and -open conditions. MEG source signals were extracted as a set of 72 nodes based on the anatomical segmentation. Mutual information (MI) was employed as a measure of connectivity between sources in the 4 frequency bands of MEG source signals corresponding to the classical EEG bands, theta (4∼7Hz), alpha (8∼12Hz), beta (13∼30Hz), and gamma (31Hz∼45Hz) bands. We used weighted undirected networks defined by MI without thresholding. Modularity and hub classification were applied to find the hubs from all nodes involved in the whole brain functional networks in source space. As results, more connector hubs were seen in the eyes-open state than in the eyes-closed state, and different hub distributions depending on the resting states and bands were observed. Our results could provide a better understanding of the eyes-closed and -open resting states of human MEG in terms of functional brain networks in source space.
Applications: Psychology
MouraoA. Martins1KoorenhofL.1SwithenbyS.1
The Open University, Milton Keynes, United Kingdom
Neurophysiological differences between people with Obsessive Compulsive Disorder and controls.
Obsessive compulsive disorder (OCD) is an anxiety disorder characterised by recurrent intrusive obsessions and compulsions. This study investigates EEG power spectra in people with OCD compared to controls. Neurophysiological studies have identified an aberrant positive feedback loop in the orbito-striato-thalamic network in people with OCD. It is thought that this causes hyperactivity in the orbito frontal and anterior cingulate cortex, which may underlie the behavioural symptoms in OCD. 21 people with OCD (14 female; mean age 46, range 21 to 74), and 22 controls without a mental health disorder (12 females; mean age 37, range 18 to 64) were recruited. The Yale Brown Obsessive Compulsive Scale (Y-BOCS) and the Minnesota Multiphasic Personality Inventory 2 Restructured Form (MMPI-II-RF) were administered. EEG was digitally recorded at 75 Hz during five minutes eyes closed and five minutes eyes open and analysed quantitatively. Data was analysed (0.3Hz to 50Hz with power line notch filter at 50Hz,) on a common average montage.
The OCD and the control group differed significantly on the clinical scales of the MMPI-II-RF (e.g. self doubt, stress, anxiety and social avoidance all p<0.01). Power spectra during the eyes-closed condition revealed a decrease in alpha amplitude (8–10Hz) in temporal electrodes and a widespread increase in amplitude in the beta range (21–25 Hz) in the OCD group (both p<0.05). During the eyes-open condition, we observed widespread decreased amplitudes in the alpha range (9–11Hz) and increases in beta frequencies (22–26 Hz) in parietal electrodes, (all p<0.05). As alpha is generally considered to indicate visual disengagement, a decrease in this frequency range might be a sign of hyperactivity as described by the fronto-striatal model of OCD. Additionally, beta is generally considered to indicate mental focus, the observed increases in this frequency range could reflect a heightened state of alertness in people with OCD, also in line with the models predictions. Our interpretation will be further evaluated by correlating the behavioural and neurophysiological data and by examining the results of complementary evoked response experiments.
Mount Sinai School of Medicine, Neurology, Radiology, Neuroscience, New York, United States
Functional connectivity changes in Parkinson's disease: A graph theory analysis of resting-state fMRI data
The degeneration of midbrain dopaminergic neurons in Parkinson's disease (PD) is accompanied by impairment of motor, cognitive and emotional functions. We should thus expect that PD presents with abnormalities of functional connectivity extending outside motor areas. In this study, we characterized the whole brain functional connectivity in PD patients compared to healthy controls (HC) using graph theory analysis of resting-state (RS) fMRI data.
RS-fMRI was acquired on 10 patients with PD (6M/4F, 62.4±7.77 yrs, UPDRS motor score 16.9±6.8, H&Y staging 1.8±0.4) and 10 HC (6M/4F, 63.5±8.84 yrs) using standard acquisition protocol. The whole brain was parcellated in 206 bilateral cortical, subcortical and cerebellum regions based on cytoarchitectonic maximum probability map and macrolabels. The connectivity matrices were constructed using voxelwise Pearson's correlation coefficients between averaged time series from all brain regions. Using Fisher's Z transformation on correlation matrices, we ensured variance stabilization. Both global [clustering coefficient (gamma), path length (lambda), global efficiency (E-glob)] and local [nodal betweenness centrality (BC), degree (D), local efficiency (E-loc)] network metrics were computed using Brain Connectivity Toolbox. The correlation matrices were threshold over a wide range of sparsity (10% ≤S≤65% with 5% interval).
Both controls and patients showed small-world network properties with normalized clustering (gamma=1.2 HC and 1.3 PD) and path length (lambda=1.39 HC and 1.13 PD). However, clustering coefficient was significantly lower (PD=0.34 HC=0.41 p=0.001) and path length higher (PD=1.98, HC=1.69,p=0.017) in patients compared to controls. On further investigation of local network properties, we found statistically significant decreased E-loc in right supramarginal and middle occipital gyri and in left thalamus in PD as compared to HC (p<= 0.004). The number of hubs was lower in PD (12) than in HC (33) based on degree. In comparison to HC, PD patients showed statistically higher BC in right amygdala and superior temporal gyrus, in left thalamus and bilateral insula (p<= 0.004).
Our results show that network topological properties are altered in PD not only in motor areas but also in brain areas involved with cognitive and emotional functions.
University of Sheffield, Academic Clinical Psychiatry, Sheffield, United Kingdom
University of Oxford, FMRIB Centre, Nuffield Department of Clinical Neurosciences, Oxford, United Kingdom
Time-frequency investigation of dynamic coherence and phase in fMRI resting state functional connectivity networks
Functional connectivity analysis of fMRI data obtained during awake rest has revealed that the brain is intrinsically organized into distinct networks including the default mode network (DMN) and the anti-correlated network (ACN). This study aims to investigate the temporal dynamics and potential non-stationarities that are present in pre-defined resting state networks using wavelet coherence analysis.
Resting state functional imaging data were acquired from 9 subjects (3T, 400 volumes, TR=1050ms). Pre-processing included motion correction, physiological noise removal (RETROICOR, Glover, Li, & Ress, 2000), slice timing correction, normalization into standard space and spatial smoothing (5mm FWHM). Three regions of interest (ROIs) for both the DMN and ACN were defined based on second level group results (p<.001, uncorrected) of z-transformed whole-brain Pearson correlation coefficients with two a priori ROIs in the posterior cingulate cortex and intra-parietal sulcus (Toro, Fox, & Paus, 2008). Implementation of the wavelet transform coherence was based on available mathematical processing scripts (http://www.pol.ac.uk/home/research/waveletcoherence/, Grinsted, Moore, & Jevrejeva, 2004). Time-averaged coherence and phase variability of intra-network (DMN and ACN) and inter-network connectivity were compared against a null distribution derived from between-subject results and against simulation data.
Results indicate that coherence was significantly lower in the DMN compared with the ACN and that resting state coherence was found across the full frequency spectrum. Hence, information regarding resting state connectivity may be contained in higher frequencies than the commonly explored ‘low frequency range’ (<0.1 Hz). Furthermore, our results show that phase relationships between resting state networks became increasingly unstable at higher frequencies and that phase relationships were significantly more stable within the DMN compared with the ACN. In conclusion, resting state networks are characterized by frequency-specific dynamic fluctuations in coherence and phase that are overlooked by conventional functional connectivity approaches.
University of Oxford, FMRIB Centre, Nuffield Department of Clinical Neurosciences, Oxford, United States
UC Berkeley, Department of Psychology and Helen Wills Neuroscience Institute, Berkeley, United States
Dual clustering analysis of individual differences in resting state connectivity: beyond anxiety
Previous research on influences of individual differences in anxiety or depression upon resting state connectivity has typically related seed-based correlation coefficient maps to a single measure of trait affect. We propose a dual-clustering approach that allows parallel investigation of resting state networks and multiple dimensions of affect.
Two runs of resting state fMRI data were acquired from 20 subjects (150 volumes, TR=2100ms). Subjects completed standardized measures of anxiety, depression, worry and neuroticism. Following standard FSL-based pre-processing, single-subject independent component analysis was used to remove components linked to movement and physiological noise. Variance associated with outside brain, white matter and movement parameters was also removed.Mean signal was extracted from 27 regions of interest (ROIs) previously implicated in emotion-related processing.
Hierarchical clustering of extracted time courses replicated previously established networks. Clustering of questionnaire data revealed a primary distinction between depression and anxiety. Depression further sub-clustered into the presence of depressed mood and anhedonia. Anxiety sub-clusters dissociated worry and neuroticism from anxious arousal.
Non-parametric permutation testing (thesholded based on cross-run reliability) revealed cross-measure vulnerability to negative affect to be associated with increased subcortical (hippocampus-amygdala) connectivity and decreased frontal (Dorsolateral Prefrontal Cortex (DLPFC) - Orbitofrontal Cortex (OFC)) connectivity. The two depression dimensions were characterized by distinctive differences in OFC - amygdala - hippocampal connectivity. The two anxiety dimensions were characterized by changes in insula connectivity; altered connectivity with other frontal regions primarily being observed for the worry/neuroticism dimension.
We present a novel dual-clustering analysis that allows a shift from exploratory towards targeted hypothesis-driven research. Our findings point to a generalized vulnerability to negative affect (altered amygdala and frontal connectivity), which may manifest as depression (disrupted OFC connectivity), or as anxiety (disrupted insula connectivity).
CEDIMAT, Dep. of Radiology, Santo Domingo, Dominican Republic
University Medical School, Dep. of Neurology, Hannover, Germany
CEDIMAT, Department of Scientific Investigations, Santo Domingo, Dominican Republic
CEDIMAT, Dep. of Neurology, Santo Domingo, Dominican Republic
The degree of dystonia in patients with Pantothenate Kinase Associated Neurodegeneration (PKAN) predicts components in resting state fMRI
Objective: In a group of 7 patients with secondary dystonia due to Pantothenate Kinase Associated Neurodegeneration (PKAN), we saw a “hyperactivation” in the posterior cingulum during an event-related motor activation study, present only 4 and 3 sec before the actual event (Fig. 1). For further exploration, we conducted functional Magnetic Resonance Imaging (fMRI) during true resting state conditions in 5 of them.
FIG. 1.
Patients and Methods: Included were 5 individuals from the south-west of the Dominican Republic suffering from an identical mutation of the PANK2-gene, and 6 healthy controls.
FMRI was performed by the Philips 3T system “Achieva”: Echo Planar Imaging (EPI) gradient echo sequence (TR 2 s, 34 slices, voxel size 2.4×2.4×3 mm) over 10 min (where subjects were instructed to lie quietly with eyes closed) and 3D T1-weighted images for co-registration. Data processing by Statistical Parametric Mapping (SPM8) involved slice timing, realignment, spatial normalization to a standard EPI template and smoothing (8 mm Gaussian kernel). Independent Component Analysis (ICA) was performed by GroupICATv2.0 (http://icat.sourceforge.net) using Infomax algorithm. 3 components were correlated to the degree of dystonia (Burke Fahn Marsden scale) using SPM 2nd level multiple regression analysis and family wise error correction.
Results: In three components in resting state fMRI, which are probably relevant for executive and motor function, the outcome could be predicted by the extent of dystonia. The regression analysis highlighted 2 bilateral clusters in the posterior cingulum, the left precuneus and the right parieto-temporal cortex (Fig. 2), as well as in right ventro-lateral prefrontal cortex and the SMA (Fig. 3 and 4).
FIG. 2.
FIG. 3.
FIG. 4.
Conclusion: This resting state fMRI study shows a relation between the degree of dystonia and motor-related components during resting state fMRI. Reports about resting state in movement disorders are rare and demonstrated reduced default-mode processing in ventral prefrontal and posterior cingulated cortices in Tourette's syndrome and reduced connectivity, combined with a reversed pattern of activation and deactivation in Parkinson's disease. The significance of our findings remains to be determined, but may partially be due to patients' efforts to suppress their involuntary movements.
University of Tehran, College of Engineering, School of ECE, Tehran, Iran, Islamic Republic of
Resting State Functional Connectivity in Medial Temporal Lobe Epileptic Patients: Seed-Based Correlation Analysis in Resting State after ICA
Objective: To localize impairments of resting state functional connectivity of Default Mode Network (DMN) in patients with medial Temporal Lobe Epilepsy (mTLE).
Methods: To localize DMN impairments, we compare resting state functional connectivity in five healthy subjects and five mTLE patients. We apply probabilistic Independent Component Analysis (pICA) and Seed-based Correlation Analysis (SCA) to estimate functional connectivity in resting state. Using pICA the spatial map of DMN is estimated and used to determine a seed for the further SCA. Therefore, the seed is selected exploratory, and unlike ICA, the method generates reproducible results. Then the mean of all voxels' time series within the seed is defined as the reference function for seed-based correlation analysis. The resulted correlation maps of subjects in two groups are then analyzed via a random effect model to find the between group differences.
Graphical display of ROI-to-seed connectivity in controls (left) and patients (right). The seed is shown as a green circle and other regions are shown as red circles.
TABLE 1. Regions with Significant Difference between Controls and Patients
Results: For healthy subjects, we have found a functional network containing 11 regions connected to seed (DMN) whereas in the patients there are 5 regions connected to the seed. In the network obtained for patients, there is a region which is not found in the control subjects. Between groups analysis showed significant decreases in the functional connectivity in patient (vs. controls) in right orbitofrontal cortex, right inferior temporal gyrus, left angular gyrus, left orbitofrontal cortex, left dorsal anterior cingulated cortex and left anterior prefrontal cortex. No significant increase was found in connectivity of patients (vs controls).
Conclusion: In this paper, we assessed the resting state functional connectivity in patients with mTLE and healthy subjects. We used a joint ICA-SCA approach and an exploratory algorithm of ICA for seed selection. This method conceals the reproducibility issue in group comparison of functional connectivity maps. Results show that the functional connectivity was significantly decreased among the frontal and temporal regions in patients relative to controls.
Applications: Psychology
SitgesC.1CifreI.1González-RoldánA.M.1RossellóF.V.1Martínez-JauandM.1MontoyaP.1
UIB & IUNICS, Psychology, Palma de Mallorca, Spain
Altered DMN activation and connectivity in chronic pain patients elicited by an affective working memory n-back paradigm
The default-mode network (DMN) is a functional network characterized by increased activation at rest and decreased activation during task performance. Recent research has indicated that the degree of DMN activation after performance on a working memory task is influenced by the cognitive challenge required by the task, reflecting the recovery of brain resources from high cognitive demands. The aim of the present study was to test the effects of an affective working memory task on DMN activation and connectivity in healthy controls and patients with chronic pain. For this purpose, fMRI was recorded at rest and during performance on a working memory n-back paradigm with three memory loads (0-, 1-, and 2-back) and three types of affective target stimuli (happy, neutral, and pain faces). A probabilistic independent component analysis (ICA) was applied by using MELODIC tool from FSL (FMRIB's Software Library,www.fmrib.ox.ac.uk/fsl) to analyze the volumes at rest. The ICA analysis showed that chronic pain patients displayed greater DMN activation after performing the memory task with pain faces, as well as an increased connectivity of the precuneous cortex after performing the task with happy faces in comparison with healthy controls. Taken together, our findings seem to indicate that the cognitive challenge elicited by the affective working memory task was greater in chronic pain patients than in healthy controls, suggesting the existence of an altered processing of affective-related information in these patients.
Research funded by La Marato TV3 Foundation and Spanish Ministry of Science (grant #PSI2010-19372).
University of Campinas, Neurology, Campinas, Brazil
Learning and delayed recall impairment in Alzheimer's disease are related to functional connectivity alterations in Default Mode Network
Introduction: New methods in functional magnetic resonance imaging, especially during resting state, may help to clarify the functional organization of cognitive networks. While their alterations have been reported in AD, especially in the Default Mode Network (DMN), their relationship with cognitive symptoms remains unclear. In this study, we aimed to verify the relation between DMN connectivity and memory performance in AD patients.
Methods: We studied 20 mild to moderate AD patients. High-resolution Magnetic Resonance Imaging (MRI) was performed using a 3.0 T scanner (Philips - Achieva). All patients underwent a 10 minutes task-free functional MRI (fMRI). We used FSL's Melodic Independent Component Analysis to study fMRI images in order to select each patient's DMN. They also underwent a cognitive evaluation, including the Rey Auditory Verbal Learning Test (RAVLT). We correlated RAVLT's scores (encoding, delayed recall and recognition) with individual maps of DMN connectivity, considering age, education and dementia severity. We also performed VBM analysis to obtain grey matter maps to correct these data for atrophy.
Results: We found significant areas of correlation between DMN functional connectivity and RAVLT encoding and delayed recall with left precuneus (MNI coordinates: −13, −67, 34). We did not find any areas of correlation with recognition, after correction for atrophy.
Conclusion: We report the association of changes in DMN connectivity (atrophy corrected) with episodic amnesia in AD, especially in left precuneus. These findings confirm the importance of neurofunctional networks alterations in the origin of AD symptoms.
Data Analysis
YanC.1MilhamM.12ZangY.3
The Nathan Kline Institute for Psychiatric Research, Orangeburg, United States
Child Mind Institute, Center for the Developing Brain, New York, United States
Hangzhou Normal University, Center for Cognition and Brain Disorders and The Affiliated Hospital, Hangzhou, China
DPARSF 2: an updated MATLAB toolbox for “pipeline” data analysis of resting-state fMRI
The previous Version 1.0 of the Data Processing Assistant for Resting-State fMRI (DPARSF) (Yan and Zang, 2010) (www.restfmri.net) - a “pipeline” data analysis MATLAB toolbox, has successfully addressed issues of time-consuming manual procedures when acquiring resting-state fMRI measures, e.g., functional connectivity (Biswal et al., 1995), regional homogeneity (Zang et al., 2004), amplitude of low frequency fluctuation (ALFF) (Zang et al., 2007) and fractional ALFF (Zou et al., 2008). This user-friendly toolbox has made the relatively novel technique of resting-state fMRI easier to study, and has been cited for 34 times.
However, the DPARSF 1.0 is somewhat limited in its flexibility and fixed to a certain order of process steps. As such, we continue to update DPARSF to version 2 including the following features:
•The processing steps can be freely skipped or combined.
•Utilize DARTEL to perform spatial normalization (from native to MNI space or vice versa).
•Support calculating resting-state fMRI measures in native space with warping masks from MNI space.
•Define ROIs interactively based on a participant's T1 image in native space.
•Interactively reorient functional images and T1 images to improve the accuracy in coregistration, segmentation and normalization.
•Distribute the processing of each subject into different CPU cores (work with parallel computing toolbox) (will release in summer).
•More resting-state fMRI measures are included, e.g., voxel-mirrored homotopic connectivity (Zuo et al., 2010), Degree Centrality (Buckner et al., 2009), connectome-wide association studies, and Granger causality analysis (will release in summer).
•Head motion correction strategies are included: regressing out 6 head motion parameters, regressing out autoregressive models (Friston et al., 1996), regressing out voxel-specific head motion regressors and performing data scrubbing (will release in summer).
Similar with the operation in version 1.0 of DPARSF, users simply need to arrange the raw files, and click a few buttons to set parameters in GUI to generate the desired preprocessed data and results with the new DPARSF (Figure 1). We hope this open-source toolbox could continually contribute to our novice (by user-friendly GUI) and expert users (by efficient command line) and promote the resting-state fMRI studies.
Graphical user interface of DPARSF.
Applications: Psychology
CifreI.1SitgesC.1MuñozM.A.2González-RoldánA.M.1Martínez-JauandM.1ChialvoD.R.3MontoyaP.1
UIB & IUNICS, Palma de Mallorca, Spain
University of Granada, Granada, Spain, 3University of California, David Geffen School of Medicine., Los Angeles, California, United States
Chronic pain patients display an altered connectivity of the pain matrix at rest
Although chronic pain patients seem to be characterized by an altered brain processing of pain, little is known about the impact of lasting pain on brain dynamics at rest. In the present study, functional connectivity was examined in patients with chronic pain (n=9) and healthy controls (n=11) by calculating partial correlations between low-frequency blood oxygen level dependent fluctuations extracted from 15 brain regions of the pain matrix. Chronic pain patients displayed enhanced functional connectivity of the anterior cingulate cortex (ACC) with the insula (INS) and basal ganglia (p values between .01 and .05), the secondary somatosensory area with the caudate (CAU) (p=.012), the primary motor cortex with the supplementary motor area (p=.007), the globus pallidus with the amygdala and superior temporal sulcus (both p values < .05), and the medial prefrontal cortex with the posterior cingulate cortex (PCC) and CAU (both p values < .05). Functional connectivity of the ACC with the amygdala and periaqueductal gray (PAG) matter (p values between .001 and .05), the thalamus with the INS and PAG (both p values < .01), the INS with the putamen (p=.038), the PAG with the CAU (p=.038), the secondary somatosensory area with the motor cortex and PCC (both p values < .05), and the PCC with the superior temporal sulcus (p=.002) was also reduced in chronic pain patients. In addition, significant negative correlations were observed between depression and PAG connectivity strength with the thalamus (r=−0.64, p=.003) and ACC (r=−0.60, p=.004). All these findings demonstrated that chronic pain patients display a substantial imbalance of the connectivity within the pain network during rest, suggesting that chronic pain may also lead to changes in brain activity during internally generated thought processes such as it occurs at rest.
Research funded by La Marato TV3 Foundation andSpanish Ministry of Science (grant #PSI2010-19372).
CBBS, Magdeburg, Germany
Otto-von-Guericke University, Psychiatry and Psychotherapy, Magdeburg, Germany
Leibniz Institute for Neurobiology, Magdeburg, Germany
Otto- von- Guericke University, Neurology, Magdeburg, Germany, 6DZNE, Rostock, Germany
MHH, Neurology, Hannover, Germany
Resting-state functional connectivity in amyotrophic lateral sclerosis
Amyotrophic lateral sclerosis (ALS) is a progressive disease involving neurons within the motor cortex (M1). Furthermore, alterations of major brain network have been described in ALS patients using independent component analysis (ICA; Mohammadi, 2009), but the specific functional connectivity (FC) pattern related to M1 has not been specified yet. Our study therefore aimed to test for global and local resting state behaviour of the motor cortex in patients with ALS compared to healthy controls (HC). 26 ALS-Patients and 26 HC underwent a 10min eyes-closed resting state scan (3T). Data was analyzed using DPARSF (Yan, 2010), which is based on REST (Song et al., 2011) and SPM8 (Wellcome Trust Centre for Neuroimaging, London). Whole-brain FC was calculated for left and right motor cortex separately, as defined by the AAL-templates (Tzourio-Mazoyer et al., 2002). In addition whole brain fractional amplitude of low-frequency fluctuation (fALFF) (Zang et al., 2007) was calculated voxel-wise for patients and HC. Functional connectivity of right M1 with the posterior cingulate cortex, frontal pole, lateral parietal cortex and inferior temporal cortex within the default mode network was significantly decreased in ALS. In contrast, connectivity of M1 with supplemental motor area (SMA), precentral- and postcentral gyrus was significantly increased in ALS compared to HC. No significant differences were found for FC with left M1. fALFF in right M1 was significantly altered in ALS compared to HC, with significant higher fALFF in M1 and lower fALFF in the premotor cortex. Our study shows that alterations in FC seeded from the motor cortex in ALS coincides with alterations in local resting state properties. Alterations of FC with a large scale network are in line with previous findings in ALS using ICA (Mohammadi, 2009). However, we here for the first time focused on differences in functional connectivity and fALFF. M1 tissue abnormalities, as indicated by fALFF could influence long range connectivity, thereby affecting regions involved in emotional and cognitive processes, such as memory and attention - functional abnormalities that have previously been linked to ALS. Higher functional connectivity of M1 with secondary motor areas like SMA could be a hint to a compensatory mechanism as described by Schoenfeld et al. (2005).
Data Analysis
KumarV.1CongF.1SchefflerK.1GroddW.1
RWTh Aachen Uniklinikum, Klinik für Psychiatrie, Psychotherapie und Psychosomatik, Aachen, Germany
Temporal Dynamic of Intrinsic Spontaneous Brain Fluctuations revealed by Independent Component Analysis
Introduction: Patterns of spontaneous fluctuations of the BOLD signal can be identified by their spatial coherence using a correlation or independent component (ICA) approach (Beckmann et al. 2005). Examinations across time reveal varying fluctuations within each and between networks (Raichle, 2011) reflecting spontaneous changes (Smith et al. 2012). However, the extend of those intrinsic fluctuations remains still unclear. As correlation-based approaches measure the average functional connectivity between regions, we therefore used an ICA to a) identify number of resting state networks and b) to calculate their fluctuation over a time period of 20 min.
Methods: Data acquisition: A young volunteer was examined for 20 min. with a 32 channel head coil at 3 Tesla system and an EPI sequence with 3 mm isotropic resolution (46 slices, TR 2800 ms, TE 28 ms).
Data Analysis: Preprocessing: Data was preprocessed i.e. detrend and filtered (0.001–0.02Hz) using SPM Rest toolbox (Xiao-Wei, 2011) with the removal of noise (Cong et al., 2011b). Model order selection (He et al., 2010) was used to estimate the number of sources. ICA was performed using infomaxICA (Bell & Sejnowski, 2011) through ICASSO software (Himberg et al., 2004). The component of interest were selected and projected back to the scan field to obtain the temporal course.
Results: The ICA Analysis in Fig. 1 indicates the compactness of isolated clusters. Icasso plot in Fig.1a depicts a total of 52 clusters using a frequency bandwidth ranging from 0.008 to 0.02. All cluster were examined for stability and 21 showed a stability index > 0.8 (Fig.1b). Compact and isolated clusters suggest reliable estimates (Fig.1c). The maps of three ICA components and their temporal courses are depicted across 400 scans (Fig. 2).
ICA Analysis: a) clustering quality plot: x axis represents number of selected clusters i.e. 52. b) Estimate quality: x axis represents the stability index for ICA-estimate-clusters. y axis is the label of clusters. 21 clusters showed higher > 0.8 stability index. c) Similarity graph / cluster compactness: Compact and isolated clusters suggest reliable estimates.
Top: Surface view of three ICA components with pos. and neg. amplitudes are colored in red-yellow and blue-light blue respectively. Bottom: Temporal characteristics of the three ICA components.
References
BeckmannCFet aaal.2005. Philosophical Transactions of the Royal Society of London. Series B, Biological Sciences, 360,1457:1001–1013.BellAJ, SejnowskiTJ. 1995. Neural Computation. 7–1159CongFet al.2011a. Biomedizinische Technik / Biomedical Engineering. 56,4:223–234.CongFet al.2011b. Journal of Neuroscience Methods. 201,1:269–280.HeZet al. 2010. IEEE Trans. Pattern Anal. Mach. Intell., 32:2006–2021.HimbergJet al.2004. Neuroimage, 22:1214–1222.RaichleME. 2011. Restless brain, Brain Connectivity. 1:3–12SmithSMet al.2012. PNAS 109. 21,2:3131–3136.Xiao-WeiSet al.2011. PLoS ONE, 6,9:e25031, 10.1371/journal.pone.0025031
Applications: Psychology
AurtenetxeS.1LópezM.E.1CuestaP.1GarcesP.1CastellanosN.1BajoR.1PrietoJ. Garcia1MontejoP.2DelgadoM.L.3CabranesJ.A.4MArcosA.4del PozoF.1MaestuF.1
CTB. Laboratory of Cognitive and Computational neuroscience, Madrid, Spain
Unidad de prevencion del deterioro cognitivo, Madrid, Spain
Universidad Complutense, Madrid, Spain
Hospital Clinico San Carlos, Madrid, Spain
Cognitive reserve modulates connectivity patterns of brain activity in aging. AMEG study in Mild Cognitive Impairment
The link between mental activity and dementia risk has been recently studied since cognitive training seems to produce strong and persistent benefits in healthy older adults. The cognitive reserve hypothesis, defined as the capacity of the adult brain to sustain the effects of pathology that would cause clinical dementia, suggests that there are individual differences in the ability to cope with the pathological changes in Alzheimer disease (AD). In this sense, it is quite established that people with a higher educational and occupational attainment can overcome with advancing AD pathology longer before is expressed clinically. Thus, cognitive reserve is associated with decreased risk for incident dementia and with a significantly slower rate of memory decline. Neuroimaging data show that cognitive reserve modulates brain architecture by increasing its functionality. In order to assess how the cognitive reserve may modify the patterns of brain activity in normal and pathological aging, we have used the magnetoencephalography (MEG) and obtained resting state data of 30 healthy elderly people and 60 Mild Cognitive Impairment (30 with amnestic type and 30 with multidomain type). Each group has been divided into two, according to an index of cognitive reserve, which is the mean of the education level (maximun score of 7) and occupation (maximun score of 6). So, high cognitive reserve corresponds to a score of 7 or more and low cognitive reserve to a score of 6 or less. We analyzed the functional connectivity with two different methods, Mutual Information (MI) and Phase locking value (PLV). Both methods of analysis revealed differences in connectivity between the high and low cognitive reserve groups of MCI, showing the importance of this variable to slow the decline of memory and other cognitive functions in the preliminary stages of the AD.
Applications: Neurology
DelgadoL.M. Rueda1ReillyR.1
Trinity College Dublin, Trinity Centre for Bioengineering, Dublin, Ireland
Connectivity changes in the EEG resting state network with subject's own name
Objective: To evaluate the changes in connectivity of the resting state network in EEG when the subject's own name (SON), another name (OTHER) and a word are presented in and oddball paradigm.
Methods: Resting state activity from 10 healthy controls (mean age 27 years, with no history of neurological disease or hearing impairment) was recorded using a 128-channel EEG system (Fs: 512Hz, recording time: from 2 to 4min). Next, an auditory oddball paradigm was played to the participants. The paradigm consisted of standard (80% probability of occurrence) and deviant tones (14%) and three novels (2% each). The standard sounds were complex tones of 800Hz, 1600Hz and 3200Hz with a duration of 75ms; the deviant tones had the same frequencies but with a duration of 30ms. The novels consisted on SON, OTHER and a word.
After preprocessing, the connectivity analysis was performed using regions of interest. The four lobes, the hippocampus, the medial temporal gyrus, the superior temporal sulcus and the inferior frontal gyrus were chosen. The coherence and the phase-lag index were used as weights to create a connectivity map.
Results: Within an auditory oddball paradigm, a known evoked-response potential (ERP) is expected. For healthy participants, an early P300 component (mostly around 260ms) is visible for deviant tones. This is explained by the involuntary attention that the participants may be giving to the stimuli. The results from one participant are shown in Fig. 1 and Fig. 2.
ERP to standard and deviant tones.
ERP to SON, other name and a word.
The resting state network will be compared to the auditory network for each type of stimuli.
Conclusions: It is expected to find a significant difference in the inferior frontal gyrus in the results of the cortical sources for the presentation of the SON over OTHER and the word, as previously reported in fMRI studies. In particular, for each novel (SON, OTHER and word) it is expected to find a different composition of the network that would show the involvement of specific brain regions for each condition.
This passive paradigm was designed to be used in comatose patients after cardiopulmonary arrest in the intensive care unit. The results from this study will be used to analyse the relevant networks in the clinical cohort and evaluate the feasibility of their use for prognosis.
Data Analysis
MadhyasthaT.12WillisS.2SchaieK.W.2GrabowskiT.134
University of Washington, Integrated Brain Imaging Center, Seattle, United States
University of Washington, Psychiatry and Behavioral Sciences, Seattle, United States
University of Washington, Radiology, Seattle, United States
University of Washington, Neurology, Seattle, United States
Robust Evidence of Age-Related Change in the Dynamic Architecture of the Default Mode and Fronto-Parietal Task Control Networks
Overview: Correlations among low frequency spontaneous fluctuations in the blood oxygen level-dependent (BOLD) signal reflect the connectivity of intrinsic large scale networks in the brain. Connectivity within networks has typically been characterized by BOLD signal correlations in different regions over the entire timecourse (mean connectivity). However, the mean correlations between regions varies dynamically. We show that the dynamic connectivity among the nodes of the DMN and fronto-parietal task control network (FPTC) is strongly congruent across individuals, and that weaker synchronization among key network hubs is related to age.
Method: We conducted a chained p-technique factor analysis of the correlations in nonoverlapping temporal windows among pre-identified nodes in the default mode network (DMN) and fronto-parietal task control network (FPTC) across N=143 normal aging subjects (age 56–89) to identify factors that were significantly correlated with age. To examine the stability of the network dynamics, we conducted a split-half validity analysis.
Results: The factor structure of the DMN and FPTC is highly congruent, indicating that the dynamic connectivity patterns as measured by the time-varying correlations of the BOLD signal are largely the same across individuals at rest. In the DMN, a factor loading strongly on the links betweeen the posterior cingulate cortex (PCC) and medial prefrontal cortex (mPFC); and the mPFC and left and right angular gyrus (LAG, RAG) is the only factor related to age r(143)=−.39, p<.001. Figure 1 shows the sliding window correlations between these nodes for an (a) old and (b) young subject. Older subjects displayed lower syncronization across these nodes. In the FPTC, the most significant age-related factor loads on the connections between the left frontal and right intraparietal sulcus (IPS); right dorsolateral prefrontal cortex (dlPFC) and right IPS; left dlPFC and right IPS; and left and right IPS r(143)=−.22, p=.007. Decreased synchronization was related to advanced age.
Sliding window correlations over 40 second windows among nodes of the DMN: PCC, mPFC, LAG and RAG. (a) Older subject (88 yrs) with lowest loading on DMN factor indicating low dynamic correlations among these nodes. (b) Younger subject (64 yrs) with high dynamic correlations among these nodes.
Conclusions: The findings of reduced dynamic synchronization among nodes in the DMN and FPTC with age converge with results of mean functional connectivity analyses, but yield a richer description. These findings are robust among healthy aging subjects.
Support: NIH AG024102, 1RC4NS073008-1
Applications: Psychology
BorghesaniP.1PresnyakovG.2ChaovalitwongseW.A.2WillisS.1GrabowskiT.3
University of Washington, Psychiatry and Behavioral Sciences, Seattle, United States
University of Washington, Industrial & Systems Eng. and Radiology, Seattle, United States
University of Washington, Radiology and Neurology, Seattle, United States
Network Modeling Approaches to Investigate Intranodal Connectivity within the Default Mode Network during Aging
Objectives: Functional connectivity magnetic resonance imaging (fcMRI) defines cerebral networks through correlations in the blood oxygen level dependent (BOLD) signal. Typically, studies focus on network, i.e., inter-nodal, connectivity while assuming that regional, i.e., intra-nodal, activity is homogeneous. However, anatomically proximal voxels may function autonomously while distant voxels (within the node) may be connected. We explore this using graph theory methods for intra-nodal analysis within the default mode network (DMN). We propose network modeling of individual DMN nodes will be sensitive to differences in cognitive aging.
Methods: Resting state fcMRI data was collected in 29 typically aging adults (age 62±3, range 57–67; no overt cognitive impairment) who were part of the Seattle Longitudinal Study (Schaie 2005) and for whom > 10 years of cognitive testing results were available; 15 had declining executive function and 14 had comparatively stable executive function. Standard independent component analysis (ICA) and seed-based approaches were used to identify and compare the DMN between groups. For intra-nodal modeling, the DMN was decomposed into 6 regional nodes, including medial prefrontal, posterior cingulate, lateral parietal and medial temporal regions, bilaterally. Models used include (a) a mesh network (i.e., all pair-wise voxel correlation within the node), (b) a maximum spanning tree (i.e., MST - the average correlation of the most highly correlated tree that connects all voxels), and (c) a spatially-constrained maximum spanning tree (i.e., SCMST similar to MST but requiring the tree to connect adjacent voxels).
Results: Although standard dual regression methods did not reveal group differences, subjects with declining executive function manifested reduced intra-nodal connectivity in the medial temporal nodes (Figure 1). Network models were variably informative, with maximum spanning tree generating the lowest p-values (Figure 2). In comparison to spatially-constrained trees, including non-adjacent voxels in the tree network may provide optimal information regarding node function (Figure 3).
Bar plot comparing average absolute correlations of the maximum spanning trees of all 6 DMN nodes between decliners and controls, where the Left Medial Temporal node yields significant difference between the two populations (p-value < 0.01).
Bar plot comparing the p-values of statistical difference testing between decliners and controls of different network models in all 6 DMN nodes, where the Left Medial Temporal node yields significant difference between the two populations in all three network models and the maximum spanning tree provides the lowest p-value (p-value < 0.01).
(a) Adjacency matrix of voxels in the Left Medial Temporal node of Subject 4, where the red entries indicate that two voxels are adjacent; (b) All pair-wise correlation matrix of the node in (a), whose average of all entries was used to model the mesh network connectivity; (c) Connectivity matrix of the maximum spanning tree; (d) Connectivity matrix of the spatially constrained maximum spanning tree. Link to the texts: Comparing figure 3 (c) and (d) show high distant correlation within the node.
Conclusions: Intra-nodal connectivity assessed with network modeling provides information about node, and network, function beyond that obtained through typical inter-nodal comparisons and will expand our understanding of fcMRI.
Applications: Neurology
KilpatrickL.1TillischK.1NaliboffB.1LabusJ.1JiangZ.1MayerE.1FarmerM.2ApkarianA.V.2MackeyS.3JohnsonK.3ClauwD.4HarrisR.4DeutschG.5NessT.5YangC.6MullinsC.7
UCLA Oppenheimer Center for Neurobiology of Stress, Medicine, Los Angeles, United States
Northwestern University, Chicago, United States
Stanford University, Stanford, United States
University of Michigan, Ann Arbor, United States
University of Alabama, Birmingham, United States
University of Washington, Seattle, United States
NIDDK, Bethesda, United States
Resting scan alterations in female patients with Interstitial Cystitis/Painful Bladder Syndrome: Preliminary data from the Multi-disciplinary Approach to the Study of Chronic Pelvic Pain (MAPP) Network
The Multi-disciplinary Approach to the Study of Chronic Pelvic Pain (MAPP) Network is a multi-site endeavor to identify epidemiological and neuroimaging parameters to advance clinical phenotyping and treatment efforts for urological chronic pelvic pain, including interstitial cystitis/painful bladder syndrome (IC/PBS). The current study consists of pooled resting scan data collected between Fall 2010–Fall 2011. We examined oscillation dynamics of intrinsic brain activity in female IC/PBS patients without comorbidities (n=27) and female healthy controls (HCs; n=45) collected during a 10-minute resting fMRI scan. TheBOLDsignal was transformed to the frequency domain and relative power was computed for low (0.01–0.05 Hz), mid (0.05–0.12 Hz), and high (0.12–0.25 Hz) frequency bands. Sensorimotor-related regions (primary somatosensory, paracentral lobule, superior parietal, and supplementary motor area) demonstrated significantly less high frequency power and greater low/medium frequency power in patients compared to HCs. In addition, several regions with both sensorimotor and limbic-related connections (insula, middle frontal gyrus, precuneus/retrospenial cortex) demonstrated significantly greater high frequency power and less low/medium frequency power in the patient group. An independent component analysis (ICA) confirmed that all of the regions demonstrating altered oscillation frequency were contained within a sensorimotor network (SN), previously reported (Smith et al, 2009). Interregional correlations in frequency power suggest altered relationships between lateral and medial SN regions as well as altered relationships between primary somatosensory cortex, insula, and mid frontal gyrus in patients. These findings suggest the presence of alterations not only in the insular cortex, but in the extended sensorimotor network of female IC/PBS patients. These findings are consistent with a previous report demonstrating reduced sensorimotor gating in female IC/PBS patients reflecting a decreased ability to adequately filter incoming information (Kilpatrick et al, 2010). Thus, a possible mechanism contributing to altered interoceptive information processing in IC/PBS may be the presence of a generalized alteration in sensorimotor gating/pre-attentive processing.
National Institute of Mental Health, SFIM, Bethesda, United States
NIMH, FMRI Facility, Bethesda, United States
Identification of most and least stable connections in resting state fMRI during an hour long continuous resting scans
Introduction: Although it is common to assume temporal stationarity of resting state networks for the duration of a resting scan (5−10 mins), recent studies have shown that resting state network show a dynamic behavior and that they vary their configuration at a smaller time scale. The purpose of this work is to study the temporal stability of resting state connectivity within a continuous 1 hour resting state scan. We look both at long term (>7 minutes) and short term (<5 minutes) stability.
Methods: 54 minutes resting scans were acquired on 5 subjects on a 7T scanner using a TR of 400ms. The scans include a slab of 11 slices placed to partially include the motor, visual and default mode networks. A subset of 40 spherical ROIs from Dosenbauch et al. (Science 2010) that intersect the functional field of view were used as nodes for the connectivity analysis. A running window correlation analysis with different window lengths (2–30 mins) was used to evaluate stability. Most stable and least stable connection pairs across all subjects were also identified.
Results:Figure 1 shows the connectivity matrix for representative subject for non-overlapping window durations of 54, 30, 15 and 7.5 minutes. Connectivity varies across windows even thought their duration exceeds 5 minutes. Figure 2 shows most stable connections, which concentrate on medial occipital regions. Figure 3 shows least stable connections, which seem to originate from right parietal regions.
FIG. 1.
FIG. 2.
FIG. 3.
Conclusions: resting state networks vary their configuration considerably during 1 hour scans. Using durations longer than 5 minutes we can still observe within subject differences across time-slots. Occipital regions seem more stable than parietal regions in their connectivity profile.
Applications: Psychology
Di MartinoA.1KellyC.1CheungB.2MennesM.13CastellanosF.X.1MilhamM.2
NYU Child Study Center, Child Psychiatry, NY, United States
Child Mind Institute, Center for the Developing Brain, New York, United States
Donders Institute for Brain, Dept. of Cognitive Neuroscience, Nijmegen, United States
Toward individually-based biomarkers of verbal proficiency in Autism
Question: Verbal proficiency in 6 year-olds with Autistic Disorder (AD) is a prognostic factor of long-term functioning. As a first step toward identifying biomarkers as early as the first identification of AD, we characterize the neuronal underpinnings of verbal proficiency in children with AD. By means of resting-state fMRI (R-fMRI), we first examined intrinsic functional connectivity (iFC) of language-based circuits in a sample of school-age children. Then, to explore the stability of the identified marker(s), we examined its relationship with verbal proficiency in an independent group of preschoolers with AD.
Methods: Two samples of children with AD included: 34 school-age kids (age 11±2yrs) completing an awake R-fMRI scan; and 20 preschoolers (age 60±10months) completing a R-fMRI scan during natural sleep. To examine iFC of language circuits we focused on the left inferior frontal gyrus (IFG): the pars triangularis (pt), pars opercularis and ventral premotor cortex. We indexed verbal proficiency with the Vineland Expressive Language (VEL) standard scores of expressive language skills. In the 34 school-age children with AD, we examined the relationship between VEL scores and inter-individual differences in iFC patterns associated with each of the IFG seeds, at the voxel-wise, whole-brain level (Z>2.3, p<0.05, Gaussian random field theory corrected). Then, we examined the relationship between iFC of circuit(s) identified in the first step with the individual VEL score in the preschoolers with AD. We plan to apply one-class support vector machine to examine whether pattern of iFC can classify verbal proficient children with AD from those with poor verbal proficiency.
FIG. 1.
Results: Voxel-wise analyses showed a significant positive relationship between VEL scores and the iFC between left IFGpt and a cluster in the posterior aspects of the right superior temporal sulcus (STS) in the school-age kids.Guided by this finding, we correlated the iFC within this circuit with VEL scores of 20 preschoolers with AD.The iFC of this circuit explained 16% of the variance in verbal proficiency (r=0.40).
Conclusions: R-fMRI during natural sleep provides a feasible means for identifying loci of disconnection in autism that may serve to identify prognostic markers of verbal proficiency at the individual level at the time of first diagnosis.
Applications: Neuroradiology
HafkemeijerA.123Altmann-SchneiderI.1van BuchemM.13van der GrondJ.1RomboutsS.123
Leiden University Medical Center, Radiology, Leiden, Netherlands
Leiden University, Institute of Psychology, Leiden, Netherlands
Leiden University, Leiden Institute for Brain and Cognition, Leiden, Netherlands
ICA reveals age dependency of structural covariance networks in elderly
Background: Analysis of structural covariance networks (SCNs) is a powerful technique to study networks in the brain. SCNs show correspondence with resting state fMRI networks. The effect of aging and white matter lesions on SCNs is underexplored. Here we investigate the association between age, severity of white matter lesions and SCNs in healthy elderly.
Methods: Structural MRI scans were tissue type segmented using voxel-based morphometry of FSL. Independent component analysis (ICA) was performed on the gray matter maps of 370 elderly between 45 and 85 years. This method defines structural components based on the covariation of gray matter volume among subjects. Dimensionality estimation was set on ten components. The effect of age on the amount of gray matter within each of the SCNs was analyzed with a univariate analysis of variance in SPSS (corrected for gender). ANOVA was used to study the correlation between white matter lesions and SCNs (corrected for gender and age). Results: The amount of gray matter within each of the ten SCNs is negatively correlated with age (fig. 1). Strongest correlations are found in a network with nucleus accumbens, hippocampus, thalamus, putamen, PCC, cuneus, precuneus as main regions (p<0.0001, R2=0.369, fig. 2) and in a somatosensory network (p<0.0001, R2=0.252). Weakest correlations are found in two cerebellum networks (p=0.001, R2=0.042 and p=0.006, R2=0.034). Nine of ten SCNs show a negative correlation with the severity of periventricular and subcortical white matter lesions (p<0.01). Conclusion: This study demonstrates that age-dependent covariation of gray matter is organized in networks in elderly. Five of the SCNs show a strong correlation with age, while the age-dependency of the other five SCNs is weak (fig. 1). We also demonstrate that the severity of white matter lesions is associated with gray matter networks, independent of age.
Structural covariance networks. In all ten SCNs the amount of gray matter is negatively correlated with age. SCNs are ordered such that SCN 1 (fig. 2) shows the strongest correlation with age and SCN 10 the weakest. All SCNs, except SCN 9, show a negative correlation with white matter lesions.
Correlation between gray matter volume and age. The strongest correlation between gray matter volume and age is found in SCN 1 (fig. 1).
Data Analysis
GantnerI.1GuldenmundP.1GomezF.1VanhaudenhuyseA.1BoverouxP.1LaureysS.1SodduA.1
University of Liège, Coma Science Group, Liège, Belgium
Propofol induced unconsciousness: fMRI total neuronal activity and resting state networks
Objectives: To date, there is no consensus on the mechanisms by which anesthetic drugs induce loss of consciousness. Resting state fMRI studies have identified several brain networks including the default mode network, executive control networks, auditory and visual networks. Our aim was to analyze the effects of propofol anesthesia by investigating changes in relevant resting state networks functional connectivity patterns and in a total neuronal single scalar map obtained combining all resting state networks of neuronal origin.
Methods: Data from 18 healthy participants were acquired at resting state in four conditions: wakefulness, mild sedation, unconsciousness and recovery of consciousness, using 3T-fMRI. Independent component analysis identified 30 components which were tested for neuronality using both temporal and spatial properties. All neuronal components were then combined to create scalar maps of total neuronal activity. A repeated measures general linear model (random effects analysis) tested for significant differences between conditions. In a second analysis we selected 7 relevant networks through template matching, that had significant activation over all four conditions and we examined their pattern of activity across conditions.
Results: Analysis of the scalar maps revealed a significant decrease in resting state total neuronal activation with loss of consciousness and several areas in the prefrontal, parietal and temporal lobe that correlated negatively with the state of consciousness (p<0.03 whole brain FWE correction, Figure 1). The default mode and bilateral executive control networks correlated negatively with state of consciousness, whereas left and right visual networks stayed stable over the conditions. The sensorimotor and auditory network showed a paradoxical effect of increased thalamic activity with mild sedation.
Brain regions negatively correlated to loss of consciousness with FEW correction p < 0.05 (yellow) and uncorrected p < 0.0001 (red).
Conclusion: The creation of a single total neuronal scalar map made it possible to identify regions in the whole brain that are modified by propofol. While primary processing networks remain active in decreased levels of awareness, higher order functioning networks become disintegrated. Our findings suggest that functioning in higher order fronto-parietal networks is diminished through anesthesia, leading to loss of consciousness.
Applications: Psychology
BærentsenK.1HansenM.2Stødkilde-JørgensenH.3
University of Aarhus, Psychology, Aarhus C, Denmark
Aarhus University Hospital, Department of Otorhinolaryngology, Aarhus C, Denmark
Aarhus University Hospital, Department of Clinical Medicine - The MR Research Centre, Aarhus N, Denmark
Resting State Network Activity Correlations
Previously we have found systematic variations in the level of correlation and synchronisation of RSN component brain processes during different cognitive tasks (5, 6). Here we present further evidence supporting the hypothesis that meditation may be understood as a dynamically stable state of mind characterised by adaptive compensation for disturbances (4).
22 subjects (mean age 45 yrs) with meditation experience (mean experience 12 yrs) were scanned with fMRI while performing fingertapping, rest, meditation on-off and uninterrupted meditation (fig 1).
FIG. 1.
ICA was carried out using FSL (9, 11), see (3, 4, 5). In each scanning 8 Resting State Networks (RSN) were selected corresponding to RSN a-h; see (2). Time series of RSN's were correlated with temporal shifts of ±13 acquisitions (±45.5 seconds). The maximal correlation and the Temporally Shifted Acquisition (TSA) at which it occurs were recorded (fig 2).
FIG. 2.
In the epoch related scans fingertapping shows a skewed normal distribution of RSN correlations, with a local peak at r=+0.3, while meditation on-off scans show bimodal distributions (most pronounced in meditation on-off 2). Peaks in on-off 1 were at r=+0.2 and −0.4, and in on-off 2 at r=+0.6 and r=−0.7.
The baseline 1 scan shows a skewed normal distribution of RSN correlations with a local peak at r=+0.2, whereas in baseline 2 the peak is located at r=−0.3.
The continuous meditation scan shows a normal distribution of RSN correlations, but is not comparable to the other sessions due to differing durations. When divided into comparable sections, all sections reveal normal distributions of correlation coefficients, with no local peaks different from r=0.
The correlation of components reflect their linking together to form functional systems realizing the given cognitive task (1). During meditation on-off all components lock together shifting from unstructured thinking to meditation, i.e. absence of thought. During resting state the low level of correlation reflects the incoherence and discontinuity of a mind spontaneously wandering between thoughts (i.e. “disturbances”, see 7). The especially low level of correlation during continuous meditation reflects the maintenance of a non-thinking yet focused state of mind, in which attention escapes any particular thought or impression (“concentration”, see 7).
Applications: Neuroradiology
KlaassensB.123Altmann-SchneiderI.1Van der GrondJ.1Van BuchemM.12RomboutsS.123
Leiden University Medical Center, Radiology, Leiden, Netherlands
Leiden University, Leiden Institute for Brain and Cognition, Leiden, Netherlands
Leiden University, Psychology, Leiden, Netherlands
Hippocampal volume is associated with functional connectivity in the salience network
Introduction: In Alzheimer's disease, RS-FMRI connectivity within the default mode network (DMN), including hippocampal regions, decreases while RS-FMRI connectivity in the so-called salience network has been shown to increase. A key feature of Alzheimer's disease is atrophy of the hippocampus, suggesting an association of hippocampal atrophy with DMN and salience network RS-FMRI connectivity. Here we study the relation between RS-FMRI networks and hippocampal volume in healthy elderly.
Methods: Resting state network connectivity of 72 healthy elderly subjects (M age: 65 years; SD: 6.9; age range: 47–80) was investigated with RS-FMRI. After preprocessing, RS-FMRI networks were extracted using a dual regression analysis with FSL based on eight standard network templates, including the DMN and the salience network. Regional linear relationships between RS-FMRI connectivity with each of these networks, and hippocampal volume were examined voxel-wise at p<0.05, corrected.
Results: RS-FMRI connectivity of parts of the prefrontal cortex and anterior cingulate cortex with the rest of the salience network showed a negative correlation with hippocampal volume (see Figure 1). Other regional RS-FMRI connections were not correlated with hippocampal volume.
RS-FMRI connectivity between parts of the prefrontal cortex and anterior cingulate cortex (depicted in red) and the salience network showed a significant negative correlation (p<0.05, corrected) with hippocampal volume in healthy elderly
Discussion: A smaller hippocampus is associated with higher RS-FMRI connectivity in the salience network in healthy elderly. This relation corresponds to features of Alzheimer's disease, in which less hippocampal volume and an increase in salience network activity have been demonstrated.
Data Analysis
MarguliesD.1SchaeferA.2BoettgerJ.1BernhardtB.2LohmannG.2
Max Planck Institute for Human Cognitive and Brain Sciences, Neuroanatomy & Connectivity, Leipzig, Germany
Max Planck Institute for Human Cognitive and Brain, Leipzig, Germany
Mapping Functional Connectivity Transitions on the Individual-Level
Question: In order to study consistent and highly specific neuroanatomy across individuals, it would be valuable to have a tool which could provide insights into areas of local connectivity-based cortical segregation. An approach pioneered by Cohen et al. (2008) innovated such a method of transition-mapping using the eta2 distance metric. However, certain biases of the method towards network size suggest room for methodological improvement. In the current study, we present methods aiming to map transitions in connectivity on the local level, providing maps for subsequent investigation of consistent connectivity patterns across individuals.
Methods: The novel aspects of this approach include: 1) thresholding the correlation values, which allows only areas of significant functional connectivity to be included in the distance calculation; 2) the Dice coefficient to test similarity between only adjacent vertices, thereby ensuring that multiple instances of global boundaries do not outweigh finer-grained results.
Data was acquired at four time sessions (two weeks apart), and consisted of a standard functional sequence with 400 volumes (see Taubert et al, NeuroImage, 2010). After standard preprocessing, extraction onto the surface, and 6mm smoothing, the full correlation matrix was calculated across all vertices, and thresholded at 0.05 increments from r>0.2 to 0.5. Similarity of neighboring thresholded functional connectivity maps was calculated using the Dice coefficient. Results were compared across thresholds, time-points, and within session on the individual-level.
Results: In general, the transition maps show discrete boundaries most clearly surrounding primary visual, primary somatomotor, and supramarginal gyrus (Fig 1). Several similar connectivity patterns could be discerned from more complex prefrontal areas by using the transition map for individualized orientation. The main lines of transition were unaffected by the selection of threshold (Fig 2), and reliable during (Fig 3) and across multiple scans within the same individual (Fig 4).
FIG. 1.
FIG. 2.
FIG. 3.
FIG. 4.
Conclusions: The transition maps appear reliable, informative of connectivity boundaries, and to have a subtle distribution of transitions, especially through more complex associative areas of cortex.
Lyon neuroscience center, Lyon, france, France
Functional role of transient reduction of activity in the default-mode network (DMN) and the ventral attentional network (VAN)
Functional neuroimaging studies have shown that the default mode network (DMN) displays an elevated activity during resting state and a systematic reduction of activity during attention demanding task. The functional significance of this network deactivation remains largely debated and cannot be completely resolved without accessing its fine-scale temporal dynamics. In recent studies, intracranial and MEG recordings have been used to explore the electrophysiological underpinnings of the human DMN. Using a visual search task we recently showed that the deactivation in the DMN, but also in the ventral attentional network (VAN), is correlated with the task complexity and the individual performance and could encode the attentional engagement for external stimuli (Ossandon et al 2011).
Intracranial recordings were obtained from 11 epilepsy patients performing a high attention-demanding discrimination task (emotion discrimination) and a low attention-demanding detection task (color detection). We observe the same brain-wide pattern of high gamma power suppression which we previously reported in the visuospatial search task (figure-top), and confirm the relation-ship between power decreases and task difficulty. But, we also found that the power suppression was more pronounced for the target facial expression (fear) in the emotion discrimination task, and was only significant for the target stimuli in the color detection task (figure-bottom).
A: Anatomical distribution of gamma band suppression. B. Example of time course of deactivation (medial prefrontal cortex) for the color detection task (green) and the emotion discrimination task (blue) In both task, target stimuli (dotted line) elicited a stronger deactivation.
These results provide novel insights into the functional role of DMN and VAN deactivation that would not reflect a global attentional engagement to external stimuli but the detection of task-relevant stimuli or the involvement in a goal-directed behavior.
Applications: Neuroradiology
ZhangH.1ChenF.2
Center for Cognition and Brain Disorders, Hangzhou, China
No.1 Affl. Hosp. Fujian, Fuzhou, China
Brain Tumor Localization Using Resting-State FMRI and Independent Component Analysis
For glioma, a common type of malignant tumor, due to the infiltrating characteristic, its border is often hard to define and always blurred seeing from structural MR image. Functional MR imaging (fMRI) has been utilized in presurgical planning. Just two or three years ago, resting-state fMRI (R-fMRI) has been adopted in this field. However, studies are only for localizing eloquent functional areas (i.e., sensorimotor, language), none of them deal with localization of tumor. Such ignorance has reasons: 1) tumor border was thought to be easier to delineate (which is in fact not the case), 2) seed region is difficult to define since tumor tissue is highly heterogeneous. Here we propose a tumor localization method using R-fMRI and independent component analysis (ICA). A consistent group ICA method “SOI-GICA” (http://www.nitrc.org/projects/cogicat/) was utilized to decompose 2-session R-fMRI data from two glioma patients (1: age 19, male; 2: age 18, male) scanned by Siemens 3T Verio in No. 1 Affl. Hosp. Fujian, China. Echo-PIanar BOLD Images were acquired with TR/TE=2000/30, matrix=64*64, voxel size=3.125*3.125*3, gap=0.6, FA=90 deg. ICA parameters were: component number=20, ICA algorithm=infomax, number of ICA runs=10, scaling method=z-score and randomized initial value. Tumor-related component was visually identified, with only one tumor-related component for each patient. Result clearly shows that such a component spatially overlaps with the T2-revealed tumor tissue (Figs. 1, 2). Moreover, the result indicates the potential tumor region in the blurred areas of the T2 image. To find whether the ICA parameters influent the final result, we also tested various preset component numbers (10, 30, 60), different data preprocessing and calibration methods. The results were consistent. Of note, this is only a preliminary study; larger sample is now gathering. The result should also be compared with the data collected during surgery to further validate “real” tumor border. The pattern of ICA-derived time course of the tumor component should also be investigated. In conclusion, ICA serves a good method to localize glioma tumor. This study has promising clinical significance in presurgical planning, which enable a better assessment of the relationship of tumor tissue and the adjacent functionally essential areas.
Max Planck Institute for Human Cognitive and Brain Sciences, Research Group Neuroanatomy and Connectivity, Leipzig, Germany
Max Planck Institute for Human Cognitive and Brain Sciences, Department of Neurology, Leipzig, Germany
Max Planck Institute for Human Cognitive and Brain Sciences, Department of Neurophysics, Leipzig, Germany
Max Planck Institute for Human Cognitive and Brain Sciences, MEG and Cortical Networks, Leipzig, Germany
Berlin School of Mind and Brain, Berlin, Germany
Three-dimensional force-directed edge-bundling of functional connectivity
Question: Visualizing a full graph of functional connectivity in a single three-dimensional anatomical rendering would help for intuitive investigation of brain organization. Since drawing connections in high-resolution data as straight lines suffers from heavy overdraw, we employ the non-hierarchical edge-bundling method. This approach visually changes the shape of the connections by grouping similar edges together. In order to make this possible in anatomical space, we implemented the method for three-dimensional data.
Methods: We preprocessed and co-registered 127 resting-state fMRI datasets. For each dataset, we calculated a connectivity matrix using Pearson correlation between the average time-series of 463 ROIs from a whole brain atlas, which were generated via spatially constrained spectral clustering of the boundary surface between gray and white matter. After Fisher's r-to-z transformation, we averaged correlations across subjects, and included connections with z>0.3 and a length > 20 mm between the centers of gravity of the ROIs.
We then applied force-directed edge-bundling. After calculating a measure of similarity using several criteria such as length and direction, it iteratively subdivides the edges, and simulates electrostatic attraction between similar edges. The result is spline-like bundles of grouped connections. For the visualization, we superimposed the edge bundles on a single surface derived from a Freesurfer extraction.
Results:Figure 1 shows that while using straight edges (left) the underlying structure is hard to discern, after bundling, more structure becomes visible (right). The most obvious feature in the superimposed visualizations (Figures 2–4) is the sensori-motor system (1). Also visible are several other bundles of long-range connectivity, such as the midline component of the default-mode network (2), as well as the visual (3) and dorsal fronto-parietal (4) networks.
FIG. 1.
FIG. 2.
FIG. 3.
FIG. 4.
Conclusions: Our preliminary results suggest that visualizing the full connectivity information in a single image is a valuable tool in the exploration of the human connectome. Edge-bundling offers a method from the data visualization community to help clarify the combined complexity of integrating graph information with three-dimensional space - a problem at the heart of understanding the brain.
Applications: Psychology
RypmaB.1
University of Texas at Dallas, Behavioral and Brain Sciences, Richardson, United States
Connectivity dynamics underlying age differences in processing speed
Psychometric research has revealed consistent differences among individuals in the speed with which they can perform simple and more complex cognitive tasks. This observation has led to hypotheses that the efficient use of limited sets of cognitive operations governs performance across a broad range of tasks. FMRI research suggests lateral prefrontal cortex (PFC) mediates this cognitive efficiency. Research also has revealed age-related slowing on measures of cognitive processing speed and that age-related processing speed declines account for significant age-related variability in performance on a variety of more complex cognitive tasks. These results suggest that age-related cognitive declines, in general, are due to declines in the efficient use of basic cognitive processes. The present study used FMRI to examine the neural basis for age-related differences in connectivity patterns mediating cognitive efficiency. On each trial, participants determined whether a paired symbol and number appeared in a key of nine symbol-number pairs (a rapid event-related design; 153 trials over three 6 minute runs). In previous work, faster younger adults showed less BOLD signal-change within PFC than slower younger adults, but faster older adults showed greater BOLD signal-change within PFC than slower older adults. Granger causality analysis was used to evaluate feed-forward and feed-back functional connectivity to the three identified PFC regions, controlling for the autocorrelation and influence of non-target ROIs with each regression. Feed-forward and feed-back connectivity to the different PFC regions varied with age and performance. However, Age X Performance interaction effects in feed-forward connectivity estimates also were observed in frontal, parietal, temporal, and insula regions, and interaction effects in feedback-feedforward connectivity estimates also were observed in visual association, parietal, and motor regions. The results provide evidence for age differences in PFC integration and modulation functions mediating processing speed.
Applications: Neuroradiology
WhitlowC.1MaldjianJ.1
Wake Forest School of Medicine, Radiology - Neuroradiology, Winston-Salem, United States
Brain Intratumoral Graph Theory Network Metrics Can Be Computed from Resting-State BOLD Signal and May Vary by Tumor Histological Subtype
Objective: The objective of this study was to determine if graph theory network metrics could be acquired from glial cell brain tumors using RS-BOLD. We hypothesized that some network metrics might vary according to glial tumor grade.
Methods: Four patients with brain tumors were scanned for collection of structural T1- (Figure 1) and T2-weighted (Figure 2) MRI, as well as RS-BOLD data as part of routine presurgical fMRI motor and language mapping at Wake Forest School of Medicine. Pearson correlation coefficient was computed between all pairs of node time series within the brain and tumor to generate a correlation matrix (Cij), which was thresholded and dichotomized to generate a binarized adjacency matrix (Aij) for each patient's tumor at a cost of 0.3. Graph theory metrics were then computed in the standard fashion to evaluate the effects of tumor histologic subtype on functional intratumoral network connectivity.
FIG. 1.
FIG. 2.
Results: Patients included a 69 y.o. female with right frontoparietal glioblastoma multiforme (GBM) (Grade IV), 42 y.o. female with left temporal astrocytoma (Grade II), 37 y.o. male with left frontal oligodendroglioma (Grade II), and 45 y.o. male with right frontal oligodendroglioma (Grade II). All tumors demonstrated functional network connectivity with the surrounding cerebral and cerebellar hemispheres (Figure 3), as well as dense functional intratumoral network connectivity (Figure 4). Comparison of network metrics between astrocytomas and oligodendrogliomas demonstrated similar values for clustering coefficient (p>.05), characteristic path length (p>.05), local efficiency (p>.05), and global efficiency (p>.05), with a trend towards significance for differences in small-worldness (p=0.06).
FIG. 3.
FIG. 4.
Conclusion: Intratumoral graph theory network metrics can be computed from RS-BOLD signal, and may vary by tumor histological subtype. Higher histologic grade astrocytomas demonstrated greater small worldness than the lower grade gliomas, suggesting a less random and more organized pattern of intratumoral connectivity. Such connectivity properties may help to explain the more infiltrative and aggressive nature of astrocytomas compared to oligodendrogliomas. Further characterization of network characteristics of brain tumors could potentially lead to novel functional imaging biomarkers with which to study disease progression, guide therapy and predict patient outcomes.
Support vector classification and prediction of resting-state functional connectivity over the lifespan
Objektive: Multivariate classification is an important alternative to univariate techniques in studying functional connectivity. Following recent work (Dosenbach 2010), this study extends the investigation of predicting brain age to the entire lifespan.
Methods: Resting-state functional MRI data were collected on 3T GE scanner using a spiral-in acquisition, with parameters (TR/TE/FA=2000/30/90, 40–43 slices, 3.44×3.44×3mm resolution). Anatomical T1 overlays matching the prescription of the functional data and whole-brain T1 SPGRs were also collected. 188 subjects in total were scanned (73<18 years old, 38 18–50, 77>50), with eyes open using a fixation cross during the resting state.
MR data preprocessing: All data was preprocessed using SPM8, including slice timing correction and realignment; anatomical coregistration and segmentation, normalization to MNI space, and spatial smoothing (5mm FWHM). Functional connectivity analysis: Preprocessed resting-state data were then detrended, and CSF/WM timecourses and head motion parameters regressed out. Data were then bandpass filtered (0.01–0.1 Hz). 160 ROI timecourses (defined in Dosenbach 2010) were extracted and correlated with each other for every subject. The resulting functional connectivity matrices were then used in the multivariate analysis. Support vector analysis: Support vector machine learning was performed using the 3dsvm toolbox in AFNI. Binary SVM classification was performed using a linear kernel and multistate classification, using young (<18), middle (18–50), and old age (>50) as labels. Support vector regression was performed using an epsilon width of 0.1. Leave-one-out cross-validation (LOOCV) was used to calculate accuracies and predicted values.
Results: SVM classification results in 87% in classifying young vs. old, 75% for middle vs. old, and 68% for young vs. middle. Support vector regression resulted in a predicted brain age that tracked well with chronological age (see Figure 1).
Chronological age vs predicted brain maturity. Maturity values are normalized to predicted value at 40 years of age.
Conclusion: Resting state functional connectivity, combined with multivariate analysis, can be used to examine and predict internal maturational state across the lifespan.
Pharmacology
ColeD.12OeiN.3SoeterR.3BothS.3van GervenJ.4RomboutsS.3BeckmannC.125
University of Oxford, FMRIB Centre, Oxford, Netherlands
Imperial College London, London, Netherlands
Leiden Institute for Brain & Cognition, Leiden, Netherlands
Center for Human Drug Research, Leiden, Netherlands
Donders Institute for Brain, Cognition & Behaviour, Nijmegen, Netherlands
Dopamine-dependent resting-state network cortico-subcortical functional connectivity
Introduction: Maladaptive dopaminergic mediation of reward processing in humans is thought to underlie multiple neuropsychiatric disorders, including addiction, Parkinson's disease and schizophrenia1–3. Mechanisms responsible for the development of such disorders may depend on individual differences in neural signaling within large-scale cortico-subcortical circuitry4,5. We used a combination of blood-oxygenation level-dependent (BOLD) functional magnetic resonance imaging (FMRI) during psychological rest and pharmacological challenges in healthy volunteers. Our analyses looked for opposing dopamine agonistic and antagonistic neuromodulatory effects on distributed functional interactions between specific subcortical regions and corresponding neocortical ‘resting-state’ networks (RSNs), known to be involved in distinct aspects of cognition and reward processing5,6.
Methods: We compared cortico-subcortical RSN functional connectivity in resting-state FMRI data from 3 groups of healthy volunteers given fixed-dose dopamine antagonist (haloperidol, 3 mg; N=18) or agonistic (L-dopa, 100 mg; N=16) drugs, or a placebo (N=15). A seed-based partial correlation analysis7 technique was employed to calculate voxel-wise subcortical ‘seed’ functional connectivity with distinct ‘target’ neocortical RSNs, the latter defined by multi-session probabilistic independent component analysis6 of the placebo group data. We created a large subcortical seed mask for each individual via (i) T1 structural segmentation8 of the bilateral thalamus, amygdala, hippocampus, pallidum and the entire striatum and (ii) nonlinear registration to subject FMRI-space of these volumes and six other midbrain template9 regions. We then correlated the BOLD time series at each mask voxel with the first BOLD eigenvector of each subject-space target RSN, controlling for other RSN, motion and non-grey matter signals. We used General Linear Modelling and nonparametric permutation testing to identify significant dopaminergic drug effects (e.g., L-dopa>placebo>haloperidol) on RSN cortico-subcortical functional connectivity (cluster t>2.3, p<0.05, corrected). Correlations of dopamine-dependent RSN connectivity effects with self-report impulsivity measures10 were also explored.
Results: We found that, relative to a placebo, L-dopa and haloperidol challenges respectively increased or decreased the functional connectivity between: (a) the midbrain and a ‘default mode’ network (DMN; Fig. 1Ai-ii); (b) the right caudate and a right-lateralised frontoparietal network (Fig. 1Bi-ii); and (c) the ventral striatum and a fronto-insular salience/executive network (Fig. 1Ci-ii). In addition, the dopamine-dependent connectivity between the DMN and midbrain regions was significantly negatively correlated with trait impulsivity in the haloperidol group (r=−0.58, p=0.012; Fig. 1Aiii), differentially to a positive (although non-significant) relationship in the L-dopa group (z=2.1, p=0.038) and in an opposing direction to similar (trend) differential correlations (Fig. 1Biii) between impulsivity and right caudate-frontoparietal RSN connectivity.
Significant linear effects of antagonistic (haloperidol) and agonistic (L-dopa) dopaminergic neuromodulation on cortico-subcortical resting-state network functional connectivity (N = 49) and correlations with subject BIS-11 impulsivity scores. (A) (i) Default mode network (DMN)-midbrain connectivity shows (ii) a linear effect (t > 2.3, p < 0.05, family-wise error-corrected) of treatment (Ldopa > placebo > haloperidol), which (iii) is negatively correlated with impulsivity (BIS-11) within the haloperidol group, differentially to within the L-dopa group. (B) (i) Right frontoparietal control network (FPN)-caudate connectivity shows (ii) a similar linear effect and (iii) a trend towards an opposite relationship with impulsivity to theDMN-midbrain result. (C) (i) Salience/executive network (SEN)-ventral striatum connectivity shows (ii) the same linear drug effect but (iii) no significant interaction with impulsivity. Left panels: RSNs presented in orange, subcortical regions in green. Centre panels: Boxplots represent mean connectivity scores (–95% confidence intervals) for each drug group. Right panels: **Denotes significant within-group correlation with impulsivity (p < 0.05); *Significant difference between two correlation coefficients (p < 0.05); {Near-significant trend towards difference between coefficients (p < 0.07).
Conclusions: Our results demonstrate opposing effects of agonistic and antagonistic dopaminergic challenges on functional connectivity relationships between specific, dopamine-rich subcortical regions and corresponding neocortical RSNs. This implies that RSN functional connectivity can, in some cases, provide an indirect measure of dopamine neurotransmission. Further, we found drug-specific associations between brain circuitry reactivity to dopamine modulation and individual differences in trait impulsivity, revealing dissociable drug-personality interaction effects across distinct, dopamine-dependent cortico-subcortical networks. Our findings identify possible systems (or sub-systems) underlying pathogenesis and treatment efficacy in disorders of dopamine deficiency.
References
BuckholtzJ.W., TreadwayM.T., CowanR.L., WoodwardN.D., LiR., AnsariM.S., BaldwinR.M., SchwartzmanA.N., ShelbyE.S., SmithC.E., KesslerR.M., ZaldD.H.2010. ‘Dopaminergic network differences in human impulsivity’Science, 329,5991:532.DagherA., RobbinsT.W.2009. ‘Personality, addiction, dopamine: insights from Parkinson's disease’Neuron, 61,4:502–510.SchaferM., RujescuD., GieglingI., GuntermannA., ErfurthA., BondyB., MollerH.J.2001. ‘Association of short-term response to haloperidol treatment with a polymorphism in the dopamine D(2) receptor gene’American Journal of Psychiatry, 158,5:802–804.HoneyG.D., SucklingJ., ZelayaF., LongC., RoutledgeC., JacksonS., NgV., FletcherP.C., WilliamsS.C., BrownJ., BullmoreE.T.2003. ‘Dopaminergic drug effects on physiological connectivity in a human cortico-striato-thalamic system’Brain, 126,8:1767–1781.KoobG.F., VolkowN.D.2010. ‘Neurocircuitry of addiction’Neuropsychopharmacology, 35,1:217–238.BeckmannC.F., DeLucaM., DevlinJ.T., SmithS.M.2005. ‘Investigations into resting-state connectivity using independent component analysis', Philosophical Transactions of the Royal Society of London. B - Biological Sciences, 360,1457:1001–1013.O'ReillyJ.X., BeckmannC.F., TomassiniV., RamnaniN., Johansen-BergH.2010. ‘Distinct and overlapping functional zones in the cerebellum defined by resting state functional connectivity’Cerebral Cortex, 20,4:953–965.PatenaudeB., SmithS.M., KennedyD.N., JenkinsonM.2011. ‘A Bayesian model of shape and appearance for subcortical brain segmentation’NeuroImage, 56,3:907–922.LancasterJ.L., WoldorffM.G., ParsonsL.M., LiottiM., FreitasC.S., RaineyL., KochunovP.V., NickersonD., MikitenS.A., FoxP.T.2000. ‘Automated Talairach atlas labels for functional brain mapping’Human Brain Mapping, 10,3:120–131.PattonJ.H., StanfordM.S., BarrattE.S.1995. ‘Factor structure of the Barratt impulsiveness scale’Journal of Clinical Psychology, 51,6:768–774.
Applications: Neuroradiology
AchaibarK.1MhuircheartaighR. Ní1WarnabyK.1DuffE.1JbabdiS.1RogersR.1TraceyI.1
University of Oxford, Nuffield Department of Clinical Neuroscience, Oxford, United Kingdom
Resting state networks under anaesthesia
Background: Despite the thousands of anaesthetics administered daily, we have a poor understanding of the mechanisms of anaesthesia-induced loss of consciousness. Using functional magnetic resonance imaging (FMRI) of resting-state brain activity during the induction of anaesthesia, we examine the pharmacological effects of anaesthetic agents on global brain connectivity.
Methods: Intravenous sedative propofol was administered to healthy volunteers (n=15) by target-controlled infusion. Ten minutes of resting state fMRI (TR=3 s) was acquired in the conscious and sedated state (maximal propofol effect site concentration 4.0 mcg/ml). We applied group independent component analyses (ICA) with temporal concatenation to create spatial maps of resting state networks. These maps were then projected onto the subjects' data to get individual maps (dual regression). Finally, the individual maps were used in paired t-tests to test for reductions between the awake and sedated states in resting state connectivity within each functional network.
Resting State Networks in a) Awake state b) Statistical maps showing reductions in functional connectivity in the sedated state (p<0.05 corrected). Networks shown: 1) visual medial 2) visual occipital 3) auditory 4) default mode network 5) executive. Group mean maps, thresholded z stats=3.
Results: We observed reductions in functional connectivity within the visual medial, visual occipital and auditory networks under propofol sedation. Interestingly, high functioning networks including the default mode and executive networks were largely preserved in the unconscious state.
Conclusion: High functioning cognitive resting state networks are largely preserved under anaesthesia. How these networks are influenced by external stimuli attempting to activate brain regions during states of unconsciousness remains to be determined, as does their broader role in these states of perception loss.
Data Analysis
LordA.12HornD.3BreakspearM.145WalterM.3
Queensland Institute of Medical Research, Systems neuroscience, Brisbane, Australia
University of Queensland, Psychology, Queensland, Australia
Otto v. Guericke University, Psychiatry, Leipzig, Germany
University of New South Wales, Psychiatry, Sydney, Australia
Black Dog Institute, Sydney, Australia
Changes in community structure of resting state functional connectivity in unipolar depression
Major depression is a prevalent disorder that imposes a significant burden on society, yet objective laboratory-style tests to assist in diagnosis are lacking. We employed network-based analyses of ``resting state'' functional neuroimaging data to ascertain group differences in the endogenous cortical activity between healthy and depressed subjects.
We additionally sought to use machine-learning techniques to explore the ability of these network-based measures of resting state activity to provide diagnostic information for depression. Resting state fMRI data were acquired from twenty-two depressed outpatients and twenty-two healthy subjects matched for age and gender. These data were anatomically parcellated and functional connectivity matrices were then derived using the linear correlations between the BOLD signal fluctuations of all pairs of cortical and subcortical regions.
We characterised the hierarchical organization of these matrices using network-based matrics, with an emphasis on their mid-scale ``modularity'' arrangement (figure 1). Whilst whole brain measures of organization did not differ between groups, a significant rearrangement of their community structure was observed (figure 2). Furthermore we were able to classify individuals with a high level of accuracy using a support vector machine, primarily through the use of a modularity-based metric known as the participation index (figure 3).
Modular structure of an individual where brown, green, cyan, yellow and dark blue denote the different modules. Connections are black where they join nodes of different modules and in their respective module colours where they join nodes within modules.
Regions of interest that changed their (rank ordered) participation indices between healthy control and major depressive disorder groups where red denotes an increase in rank from the control group to the depressed group, and blue is the reverse.
Support vector classifier trained to segregate the two groups using the 2 most informative features from the graph metric analysis.
In conclusion, the application of machine learning techniques to features of resting state fMRI network activity shows promising potential to assist in the diagnosis of major depression, now suggesting the need for validation in independent data sets.
Pharmacology
ColeD.12BeckmannC.123OeiN.4SoeterR.4BothS.4van GervenJ.5RomboutsS.4
University of Oxford, FMRIB Centre, Oxford, Netherlands
Imperial College London, London, Netherlands
Donders Institute for Brain, Cognition & Behaviour, Nijmegen, Netherlands
Leiden Institute for Brain & Cognition, Leiden, Netherlands
Center for Human Drug Research, Leiden, Netherlands
Dopamine drug modulation produces linear and nonlinear effects on resting-state network connectivity
Introduction: The possibility that brain dopamine exerts both linear and ‘inverted U-shaped’ (i.e., nonlinear) effects on cognitive function has important implications for the successful treatment of multiple neuropsychiatric disorders, including addiction, schizophrenia and Parkinson's disease1. Systems-level biological characterization of such ambiguous functional effects of dopamine neuromodulation may be provided through functional magnetic resonance imaging (FMRI) measures relevant for maladaptive behaviors in such disorders2,3. We used FMRI during a psychological resting state combined with broad-spectrum dopamine pharmacological challenges, to examine interactions, or ‘functional connectivity’, between distributed activity patterns of brain ‘resting-state’ networks (RSNs), to establish: (i) if nonlinear dopaminergic effects on RSN phenomena could be observed; and (ii) how these might differ from linear effects.
Methods: We compared RSN functional connectivity in resting-state FMRI data from 3 groups of healthy volunteers given fixed-dose dopamine antagonist (haloperidol, 3 mg; N=18) or agonistic (L-dopa, 100 mg; N=16) drugs, or a placebo (N=15). Whole-brain analyses of RSN functional connectivity were performed using a combined temporal concatenation independent component analysis4 and spatiotemporal ‘dual regression’ technique5, focussing on networks highlighted in the literature as relevant for cognition, reward and/or dopaminergic functioning2–4,6,7. We then employed higher-level nonparametric statistics, within a General Linear Model framework, to look for both linear (L-dopa>placebo>haloperidol) and inverted U-shaped (placebo>L-dopa+haloperidol) significant effects (and the inverse contrasts) on RSN connectivity of manipulating dopamine neurotransmission pharmacologically (cluster t>2.3, p<0.05, corrected for family-wise error). Correlations of dopamine-dependent RSN connectivity effects with self-report impulsivity measures8 were also explored.
Results: We found that a (predominantly striatal) basal ganglia/subcortical RSN (Fig. 1A; centre, red-yellow) displayed both linear (Fig. 1Ai) and nonlinear (Fig. 1Aii) significant effects of dopamine manipulation, respectively, in terms of its connectivity with distinct left motor (Fig. 1A; centre, blue; cluster peak MNI co-ordinates: x=−38, y=−26, z=42) and anterior-mid cingulate (Fig. 1A; centre, green; x=4, y=−8, z=36) neocortical areas. Conversely, an anterior sub-system of the ‘default mode’ network (aDMN; Fig. 1B; centre, red-yellow) exhibited significant ‘regular’ (Fig. 1Bii) and ‘inverse’ (Fig. 1Bi) linear dopaminergic effects, respectively, on connectivity with right inferior lateral parietal (Fig. 1B; centre, green; x=52, y=−34, z=46) and left superior posterior lateral frontal (Fig. 1B; centre, blue; x=−40, y=6, z=56) cortical regions. In addition, aDMN connectivity strengths within the parietal region displaying a linear dopamine-dependent association were selectively and differentially negatively correlated with trait impulsivity in subjects given haloperidol (r=−0.51, p=0.031), relative to L-dopa and placebo groups (Fig. 2).
Significant linear and nonlinear effects of dopamine neuromodulation on whole-brain RSN functional connectivity (N=49). (A) Centre: basal ganglia/limbic RSN (BGLN) connectivity with left pre- and post-central gyri/motor cortex (blue) shows (i) a linear effect (t>2.3, p<0.05, FWE-corrected) of dopamine (L-dopa>placebo>haloperidol), while BGLN connectivity with dorsal anterior-mid cingulate (green) displays (ii) a nonlinear effect of dopamine (placebo>haloperidol+L-dopa). (B) Centre; anterior DMN connectivity with left precentral and middle frontal gyri (blue) shows (i) an inverse linear drug effect (haloperidol>placebo>L-dopa), while aDMN-right supramarginal gyrus connectivity displays (ii) the opposite relationship with dopamine modulation. Red-yellow overlays depict functional connectivity within the RSNs themselves, as defined by placebo group ICA.
Drug-specific association between aDMN-parietal connectivity and impulsivity. Antero-centric DMN connectivity in right supramarginal gyrus (see Fig. 1Bii) is significantly negatively correlated with subject impulsivity (BIS-11) scores in the group given haloperidol (r=−0.51, p<0.05 two-tailed, denoted by ‘**’), but not in the placebo or L-dopa group. The connectivity-impulsivity correlation in the haloperidol group is significantly different to that in the placebo group (p<0.02, denoted by ‘*’) and shows trend levels of difference to that in the L-dopa group (p=0.09, denoted by ‘§’).
Conclusions: Our findings highlight the complex and diverse functional effects that acute dopamine neuromodulation has on macroscopic neural interactions at the systems level, as measured by variation in correlated and ‘anticorrelated’ activity within cortico-subcortical and cortico-cortical circuitry. The dopamine-dependent pathways identified are implicated in processes of functional plasticity9 and ‘switching’ processing resources between distinct cognitive networks and associated behaviors1,10. The observation that dopamine modulates these distinct large-scale network functional connectivity patterns differentially, in both linear and nonlinear fashions, provides support for the objective utility of RSN connectivity metrics in classifying the effects and efficacy of psychopharmacological medications.
References
CoolsR., D'EspositoM.2011. ‘Inverted-U-shaped dopamine actions on human working memory and cognitive control’Biological Psychiatry, 69,12:e113–125.a-935a-959KellyC., de ZubicarayG., Di MartinoA., CoplandD.A., ReissP.T., KleinD.F., CastellanosF.X., MilhamM.P., McMahonK.2009. ‘L-dopa modulates functional connectivity in striatal cognitive and motor networks: a double-blind placebo-controlled study’Journal of Neuroscience, 29,22:7364–7378.a-936a-940ColeD.M., BeckmannC.F., SearleG.E., PlissonC., TziortziA.C., NicholsT.E., GunnR.N., MatthewsP.M., RabinerE.A., BeaverJ.D.2011. ‘Orbitofrontal connectivity with resting-state networks is associated with midbrain dopamine D3 receptor availability’Cerebral Cortex[Epub ahead of print]10.1093/cercor/bhr354.a-937a-941BeckmannC.F., DeLucaM., DevlinJ.T., SmithS.M.2005. ‘Investigations into resting-state connectivity using independent component analysis’Philosophical Transactions of the Royal Society of London B - Biological Sciences, 360,1457:1001–1013.a-938a-942FilippiniN., MacIntoshB.J., HoughM.G., GoodwinG.M., FrisoniG.B., SmithS.M., MatthewsP.M., BeckmannC.F., MackayC.E.2009. ‘Distinct patterns of brain activity in young carriers of the APOE-epsilon4 allele’Proceedings of the National Academy of Sciences of the U S A, 106,17:7209–7214.a-939GreiciusM.D., SrivastavaG., ReissA.L., MenonV.2004. ‘Default-mode network activity distinguishes Alzheimer's disease from healthy aging: evidence from functional MRI’Proceedings of the National Academy of Sciences of the U S A, 101,13:4637–4642.a-943SmithS.M., FoxP.T., MillerK.L., GlahnD.C., FoxP.M., MackayC.E., FilippiniN., WatkinsK.E., ToroR., LairdA.R., BeckmannC.F.2009. ‘Correspondence of the brain's functional architecture during activation and rest’Proceedings of the National Academy of Sciences of the U S A, 106,31:13040–13045.a-944PattonJ.H., StanfordM.S., BarrattE.S.1995. ‘Factor structure of the Barratt impulsiveness scale’Journal of Clinical Psychology, 51,6:768–774.a-945TostH., BrausD.F., HakimiS., RufM., VollmertC., HohnF., Meyer-LindenbergA.2010. ‘Acute D2 receptor blockade induces rapid, reversible remodeling in human cortical-striatal circuits’Nature Neuroscience, 13,8:920–922.a-958SridharanD., LevitinD.J., MenonV.2008. ‘A critical role for the right fronto-insular cortex in switching between central-executive and default-mode networks’Proceedings of the National Academy of Sciences of the U S A, 105,34:12569–12574.a-960
Applications: Psychiatry
ScheideggerM.12WalterM.34LehmannM.2MetzgerC.4GrimmS.256BoekerH.2BoesigerP.1HenningA.17SeifritzE.17
University & ETH Zurich, Institute for Biomedical Engineering, Zurich, Switzerland
University of Zurich, Clinic of Affective Disorders and General Psychiatry, Zurich, Switzerland
Leibniz Institute for Neurobiology, Department of Behavioral Neurology, Magdeburg, Germany
Otto-von-Guericke University, Department of Psychiatry, Magdeburg, Germany
Freie Universität Berlin, Cluster Languages of Emotion, Berlin, Germany
Charité, CBF, Department of Psychiatry, Berlin, Germany
University of Zurich, Zurich Center for Integrative Human Physiology (ZIHP), Zurich, Switzerland
Ketamine decreases resting state functional connectivity between networks via the dorsal nexus: implications for major depression
Question: Increasing preclinical and clinical evidence underscores the strong and rapid antidepressant properties of the glutamate modulating NMDA receptor antagonist ketamine [1, 2]. Targeting the glutamatergic system might thus provide a novel therapeutic strategy for antidepressant drug treatment [3]. Since glutamate is the most abundand and major excitatory neurotransmitter in the human brain, pathophysiological changes in glutamatergic signalling are likely to affect neurobehavioural plasticity, information processing and large-scale changes in functional brain connectivity underlying certain symptoms of major depressive disorder (MDD) [4]. Using resting state functional MRI (rsfMRI), the „dorsal nexus“ (DN) was recently identified as a bilateral dorsal medial prefrontal cortex (DMPFC) region showing dramatically increased depression-associated fMRI connectivity with large portions of the cognitive control network (CCN), the default mode network (DMN), and the affective network (AN) [5]. Hence, Sheline and colleagues [5] proposed that reducing increased connectivity of the DN might play a critical role in reducing depressive symptomatology and thus represent a potential therapeutic target for affective disorders. Since little is known about how ketamine affects large-scale neural network dynamics in the human brain, we aimed to test the hypothesis that ketamine as an antidepressant glutamatergic agent decreases resting state connectivties via the DN.
Methods: Study design: 17 healthy subjects (mean age, 40.5 +/− 7.5 [SD]; 9 males) completed four resting state fMRI sessions in a double-blind, randomized, crossover study design (s. Fig 1). The baseline scan was followed by an intravenous infusion (45 mins) of either S-ketamine (0.25 mg/kg) or placebo (saline) outside the scanner. Since the antidepressant effect of ketamine is most prominent after one day [1], the followup scans were scheduled 24 hours after the ketamine or placebo infusion in order to assess the mid-term effects on neuronal network dynamics that might contribute to its antidepressant efficacy. To avoid a possible carry-over effect, the time lag between the two baseline measurements was set to at least 10 days. rsfMRI data acquisition and analysis: Measurements were performed on a Philips Achieva TX 3-T whole-body MR unit equipped with an 8-channel SENSE head coil. During each session a total of 200 functional images were collected in 10 minute runs (eyes closed) using the following acquisition parameters: TE=35 ms, TR=3000 ms (θ=82°), FOV=22 cm, acquisition matrix=80×80 interpolated to 128×128, voxel size=2.75×2.75×4 mm, 32 contiguous axial slices (placed along the anterior-posterior commissure plane), and sensitivity-encoded acceleration factor R=2.0. A 3-dimensional T1-weighted anatomical scan was obtained for structural reference. Data were analyzed using the SPM8 (Wellcome Trust Center for Neuroimaging, London, England) based data processing assistant for resting state fMRI (DPARSF, by Yan Chao-Gan et al.) which includes a resting state fMRI data analysis toolkit (REST, by Song Xiao-Wei et al.). The postprocessing steps followed the standard protocol described by Yan and Zang (2010) [6].
Double-blind, randomized, crossover study design (n=17 subjects)
Results: To test our hypothesis, we created a seed region of interest in the left and right DMPFC (10 mm sphere at ±6 51 24) representing the DN. 24 h following ketamine administration, functional connectivity was exclusively reduced to the posterior cingulate cortex (PCC), to the subgenual anterior cingulate cortex (sgACC), and to anterior and mediodorsal parts of the thalamus (compared to placebo). The backprojection from a seed in the PCC confirmed these results and revealed an additional significant reduction of functional connectivity to the pregenual ACC (PACC) and medioprefrontal cortex (MPFC). For details, see Fig. 2 A, B and bar diagrams (functional connectivity change, paired t tests).
Red voxels in the PCC, sgACC and thalamus showing reduced functional connectivity to the DN seed region (green) after ketamine administration (n=17, paired t-test, s. bar diagrams). B Red voxels in the DN (backprojection) and PACC/MPFC showing reduced functional connectivity to the left PCC seed region (green) 24 hours after ketamine administration.
Conclusion: While pharmacological effects of ketamine on task induced fMRI BOLD signals have been studied extensively, this is the first randomized, placebo-controlled, double-blind, crossover study demonstrating changes in resting state functional connectivity in response to ketamine administration in healthy subjects. Here, we report a significant decrease in functional connectivity of the sgACC (AN) and the PCC (DMN) via the DN 24 hours following ketamine administration, thus reflecting a neuronal pattern of normalization with regard to MDD where increased connectivities of the AN and DMN via the DN have been observed [5]. As critical hub of the AN, the sgACC plays an important role in mood regulation. Subgenual cortical activity was shown to be elevated in MDD and effective antidepressant treatment was associated with a reduction in sgACC activity [for review see ref. 7]. In addition, the observed reduction in functional connectivity between anterior (PACC/MPFC) and posterior parts of the DMN (PCC) may partially reverse the disrupted neurobehavioral homeostasis in MDD where a failure to normally down-regulate activity within the DMN during emotional stimulation was found [8], with increasing levels of DMN dominance being associated with higher levels of maladaptive, depressive rumination and lower levels of adaptive, reflective rumination [9]. Finally, reductions in cortico-thalamic connectivity may reflect functional alterations in thalamocortical loops via the prefrontal cortex. Based on the fact that the antidepressant effect of ketamine peaks one day after a single intravenous administration [1], we conclude that pharmacologically reducing the hyperconnectivity via the DN may play a critical role in reducing depressive symptomatology and in representing a systems level mechanism of treatment response for major depression.
References
Zarateet al.Arch Gen Psych. 2006.a-976a-983a-990Machado-Vieiraet al.Pharmacol Ther, 2009.a-977Sanacoraet al.Nat Rev Drug Discovery, 2008.a-978Hornet al.Front in Syst Neurosci, 2010.a-979Shelineet al.PNAS, 2010.a-980a-981a-986Yan, Zang. Front in Syst Neurosci, 2010.a-984Drevetset al.CNS Spectr, 2008.a-987Grimmet al.Neuropsychopharmacology, 2009.a-988Hamiltonet al.Biol Psychiatry, 2011a-989
Data Analysis
PykaM.1JansenA.1KircherT.1
University of Marburg, Department of Psychiatry, Marburg, Germany
A model for resting state reactivity induced by experimental conditions
Recent studies investigating the influence of attention demanding processes on subsequent rest have raised the notion of the resting state as a cognitively meaningful state showing reactivity to events of the past. Conceptually, this means that experimental conditions do not only have an immediate causal influence on brain functions but also trigger a delayed reaction. This belated response has been associated with self-reflective and memory processes. We present a causal forward model, called dynamic reactivity model (DRM) to analyze the influence of an experimental condition on subsequent resting state activity with Bayesian methods. In contrast to previous models, in DRMs, experimental conditions have a direct influence on neural activity in brain regions but can also evoke cognitive processes in subsequent stimulus-free periods which in turn drive neural activity. We introduce the mathematical foundations of DRMs and analyze its validity with synthetic data under various signal-to-noise ratios and neural/hemodynamic parameters. Furthermore, we demonstrate in two experimental studies how DRMs can be used to characterize the temporal pattern of task-induced resting state or baseline activity and how the modulating factors of rest in an experiment with several conditions can be identified. In particular the so-called default mode regions, such as the precuneus and the medial prefrontal cortex, have been found to be affected by preceding task conditions. DRMs might therefore represent a first step towards a more general computational model of specific regions in the brain. In this context, we discuss the chances and challenges of experiment-independent computational models of brain areas.
University Hospital of Liège, University department of Neurology, Liège, Belgium
University of Liège, Coma Science Group, Cyclotron Research Centre, Liège, Belgium
University Hospital of Liège, University department of Neurology, Myelin Disorder Research Team (MYDREAM), Liège, Belgium
University of Liège, Cyclotron Research Centre, Liège, Belgium
University Hospital of Liège, University Department of Anesthesia and ICM, Liège, Belgium
Laboratory for Sleep and Consciousness Research, University Department of Psychology, Salzburg, Austria
Relationship between spontaneous fluctuation, auditory evoked activity and consciousness: an EEG-fMRI study
Question: Recent functional MRI studies have identified coherent spontaneous activity fluctuations in large scale brain networks in the awake resting human brain (Boly et al 2007, 2008, Sadaghiani et al, 2010). These slow blood oxygen level-dependent (BOLD) fluctuations persist during anesthesia (Vincent et al, 2007). In particular, spontaneous activity within auditory cortices has been shown to remain unchanged across propofol-induced sedation stages (Boveroux et al, 2010). The functional significance of the preserved ongoing BOLD signal fluctuations during propofol-induced loss of consciousness remains poorly understood. The aim of this study is to investigate the influence of spontaneous fluctuation in the auditory resting-state network on stimulus-evoked auditory responses under propofol anesthesia, as compared to wakefulness.
Methods: Simultaneous functional MRI and EEG data were acquired in 13 healthy volunteers (6 females, mean age 23±5 y). All subjects underwent 4 scanning sessions (normal wakefulness, propofol-induced mild sedation, loss of consciousness, and recovery of consciousness) where pure tones were presented with a randomized jitter (median interstimulus interval: 2910 ms, standard deviation: 10706 ms). First, an auditory network template was obtained by assessing the response to all sounds during awake state. Second, we performed independent component analysis on fMRI data and identified (through template matching) a spontaneous auditory brain activity spatial map (which time course was not correlated to sounds presentation) in each condition for each subject. Third, sounds were classified into two classes: a tone was classified in the 'up' category if its onset occurred within the upper half spontaneous auditory map BOLD activity values, and was categorized as 'down' otherwise. Differential brain responses to 'up' versus 'down' sounds were assessed in all sessions and the presence of a correlation between the effect of spontaneous activity and the level of consciousness was investigated. An additional EEG analysis searched for an effect of spontaneous BOLD activity fluctuations on auditory event-related spectral perturbations of (fMRI-classified) 'up' and 'down' sounds across sedation stages. We also looked for a correlation between the level of consciousness and the effect of spontaneous activity on stimulus-induced oscillatory activity. Statistical analyses were all performed with SPM8 and thresholded at p<0.05 corrected for multiple comparisons using false discovery rate.
Results: During wakefulness, 'up' tones induced stronger cerebral activation than the 'down' tones, in a set of areas encompassing temporal, parietal, frontal and limbic cortices. During deep sedation, the effect of spontaneous activity was restricted to primary auditory cortices. A correlation between the influence of spontaneous BOLD signal fluctuations on the responses to sounds and the level of consciousness was found in parietal, frontal and occipital cortices. A consciousness-dependent effect of spontaneous BOLD activity on the processing of stimuli was also found for stimulus-induced beta band synchronisation at a latency of 200 ms after the presentation of sounds.
Conclusions: During wakefulness, spontaneous auditory cortices BOLD fluctuations elicits large differences in BOLD activation (encompassing frontoparietal cortices) and beta synchronization in late latencies - commonly reported as neural correlates for conscious perception of stimuli (Gaillard et al, 2009; Gross et al, 2004). In contrast, the localized effect of spontaneous activity in primary auditory cortices during deep sedation is unlikely to lead to changes in awareness of auditory stimuli. Our data suggest a graded correlation between the level of consciousness and the interplay between spontaneous and stimulus evoked activity. They shed light on the (lack of) functional significance of BOLD fluctuations observed during anesthesia-induced loss of consciousness for the processing of external stimuli.
References
BolyM.et al.2007. ‘Baseline brain activity fluctuations predict somatosensory perception in humans’Proceedings of National Academy of Sciences U S A, 104,29:12187–92.a-1017BolyM.et al.2008. ‘Consciousness and cerebral baseline activity fluctuations’Human Brain Mapping, 29,7:868–74.a-1018BoverouxP.et al.2010. ‘Breakdown of within- and between-network resting state functional magnetic resonance imaging connectivity during propofol-induced loss of consciousness’Anesthesiology, 113,5:1038–53.a-1021GaillardR.et al.2009. ‘Converging intracranial markers of conscious access’Public Library of Science Biology, 7,3:e61.a-1022GrossJ.et al.2004. ‘Modulation of long-range neural synchrony reflects temporal limitations of visual attention in humans’Proceedings of National Academy of Sciences, 101,35:13050–5.a-1023a-1032SadaghianiS.et al.2010. ‘Intrinsic connectivity networks, alpha oscillations, and tonic alertness: a simultaneous electroencephalography/functional magnetic resonance imaging study’Journal of Neuroscience, 30,30:10243–50.a-1019a-1039a-1040VincentJ.L.et al.2007. ‘Intrinsic functional architecture in the anaesthetized monkey brain’Nature, 447,7140:83–6.a-1020a-1041a-1042
Cleveland Clinic, Radiology, Cleveland, United States
Functional connectivity and activation in major depression before and after electroconvulsive therapy reveals centrality of orbitofrontal cortex
Introduction: ECT is a successful therapy for MDD; the mechanism likely differs from other therapies and may aid in understanding MDD. Reviews have concluded MDD is mediated by corticolimbic network abnormalities [1–7] and can be treated by modulating nodes to regain normal network function [2]. Reviews posit that 3 nodes are essential to mood integration/manifestation: rostral ACC, medial PFC, and OFC [2]. A recent review [3] extends this, concluding either hyperactive OFC provides too much negativity bias or downstream cortex is hyper-receptive to bias [3]. Brain stimulation in several regions (incl these, dorsolateral PFC (DLPFC) [8] and nucleus accumbens [9] among others) all appear to show success. This, despite different targeting, may be due to nodal interdependence. It is difficult to draw conclusions from past studies on the nodal dependence. Our pre/post fMRI ECT results shed light on this issue.
Methods: 6 ECT-naïve MDD patients were treated with ECT. 1 week before and 1–3 weeks after ECT, patients underwent fMRI with working memory and affective tasks and during eyes-closed rest. Changes in task response in ROIs were compared with changes in MDD severity measured by Hamilton Depression score (HDRS). Change in functional connectivity (FC) between regions was compared with change in HDRS.
Results: We observed decreased activation after ECT (Fig 1). Change in HDRS (pre-ECT HDRS=25.17, post=9.33) correlated significantly with reduced OFC affective deactivation. Whole-brain FC of ACC (Fig 2) showed an increase in FC for ACC->right DLPFC and ACC->posterior cingulate cortex after ECT, correlating significantly with change in HDRS.
FIG. 1.
FIG. 2.
Discussion: ECT appears to normalize OFC hyperdeactivation to negative emotion in parallel with symptom normalization. We furthermore found change in FC for the right DLPFC-ACC in parallel with normalization. By incorporating activation and FC findings, we suggest that our findings support the hypothesis that OFC abnormality is more central in treatment-resistant MDD and that FC changes in other nodes is secondary.
MesséA.1MarrelecG.1
Inserm/UPMC, Laboratoire d'Imagerie Fonctionnelle (UMRS 678), Paris, France
Relating structural and functional connectivity in MRI: A simple model for a complex brain
Introduction: Magnetic resonance imaging (MRI) has been able to provide relevant information regarding the human brain structure and function. However, to our knowledge, few studies have addressed the relationship between functional dynamics and the underlying structure as inferred by MRI [Honey and al. 2010]. We here reintroduce a simple generative model based on spatial autoregression (SAR) [Tononi and al. 1994], and compare its characteristics to classical models.
Materials and Methods:Data Resting state fMRI data and DTI images were acquired from twenty one healthy volunteers. Anatomical parcellation was performed from T1-weighted data to define sets of regions of interest [Fischl and al. 2004]. Low and high parcellation schemes were used (82 and 424 regions, respectively). The time series of all voxels composing a given ROI were spatially averaged to form the signal representative of that ROI. A structural connectivity index (SC) was then set as the proportion of fibers connecting two given ROIs using probabilistic tractography [Behrens and al. 2007], allowing to build a connectivity matrix which was then thresholded at 0.001.
Computational models The individual data were finally fed to 4 generative models: structural connectivity as such, an analytic model [Galan 2008] and a neural-mass model [Honey and al. 2009] and the SAR model. Model performance was assessed using measures of prediction and modeling power, which correspond to the correlation and mean square error between the empirical and simulated functional connectivity.
Results: Results are summarized in Figure 1. All generative models had relatively strong prediction power. Both prediction and modeling power increased when including only direct SC and when averaging over subjects. The SAR had the highest prediction and modeling power.
Power of computational models averaged across subjects (circles) and for the averaged data (diamonds): (red territory) including all connections and (blue territory) after exclusion of region-pairs with absent structural connection. Markers size is proportional to the number of regions.
Conclusions: These results highlight that a simple generative model (but not the simpler) defined by the SAR model seemed to outperform classical computational models, not only in terms of powers, but also in terms of computational burden. Such finding opens a new avenue in the study of the structure-function coupling with the use of the SAR model.
Pharmacology
NickersonL.12FrederickB.123LindseyK.123LukasS.123
McLean Hospital, Imaging Center, Belmont, United States
Harvard Medical School, Psychiatry, Boston, United States
United States
Acute marijuana smoking alters BOLD functional connectivity of a hippocampal memory network with DLPFC
Question: Cannabinoids (CBs) impair all aspects of memory function and brain imaging of the neural correlates of impaired memory function during acute Δ9-THC (a CB in marijauna) administration shows altered activation of dorsolateral prefrontal cortex (DLPFC) during memory task performance. However, resting state functional connectivity (FC) of memory regions has not been studied during CB administration. The current study fills a key gap in the literature by studying the effects of smoked marijuana (MJS) during concurrent fMRI in an attempt to quantify the effects of MJS during peak “high” on FC in key memory and DLPFC networks.
Methods: 8 heavy chronic MJ smokers were scanned on 2 occasions: during placebo smoking (PLS) and MJS (3.51% Δ9-THC) (double-blind, randomized) via an MR-compatible smoking device.
BOLD fMRI data were acquired using a Siemens 3T Trio (TR/TE=3000/18 ms, 3.5 mm isotropic, 50 axial slices) for 35 min: 5 min baseline, 5 min cued air puffing, 5 min smoking, 20 min post-smoking. Subjects also reported ratings of high via a VAS.
Standard data pre-processing was done using FSL (www.fmrib.ox.ac.uk/fsl), including 0.01<f<0.15 Hz bandpass temporal filtering prior to non-linear registration to standard space via high-res structurals.
Ten min of post-smoking fMRI data extracted from the full data were temporally concatenated across subjects and a group ICA was done (FSL MELODIC), resulting in 30 independent components (ICs). Dual regression was used to assess condition differences in within-network FC (paired t-test using FSL Randomise, cluster-mass thresholding, z=2.5, p<0.05 corrected) and between-network FC (paired t-tests, p<0.05).
Results: A hippocampus network (HCN, Fig 1A) showed decreased FC during MJS with bilateral DLPFC, insula, and precuneus (Fig 2). The HCN also showed strong positive coupling to a right fronto-parietal network (rFPN, Fig 1B) during PLS, but weak anti-correlations during MJS (Fig 3).
A. RSN containing bilateral hippocampus, bilateral amygdala, orbitofrontal cortex, entorhinal cortex shown in green overlaid onto the MNI-152 brain. B. The right fronto-parietal network comprised of DLPFC and posterior parietal regions, as well as caudate (green, overlaid onto the MNI-152 brain).
Relative to placebo smoking, marijuana smoking was associated with statistically significant reductions in functional connectivity of the hippocampal network with bilateral DLPFC, insula, and precuneus. Areas of reduced FC are shown (red-yellow) in several slices/orientations overlaid with the hippocampal network (green) onto the MNI-152 brain.
Mean correlation coefficients (Fisher-Z transformed) between the hippocampal network and the right fronto-parietal network were calculated across subjects during the post-smoking period for placebo and marijuana smoking (error bars reflect the standard error of the mean). During placebo post-smoking, the correlation between the two networks is strong and positive. After smoking marijuana, the two networks are weakly anti-correlated.
Conclusions: DLPFC facilitates long-term memory formation with the HCN and both are densely populated with CB1 receptors. CB1 agonists, including Δ9-THC, disrupt working memory mediation by PFC, thus our findings of reduced FC between HCN and DLPFC and of decoupling of HCN with rFPN after MJS may underlie the neuroanatomical basis of the memory impairing effects of cannabinoids.
Applications: Psychiatry
WotrubaD.12MichelsL.1TheodoridouA.2KolliasS.1RösslerW.2HeekerenK.2
University of Zurich, Clinic for Neuroradiology, Zurich, Switzerland
Psychiatric University Hospital Zurich, The Zurich Program for Sustainable Development of Mental Health Services (ZInEP), Zurich, Switzerland
Aberrant salience-network connectivity in the pre-psychotic period
Introduction: Resting-state functional magnetic resonance imaging (rs-fMRI) has revealed that spontaneous BOLD signal activation is organized into spatially segregated functional connectivity networks (e.g. [1]). There is strong evidence that among those networks, the default mode network (DMN) [2] and the salience network (SN) are abnormal in schizophrenia [3,4]. The aim of this study is to examine the intrinsic functional connectivity maps in subjects at-risk for psychosis in order to test whether rs-fMRI fluctuations are already different in the pre-psychotic period compared to healthy adults.
Methods: We utilized rs-fMRI (3 Tesla MR-system, Achieva, Philips Healthcare, Best, The Netherlands) to investigate the intrinsic connectivity (6 minutes, TR=2000 ms; eyes closed, awake) in two groups; 22 subjects at-risk for psychosis with basic symptoms [5] (HR) and 18 healthy controls (HC), matched for age, handedness and education. The posterior cingulate gyrus was selected as seed region for the DMN [1]; the left and right fronto-insular cortex for the SN [6]. The intrinsic organization was reconstructed on the basis of fMRI time series and a bivariate regression analysis was performed between the seed regions and all other voxels in the brain using the SPM-based connectivity toolbox Conn (http://www.nitrc.org/projects/conn).
Results: Second level analysis revealed differences between HR and HC in the salience connectivity map but not in the DMN (Fig. 1). A single cluster of hyper-connectivity was found containing right-dominant regions within the insular cortex, inferior temporal gyrus, superior temporal gyrus, and parahippocampal cortex (Fig. 2).
The DMN and SN maps in healthy controls and subjects at risk for psychosis (significant connectivity maps are shown in red). A random effect analysis was performed to create within group statistical parametric maps for each network. Results are shown at a voxel-wise threshold of p<.001 with a FWE cluster correction of p<.05. Seed regions used to identify each network are shown as blue circles
Significant resting-state functional connectivity differences between subjects at risk for psychosis and healthy controls in the salience network are shown in red for right and left lateral and medial view. The thresholds for the between-group maps are presented at a voxel-wise threshold of p<.05 with a FWE cluster correction of p<.01.
Conclusion: Increased SN connectivity suggests disturbance to the system which effects interoceptive-autonomic processing and other homeostatic challenges in the pre-psychotic period [6]. Interestingly, the hyper-connectivity shown in the risk group in the right-lateralized temporal area plays a critical role in positive symptoms such as delusions and hallucinations [7]. Moreover, the anterior insula has been identified as a key region in the pathophysiology of schizophrenia [4]. These preliminary findings suggest that altered resting-state activity in the SN but not in the DMN may be related to the clinical features of risk for psychosis.
References
FoxM.D.et al.The human brain is intrinsically organized into dynamic, anticorrelated functional networks. Proceedings of the National Academy of Sciences of the United States of America, 2005; 102,27:9673–9678.a-1072a-1077BroydS.J.et al.Default-mode brain dysfunction in mental disorders: a systematic review. Neuroscience and Biobehavioral Reviews, 2009; 33,3:279–296.a-1073WhiteT.P.et al.Aberrant salience network (bilateral insula and anterior cingulate cortex) connectivity during information processing in schizophrenia. Schizophrenia Research, 2010; 123,2–3:105–115.a-1074PalaniyappanL., LiddleP.F.Does the salience network play a cardinal role in psychosis? An emerging hypothesis of insular dysfunction. Journal of psychiatry & neuroscience : JPN, 2012; 37,1:17–27.a-1075a-1083KlosterkötterJ.et al.Diagnosing schizophrenia in the initial prodromal phase. Arch Gen Psychiatry, 2001; 58,2:158–164.a-1076SeeleyW.W.et al.Dissociable Intrinsic Connectivity Networks for Salience Processing and Executive Control. The Journal of Neuroscience, 2007; 27,9:2349–2356.a-1078a-1081GoghariV.M., SponheimS.R., MacDonaldA.W.3rd. The functional neuroanatomy of symptom dimensions in schizophrenia: a qualitative and quantitative review of a persistent question. Neuroscience and Biobehavioral Reviews, 2010; 34,3:468–86.a-1082
Data Analysis
WohlschlaegerA.12SorgC.13RiedlV.14ShaoJ.1KöhlerL.1LöserJ.1
Klinikum rechts der Isar, Department of Neuroradiology, Munich, Germany
Klinikum rechts der Isar, Department of Neurology, Munich, Germany
Klinikum rechts der Isar, Department of Psychiatry, Munich, Germany
Klinikum rechts der Isar, Department of Nuclear Medicine, Munich, Germany
Occipital resting state networks agree with cytoarchitectonically defined retinotopic areas
Question: In the recent years a number of resting state networks (RSNs) in the brain has been stably identified by resting-state fMRI (rsfMRI). Most of them largely overlap with networks which are often simultaneously recruited by a spectrum of tasks. Although some RSNs can be identified as comprising the somatosensory or visual cortex, no rigorous comparison has been performed up to now, linking RSNs to cytoarchitectonically defined areas of the brain. In the occipital cortex retinotopic areas have been successfully characterized by cytoarchitectonic mapping, as well as by fMRI using periodic visual stimuli (retinotopic mapping). In the present study we aim at comparing RSNs in the occipital cortex with existing cytoarchitectonic maps.
Methods: We used 10 min of high-resolution rsfMRI (voxel size=0.9×0.9×1 mm3, TR=2 s) covering the occipital cortex. Data were preprocessed including spatial normalization to a standard space using SPM5. Data were analyzed by group independent component analysis using the GIFT toolbox. Out of the 70 independent components (IC) identified, 6 had an activity pattern based in the occipital cortex. Group maps of these components were superimposed onto cytoarchitectonically derived maps with the Anatomy toolbox of SPM5.
Results: All detected occipital RSNs proved to be bilateral. Peak coordinates of the ICs were attributed to the different retinotopic areas: V1 posterior: 100%, V1 anterior: 100% (Probability of the coordinate to be located within the stated area), V2: 70%, V3v: 50%, V4v: 60%, V5: 30%.
Conclusions: Peak coordinates of all RSNs can be attributed well to different occipital areas. Probability was lowest in the case of V5, a non-retinotopic occipital area. The reason for this could be that V5 is not attached to major macroscopic anatomical landmarks. The latter are used for spatial normalization and determine its quality to a large extent. Results underpin the assumption that brain areas defined by cyto-architecture produce BOLD-fluctuations with increased temporal synchronicity.
Physiology
IacovellaV.1HassonU.1
The University of Trento, CIMeC / Center for mind and brain sciences, Trento, Italy
Directional relations between BOLD signal and autonomic activity indices are identifiable with fast-TR FMRI
Correlations between physiological fluctuations and the BOLD signal are considered artifacts in neuroimaging analysis. However, activity in certain regions may cause subsequent physiological fluctuations rather than be caused by them. Here we identified regions where BOLD fluctuations precede physiological ones during task and rest. A high-static field (4T) was used, with a fast repetition time (fast-TR, 0.4 s) to match the temporal resolution of BOLD and cardiac rate, avoid aliasing and loss of high-frequency information.
Fast-TR scans: Participants (N=12) performed a mathematical calculation for 100 sec. Heart Rate (HR) recordings were used to construct a derived measure reflecting HR in 10 sec windows. A correlation analysis identified voxels where BOLD activity (at time T) predicted HR in the next 10 sec (time T..T+10; see Figure 1b).
(A) Experimental protocol. (B) Construction of the regressors for the BOLD ->ANS directional analysis using a sliding window of N=10 scans.
Slow-TR scans: (TR=2.2 s): A block design (Fig 1a) identified areas involved in the mathematical task, revealing expected activation and deactivation patterns (Fig 3).
Results:Fig. 2 shows logical relations between identified regions. Anterior cingulate (ACC) activity preceded HR fluctuations, during both task and rest (red regions in Fig. 4). In ACC higher BOLD response preceded low-HR epochs (note: ACC is 'deactive' in Fig. 3). In other regions, higher activity preceded high-HR epochs (blue regions in Fig. 4).
Experimental logic. Blue and red circles: regions showing directional BOLD ->ANS relations. Green circle: regions identified via a block-design (TR=2.2 s) protocol.
Block-design results. Green spots=deactivation, Yellow spots=activation.
(A) Areas showing a causal BOLD ->ANS relation. See text for red, blue color codes (B) Results from directional analysis in different conditions and using different sliding window length.
Implications: 1. Activity in certain regions systematically precedes ANS fluctuations. 2. BOLD->ANS relations are found in deactive areas; i.e, these contain information related to near-future ANS states. Summary: the relation between BOLD and ANS activity is not necessarily an artifactual one; removal of ANS variance may result in a loss of functionally relevant variance.
Applications: Psychiatry
AnteraperS. Arnold1TriantafyllouC.12SawyerA.3HofmannS.4GabrieliJ.5Whitfield-GabrieliS.5
A.A. Martinos Imaging Center at McGovern Institute for Brain Research, Massachusetts Institute of Technology, Cambridge, United States
A.A. Martinos Center for Biomedical Imaging, MGH, Dept. of Radiology, Harvard Medical School, Charlestown, United States
Program in Clinical Psychology, Boston University, Boston, United States
Psychotherapy and Emotion Research Laboratory, Department of Psychology, Boston University, Boston, United States
Massachusetts Institute of Technology, Department of Brain and Cognitive Sciences, Cambridge, United States
Altered Thalamostriatal Resting State Functional Connectivity in Social Anxiety Disorder
Introduction: Using functional connectivity MRI (fcMRI) we are aiming to demonstrate possible disruptions or abnormalities in the resting state networks associated with Social Anxiety Disorder (SAD), a prevalent mental disorder, which will subsequently serve as guidelines for treatment.
Methods: 17 SAD patients (24.7±6.3 yrs, 8 males, all right-handed, no medication, LSAS: 77.9±14.1), and 17 age-, gender-, handedness-matched healthy controls (HC) (25±7.5 yrs) were imaged on a 3T Siemens TimTrio using a 32Ch product coil and a single-shot gradient echo EPI sequence; 67 slices, TR/TE/FA=6000 ms/30 ms/90°, 62 time-points, 2 mm3 voxel size. Data were realigned, slice-time corrected, normalized, smoothed and temporally band-pass filtered (0.008<f<0.09) using SPM8, followed by connectivity analyses using CONN toolbox [1]. Seed regions were 1) a 10-mm-diameter sphere centered on thalamus [2] and 2) left and right putamen (striatum). Physiological and other spurious sources of noise were estimated using the anatomical Compcor method [3], and regressed out together with motion related covariates. Correlation maps were produced by extracting the residual BOLD time course from the seed, and computing Pearson's correlation coefficients between the seed time-course and those of all other voxels in the brain. Correlation coefficients were converted to normally distributed scores using Fisher's r-to-z transform to allow for group-level GLM analyses.
Results: Resting state functional connectivity in the SAD>HC comparison was significantly stronger at the group-level (cluster-level pFWE-cor<0.05) for: 1) L and R Inferior Temporal and Parahippocampal Gyrus, part of default mode network (DMN), for thalamus seed (fig. 1) and 2) L and R Lateral Parietal Cortex and Cingulate gyrus, part of Salience Network [4], for striatum (fig. 2). HC>SAD was not significant.
Surface representation of the resting state functional connectivity in SAD>HC comparison at the group-level (n=17 per group; cluster-level pFWE-cor<0.05) with thalamus seed. Left and Right Inferior Temporal (BA 20/21) and Parahippocampal Gyrus (BA 36), which form part of the default mode network are significantly stronger. HC>SAD comparison was not significant. Within-group comparisons for SAD and HC are shown at whole-brain pFDR<0.05 threshold.
Surface representation of the resting state functional connectivity in SAD>HC comparison at the group-level (n=17 per group; cluster-level pFWE-cor<0.05) for striatum with left and right putamen seeds. Left and Right Lateral Parietal Cortex (BA 40) and Cingulate Gyrus (BA 24), which form part of the salience network are significantly stronger. HC>SAD comparison was not significant. Within-group comparisons for SAD and HC are shown at whole-brain pFDR<0.05 threshold.
Conclusion: Increased activity of thalamus/limbic regions in SAD is one of the most coherent findings with neuroimaging [5]. We provide evidence for hyperconnectivity of the thalamus and striatum in SAD population for the first time using resting state fcMRI. The largest impact of this study will be in patients who are unable to perform a cognitive task (due to age or cognitive deficit), or cannot tolerate long imaging sessions or other available mapping methods.
Data Analysis
JoliotM.1NaveauM.1PetitL.1MelletE.1Tzourio-MazoyerN.1MazoyerB.1
GIN UMR5296, CNRS CEA Bordeaux University, Bordeaux, France
Voxel-based homotopic functional correspondences using functional connectivity analysis of resting state FMRI data
Introduction: During the resting state (REST), brain activity is organized into “resting state networks” (RSN) of functionally correlated areas [1]. Correlation of homotopic areas in RSN leads to right-left spatial symmetry [2], broken at the voxel level by the Yakovlevian torque, a non-linear anatomical distortion between left (LH) and right hemispheres (RH). Based on multi-scale regional correlation analysis of RSNs, we calculated a voxel-based deformation field (VBDefF) defining homotopic correspondence of REST areas, and quantified asymmetries.
Method: 282 subjects were scanned during 8-min eyes-closed REST. VBDefF elaboration: 1) ICA of preprocessed data [1], 2) Individual components' classification into 34 RSN (MICCA, [3]), and computation in each voxel of a 34-dimension profile of its probability to belong to the 34 RSN, 3) 21 multi-scale k-means clustering of voxels' profile matrix resulting in 21 atlases of ROIs, 4) For each, computation of regional homotopic correspondences based on maximum average correlation, 5) VBDefF construction by averaging the 21 values of regional deformations of the regions each voxel belonged to. Evaluation of volumetric asymmetries by computing left/right differences in each of the 21 atlases, significant asymmetries detected by voxel-based t-test (p
Results: VBDefF showed a postero-anterior distortion of the LH over the RH with maximal amplitude in the posterior temporo-parietal areas (Fig. 1). The temporal site of maximal distortion had a larger LH volume, as did the inferior frontal and supplementary motor areas (Fig 2), while larger right occipital, superior parietal and anterior insula areas were present.
Measurements of the symmetric inter-hemispheric left on right homotopic voxel distortion from symmetry. Direction and Amplitude of the distortion. On the left (resp. right) hemisphere is represented the distortion of the left to right (resp. right to left) hemisphere.
Normalized homotopic volumetric significant difference (0.05 FWE corrected). Only the left (resp. right) positive differences are shown on the left (resp. right) hemisphere.
Conclusion: Asymmetries of volumes of functional homotopic areas of REST connectivity may constitute the functional support of hemispheric specialization.
LiuZ.1de ZwartJ.1ChangC.1DuanQ.1van GelderenP.1DuynJ.1
National Institutes of Health, National Institute of Neurological Disorders and Stroke, Bethesda, United States
Neuronal Electrical Activity Dependent Resting State Functional Magnetic Resonance Imaging
FMRI signals acquired during task and rest contain signal variations originating from both neuronal and non-neuronal processes. It is critical to properly identify and interpret the origin, role, and characteristics of neuronal contributions to fMRI. We have developed a novel multimodal technique based on simultaneous fMRI and EEG. We use a linear subspace analysis to decompose a single fMRI time-series signal, observed at each voxel, into multiple time-series components that are uniquely attributed to neural activity and characterized by specific electrophysiological signatures, e.g. neuronal oscillations. We refer to this technique as Neuronal Electrical Activity Dependent (NEAD) fMRI.
We acquired 600-s EEG-fMRI data from 15 healthy volunteers in eyes-closed resting state. Neuro-electrical signatures were derived from EEG oscillatory components defined by five frequency bands (delta, theta, alpha, beta, gamma). After applying the new technique to these data, we quantified the percentage fMRI signal variance corresponding to every frequency band. Such fractional variance significantly varied across fMRI locations and EEG bands (Fig 1). The map of the preferred frequency, accounting for most variance in a voxel, showed similar spatial patterns as known functional systems or networks. We further clustered all brain voxels based on their profile of frequency dependence and found well-organized spatial clusters that progressively revealed more sub-divisions of functional networks as the resolved number of clusters increased (Fig 2). Up to at least 15 clusters, these functional clusters found based on EEG signatures closely resembled those found in previous studies based on correlation or ICA analysis of fMRI data. We further evaluated the inter-regional correlation based on the NEAD-fMRI data. The resulting correlational pattern and strength was also frequency dependent. Fig 3 shows an example related to the default-mode network with a seed ROI placed at the posterior cingulate cortex.
Illustration of how BOLD signal variance is mapped out by neuronal oscillations. The first to fifth rows show the spatial distribution of the percentage of the BOLD variance explained by EEG oscillatory activities in delta, theta, alpha, beta and gamma bands. The sixth row shows the color coded map of the preferred oscillation frequency that accounts for the most BOLD signal variance in every voxel.
Clusters of brain regions based on their profile of oscillation frequency dependence, i.e. how the BOLD signal is contributed by different neuronal oscillatory components. Each row corresponds to the color-coded clusters for different choices of the number of clusters in the k-means clustering algorithm.
Functional connectivity as a function of underlying neuronal oscillation frequency with the default-mode network as an example. a) the seed ROI from posterior cingulate cortex; b) the map of functional connectivity to PCC derived based on original BOLD-fMRI data; c-g) the map of functional connectivity for each EEG frequency bands derived based on the NEAD-fMRI data; h-l) the statistically significant difference between the functional connectivity of each frequency band vs. the original functional connectivity based on the conventional seed correlation analysis.
In summary, NEAD-fMRI enables us to evaluate resting state fMRI signals of neuronal origin. It also allows localization of the metabolic and/or hemodynamic correlate of oscillatory neural activity during rest or task. Its application to resting-state fMRI suggests a unique frequency signature for activity in specific brain networks.
Applications: Psychiatry
SuoC.12SinghM.A. Fiatarone34SachdevP.S.156GatesN.J.12ValenzuelaM.125the SMART research teamT.S.R.712563489
University of New South Wales, School of Psychiatry, Randwick, Australia
University of Sydney, Regenerative Neuroscience Group, Brain and Mind Research Institute, Camperdown, Australia
University of Sydney, Exercise Health and Performance Faculty Research Group, Sydney Medical School, Lidcombe, Australia
Hebrew Senior Life, Boston, MA, and Jean Mayer USDA Human Nutrition Research Center on Aging at Tufts University, Boston, Australia
University of New South Wales, Brain and Aging Research Program, Randwick, Australia
Prince of Wales Hospital, Neuropsychiatric Institute, Randwick, Australia
the University of Sydney, BMRI, Sydney, Australia
University of Adelaide, Adelaide, Australia
Balmain Hospital, Sydney, Australia
Resting State Network Adaptation in Older Adults with MCI in the SMART Trial: Unique Effects of Combined Cognitive Training and Physical Exercise
Background: Cognitive and physical activity helps protect against cognitive dysfunction in late life, but the underlying neurobiological mechanisms are unclear 1,2. FMRI studies in Mild Cognitive Impairment (MCI) and Alzheimer's disease suggest that changes to resting state networks (RSN) may be an early diagnostic biomarker, including degradation of the Default Mode Network (DMN) and hippocampal connectivity 3,4.
We investigated multimodal MRI neuroimaging outcomes in the Sydney-based SMART Trial (Study of Mental and Regular Training) - the first randomised, sham-controlled and double blind trial of cognitive training and resistance exercise in older adults at risk for dementia 5.
Method: Subjects (N=100 recruited, N=73 with complete data) were non-demented older adults (54–87 y, mean 70 y; 22 males) with MCI, randomly assigned to one of 4 training groups (2 or 3 d/wk, 6 months) based on a 2×2 factorial design: cognitive training+sham exercise (CT), resistance training+sham mental activity (RES), cognitive+resistance training (CT+RES) and sham mental activity+sham exercise (SHAM). Scans were carried out at baseline and 3 days post training.
Eyes-closed resting-state fMRI used a gradient echo EPI sequence (Philip 3T Achieva) for 6.5 minutes (200 volumes). Preprocessing included slice timing, normalization and re-sampling, smoothing, detrending and bypass filtering and regressing out nuisance signals (SPM8-based DPARSF toolbox). Posterior cingulate (PC) and right hippocampus (HIP) RSNs were generated using the seed-based correlational fMRI toolbox (REST). The 3-way interaction (Time x Cognitive x Physical) was tested across the whole brain using the GLM_Flex toolbox.
Results: A significant 3-way interaction in the dorsal anterior cingulate cortex (ACC) was found when analysing HIP connectivity, and in the ventral ACC when analysing PC connectivity. The CT+RES group experienced an increase in HIP-ACC connectivity compared to no change of connectivity in the stand-alone training groups; by contrast, PC-ACC connectivity decreased in the CT+RES group and increased in the stand-along groups (Figure 1).
FIG. 1.
Conclusion: Combined cognitive and physical exercise has unique effects on anterior cingulate connectivity in older individuals at risk for dementia compared to each type of training alone.
Data Analysis
BoordP.1MehtaS.1GrabowskiT.1
Integrated Brain Imaging Center/University of Washington, Radiology, Seattle, United States
Complementary functional connectivity from spatiotemporal pattern information in fMRI
Question: Standard approaches of functional connectivity (FC) correlate mean spatial fMRI activity between regions across time, and ignore information in local voxel activity patterns. We sought to devise a connectivity metric sensitive to similarity of spatiotemporal activity patterns between regions, and compared the results to those obtained by standard FC approaches.
Methods: We developed a pattern information connectivity (PIC) metric using representational similarity analysis to compare dissimilarities among successive voxel patterns within a local kernel (27 voxel cube). Pattern dissimilarity was summarized by a representational dissimilarity matrix (RDM), using either (1) Euclidean distance (PIC 1), or (2) Pearson's correlation (PIC 2), between voxel patterns, after removing the spatial mean, within a sliding temporal window (20 seconds, TR=2). Similarity of pattern dynamics between regions was measured by correlating the RDM from a seed region in posterior cingulate cortex to RDMs across the rest of the brain.
To verify that PIC was sensitive to local patterns of information, we compared it with three other connectivity metrics. Metric 1 performed FC of the whole time series, and Metric 2 performed sliding-window FC. Metric 1 and 2 used only the spatial mean of activity within the kernel at each time-point; whereas Metric 3 used the magnitude of the residual pattern activity (square root of the sum of squares of all 27 voxels) after the spatial mean at each time-point was removed.
Metrics were applied to data from two groups of subjects that differed with respect to when their resting-state fMRI (rsfMRI) were acquired: (1) pre-language task (N=18), and (2) post-language task (N=19). Correlation maps were converted to Z-statistics prior to group-level analyses.
Results: Metrics sensitive to local spatiotemporal pattern information (PIC 1 and 2) identified connectivity between high-order association frontal and parietal regions and standard default mode network regions in the post-language task rsfMRI group. These regions were not detected by standard FC approaches (Metric 1 and 2), nor by utilizing only the magnitude of the residual pattern activity (Metric 3).
Conclusion: We demonstrate that brain regions can share information encoded in the spatiotemporal dynamics of local activity, which can remain undetected by standard FC approaches, and provide a metric of connectivity sensitive to spatiotemporal pattern information, complementing and extending connectivity obtained by FC.
FIG. 1.
Physiology
GaoW.1GilmoreJ.2LinW.1
University of North Carolina at Chapel Hill, Radiology and BRIC, Chapel Hill, United States
University of North Carolina at Chapel Hill, Psychiatry, Chapel Hill, United States
Evidence on a Tri-modal Organization of Default-Mode Network
Objectives: Previous studies suggested different or even contrasting default network functions. However, how such diverse functions coexist remains elusive. In this study, we propose a tri-modal organization of the default network consisting of a “core” component which remains stable across different brain states and two dynamic components, one internally driven and the other externally oriented, which reorganize under different cognitive states. We tested our hypothesis by examining the task-dependent reorganization of the default network and its behavioral significance.
Methods: We designed a 4-stage experiment consisting of a pre-task resting state (R1), two attention task states with lower (T1) and higher (T2) attentional demands, and a post-task resting state (R2). Nineteen healthy subjects (age 27∼40, 5F) were recruited to undergo fcMRI scan during each state. After preprocessing, seed-based analyses were carried out to delineate the state-dependent default network functional connectivity maps and statistical comparisons were conducted to detect voxels showing/not showing connection strength differences across different states. Finally, brain-behavior relationship was examined by correlating the detected connection changes with response time (RT) and accuracy.
Results: Our results demonstrate a core component (R-Stb) showing neither qualitative nor quantitative connectivity changes throughout the four experimental states (Fig. 1). In contrast, there are two other components that are “retrieving” and “expanding”, respectively (Fig. 2), corresponding to the internal and external driven components of the network as we hypothesized. Specifically, the retrieving sub-network (R-Retr) shows reduced connectivity with the core component as attentional demand increases (Fig. 3a), whose level of reduction significantly predicts response time (RT) (Fig. 4a). On the other hand, the expanding sub-network (R-Expd) shows increasingly enhanced connectivity with the core system as attentional demand increases (Fig. 3b), whose level of enhancement significantly predicts accuracy (Fig. 4b).
Core component.
Two dynamic components.
Connectivity changes of the two dynamic components.
Behavioral correlation of the dynamic connectivity changes.
Conclusion: In this study, we provided evidences on a tri-modal organization of default network by showing its task-induced reorganization and behavioral correlation.
Applications: Psychiatry
qiuM.1xieB.1zhangY.1zhangJ.1
Third military medical university, Department of Medical Informatics and Medical Image, chongqing, China
Alterations of brain structure and function in patients with post-traumatic stress disorder
Objectives: The core neuropsychological processes underlying posttraumatic stress disorder(PTSD) have yet to be elucidated. The aim of this study is to investigate the differences of brain structures in PTSD patients, and to explore the difference of the amplitude of low frequency fluctuation (ALFF) between PTSD patients and normal control (NC) subjects by resting fMRI.
Methods: Fifteen PTSD patients who had been involved in a motor vehicle crash and fifteen normal control participants who had not experienced trauma were recruited. All experiments were performed on a 3.0 T Siemens MRI scanner, T1-weighted images were acquired using a 3D MPRAGE sequence with slice thickness/1 mm, the resting-state data were acquired using the following parameters: TR/TE/FA 2000 ms/30 ms/90o, thickness of 3.0 mm. Each session lasted for 260 seconds. The cortical thickness of the brain was analyzed by Freesurfer, the resting-state data were calculated using REST (http://www.restingfmri.net). ALFF maps in PTSD and control groups were compared on a voxel-wised basis by a two-sample t test (P20) in SPM5.
Results: The results showed that the thickness of grey matter decreased significantly in the PTSD group compared with the control group (P=0.04) mainly in the medial prefrontal cortex (MPFC) and anterior cingulate cortex (Fig 1). The ALFF value of PTSD patients increased mainly in the left frontal cortex (BA10/11) and the anterior cingulate cortex. The ALFF value in the right medial prefrontal cortex (BA10) was positively correlated with severity of the disorder (Fig 2).
Color maps showing a significant (P
Comparison of the ALFF value between PTSD and NC subjects in the resting-state. The figure exhibits that the value increased mainly in the BA10/11, ACC, and the cerebellum, and decreased in the bilateral postcentral gyrus. Corresponding t values are color-coded with yellow-to-red.
Conclusion: Combining the results of brain structure and function in PTSD patients, we suggest that the abnormally increased spontaneous activities in the left frontal and ACC local regions may be associated with the decreased cortex thickness of these regions, consistent with clinical symptoms of PTSD patients.
Data Analysis
ChenP.-Y.123ChienS.-C.3HsiehH.-L.14LeeJ.-D.3TsengW.-Y.I.12
National Taiwan University College of Medicine, Center for Optoelectronic Biomedicine, TAIPEI, Taiwan
National Taiwan University, Institute of Zoology, Taipei, Taiwan
Academia Sinica, Institute of Statistical Sciences, Taipei, Taiwan
National Taiwan University, Institute of Biomedical Engineering, Taipei, Taiwan
Decomposition of Cortical-cortical Functional Connectivity Using a Functional Data Analysis of Resting-Sate fMRI
Introduction: Functional data analysis (FDA) is a statistical technique for sparsely sampled random trajectories and time series data (Ramsay and Silverman, 2005). It is a data-driven technique to reveal the internal structure of time-series data and empirically estimate the robustness of sparsely sampled random trajectories by maintaining local features while providing smoothing. The present study applied FDA to the ROI-based functional connectivity derived from resting-state fMRI (rsfMRI). We decomposed the cortical-cortical functional connectivity of the whole brain to delineate the structure of the variability in resting state BOLD signals and underlying dynamic functional networks.
Methods: 40 young healthy right-handed adults were recruited in the study (age: 19–41 yr, mean=26.2; 16 males). Scanning was performed on a 3T MRI system. All participants were scanned at rest-state for 6 minutes. A GRE-EPI sequence for resting-state fMRI data (TR/TE=2000 ms/24 ms, FA=90o, FOV=256 mm, thickness=3 mm, slices=34). T1 weighted images were a MPRAGE sequence (TR/TE=2000 ms/2.98 ms, FOV=256 mm, voxel size=1 mm). Functional Connectivity of rsfMRI by Independent Component Analysis (ICA):Figure 1 shows the group activation maps of the first 6 ICA components. T1 Atlas and mapping with rsfMRI activation map:108 functional activated regions with anatomical counterparts. Functional Data Analysis (FDA):We adopted the version of the PACE (Principal Analysis by Conditional Estimation) model proposed by Yao et al. (2005). We calculated every subject's random coefficients ξ of 108 ROIs, contributed to the first component and averaged ξ of every ROI across 40 subjects as the group result of the first component. The FVE (fraction of variance explained) threshold is .85. We generated spatial maps of positive ξ and negative networks ξ (Figure 2 & 3).
FIG. 1.
FIG. 2.
FIG. 3.
FIG. 4.
Results:Figure 2 shows the spatial mapping of the positive coefficients and Figure 3 shows that of the negative coefficients. Given the dynamic property of the resting-state time-series data, the ROIs in the positive network have positive contribution to the major variance whereas those in the negative network have negative contributions.
Conclusions: The functional connectivity analyzed by ICA can be decomposed via FDA to explore the network of the major variance of the brain function during rest. The major variance networks show distinct spatial mappings corresponding to positive and negative contributions.
Universitat Pompeu Fabra, Center of Brain and Cognition, Barcelona, Spain
INSERM, Bron, France
K. U. Leuven, Leuven, Belgium
G. D'Annunzio University, Chieti, United States
Washington University, St Louis, United States
ICREA, Barcelona, Spain
Spatiotemporal structure of the spontaneous activity of the brain: modeling and comparison to intracranial EEG and fMRI
Question: Brain neuroimaging during rest, a privileged way to observe the spontaneous neural activity of the brain, has revealed two remarkable phenomena. First, neural activity, as recorded by EEG or MEG, exhibits multiple alpha oscillations, strongest when eyes are closed. Second, fMRI BOLD signal fluctuations reveal a number of functional connectivity patterns, the resting state networks (RSNs), which can serve as dynamical markers for a number of brain diseases. Although now well characterized, the neural underpinnings of these two phenomena remain unknown.
Methods: We consider a model of the spontaneous activity of the brain, where the brain is defined by a network of local nodes excitatorily coupled via the white matter fibers with finite conduction velocity. At the local node level, the excitatory and inhibitory neural network is assumed to be in an asynchronous state and subject to noise. We theoretically show that the local dynamics can be described by a linear model. The BOLD signal is evaluated using the Balloon-Windkessel model. Simulations use the DSI-derived connectivity of Hagmann.
Results: Theoretical analysis of this model, confirmed and extended by numerical simulations, reveals how the global neural activity can be described by modes. The dominant modes are shown to exhibit an oscillation, whose properties allow identifying them to the multiple alpha oscillations observed experimentally. These modes induce spatial patterns of neural activity that are also present in the BOLD signal, explaining the origin of the RSNs. For both phenomena, the global excitatory coupling is responsible for the emergence of dominant modes in variance.
We further show how the modeled neural activity agrees well with intracranial EEG data. Using ICA to remove fMRI BOLD artifacts, we extract the main BOLD correlation pattern and show that the model one agrees well with it.
Conclusions: This study suggests that the spatiotemporal properties of the observed spontaneous activity of the brain are different facets of the same neural dynamics.
Band limited power correlation matrix for intracranial EEG electrodes in the alpha and gamma bands. Correlations are only visible in the alpha band.
Main BOLD correlation pattern in fMRI data and model results obtained from the correlation matrix decomposition.
Applications: Psychiatry
LiemburgE.12KnegteringH.123BruggemanR.2AlemanA.1
University Medical Center Groningen, Cognitive Neuropsychiatry, Department of Neuroscience, Groningen, Netherlands
University Medical Center Groningen, Rob Giel Research Center, Groningen, Netherlands
Lentis, Center for Mental Healthcare, Groningen, Netherlands
Decreased default mode network resting state connectivity related to apathy in schizophrenia
Apathy is an disabling and difficult to treat symptom of schizophrenia. It is defined as a quantitative reduction of voluntary, goal-directed behaviors that impairs daily functioning. Apathy could be seen as a dysfunction in self-initiated behavior and planning. We hypothesized that apathy could result from reduced integration of processing across brain regions, which is necessary for complex behavior. Such habitual reduction of communication between regions might be reflected in reduced connectivity of the default mode network (DMN). The DMN concerns a network of areas that shows coherent patterns of activation most prominently during rest.
44 patients with schizophrenia underwent a resting state scan in a 3 T scanner (200 whole brain EPI scans, TR=2.3 s). Scans were realigned, coregistered to anatomy, normalized to the MNI template en smoothed (10 mm FWHM) using SPM. Independent component analysis by GIFT was used to decompose the dataset in 32 (estimated) independent components (Infomax). An anterior and posterior DMN component were selected for a voxelwise linear regression with a measure of apathy. This was defined as items N4 and G13 of the Positive and Negative Syndrome scale (PANSS). An additional regression was done based on two subdomains of negative symptoms that arise from factor analysis - expressive deficits social amotivation (these factors are also consistent with the new DSM-V classification proposal).
Regression showed a negative association of apathy with connectivity within DMN regions (cingulate gyrus and insula), and the head of the caudate to the rest of the component, and a positive association with the orbitofrontal cortex and occipital gyrus. Expressive deficits were negatively associated with connectivity within DMN areas (posterior cingulate, medial temporal gyrus), and positively with Broca`s area. Social amotivation showed almost identical connectivity associations as the regression with apathy scores.
As expected, higher levels of apathy and social amotivation - which may be similar constructs - were related to lower connectivity of DMN regions. Expressive deficits were also related to decreased DMN connectivity, but in different DMN areas.
Max Planck Institute for Human Cognitive and Brain Science, Neurology, Leipzig, Germany
Max Planck Institute for Human Cognitive and Brain Science, Neuroanatomy and Connectivity, Leipzig, Germany
Max Planck Institute for Human Cognitive and Brain Science, Neurophysics, Leipzig, Germany
Communities of Connectivity Change in rs-fMRI
Question: In analyses of resting state fMRI data (rs-fMRI), connectivity is typically treated as static. However, recent work [1] has shown that connectivity as assessed with rs-fMRI changes over time. Here, we ask whether the dynamic changes in connectivity occur in spatially distinct networks.
Methods: The data comprised rs-functional scans (TR=2.5 s) and anatomical volumes of 102 subjects.
Functional data was preprocessed using standard routines [3] resulting in 250 volumes, per subject. To reduce computational complexity we parcellated the anatomical images into 463 regions [2]. For each pair of regions, we computed the correlation of the spatially averaged signals. We selected the 5% strongest connections for further analysis. To investigate network dynamics we used a shifting window approach [1]:
r=corr(x(t*w:(t+1)*w-1),y(t*w:(t+1)*w-1))
where t=0,..,4, w=50 and x, y are the time-series of two parcels (out of 463). Estimated r values are Fisher's z-transformed, resulting in five z-values per connection and subject. Each of these values is adjusted to its within-subject baseline. The resulting z-values reflect the temporal change of the connection between each pair of regions. We concatenated these z-values over subjects and used spectral clustering [4] to identify ten connectivity components.
Results:Figure 1 shows all ten communities found by the clustering algorithm, where connections within each community have similar change of connectivity. Figure 2 shows three spatially overlapping communities in visual areas. Figure 3 displays a similar overlap for motor regions, indicating a different change of connections within well-established resting-state-networks.
Sagittal and axial view for each of the ten communities identified by the proposed approach.
The clusters 2, 6 and 8 are partially overlapping within the visual cortex.
Clusters 1 and 9 are partially overlapping clusters within the sensory-motor network.
Conclusion: In summary, this method enables the analysis of resting-state brain data using a novel dynamic connectivity-based approach.
AchardS.1KremerS.2RenardF.1NamerJ.-I.2Delon-MartinC.3
CNRS, Gipsa-Lab, Grenoble, France
Université de Strasbourg, CHU Hautepierre Radiologie 2, Strasbourg, France
INSERM U836 GIN, La Tronche, FRANCE, France
Global efficiency from graph of resting state fMRI is related to brain metabolism
Question: The normal human brain has recently been described as a complex network with topological organization of small-world, at a multivariate level of analysis (1). The graph methodallowsto consider globally all the functional correlations in the brain rather than focusing on a particular subnetwork, and to extract graph metrics for each region of the brain after automatic parcellation (2). In order to evaluate whether hubs found by graph methods correspond to areas of higher glucose consumption, we performed a correlation study between both measures within the areas defined by the AAL atlas.
Methods: Resting-state fMRI data (1.5 T, 8-channel head coil, BOLD sensitized EPI sequence, 400 volumes, TR=3 s, isotropic voxel size (4 mm)3) have been acquired in a group of 20 controls. Graphs of functional connectivity have been computed using methodology described elsewhere (1) and global efficiency (GE) have been derived in the 90 cortical regions of the AAL template (2). 18F-FDG PET images (PET/CT Discovery ST system, 3D mode, isotropic spatial resolution 3.27 mm3) were taken from another groupof eight control subjects. After realignment of PET images with the AAL template, we computed in each ROI the mean regional cerebral metabolic rate of glucose (rCMRGlu) and the global efficiency. We tested for a possible correlation between the global efficiency per region against the mean rCMRGlu usingnon-parametric Kendall's tau correlation test.
Results: The mean GE and the mean rCMRGlu derived from our group of controls are displayed in Fig. 1. Hubs of strongly connected areas (high GE values) are in white color and seem to correspond with the location of high rCMRGlu. Furthermore, we found (fig. 2) a statistically significant correlation between metabolic activity and the GE (r=0.25 ; p=4.10−4).
FIG. 1.
FIG. 2.
Conclusions: Our studydemonstrates thatthe hubs of the networks in control subjects (regions of high global efficiency) also present a high metabolic activity.
ProalE.1CastellanosF.X.2RojasG.3MannuzzaS.2KleinR.2MilhamM.2KellyC.2
neuroingenia, mexico city, Mexico
NYU Langone Medical center, Child and Adolescence psychiatry, New York, United States
Clinica las Condes, Radiology, Santiago de Chile, Chile
Intrinsic functional connectivity networks in adults with childhood attention-deficit hyperactivity disorder at 33-year follow-up
Background and Objectives: Most imaging studies of Attention-Deficit/Hyperactivity Disorder (ADHD) in adults have relied on retrospective recall of childhood ADHD status. In the longest longitudinal study of ADHD, from which this report is drawn, children with impairing symptoms of hyperactivity, impulsivity, and inattention were recruited between ages 6 and 12. They were followed-up at mean ages 18, 25, and 41 along with comparisons free of such childhood symptoms enrolled at mean age 18. At age 41 they underwent an MRI study. Our objective here was to examine intrinsic functional connectivity (iFC), by contrasting individuals with a documented history of childhood ADHD to non-ADHD comparisons.
Methods: Participants:We analyzed resting fMRI data in a subset from the NY Longitudinal Study of ADHD (N=45; 20 Probands, mean age, 42.6; and 25 Comparisons mean age, 40.6) who underwent MRI scans.
Seed based analyseswere performed with26 seeds selected froman ADHD meta-analysis of 55 fMRI studies. Subject level analyses of correlations between seed time-series and every other voxel in the brain were obtained; group-level analyses were carried out using random-effects ordinary least squares, whole-brain corrected.
Results: Comparisons had greateriFC between left putamen and widespread dorsomedial frontal regions. Left inferior frontal gyrus (BA44) exhibited greater iFC in ventral frontal striatal regions. In the right hemisphere, group differences for inferior frontal gyrus included frontal pole and caudate. Differences in postcentral gyrus iFC were seen in frontal and insular regions.
ADHD showed greateriFC in both Inferior frontal gyri with pre and postcentral regions and parietal lobe.
Lack of IFC in probands and negative iFC in comparisons was found for left putamen, right posterior cingulate cortex, and left inferior frontal gyrus (BA45) seeds with regions located mostly in occipital and temporal regions.
Conclusions: Overall we found decreased iFC in probands in frontoparietal and limbic networks, and increased iFC in visual and somatomotor networks that persisted into adulthood. We note that decreased iFC in probands was seen mostly in frontal and striatal circuits related to motivation and executive function and lack of negative iFC was observed posteriorly in visual and parietal networks related to attentional tasks.
Data Analysis
WisselT.12AndersS.3SchweikardA.1
Institute for Robotics and Cognitive Systems, University of Lübeck, Lübeck, Germany
Graduate School for Computing in Medicine and Life Sciences, University of Lübeck, Lübeck, Germany
Department of Neurology, University of Lübeck, Lübeck, Germany
On state-like behavior of temporal nonstationarities in patterns of resting-state brain activity
Current methodological concepts for decomposing brain dynamics during rest into large-scale functional networks are governed by a rather stationary view on the data and very often implicitly average activity over time. Recently, however, periods of changing time-frequency coherence in pairwise connectivity between parts of the brain were identified. Thus, it has been found that brain regions can reflect the activity of one particular resting-state network (RSN) for some time and the activity of other networks at other times. Furthermore, microstates extracted from EEG resting-state recordings have been shown to exhibit scale-free behavior that is observable even at fMRI time scale. Together, these findings give rise to the question whether the dynamic connectivity between RSNs generally exhibit recurrent, state-like nonstationarites.
To address this question, we extracted three RSNs (comprising parts of the visual RSN) from fMRI resting state data and computed their mutual dynamic connectivity by sliding window correlation applied to the temporal modulation of the RSN maps. For subsequent clustering the microstate algorithm was used, and the number of inherent states was estimated by a cross-validated prediction strength approach.
Results confirm the existence of intervals having distinct connectivity characteristics and show that these can be identified by clustering even in a multivariate context involving multiple networks. However, while a well-defined state decomposition (explained variance of >80%) was achieved for some subjects, the overall results suggest that the identification of nonstationarities might critically depend on the inclusion of information about the temporal context of a data point. Distinct clusters tend to merge when more and more data are included or the temporal order is neglected. This - together with the observation that further measures of model order, such as AIC or BIC, did not indicate in a distinct minimum either - may suggest that stationary intervals in dynamic connectivity do not necessarily recur as discrete states and presumably depend on more than instantaneous network interactions. This calls for factorizations explicitly modeling non-stationary behavior.
Results of microstate analysis for one representative subject (subject 25). Left:Time courses of windowed correlations between three RSNs that showed high correlation with the visual RSN (top) and corresponding state label assignment for this multivariate sequence using 4 states (bottom).Right:Mean duration of state intervals, standard deviation (red) and [min, max] range (green).
2D subspace of the correlation dynamics between the three visual RSNs (subject 27, four states).The long elliptical cluster is shared by several distinct temporal periods causing a scattering along both main axes. Particularly variance tangential to the unit circle merges states and makes the determination of the number of states more difficult.
Physiology
LachauxJ.-P.1JerbiK.1PichatC.1Perrone-BertolottiM.1MincicA.1OssandonT.1KahaneP.1BaciuM.1
INSERM, U1028, Lyon, France
High-Frequency ([50 Hz–150 Hz]) Amplitude Correlations in human intracranial EEG reveal functional connectivity within the Default-Mode Network
Question: High-Frequency Actiivty ([50 Hz to 150 Hz]), as measured in intracranial EEG recordings, approximates population-level neural activity during cortical processing with millimetric and millisecond precision. HFA is transiently reduced during attention-demanding tasks relative to rest or baseline level. Such HFA suppressions, or HFS, occur predominantly in the Default-Mode Network. Vidal et al. (J Neuroscience, 2012) have recently suggested that during a task, two regions exchanging information within the same functional network should have correlated HFA time-fluctuations, because HFA covaries with the amount of cortical computation performed by neural populations. The idea can be extended further to resting state activity cortical regions active during rest should have correlated HFA fluctuations, provided that they process information collectively.
Methods/Results: We tested for the existence of such large-scale High-Frequency Amplitude Correlations (HFAC) in 17 epileptic patients during 4 minutes episodes of rest. We computed the distribution of correlation coefficients over 52,000 pairs of channels, and found a deviation from a normal distribution, with an excess of positive coefficients, and of extreme values, both positive and negative. For pairs separated by more than 2.5 cm, correlation did not vary with inter-site separation, but only with anatomical origin. A specific analysis of the posterior cingulate cortex revealed extremely high HFAC (R>0.5)) with distant cortical regions, including mesial prefrontal, lateral parietal and ventral lateral prefrontal cortex. Those anatomy-specific connectivity patterns were compared with fMRI functional connectivity measured in the same patients. iEEG revealed that HFAC vary over time, presumably due to the non-stationarity of cognitive activity during rest. In fact, we show that DMN functionalconnectivity can be followed in real-time, and related with changes in the participant's behavior or environment.
Conclusions: Altogether, our results confirm our hypothesis that cortical interactions produce HFA correlations during rest, especially in the DMN. Our study also provides a novel marker for functional connectivity analysis with high temporal resolution, and a plausible neural correlate of BOLD connectivity measures.
Applications: Psychiatry
DanielsJ.1ShawM.2GaeblerM.1LamkeJ.-P.1WalterH.1
Charite, Berlin, Germany
Universitätsklinikum Heidelberg, Neurologische Klinik, Heidelberg, Germany
Resting State Functional Connectivity in Depersonalization Disorder - a Partial Correlation Study
Background: The impact of pathological emotional processing - a factor common to many psychiatric disorders - on the DMN is barely understood.In this investigation, patients suffering from depersonalization disorder will be compared to healthy controls as they chronically experience low emotional arousal and low self-relevance. They exhibit extreme levels of emotional numbing which leads them to consistently rate unpleasant pictures as less emotional and less arousing than controls. This is the first study presenting resting state functional connectivity data in patients with depersonalization disorder.
Methods: Pilot data from n=7 patients with depersonalization disorder were be compared to data from n=7 matched healthy controls and n=21 PTSD patients. Individual BOLD time-courses were extracted from 9 ROIs repeatedly identified as the backbone structures of the DMN. Partial correlation coefficients were computed for each combination of these 9 ROIs, quantifying the specific functional connectivity between two ROIs each. Finally, group statistics were computed to generate average partial correlation coefficients.
Results: The pilot data (s. Fig 1). suggest that DPD patients are characterized by a disorder-specific aberration from RSFC as observed in healthy controls and differentiable from the pattern exhibited by PTSD patients. More specifically, they showed a stronger integration between the medial prefrontal cortex and the posterior cingulate cortex. In addition, these patients are characterized by a null correlation between the medial prefrontal cortex and the right angular gyrus.
FIG. 1.
Discussion: The analysis of our pilot data indicates that depersonalization disorder is characterized by an enhanced longitudinal integration with the DMN. Interestingly, the right angular gyrus seems to lack integration into the frontal section of the DMN in patients suffering from altered self experience and embodiment. The right angular gyrus has been implicated in agency processing, a domain severely impaired in patients with depersonalization disorder. New analyses of all available data (Minimum n=16 per group) will be presented at the conference to test if the pattern described in the pilot data holds up.
Data Analysis
RoquetD.123FoucherJ.123
INSERM, Unité 666, Psychiatry, Strasbourg, France
UdS, Université de Strasbourg, psychiatry, Strasbourg, France
HUS, Hôpitaux Universitaires de Strasbourg, Psychiatry, Strasbourg, France
Empirical estimation of the dimensions to retain in independent component analysis
Question: Being a model-free and multivariate method, spatial independent component analysis (ICA) is commonly used to decompose the fMRI signal. However, a varying amount of sources constituting the fMRI signal across subjects is generally decomposed into a chosen fixed number of components (i.e. the model order). This procedure leads to biased functional connectivity maps (FCM). Therefore, it is of prior interest to define an optimal number of components to be retained at the subject level. Our aim is to estimate, empirically, a range of model order where (1) FCM remain constant, (2) a maximum volume of the brain is involved in the functional activities, and (3) a maximum of noise and artifacts is avoided.
Methods: Eleven fMRI resting-state data-sets (400 EPI volumes) from healthy subjects were decomposed using an increasing model order (from 10 to 250). At each step, components reflecting FCM were selected. We then investigated (1) the variations of volume of each FCM along the model order and of splits of FCMs into sub-FCMs, (2) the percentage of brain recovered by merged FCM, and (3) the amount of single voxels not constituting a coherent set. Map threshold values were from z-score 1 to 3 by increment of 0.2.
Results: Splits occurred at each model order. The observed brain covering score increased as a function of model order for each subject, while the volume of FCMs decreased. The more components were extracted, the less variation of volume of functional networks could be observed, regardless of the thresholds. The higher the threshold, the larger was the diversity of volume modification among the different FCMs. A maximum mean of 130 scattered voxels for whole brain has been recorded at the highest model order (at the lowest threshold).
Conclusions: Considering brain covering scores, splits, variations of volume, all results suggest that a decomposition of a 400 volume fMRI data into at least 150 components is needed to extract the maximum of BOLD fluctuations and to obtain the most stable FCMs. Conversely to what is frequently said, not only splits are less frequent and noise not more prominent. This number of 150–250 dimensions to retain exceeds by far what analytic solution suggested (between 40 to 81 dimensions). Last, results of ICA would be best displayed at a threshold close to 1.4 to 1.6 in order to increase the reproducibility of the results.
Physiology
HajaliV.1mohaddesG.2
Kerman neuroscience research center, Kerman, Iran, Islamic Republic of
tabriz university of medical sciences, physiology, Tabriz, Iran, Islamic Republic of
Intracerebroventricular Insulin Improves Spatial Learning and Memory In a Dose Dependent Manner In Rats
As one of the most studied protein hormones, insulin as well as its receptor have been known to play key roles in a variety of important biological processes. Detection of insulin and its receptor in the central nervous system (CNS) has led to a rapidly growing interest in the central effects of insulin. The high density of insulin/insulin receptor in brain areas such as the hippocampus and cerebral cortex have shown to play an important role in higher cognitive functions, such as lerning and memory. Previous studies have offered controversial results regarding the effects of insulin on various types of memory. The aim of the present study is to determine whether intracerebroventricular (ICV) administration of insulin improves the water maze performance of rats. The experimental groups had pretraining insulin infusion (2, 4, 8, 16, and 32 mu) into the third ventricle, and then they were compared with a sham (saline) group. Insulin treatment caused an enhancing effect on spatial memory in a dose-dependent manner. The low doses (2, 4, and 8 mu) of insulin had no significant effect on the water maze achievement of rats, whereas higher doses (16 and 32 mu) significantly improved the rats' performance. These results suggest that ICV administration of insulin may result in a dose-dependent improvement of memory function in rats.
Hartford Hospital, ONRC/IOL, Hartford, United States
Yale School of Medicine, Dept. of Psychiatry, New Haven, United States
John Hopkins School of Medicine, Dept. of Psychiatry and Behavioral Sciences, Baltimore, United States
Maryland Psychiatric Research Center, University of Maryland School of Medicine, Baltimore, United States
Beth Israel and Deaconess Medical Center, Harvard Medical School, Boston, United States
Department of Psychiatry, University of Illinois at Chicago, Chicago, United States
Medical Center, University of Texas Southwestern, Dallas, United States
Departments of Psychology and Neuroscience, University of Georgia, Athens, GA, United States
Combination of Structural and Functional Connectivity Mapping Shows Abberation in Schizophrenia and Bipolar Patients and Their Relatives
Schizophrenia (SZ) and Bipolar Disorder (BP) are both hypothesized to involve disordered brain connectivity. To test this, we combined two methods of estimating brain connectivity to compare SZ and BP to healthy controls. Anatomical connectivity (AC) was quantified using a diffusion tensor imaging (DTI) analysis of white matter tract integrity, and functional connectivity (FC) measured using the strength of temporal correlations in resting fMRI. The measure of spatial coherence between those two connectivity approaches, assesses Functional-Anatomical Coherence (FAC) and was used to analyze the related changes in brain connectivity in both diseases. This spatial coherence measure was applied not only to whole brain but to smaller resting state networks as well.
275 healthy controls, SZ and psychotic BP probands and their first-degree relatives from Bipolar-Schizophrenia Network on Intermediate Phenotypes (BSNIP) study were analyzed. Global analysis showed decreased AC and FAC in probands. FC showed a more complicated picture, with various brain networks showing decreases and increases in both clinical groups.
We identified brain systems that show both increases or decreases in FAC in probands with a general trend that networks showing increased FC show decreased FAC, and networks showing decreased FC show increased spatial FAC, compared to controls. This suggests that while overall connectivity tends to be lower in probands FC is more strongly determined by the underlying structural substrate. However, some networks (mainly located in Default Mode Network) show FC increases are accompanied with decreases in FAC and thus are less dependent on the underlying neuronal fibers. This, likely compensatory, mechanism may be explained by an increased utilization of connections using secondary smaller fibers leading to more circuitous, indirect connections.
While most effects were similar in SZ and BP, networks showing differences between clinical groups were identified.
The study demonstrates the clinical potential of analysis combining anatomical and functional connectivity measures and that extend from global assessments to analysis of smaller brain networks.
The example of network within DMN showing differences in both connectivity measures and its spatial coherence. While both clinical group show deficit in AC, only SZ show change (increase) in FC, both clinical groups show (opposite) changes in FAC.
Data Analysis
VaroquauxG.1GramfortA.1JenattonR.2ObozinskiG.2BachF.2ThirionB.1
INRIA/Neurospin, CEA Saclay, Gif sur Yvette, France
INRIA, Sierra, Paris, France
Spatial modeling resting-state brain activity with sparse decompositions
Brain imaging can be used to give a view on its functional organization. Starting from spatially-resolved recordings of brain activations at rest, exploratory analysis such as independent component analysis (ICA) can separate regions with different functional characteristics. With this application in mind, we review and compare recent progress in unsupervised models akin to PCA and sparse PCA (SPCA) applied to brain imaging. We introduce a generative model for brain resting-state time series, in which the signals are represented as linear combinations of latent spatial maps. Going beyond exploratory data analysis, our model provides a natural framework to guide parameter selection and impose a prior information on the structure of the signal. In particular, we explore approaches to imposing spatial structure or to modeling multiple subjects in this framework. We show that using well-designed penalizations injecting sparsity in a PCA context can yield better brain parcellations than the current ICA-based approach.
In this contribution, we study the use of sparse-PCA-based approach to learn brain parcellations. In particular we detail empirical results to guide methodological choices and introduce statistical learning tools that are useful to impose priors consistent with our observations. Here we focus on linear decomposition models.
Emprically, both ICA and SPCA can extract meaningful brain parcellations. However, at hig model order, a large fraction of the ICA maps do not segment salient features. On the opposite, All maps of SPCA-based parcellation delineate well brain regions. In addition, going beyon sparsity, we study spatially-structured or smooth sparsity to regularize spatially the maps and segment better brain regions. Finally a hierarchical group model can be combined with those sparse models. We find it gives a detailed and rich group-level parcellation of the brain in functional units from rest fMRI.
National Taras Shevchenko University of Kyiv, Educational and Scientific Centre “Institute of Biology”, Department of Physiology of brain and psychophysiology, Kyiv, Ukraine
National Taras Shevchenko University of Kyiv, Educational and Scientific Centre “Institute of Biology”, Department of Human and Animal Physiology, Kyiv, Ukraine
EEG features dynamics in prolonged rest state depending on the emotional reaction
The investigation of interrelations between emotional state and brain functioning ranks as very important field of neurophysiology. The objective of the study was to investigate the features of human brain electrogenesis in prolonged awake state under limitation of afferent perceptual date depending on individual emotional characteristics (Boyko test). 26 volunteers (women and men) - students aged 18 to 23 years participated in this study. EEG was registered over a period of 11 minutes during the rest state. The spectral power density (SPD) and relative spectral density (RSD) of all frequencies from 0.2 to 35 Hz was estimated. The Speerman rank test was carried out for the correlation analysis. It was shown, that the intensity of euphoric type of emotional reaction correlates directly with SPD lower α1- (left occipital recording site (RS)), lower α2- (right temporal, left frontal and occipital RS), and upper α- (parietal, left temporal and occipital RS). It correlates also directly with lower α2- RSD (left frontal RS), β1- SPD (right parietal RS) and q1- SPD (right temporal RS) and negatively with q2- RSD (left temporal RS). The intensity of dysphoric type of emotional reaction correlates negatively with q1- SPD (right temporal RS), lower α2- (left parietal RS) and upper α- (both frontal and left temporal RS). The intensity of refractory type of emotional reaction correlates negatively with lower α1- SPD (in all recording sites of right hemisphere except frontal) and lower α1- RSD (right temporal RS) as well as with lower α2- SPD (in left frontal and right temporal RS) and lower α2- RSD (in left frontal RS). Thus, any kind of conscious human activity even in passive awake state is internal psychological activity of a person (internal attention, language, semantic activity, imagination, make decision processes etc.), associated with development of emotional reactions and individual emotional characteristics. This fact must be taken into consideration during psychophysiological experimentation.
Rutgers University, Center for Molecular and Behavioral Neuroscience, Newark, United States
New York University, Child Study Center, New York, United States
Child Mind Institute, New York, United States
Neural Signatures of Dyslexia and Remediation: A Resting-State Functional Connectivity Approach
Methods: Using a resting-state functional connectivity (RSFC) approach with an observational, cross-sectional design, we aimed to investigate neural signatures of literacy deficits and those of remediation in children with dyslexia (7–15 yrs old). Our participants with previous diagnosis of dyslexia were subdivided into 3 groups: 1) children with current literacy deficits/no remediation (Dys-N), 2) those who remediated their reading deficits (Dys-R), and 3) those remediated both reading and spelling deficits (Dys-RS).
Results: Seed-based analyses of known reading regions, validated by our previous RSFC studies in unimpaired readers, revealed atypical patterns of two regions in dyslexia groups relative to age-matched typically developing children (TDC). First, RSFC between the left intraparietal sulcus and left middle frontal gyrus, regions within the dorsal attentional network, was decreased in all dyslexia groups relative to TDC (Fig 1). Second, RSFC of the left fusiform gyrus, a region well known as the Visual Word Form Area (VWFM), exhibited altered patterns in the remediation groups (Dys-R and Dys-RS), relative to Dys-N and TDC groups (Fig 2): In the remediation groups, its RSFC with the right middle occipital gyrus was increased, reflecting increased coupling between visual regions, whereas its RSFC with the right medial prefrontal cortex within the default network was decreased (i.e., stronger negative RSFC), indicating increased functional segregation for efficient cognitive processing. These results suggest 1) an atypical pattern in the attention network associated with dyslexia can persist, even following remediation, and thus calling for further focus on the role of attention in dyslexia and intervention, and 2) successful remediation of literacy deficits may be associated with the emergence of compensatory circuits anchoring in VWFM. Our findings were bolstered by the correspondence between RSFC strength and literary competence (Fig 1 & 2).
Persistent dysfunctions associated with the history of dyslexia - Left Intraparietal Sulcus (L.IPS).
Compensatory changes associated with behavioral remediation - Left Fusiform Gyrus (L.FFG).
Conclusions: Taken together, RSFC has potentials to investigate neural signatures of dyslexia, to monitor dynamic changes associated with behavioral remediation over time, and eventually to evaluate the effectiveness of remediation for dyslexia.
Data Analysis
GorgolewskiK.1HalchenkoY.2HankeM.3NotterM.4VaroquauxG.5WaskomM.L.6ZieglerE.7GhoshS.8
Max Planck Institute for Human Cognitive and Brain Sciences, Leipzig, Germany
Darthmoth College, Hanover, United States
University of Magdeburg, Magdeburg, Germany
University of Zurich, Zurich, Switzerland
INRIA, Gif-sur-Yvette, France
Stanford University, Stanford, United States
Université de Liège, Liège, Belgium
Massachusetts Institute of Technology, Cambridge, United States
Studying resting state connectivity using Nipype
Nipype is data processing framework written in Python. Its main goal is to provide a uniform access to many already existing neuroimaging tools. These currently include but are not limited to: FSL, SPM, FreeSurfer, and AFNI. At its core Nipype is a library of wrappers that take care of parsing and validating inputs, executing the software (whether it is a command line program, MATLAB or Python script), and collecting outputs (see Figure 1). The wrappers (also called Interfaces) can be used separately in an interactive fashion or can be combined into workflows. Nipype enables rapid prototyping of simple to complex data processing workflows. Workflows created in Nipype can be efficiently executed on a local machine or a computer cluster. The framework takes advantage of the information about the dependencies between the Interfaces to parallelize the data processing. Additionally nipype supports seamless parameter space exploration on any level of the data processing workflow.
FIG. 1.
Nipype excels by providing access to multiple preprocessing algorithms. For resting state data, one can choose slice timing, motion correction, smoothing, coregistration and temporal filtering algorithms from AFNI, FSL, FreeSurfer and SPM packages. Additionally, algorithms are available for artifact detection, CompCor and simultaneous slice timing and motion correction algorithm [1]. Nipype also supports ICA methods through MELODIC (FSL). Preprocessed resting state data can be easily mapped to regions and surfaces through FreeSurfer interfaces. Such resting state connectivity analyses can be constrained, visualised, and/or supplemented by anatomical connectivity estimated from Diffusion Weighted Imaging (DWI). Nipype supports DWI data processing through FSL, Camino, MRtrix, and Diffusion Toolkit. Several diffusion modelling and tractography algorithms are available. Both resting and diffusion data can be represented as graphs and analyzed using the Connectome Mapper Toolkit and NetworkX library. Nipype includes examples of applying predefined resting state workflows to freely available data (INDI, NKI-RS). Nipype provides a framework for reproducible analysis and allows efficient exploration of algorithms and their parameters in the context of connectivity and other brain imaging analysis.
References
RocheA.A four-dimensional registration algorithm with application to joint correction of motion and slice timing in fMRI. IEEE Trans Med Imaging, 2011Aug30,8:1546–54.a-1304
Physiology
TsaiP.-J.1LinC.-P.2WuC.3
National Yang-Ming University, Dept. Biomedical Imaging and Radiological Sciences, Taipei, Taiwan
National Yang-Ming University, Institute of Neuroscience, Taipei, Taiwan
National Central University, Graduate Institute of Biomedical Engineering, Jhongli, Taiwan
Investigating Brain Spontaneous Fluctuations and Functional Connectivity upon Awakening
Introduction: Sleep, a spontaneous brain function, plays an important role in regulating the mental and physical conditions. Literature indicates that sleep facilitates brain plasticity and allows change of brain fluctuations after self-regulation in sleep. Previous study used PET and EEG to examine brain activities during sleep inertia, which passes through sleep modulation and re-establishes condition of awakening. However, the spatial details were scarce without connectivity information. Therefore, we applied fMRI-based functional connectivity (FC) and amplitude of low frequency fluctuation (ALFF) to investigating brain oscillations after sleep.
Method: 22 non-sleep-deprivation healthy males (mean: 24±4 y/o) participated this study. Simultaneous fMRI and EEG recordings were conducted between 11pm∼4am before (6-min), during (at most 2-hr) and after (6-min) sleep. Off-line EEG validated all participants indeed fell sleep. For each session, correlation and spectrum analyses were used to detect default mode network (DMN), hippocampal network (HPC) and sensory-motor network (SMN) to assess functional connectivity and their corresponding ALFF. Indices between pre-sleep and post-awakening were compared by paired t-test.
Results:Connectivity- Cortico-cortical connectivity reduced after awakening in SMN, non-significantly different in DMN and enhanced connectivity between HPC and anterior/posterior cingulate cortex (Fig. 1). Correlations between thalamus and each cortical network substantially increased.
Regional connectivity changes between pre-sleep and post-awakening.
Activity- In contrast to pre-sleep, the global mean ALFF reduced after sleep. However, low-frequency activity enhanced in anterior but reduced in posterior upon awakening. The thalamic-motor networks had significantly reduced ALFF while other observed networks had sustained ALFF after sleep (Fig. 2).
Mean ALFF change after awakening. Black line shows the global average.
Conclusion: Cortico-cortical disconnections and reduced activity may be the cause of poor performance in sleep inertia. Enhanced thalamo-cortical connection and activity may lead to consciousness recovery. At last, increased connectivity from limbic system to frontal lobe may be associated with onset of self-awareness.
Applications: Psychiatry
CullenK.1Klimes-DouganB.2LimK.1
University of Minnesota Medical School, Psychiatry, Minneapolis, United States
University of Minnesota, Psychology, Minneapolis, United States
Resting State Networks in Unmedicated Adolescents with Major Depression
Question: Major Depressive Disorder (MDD) frequently emerges during adolescence and is associated with significant morbidity and mortality. Due to ongoing refinement of neural networks during adolescence, research investigating connectivity in adolescent MDD is critical. We previously found lower functional connectivity stemming from the subgenual ACC in a pilot sample of adolescents with MDD that had co-morbid substance use and were treated with medications. This study sought to investigate neural networks in unmedicated, non-substance using adolescents with MDD versus healthy controls.
Methods: 35 adolescents with MDD and 22 healthy adolescents underwent an MRI scan at the University of Minnesota on a 3T Siemens Trio scanner. We obtained a 6 min resting-state scan (180 EPI volumes, TR=2000 ms; TE=30 ms; flip angle=90; 34 contiguous AC-PC aligned axial slices; matrix=64×64; FOV=22 cm; acquisition voxel size=3.4 mmx3.4 mmx4 mm). A high-resolution T1-weighted anatomical image was also acquired. Standard preprocessing and analyses were conducted using FSL. A whole-group independent components analysis was conducted using MELODIC to identify 20 components. We then conducted dual regression and randomise to investigate group differences for each component.
Results: Significant group differences at the corrected level were identified in two components:
(a) In a network that was comprised of basal ganglia and cerebellum (see figure 1), we observed a cluster in which patients showed greater connectivity within this network than controls, located in the left parietal lobe (see figure 2);
(b) In a network comprised of subgenual anterior cingulate and thalamus (see figure 3), patients had lower connectivity than controls in the right temporal lobe (see figure 4). No differences in connectivity were found in the default mode network.
Basal Ganglia and Cerebellum Network.
Group Difference for Basal Ganglia/Cerebellum Component MDD > Controls.
Subgenual ACC and Thalamus Network
Controls > Patients Subgenual ACC and Thalamus Network
Conclusion: We found significant abnormalities in resting networks in adolescents with MDD. These are supportive of our prior work implicating impairment in networks connected to the subgenual ACC, and add new information where patients have greater connectivity. Developmental interpretations of the differences between our findings and those that have been published on adults will be discussed.
Data Analysis
HummerA.12SladkyR.12LanzenbergerR.12MoserE.12WindischbergerC.12
Medical University, Centre for Medical Physics and Biomedical Engineering, Vienna, Austria
Medical University, MR Centre of Excellence, Vienna, Austria
Modeling activation patterns during the Tower of London and a motor-visual task using a set of resting state networks
Question: The modulations of the BOLD signal during resting-state have been shown to be temporally correlated across functionally related areas and are therefore referred to as resting-state networks (RSNs). Over the years a number of RSNs have been discovered and replicated by several groups including motor areas, visual areas, language areas, basal ganglia and amygdalae. Supposing that RSNs may be regarded as functional networks we hypothesized in this study that activation patterns found in typical task-based paradigms are superpositions of these RSNs.
Methods: 28 healthy subjects participated in this study. Two well-established paradigms were used: (1) Tower of London (TOL) tasks, (2) a combined finger tapping and flickering checkerboard task (FT). The same subjects were scanned in resting condition with their eyes open. In addition to standard GLM analysis in SPM8 of the task-based paradigms, we performed two different analysis. First we calculated seven RSNs using seed voxels (10 mm radius) in the following predefined ROIs: bilateral superior parietal lobule, lentiform nucleus, precentral gyrus, as well as calcarine sulcus. Secondly, we used 20 previously identified RSNs by other groups. In both analyses, we used the RSN sets as spatial basis functions to model the activation maps obtained for the TOL and FT tasks, i.e. task-based activation maps were regressed against a set of 7 or 20 RSNs, respectively.
Results:Figure 1 shows the FT results including activation maps obtained by random-effects group analysis (second row), activation maps modeled using 7 RSNs (third row) and 20 RSNs (bottom row). Figure 2 shows the corresponding results for the TOL paradigm. It can be seen that task-based activation maps are well approximated by RSNs from the same subjects (fig. 1) or from a very large reference group (fig. 2).
FIG. 1.
FIG. 2.
Conclusions: In this study we were able to show a strong correspondence between functional connectivity maps and model-based activation maps. Our study indicates that task-specific processing may be caused by a shift of activation in well-defined functional networks which are present (and measurable) even without processing an explicit task. In conclusion, these results emphasize the fundamental concept of the brain acting as a set of a small number of neuronal networks rather than working as large number of highly specialized areas.
Physiology
CabralJ.12DecoG.13
Universitat Pompeu Fabra, Center of Brain and Cognition, Barcelona, Spain
University of Oxford, Department of Psychiatry, Oxford, Spain
Institut Català de Recerca i Estudis Avançats (ICREA), Barcelona, Spain
Brain activity during rest: a signature of the underlying network dynamics of coupled oscillatory brain areas?
Neural activity in the brain exhibits complex oscillatory phenomena that can be compared with the ones observed in artificial network models of coupled oscillators. In particular, neuroimaging studies of brain activity during rest have reported slow spatiotemporally organized fluctuations and correlated band-limited power modulations. Simultaneously, theoretical works on the area of physics have reported similar dynamic behaviours using synthetic networks with modular structure and time-delayed interactions. However, for analytical tractability, such studies are restrained to networks with simplified connectivity structures, and the extension to complex network architectures, like the brain, remains unresolved.
In this work, we consider cortical regions as dynamical entities intrinsically oscillating in the gamma-frequency band. We build a network model by embedding these oscillatory units in the large-scale three-dimensional wiring architecture of the brain (Fig 1). Their cooperative behaviour is simulated using the Kuramoto model with time-delayed interactions.
3D network derived from the white-matter pathways connecting cortical regions.
Under realistic parametric conditions, we observe the spontaneous emergence of a complex dynamics that encompasses the above-mentioned mechanisms. Furthermore, periodic increases of alpha- and beta-band power occur due to metastable synchronized states (Fig 2), where subsets of regions become phase-locked at reduced collective frequencies. These states emerge sporadically and are naturally disrupted due to competitive mechanisms between multiple stable states.
The system's synchrony degree (A) fluctuates in a non-Gaussian manner (B) indicating multistability. Although nodes have a 40Hz natural frequency, increases in 10–20Hz power occur sporadically (C,D) and correlate with periods of increased synchrony (A), whereas the power in other frequencies remains constant (E,F).
These results provide a theoretical scenario from the perspective of dynamical systems to explain the physiology of resting-state dynamics at the macroscopic level. Furthermore, this scenario suggests new analytical approaches for experimental studies.
Applications: Psychiatry
HuS.1ZhangM.2WangQ.3QiH.1XuY.1
First Affiliated Hospital, College of Medicine, Zhejiang University, Department of Psychiatry, Hangzhou, China
Second Affiliated Hospital, College of Medicine, Zhejiang University, Department of Radiology, Hangzhou, China
First Affiliated Hospital, College of Medicine, Zhejiang Unviersity, Department of Radiology, Hangzhou, China
Is ecstasy-induced protracted symptom of motion perception associated with altered regional homogeneity of brain? A case study with resting fMRI
Protracted symptoms induced by ecstasy haven't been reported. A 31-year-old female ever had half-year drug abuse history of ecstasy. In the later over 7-year period of abstinence, she persisted to have a symptom of abnormal motion perception. Resting functional Magnetic Imaging (fMRI) and were performed for the patient, and 20 healthy females were selected as the controls. Regional homogeneity (ReHo) approach was applied to analyze the difference in the brain baseline between the patient and the controls. The patient showed the increased ReHo in left inferior temporal gyrus, right calcarine, left occipital gyrus, left inferior frontal gyrus, left angular gyrus, right postcentral gyrus, left precuneus, right angular gyrus, and the decreased ReHo in left putamen and left medial frontal gyrus. Dynamic electroencephalography (EEG) showed that paroxysmal sharp wave and spike-slow wave were observed in the left central area and left occipital area during sleep period. We explored to apply repetitive Transcranial Magnetic Stimulation (rTMS) for the patient. After two weeks, the symptom was improved obviously. Adding a serotonin-norepinephrine reuptake inhibitor, duloxetine (120 mg/d), combined with rTMS gradually alleviated the residual symptom of the patient. The patient's abnormal motor perception might be associated with the altered cerebral ReHo. However, the clinical efficacy of rTMS and duloxetine for the long-term neurotoxicity of ecstasy need further double-blind trials to verify.
ReHo map shown as the KCC map of the patient vs. the controls (two-sample t test; P < 0.05, corrected) in the resting state. T- score bars are shown on the right. Hot colors indicate the brain regions with increased ReHo of the patient, compared to the controls.
ReHo map shown as the KCC map of the controls vs. the patient (two-sample t test; P < 0.05, corrected) in the resting state. T- score bars are shown on the right. Cold colors indicate the brain regions with decreased ReHo of the patient, compared to the controls.
Paroxysmal sharp wave and spike-slow wave could be observed in the left occipital area and left central area during the patient's sleep period.
Data Analysis
GuentherT.1BazinP.-L.2SchindlerS.1StraußM.1GeyerS.2SchönknechtP.1
University Hospital Leipzig, Department of Psychiatry, Leipzig, Germany
Max Planck Institute for Human Cognitive and Brain Sciences, Department of Neurophysics, Leipzig, Germany
Voxel-based morphometry of T1 relaxation time maps from high-field MR (7T) in unmedicated patients with major depression
In patients with major depressive disorder (MDD), structural brain changes are commonly observed in a neural network comprising frontal, thalamic and limbic regions. Using voxel-based morphometry (VBM), affective and cognitive symptoms are most consistently associated to gray matter density reductions in the bilateral anterior cingulate cortex with additionally reported reductions in the right hippocampal and parahippocampal gyrus as well as right prefrontal regions and the left thalamus. Inconsistently, some studies reported gray matter increases.
Recent developments in high-field magnetic resonance (MR) imaging offer the visualization of new features in the brain at sub-millimeter voxel resolution. This gain is accompanied by increased levels of image artifacts in human MR images. To overcome respective limitations, the newly introduced two-inversion contrast magnetization-prepared rapid gradient-echo sequence (MP2RAGE) provides quantitative maps of T1 relaxation times.
The aim of the study is to assess the effects of different spatial normalization techniques on the detection of brain structural alterations in depression using VBM. To this concern, 13 unmedicated patients with MDD will be compared to age and gender matched psychiatric healthy control subjects. Voxel-based group-wise comparisons will be performed on T1 relaxation time maps from high-field 7T MR using three distinct registration techniques: SPM8 (Statistical Parametric Mapping), DARTEL (Diffeomorphic Anatomical Registration Through Exponentiated Lie Algebra), and VABRA (vectorized form of the Adaptive Bases registration Algorithm).
Results of this pilot study will be presented and critically discussed against the existing literature.
Physiology
KlingnerC.1BrodoehlS.1WitteO.1
Friedrich Schiller Univerität Jena, Neurology, Jena, Germany
Perceptual plasticity due to altered brain connectivity
It is well known that the threshold for somatosensory perception may adapt to different inputs. Recent studies suggest the presence of a modulating effect of somatosensory inputs on the spinal dorsal horn. However, the effects of somatosensory inputs on cerebral processing and, in particular, on the functional connectivity of the somatosensory brain network are either poorly understood or have not yet been investigated. In this study, we investigated the longitudinal impact of somatosensory stimuli on the functional connectivity of the somatosensory brain network. We performed resting state functional magnetic resonance imaging (fMRI) in 12 healthy subjects before and after unilateral electrical median nerve stimulation, and we combined this analysis with a psychophysiological examination of changes of the perception threshold. We found that unilateral median nerve stimulation increased perception thresholds bilaterally and increased functional connectivity between most cortical areas of the somatosensory network. The major finding, however, was decreased functional connectivity between both secondary somatosensory cortices and the bilateral medial nuclear complex of the thalamus; this decreased connectivity was correlated with increased perception thresholds. These findings emphasize the importance of the medial thalamic nucleus for the perceptual awareness of somatosensory stimuli.
Applications: Psychiatry
JungW.H.1JangJ.H.1KimE.1KwonJ.S.1
Seoul National University Hospital, Department of Psychiatry, Seoul, Korea, Republic of
Altered connectivity degree in the cortico-striatal circuit in obsessive-compulsive disorder
Introduction: Obsessive-compulsive disorder (OCD) is characterized by aberrant activity in the cortico-striatal circuit that associated with control and affective mechanisms. Although several recent studies found abnormal resting-state functional connectivity in the cortico-striatal circuit of OCD, the question of whether a deficit in total functional connectivity degree in the cortico-striatal circuit, which is considered as an important node in the network, is present in OCD remains unclear. Therefore, we investigated whether there are abnormalities in patterns of total functional connectivity degree during resting-state.
Methods: Nineteen patients with OCD and 18 matched healthy controls were scanned during resting-state. Based on previous literatures, 32 regions of interest (ROIs) that consisted of the cortico-striatal circuit, particularly the regions associated with the reward processing, were created by using atlas templates (Figure 1). We performed ROI-wise Pearson's correlation analyses among these ROIs. It yielded a 32×32 correlation matrix for each subject (Figure 2). Then, we calculated total functional connectivity degree based on graph theory (Figure 3). To investigate differences in these values between two groups, we performed independent t-test and used a permutation-based correction for multiple comparison.
Region of interests (ROIs) for the functional connectivity analysis. (A) Thirty-two regions comprising the network on a MNI T1 image. (B) 3D rendering image for these ROIs.
Mean functional connectivity of the network for (A) healthy controls and (B) OCD patients.
Ranking of the selected brain regions based on their total functional connectivity degree in (A) healthy controls and (B) OCD patients. Brain regions with larger vales are considered to be more important nodes in functional connectivity network than other regions.
Results: Compared to controls, OCD patients showed a significant increase of total connectivity degree in the lateral orbitofrontal cortex (BA 47) and a significant decrease of total connectivity degree in the hippocampus.
Conclusions: Our findings provide evidence that OCD have aberrant functional connectivity in the cortico-striatal circuit at rest. We further suggest that the lateral orbitofrontal cortex may play a more crucial role in the pathophysiology of the OCD than the medial orbitofrontal cortex.
Data Analysis
RoquetD.123FoucherJ.123JardriR.4
INSERM, Unité 666, Psychiatry, Strasbourg, France
UdS, Université de Strasbourg, psychiatry, Strasbourg, France
HUS, Hôpitaux Universitaires de Strasbourg, Psychiatry, Strasbourg, France
Laboratoire de Neurosciences Fonctionnelles et Pathologies, Psychiatry, Lille, France
Tailoring neuronavigation using fMRI: Comparative reliability of Generalized Linear Model and Independent Component Analysis
Functional brain imaging of hallucinations might help to tailor rTMS target for each patient. Until now, the level of confidence in imaging results remains to be assessed. In the current experiment, we compared the two main functional MRI methods used in the literature to analyze per-hallucinations: general linear model (GLM) via statistical parametric mapping (SPM) and independent component analysis (ICA).
Ten patients took part to 2 to 7 fMRI sessions during which they had to signal their hallucinations in real-time. Intra-subject reproducibility of thresholded ICA and SPM maps on raw and smoothed data were compared at the voxel level using Fleiss' kappa.
We obtained maps from 8 patients. Median Kappa was of 0.52, 0.38, 0.13 and 0.05 for ICA smooth, ICA raw, GLM smooth and GLM raw respectively. Methods and smoothing significantly differed (corrected p=0.001 and 0.003 respectively) whereas the thresholds did not play a role.
We evidenced that ICA outperformed GLM in terms of test-retest reliability of hallucinatory networks detection. Furthermore, we showed that the moderate agreement between ICA maps at the voxel level makes this method the most reliable tool to guide neuromodulation treatments for refractory hallucinations.
Inter-session concordance and volume of commonly activated voxels. a. Fleiss's kappa value, i.e., intersession concordance (median, 1st and 3rd quartile), according to the different statistical threshold for SPM analysis on raw data, i.e. unsmoothed (black squares), SPM on smoothed data (gray squares), ICA on raw (black circles) and ICA on smoothed data (gray circles). The signs (**, * and ·) stands for the p value of the Wilcoxon signed-rank test between SPM and ICA methods for the same data set (p = 0.011, p = 0.017 and p = 0.036 respectively). b. Volume of commonly activated voxels in cm3 ( = ml, median, 1st and 3rd quartile). Method and post-hoc tests are coded as in a. The numbers below abscise stand for the number of participant that have non-zero common according to the following order: SPM raw, ICA raw, SPM smooth and ICA smooth, i.e., same as for their respective horizontal gap.
Physiology
CordaniL.1HaßemerC.1StehleJ.2KellC.13
Goethe University Frankfurt, Brain Imaging Center, Frankfurt am Main, Germany
Goethe University Frankfurt, Institute of Anatomy III, Frankfurt am Main, Germany
Goethe University Frankfurt, Department of Neurology, Frankfurt am Main, Germany
How time of day affects brain function: Diurnal network dynamics underlying stable visual perception and interindividual variability in locomotion
The circadian system relies on a hypothalamic master clock that times in anticipation behavior to periods of activity and rest. Given that information about time of day is disseminated, all hierarchical levels involved in control of behavior could potentially be temporally modulated. The sensory and motor systems could use temporal information differently: To keep visual perception constant, the circadian system could inform visual perceptual systems about expected changes in physical properties of optic signals. By contrast, circadian modulation of motor systems will be influenced by external Zeitgebers like social cues. It is unknown whether and how the brain predicts these changes and uses information about time of day to keep visual perception constant and adapt our motor activity to environmental needs. To address this question, we studied 17 male adults whose individual diurnal motor profile (IDMP) was assessed over 3 weeks using an actimeter. They underwent fMRI scanning sessions on 1–3 weekends from 8a.m. to 11p.m. which included resting-state, a simple motor and a visual perceptive task. Mean resting activity was analyzed voxel-wise in the entire brain and task related BOLD activity extracted from cortical motor and visual regions of interest. Individual brain activity was correlated with IDMP. Only resting state activity in supplementary motor regions predicted the IDMP, suggesting that various Zeitgebers converge in premotor cortex to modulate motor activity. We found that modulation of mean BOLD translated into modulation of functional connectivity of the motor network. In the visual cortex and the hypothalamic master clock resting state activity showed time-of-day dependent modulation. Here, diurnal changes in mean BOLD translated into modulation of functional connectivity between visual cortex and prefrontal regions involved in perceptual decision making. Together, our data suggest that the brain uses circadian cues to keep perception constant by modulating activity of functional connectivity within the visual perceptual network. In contrast, IDMP is not directly controlled by the hypothalamus. Instead, multiple internal and external Zeitgebers converge in supplementary motor regions to bias motor behavior towards activity levels appropriate for the predicted environmental and social conditions.
Nanjing Jinling Hospital, Medical School of Nanjing University, Department of Medical Imaging, Nanjing, China
Taishan Medical University, Department of Radiology, Taian, China
Mental Health Institute, The Second Xiangya Hospital of Central South University, Department of Child Psychiatry, Changsha, China
Mental Health Center of Shenzhen, Shenzhen Kangning Hospital, Shenzhen, China
Suzhou University, Department of Pharmacology, Suzhou, China
University of Florida, Department of Biomedical Engineering, Gainesville, United States
University of Florida, Department of Psychiatry and McKnight Brain Institute, Gainesville, United States
Increased Activity Imbalance in Fronto-Subcortical Circuits in Adolescents with Major Depression
Background: A functional discrepancy exists in adolescents between frontal and subcortical regions due to differential regional maturational trajectories. It remains unknown how this functional discrepancy alters and whether the influence from the subcortical to the frontal system plays a primacy role in medication naïve adolescent with major depressive disorder (MDD).
Methods: Eighteen MDD and 18 healthy adolescents were enrolled. Depression and anxiety severity was assessed by the Short Mood and Feeling Questionnaire (SMFQ) and Screen for Child Anxiety Related Emotional Disorders (SCARED) respectively. The functional discrepancy was measured by the amplitude of low-frequency fluctuations (ALFF) of resting-state functional MRI signal. Correlation analysis was carried out between ALFF values and SMFQ and SCARED scores.
Results: Resting brain activity levels measured by ALFF was higher in the frontal cortex than that in the subcortical system involving mainly (para) limbic-striatal regions in both HC and MDD adolescents. The difference of ALFF values between frontal and subcortical systems was increased in MDD adolescents as compared with the controls.
Conclusions: The present study identified an increased imbalance of resting-state brain activity between the frontal cognitive control system and the (para) limbic-striatal emotional processing system in MDD adolescents. The findings may provide insights into the neural correlates of adolescent MDD.
T-statistical map of the resting-state brain activity levels between the adolescents with MDD and HCs. The color-coded t-score bars indicated increased (warm color) ALFF and decreased (cold color) ALFF in the MDD patients relative to HCs.
Brain ctivity imbalance in the fronto-subcortical activities shown by ALFF during resting-state. A: The mean ALFF of each ROI defined on Figure 1 for the HC and MDD groups was obtained by averaging across the HC subjects (solid bar) and MDD patients (dashed bar) in the frontal regions (red) and (para) limbic-striatal regions (blue). B: The imbalance of fronto-(para) limbic striatal activities at a system level. The mean ALFF values of the ROIs in the frontal and the (para) limbic-striatal systems were further averaged to obtain the ALFF of the two systems (red: frontal, blue: (para) limbic-striatal).
FIG. 3.
Data Analysis
KalcherK.123BoubelaR.N.123HufW.1234LammC.5LanzenbergerR.4MoserE.23WindischbergerC.23
Vienna University of Technology, Department for Statistics and Probability Theory, Vienna, Austria
Medical University of Vienna, MR Centre of Excellence, Vienna, Austria
Medical University of Vienna, Centre for Medical Physics and Biomedical Engineering, Vienna, Austria
Medical University of Vienna, Department for Psychiatry and Psychotherapy, Vienna, Austria
University of Vienna, Institute for Clinical, Biological and Differential Psychology, Vienna, Austria
Calibration of task-based fMRI results using single-subject local fractional amplitude of low-frequency fluctuation information (fALFF)
Objectives: In task-based fMRI experiments, physiologic fluctuations in the BOLD-signal can account for variations between results at single-subject level (Fox et al. 2007). Correction of these individually different physiological variations can be employed. Up to now, subject-specific indicators based on the amplitudes of low-frequency fluctuations (ALFF) calculated from resting-state measurements have been used to estimate these physiological effects and improve second-level analysis (Di et al. 2012). In this study we extend this approach to the voxel-level in by calculating voxel-specific extimates of vascular responsivity by using localized information of fractional ALFF (fALFF).
Methods: Subject-specific voxel-wise scaling factors of task-induced brain activation based on the slopes between fALFF during resting state and BOLD signal change during tasks in the neighbourhood of each voxel is computed and used to reduce physiological inter-subject and inter-region variability irrelevant for group analysis. 47 healthy subjects have been scanned on a Siemens TIM Trio 3T during resting-state as well as while performing right-hand finger-tapping cued by a flickering checkerboard visual stimulation. Calibration has been applied to single-subject datasets and calibrated second-level results have been compared to uncalibrated results.
Results: Significant activation during task has been detected in left motor and in visual areas. In both of these areas, significant positive local correlations between fALFF and task activation have been found. Calibration increased t-values in these areas on average by 10%, while leaving t-values of other brain regions unchanged. Furthermore, significant negative local correlations have been identified in task-deactivated regions, e.g. the posterior cingulate cortex.
Conclusions: Local correlation between fALFF and task activation magnitude can be employed to calibrate single-subject task-based fMRI activation maps, and this calibration leads to a significant increase in second-level analysis t-values located specifically in task-activated regions. The effect has been shown in visual, motor and posterior cingulate cortex, and further studies may investigate its usability in other brain regions, especially prefrontal and subcortical areas.
FIG. 1.
FIG. 2.
FIG. 3.
Physiology
SandovalH.1SandsS.2
Texas Tech PLFSOM, Center of Excellence in Neuroscience, El Paso, United States
Sands Research, El Paso, United States
Slow Cortical Potentials of Visual Retinotopic Maps
Question: Slow Cortical Potentials (SCPs) are EEG brain waves oscillating at frequencies below 0.5 Hertz. Its source has been mainly attributed to postsynaptic potentials of pyramidal neurons (Birbaumer, 1999). Literature evidence supports the relationship between SCPs and blood oxygen level-dependent fMRI responses during different cognitive imaging studies (Khader, 2008). This study was conducted to determine if SCPs can provide a better understanding of human neuroanatomy and neurophysiology as well as neural activity associated with sensory processing and blood oxygen level dependent fMRI signal.
Methods: 32 healthy volunteers ages 18–59 years participated in accordance with local Institutional Review Board guidelines. EEG was recorded with a DC amplifier, 68 sintered silver/silver chloride electrodes with left ear as common reference. The amplifier's bandpass range was DC-200 Hz and the digitization rate was 1000 Hz. Electrode positions were based on 10–10 extension to the 10–20 positioning system. Visual stimuli consisted of a total of 10 repetitions of 10 sec block stimuli with 90 checkerboard presentations per train per quadrant. Biological artifacts were corrected offline. DC level correction and Global Field Power (GFP) were performed.
Results: Current Density Reconstruction of Visual Evoked Potentials (VEP) for the four visual fields was generated as well as for the SCP. Current density maps showed consistent VEP localizations with well-established retinotopic maps. Bilateral frontal and temporal activations were observed during the 10 secs of the source localization for all visual fields.
Conclusions: Research has proven slow cortical fluctuations to be strongly correlated with the BOLD signal (Raichle, 2010). It has been proposed that SCPs as well as BOLD fluctuations in oxygenation represent fluctuations in cortical excitability serving an important role in the integration of functional activity (Raichle, 2010). Schroeder and Lakatos (2009), view this as one mode of attention shift to match the predictable patterns of incoming information that results in enhanced response and improved performance. This study is evidence of how SCPs can provide valuable neural activity information usually acquired and filtered out on most EEG and help us understand the relationship between Local Field Potentials and the BOLD signal.
Valence modulates the activity of resting-state networks - an analysis of short resting periods
Background: Disorder-specific aberrations in activation and/or functional connectivity within resting-state networks (RSNs; Li et al. 2011) have been demonstrated in a wide range of mental disorders (Whitfield-Gabrieli 2012). However, no etiological explanations for these alterations have been put forward to date.
Goal: Previous studies in healthy controls have indicated that the DMN may be modulated by emotional arousal (e.g. Pitroda 2008). More specifically, Eryilmaz et al. 2011 demonstrated that the valence of a preceding stimulus influenced the connectivity between DMN regions during the subsequent resting periods. In order to investigate this potential link between psychiatric disorders characterized by pathological emotion processing and altered DMN activation, an implicit emotional processing paradigm was employed.
Methods: Blocks of either neutral or aversive pictures were followed by 18 seconds of rest with fixation instruction. Both activation and functional connectivity during the rest periods were analyzed, comparing rest periods following aversive stimulation to rest periods following neutral stimulation. Data from N=32 bipolar patients and N=32 healthy controls matched for age, sex, education, IQ, and substance use were acquired.
Results: In healthy controls, an emotion-induced modulation of the resting activity was found in area V5, exhibiting greater activation after neutral stimulation than after aversive stimulation. In addition, functional connectivity analyses demonstrated a positive correlation between V5 und DMN areas following neutral stimulation absent following aversive stimulation. These results will be compared to those obtained in the patient group.
Discussion: In healthy controls, the V5 area was not recruited into the DMN after aversive stimulation, indicating an emotion-induced modulation of this network. The impact of valence on DMN connectivity and activation during resting periods may prove to elucidate the etiological origin of disorder-specific DMN aberrations.
Center for Medical Physics and Biomedical Engineering, MR Center of Excellence, Vienna, Austria
University of Technology Vienna, Dept. of Statistics & Probability Theory, Vienna, Austria
Department of Psychiatry and Psychotherapy, Medical University of Vienna, Division of Biological Psychiatry, Vienna, Austria
An improved method for whole-brain temporal independent component analysis for identification of resting-state networks
Objectives: Independent Component Analysis (ICA), a widely used method for analysis of resting-state fMRI data, can be employed either as spatial (sICA) or temporal ICA (tICA). Mostly due mostly to computational reasons, tICA has seen only limited use in fMRI analysis, even though it has been identified early as a useful method for identifying different signal sources in fMRI data (Biswal and Ulmer 1999), and whole-brain analyses have thus far been prohibitively complex. This study aimed at implementing tICA for whole-brain analysis and applying the resulting algorithm to long resting-state scans.
Methods: The tICA algorithm has been implemented in R. The previously elaborative and thus prohibitive step of prewhitening and dimensionality reduction using PCA has been addressed by a new algorithm for singular value decomposition (SVD) and accelerated using graphics processing units (GPUs). The algorithm was applied to 55 minute resting-state datasets (1900 time points) acquired on a Siemens TIM Trio 3T (TE/TR 42/1800∼ms). Furthermore, results from our implementation were compared with results from sICA using FSL MELODIC.
Results: Resulting components from tICA are shown in figure 1. sICA using MELODIC was applied to the first 10 minutes of the scan due to the size limitations for the input of the MELODIC algorithm and results were compared to sICA results for the same 10 minutes dataset using our new implementation (figure 2).
FIG. 1.
FIG. 2.
Conclusions: This study shows that tICA can be employed for the identification of temporally independent networks in resting-state fMRI datasets. As a by-product, the algorithm also allows for analysis of long fMRI time series using sICA. sICA components with the new algorithm are consistent with results from MELODIC where the latter can be computed. Furthermore, tICA leads to better delineation of functional networks due to its better ability to single out artifactual influences.
Lyon Neuroscience Research Center - INSERM U1028 - CNRS UMR5292, DYCOG Team, Bron Cedex, France
University Claude Bernard Lyon 1, Lyon, France
CERMEP-Imagerie du Vivant, Lyon, France
Unité d'Exploration Hypnologique, Centre Hospitalier le Vinatier, Lyon, France
Between subjects resting brain activity varies with dream recall frequency: a [15O] H2O PET study
Dreaming is a fascinating cognitive phenomenon which is still poorly understood. Notably, its cerebral underpinning remains unclear. Neuropsychological studies showed that lesions in the tempo-parietal junction (TPJ) and/or medial prefrontal cortex (MPFC) can lead to global cessation of dream reports (Murri et al.1985; Solms 1997). Such studies suggest that TPJ and MPFC, which are part of the default mode network, play a key role in the dreaming process (forebrain “dream-on” hypothesis, Solms 2000). To test this hypothesis, we measured regional cerebral blood flow (rCBF) using [15O]H2O positron emission tomography in healthy subjects with high and low dream recall frequency (DRF) while they were resting during both wakefulness and sleep (REM sleep, N2 and N3). High-recallers (N=21) reported more than three dream reports per week, and Low-recallers (N=20) reported less than two dream reports per month. In comparison with Low-recallers, High-recallers showed higher rCBF in the TPJ during REM sleep, N3, and wakefulness, and in the MPFC during REM sleep and wakefulness. We demonstrate that the resting states of High-recallers and Low-recallers differ during wakefulness and sleep. This result suggests that a high/low DRF is associated with a specific functional brain organisation. The functional neuroanatomical correlates of DRF which are disclosed in this study, support the forebrain “dream-on” hypothesis. Our results confirm neuropsychological findings and show that TPJ and MDFC are involved in the dreaming process at night (production and/or encoding) and not only in dream recall during wakefulness. Increased activity in MPFC and TPJ in High-recallers may increase mental imagery during sleep, and/or memory encoding of dreams.
Laboratoire de Psychologie et de Neurocognition, URM CNRS 5105, Grenoble Cedex 9, France
Structure Fédérative de Recherche “Santé et Société” - Université Pierre Mendès France, Grenoble, France
Centre Hospitalier Universitaire de Grenoble, Pôle Psychiatrie et Neurologie, Grenoble, France
Institut des Neurosciences, Grenoble, France
Centre expert en troubles bipolaires - Fondation FondaMental, CHU de Grenoble, Grenoble, France
The psychoeducation modulates resting-state functional connectivity in euthymic bipolar patients: a preliminary study
Question: Patients with bipolar disorder (BD) show significant mood stabilization after following psychoeducational programs. These benefits could be due to improvement of cognitive control and subsequent regulation of emotions. Abnormal fronto-limbic functional connectivity at rest has previously been observed in BD. But, to our knowledge, no studies have explored the resting-state connectivity in euthymic BD patients. This study aims to assess resting-state functional connectivity in euthymic BD patients and its modulation by the participation in a psychoeducational program.
Methods: Initially, 15 euthymic BD patients and 15 matched healthy controls (HC) underwent 6-minute fMRI scans during which they had to keep their attention on a visual cross. Only 13 patients who followed the entire 3-months psychoeducation program were reassessed in the same way. Matched HC were evaluated similarly at three months interval without following the psychoeducation. Independent component analysis was used to identify the default mode network (DMN) in each subject. The DMN group maps of euthymic BD patients and HC, as well as of BD patients before and after psychoeducation, were compared.
Results: Compared to HC, euthymic BD patients showed reduced DMN connectivity in medial prefrontal cortex (mPFC), right angular gyrus and left occipital lobe (Figure 1A), and also abnormal recruitment of the right insula, right middle cingulate gyrus and left cerebellum (Figure 1B). The effect of psychoeducation was illustrated by greater DMN connectivity within right mPFC, right superior temporal pole, left insula, left superior temporal gyrus and left occipital lobe (Figure 2A), and significant decreased connectivity within the head of right caudate nucleus and right posterior cingulate gyrus (Figure 2B). In HC, the DMN connectivity had increased in right globus pallidus and decreased in left temporal pole between the two evaluations.
A-B. Significant difference of DMN between healthy controls and bipolar patients. A) Healthy control > Bipolar disorder, B) Bipolar disorder > Healthy control. The significance of the activation (colored bar) and the x-coordinates of Montreal Neurologic Institute (MNI) space are also illustrated. Statistical values: p < 001 uncorrected; spatial extent (cluster) > 10 voxels.
A-B. Significant difference of DMN before and after psychoeducation in bipolar patients. A) After > Before; B) Before > After. The significance of the activation (colored bar) and the x-coordinates of Montreal Neurological Institute (MNI) space are also illustrated. Statistical values: p < .001 uncorrected; spatial extent (cluster) > 10 voxels.
Conclusions: Decreased DMN functional connectivity and abnormal recruitment of some limbic regions such as right insula and middle cingulate gyrus may reflect the emotional instability and hyperreactivity found in euthymic BD. The increased mPFC functional connectivity associated with concomitant decreased of subcortical connectivity could reflect a better cognitive regulation of emotions after psychoeducation.
Data Analysis
GhoshS.1KeshavanA.1Nieto-CastanonA.2KleinA.3Whitfield-GabrieliS.1
MIT, McGovern Institute for Brain Research, Cambridge, United States
StatANC LLC, Boston, Argentina
Columbia University, New York, United States
The impact of algorithms and parameters on resting state connectivity analysis
Over the last two decades we have witnessed a tremendous growth in the acquisition and analysis of “resting state” data, spontaneous fluctuations in an individual's functional MRI (fMRI) BOLD signal. Covariation of these fluctuations has proven to be a useful tool for studying large-scale functional organization of the brain (van den Heuvel and Pol, 2010) and has been used to reveal differences in the functional organization of the brain in neurological and psychiatric disorders (e.g., Greicius et al., 2006) and to complement inferences made from task-based fMRI analyses. However, few studies have systematically investigated the impact of algorithmic and parameter choices on the inferences made from such analyses.
Using Nipype (Gorgolowski et al., 2011), we have constructed a reusable and reproducible preprocessing workflow (Figure 1) that enables user selection of slice-timing and motion algorithms (Afni, SPM, Nipy, FSL), smoothing algorithms (FSL, isotropic, FreeSurfer), and temporal filtering (FIR, Gaussian, Elliptical) algorithms. Furthermore, this workflow allows selection and removal of any of five different types of nuisance regressors, including motion parameters and their derivatives, outlier scans, and temporal and/or anatomical CompCor components. The workflow also coregisters functional time series to FreeSurfer-processed anatomical data using boundary-based registration, and optionally allows unwarping using field maps and whitening of the time series prior to bandpass filtering. The resulting time series can be mapped to the coregistered surface meshes. Preliminary analysis with this workflow on resting data (TR=6 s, 2 mm isometric resolution) exposes differences in surface-based correlation maps produced by changing combinations of slice-timing and realignment algorithms without altering any other components of the workflow (see Figure 2 for a comparison from a single subject). We will present a comparative analysis of connectivity graphs resulting from parameter variations across a normative group.
FIG. 1.
FIG. 2.
Physiology
HamannJ.12DayanE.1HummelF.2CohenL.1
National Institutes of Health, National Institute of Neurological Disorders and Stroke, Bethesda, United States
Universitätsklinikum Hamburg-Eppendorf, BrainImaging and NeuroStimulation, Hamburg, Germany
Frontostriatal-limbic functional connectivity at rest predicts long-term retention of procedural memories acquired under reward-based training
The formation of reward-mediated memories relies on activity within fronto-striatal and striato-limbic circuits. As in many forms of learning, the formation and retention of reward-mediated memory varies substantially between individuals. Accounting for these differences is of particular relevance for understanding the mechanisms that underlie memory formation, yet these differences are often disregarded by averaging results across groups. Given the extensive set of regions involved in reward-mediated learning and memory formation, characterization of inter-individual differences and their underlying neuronal substrates necessitates analysis at larger scales. In this study we investigated whether functional connectivity within an entire reward-related network can predict the formation and retention of procedural memories, which are trained under rewarded conditions.
We acquired resting state fMRI scans from 15 subjects prior to a single training session on a visuo-motor sequence task. Memory was tested immediately after training, the next day and a month later. We report that resting state functional connectivity within a network including ventral and dorsal striatum, medial prefrontal cortices and limbic areas was significantly correlated with performance and long-term retention at one month, but not with memory as assessed immediately after, or a day after training. To control for the specificity of the results, we identified an unrelated “language” network, composed of areas that show resting-state functional connectivity with Broca area. We then verified that functional connectivity within this network could not predict any of the above described memory indices. Secondly, we found no correlations of frontostriatal-limbic functional connectivity with any of the learning indices in another group of subjects (n=15), which trained with no reward.
These findings indicate that connectivity within a frontostriatal-limbic network predicts a) memory performance at one month and b) inter-individual variability in long-term retention of motor memory, acquired under reward-based training.
Applications: Psychiatry
AnandA.1
Indiana University School of Medicine, Psychiatry, Indianapolis, United States
Resting State Connectivity in Mood Disorders and Effects of Treatment
Invited Speaker Abstract
Question: Bipolar Disorder is characterized by episodes of mania, depression and euthymic, however the neurobiology of different phases is poorly understood. In this study, we investigated the usefulness of resting state functional connectivity within the corticolimbic mood regulating circuit to investigate differences between mania, depression and euthymia
Methods: In one of the largest studies of its kind, one hundred and five medication-free subjects: 30 (hypo) manic, 30 bipolar depressed, 15 euthymic bipolar and 30 healthy control subjects underwent resting state fMRI scan. After requisite preprocessing and filtering, data was obtained for low frequency BOLD fluctuations (0.008–0.08 Hz). The data was entered into SPM first level analysis using specified seed regions - bilaterally 11 different cortical and subcortical regions were used separately as seed regions to obtain connectivity maps. Individual first level connectivity t-maps were converted into z-maps and entered into a second level full factorial model to calculate main effect of group for connectivity map of each region. Data was extracted from significant clusters and examined for group pair-wise differences in SPSS.
Results: All three bipolar groups compared to healthy subjects exhibited decreased lateral orbitofrontal cortex-subocortical connectivity, with the manic group exhibiting the most and BPD group the least decrease in connectivity. All three groups compared to healthy controls showed increased insula-subcortical connectivity, in particular the BPD group. In terms of subcortical connectivity all three bipolar groups exhibited increased connectivity but this increase was mainly in the right side in the manic and depressed groups when compared to euthymics. Finally, the depressed state was marked by increased cortico-cortical connectivity between the dorsal and ventral regions. These findings imply many similarities but also some differences between the different phases of bipolar disorder.
Conclusions: The results of the study suggest that the differential pattern of abnormal resting state corticoliimbic connectivity seen in mania, euthymia and depression in bipolar disorder can provide insights into the pathophysiology of the illness as well as a potential biomarker for diagnosis and treatment effects. Further results from ongoing analysis of data for treatment effects of lithium will also be presented at the meeting.
Data Analysis
YouW.1StadlerJ.1
Leibniz Institute for Neurobiology, Special Lab Non-Invasive Brain Imaging, Magdeburg, Germany
Fractal-driven distortion of resting state functional networks in fMRI: a simulation study
Fractals are self-similar and scale-invariant patterns found ubiquitously in nature. A lot of evidences implying fractal properties such as 1/f power spectrums have been also observed in resting state fMRI time series. While the traditional model of fractal behavior in resting state fMRI has been a fractional Gaussian noise, it is limited to describe the physical implication of fractal behavior on functional connectivity of the brain. To answer this problem, we have proposed the fractal-based model of resting state hemodynamic response function (rs-HRF) whose properties can be summarized by a fractal exponent (You et al. 2012 BMC Neurosci.). Here we show, through a simulation studies, that the fractal behavior of cerebral hemodynamics may cause significant distortion of network properties between neuronal activities and BOLD signals. We simulated neuronal population activities based on the stochastic neural field model from the Macaque brain network, and then obtained their corresponding BOLD signals by convolving them with the rs-HRF filter. The precision of centrality estimated in each node was deteriorated overall in three networks based on transfer entropy, mutual information, and Pearson correlation; particularly the distortion of transfer entropy was more sensitive to the standard deviation of fractal exponents (Figure 1). A node with high centrality was resilient to desynchronized fractal dynamics over all frequencies while a node with small centrality exhibited huge distortion of both wavelet correlation and centrality over low frequencies (Figure 2). This theoretical expectation indicates that the difference of fractal exponents between brain regions leads to discrepancy of statistical network properties, especially at nodes with small centrality, between neuronal activities and BOLD signals, and that the traditional definitions of resting state functional connectivity may not effectively reflect the dynamics of spontaneous neuronal activities. As an alternative, the nonfractal connectivity, which is defined as the correlation of nonfractal components of resting state BOLD signals, can be considered to overcome the fractal artifact (You et al. 2012 IJCNN). In conclusion, our simulation studies may give us insight into the influence of fractal behavior on complex networks of the brain.
Scatter plots which illustrate the differences of centrality in three types of functional networks such as Pearson correlation (left), transfer entropy (middle), mutual information (right) between neuronal activities and BOLD signals. Two cases, when the standard deviations of fractal exponents are (a) 0.1 and (b) 0.3, are compared. In Pearson correlation, the regression slope decreased slightly when the standard deviation of fractal exponents was high. The decrease of the regression slope was more abrupt in transfer entropy, and resulted in the increase in difference of neuronal activities and BOLD signals. On the other hand, the slope in mutual information was less affected by the standard deviation of fractal exponents; however the absolute values were smaller than those of Pearson correlation.
(a-b) The relative deviation of wavelet correlations over scales (where high scale corresponds to low frequencies), and (c-d) the deviation of centrality over scales. Left and right are for SD(d) = 0.1 and 0.3 respectively. For a node with small centrality, as the standard deviation of fractal exponents increases, the absolute peak of deviation in wavelet correlation also increases in low frequency ranges while the deviation in centrality decreases. It is obvious that the dissimilarity of either wavelet correlation or centrality between neuronal activities and BOLD signals becomes larger in a nodewith small centrality than onewith high centrality.
Physiology
BonzanoL.1PalmaroE.2TeodorescuR.3IngleseM.3BoveM.4
University of Genoa, Dept. of Neurosciences, Genoa, Italy
University of Genoa, Genoa, Italy
Mount Sinai School of Medicine, New York, United States
University of Genoa, Dept. of Experimental Medicine, Genoa, Italy
Resting-state networks activity is influenced by motor learning
Objectives: Aim of the present work was to investigate the influence of motor sequence learning on resting-state networks (RSNs) using high field MRI.
Methods: Ten healthy right-handed volunteers (5 females, 5 males; mean age=28.8±2.3 years) participated in the study. They were shown a 4 min-dummy task, to ensure a common cognitive baseline before undergoing a 5-min resting-state fMRI (rs-fMRI) session. rs-fMRI was acquired on a 3 Tesla Philips scanner with T2*-weighted echo-planar-imaging (EPI) sequences (120 volumes covering the whole brain; TR/TE=2607/27 ms; FA=90°; FOV=210 mm×210 mm; matrix=96×96).
Then, subjects were asked to memorize a sequence using verbal code (3 4 1 3 2 1 4 2) with no actual movement training. Afterward, they were informed that numbers represented the fingers of the right hand and were asked to reproduce as fast and accurate as possible, in 50 trials, the learned sequence by touching the corresponding finger with the thumb. Changes in movement rate were measured by a sensor-engineered glove to assess the improvement in early learning.
Then, another dummy-task session was performed, followed by rs-fMRI.
MRI data were analyzed with SPM8 and DPARSF. Images were realigned to correct for head motion, normalized to the MNI EPI template, and smoothed with an isotropic Gaussian filter (FWHM=6 mm). After removal of the physiological noise, functional connectivity (FC) measures were obtained by evaluating the inter-regional synchrony of signal fluctuations. The average time course was obtained from a whole brain mask and a voxel-wise correlation analysis was performed to generate FC maps, which were converted into z maps by Fisher's transformation to improve the normality. To compare FC between the first and the second rs-fMRI scan, paired t-test was performed on the z maps.
Results: Learning was successfully reached by all the subjects as shown by a significant increase of movement rate with trial repetition (p<0.05).
The analysis of rs-fMRI showed significant differences in the RSNs before and after the motor task, identifying 15 clusters (p=0.001), including the visual network and networks likely associated with motor learning (i.e., attentional, frontal, sensorimotor, basal ganglia networks).
Conclusion: Our results suggest that early motor sequence learning can influence the RSNs activity.
Georgetown University, Psychology, Washington, United States
Children's National Medical Center, Children's Research Institute, Washington, United States
Atypical task modulation of intrinsic distant functional connectivity in children with ASD
Objectives: Atypical functional connectivity (FC) is a key pathology in Autism Spectrum Disorder (ASD). Findings are mixed (lower/higher FC) related to differing methods (intrinsic, task related), subjects (children, adults), and task (resting, lower/higher cognition) across studies. We addressed these factors by examining intrinsic FC in two states (resting, attention) in the same children, using a data driven voxelwise approach.
Methods: 15 9–13 year old ASD and 16 age, gender and IQ matched control children underwent fMRI (3 mm isotropic resolution, TR 2000 ms, TE 30 ms, flip angle 90°, FOV 192×192 mm) during rest and an attention task. Images were motion corrected by scrubbing, slicetime corrected, normalized and resliced to 4 mm, smoothed with 4 mm FWHM, and physiological noise removed. Time course of each voxel was correlated to every other voxel and thresholded at p=.001 FDR corrected (r>.32). FC maps were computed by averaging, for each voxel, the r-to-Z Fisher transformed values for voxels inside (local) and outside (distant) of 14 mm radius. Group (ASD, Control) X state (rest, task) interaction was examined for local and distant FC at p<.001, 5 voxels (p<.05 Monte Carlo corrected) covarying out age and motion.
Results: No interaction was observed for local FC. For distant FC, group X state interacted in 6 frontal (left SMA, orbital, superior, middle gyri) and 2 parietal (right angular gyrus and temporoparietal junction TPJ) regions. Relative to rest, distant FC decreased in controls but increased in ASD children during the task. Distant FC was lower during rest but higher during task in ASD than control children. In all regions except left TPJ and posterior superior frontal gyrus, task-related FC increases (task>rest) correlated positively with inattention scores within the ASD group.
Discussion: Group differences in distant FC in frontal and parietal cortex depended upon cognitive state. Distant FC reflects positive connectivity of a region to the rest of brain. Task related reduction of global connectivity in controls may reflect selective engagement of task relevant networks. Higher task related FC in ASD may reflect indiscriminate network engagement, which was higher in ASD children with worse attentional function. State-dependency of FC constrains theories of under/over connectivity in ASD.
University Medical Center Freiburg, Freiburg, Germany
Resting-State Networks at Different Frequencies with MR-Encephalography and Group ICA
Objectives: MR-Encephalography (MREG) is a fast-imaging technique that can acquire a whole-brain image within sub-second. The high sampling rate allows us to observe resting-state networks at frequencies higher than 0.1Hz [2]. Here we recorded resting-state fMRI images using MREG with a single-shot concentric shells trajectory. Then we used group independent component analysis (ICA) to look at the resting-state networks at different frequencies.
Methods: Resting-state fMRI data were acquired from ten healthy volunteers on a 3.0 T Siemens Trio scanner (Siemens Healthcare, Erlangen, Germany) with a 32-channel head coil. Scan parameters: FOV=256×256×256 mm3, TR=100 msec, total 4096 time frames (total scan time 6 min 50 sec, first 15 sec discarded). Reconstruction operator was estimated using a non-uniform FFT algorithm based on coil sensitivity weightings and measured gradient trajectory.
MATLAB (The Mathworks, Inc., Natick, MA) was used for post-processing. Rigid-body motion correction and normalization was done in SPM8. Frequency filtered signals (0.01∼0.1 Hz/0.5∼0.8 Hz) were fed to Group ICA analysis in GIFT toolbox. The resulted components were manually inspected and based upon spatial location and signal waveforms, neuro-physiological relevant networks were selected. The cross-correlation coefficients of group time-series were also calculated.
Results: Figures 1–4 show the correlation coefficient matrix and the spatial maps of selected components. Figure 1: two groups of positively correlated networks at 0.01∼0.1 Hz (upper 5/lower 2). Figure 2: two pairs of negatively correlated networks at 0.01∼0.1 Hz. Figure 3: two groups of positively correlated network at 0.5∼0.8 Hz (upper 4/lower 2). Figure 4: negatively correlated network groups at 0.5∼0.8 Hz (The groups of networks in green and blue circles have time-series anti-correlated).
FIG. 1.
FIG. 2.
FIG. 3.
FIG. 4.
Conclusion: In this study we have obtained group results of resting-state networks at different frequencies. Group ICA analysis on ten subjects have revealed several networks that exist at both frequency bands, and some others appear only at one band. Interestingly the left and right parietal lobe are negatively correlated at 0.01∼0.1 Hz but positively correlated at 0.5∼0.8 Hz. Further studies are needed to determine the neurological meanings behind those networks.
Data Analysis
FrederickB.D.1NickersonL.D.1TongY.1
McLean Hospital, Brain Imaging Center, Belmont, United States
Retrospective identification of global hemodynamic fluctuations from resting state fMRI data
Introduction: Low frequency noise in BOLD fMRI data from fluctuations in blood flow and oxygenation due to cardiac and respiratory effects, spontaneous low frequency oscillations (LFO) in arterial pressure, and non-task related neural activity is a contaminant to resting state data. We have previously demonstrated that by estimating and applying a voxel-specific time delay to concurrently acquired NIRS timecourses, we can generate regressors that reflect systemic blood flow and oxygenation fluctuations effects in BOLD data, which have demonstrated utility for physiological denoising and characterizing hemodynamic responses to challenges; unfortunately, while the NIRS data acquisition can easily be added to new studies, most resting state BOLD data acquired to date does not have this information. We present a method for identifying and characterizing this moving signal from the BOLD data itself.
Methods: We identify the moving hemodynamic component of the BOLD signal by examining the time-delayed temporal correlations within the data. A group independent component analysis (ICA) is run using MELODIC, and the component corresponding to the superior sagittal sinus and posterior draining veins (Figure 1) is selected (this component has been shown to be strongly correlated with the NIRS total hemoglobin signal measured in the fingertip). The timecourse for this component in each subject, extracted using dual regression, is used as an initial input to the RIPTiDe procedure to find the voxel specific time shift and correlation between this signal and the BOLD signal throughout the brain. The BOLD signal from each voxel is then timeshifted so that the common component is in phase. A principal component analysis of the weighted, aligned timecourses is used to generate a refined estimate of the global hemodynamic signal. The procedure is repeated with the new regressor until convergence (about 3 iterations).
Component from MELODIC ICA corresponding to the superior sagittal sinus/draining veins. This component is known to be strongly correlated with the global NIRS hemoglobin signals.
Results and Discussion: The resulting signal is strongly correlated with concurrently recorded NIRS data, and shows the same pattern of correlation and time delay with highly perfused regions (Figure 2, 3). This regressor can be used for subsequent hemodynamic estimation and noise removal when the NIRS data is not available.
Maximum z-statistic of correlation between the physiological regressor and the bold data for a) the NIRS total hemoglobin regressor and b) the regressor generated from the BOLD data itself.
Map of relative time delay of maximum correlation between the physioloical regressor and the BOLD data for a) the NIRS total hemoglobin regressor and b) the regressor generated from the BOLD data itself (time delays set equal at superior sagittal sinus).
Applications: Psychiatry
BlautzikJ.1KeeserD.12BermanA.1PaoliniM.1ReiserM.1TeipelS.34MeindlT.1
Ludwig-Maximilians-University, Institute of Clinical Radiology, Munich, Germany
Ludwig-Maximilians-University, Department of Psychiatry and Psychotherapy, Munich, Germany
University of Rostock, Department of Psychiatry, Rostock, Germany
DZNE, German Center for Neurodegenerative Disorders, Rostock, Germany
Long-term test-retest reproducibility of the default-mode network in healthy elderly and MCI patients
Investigation of the default-mode network (DMN) by functional MRI is promising for the early diagnosis and follow-up of Alzheimer's disease (AD). For this purpose, determination of inter-session test-retest reproducibility of that network is crucial. Data on network reproducibility in healthy elderly (HE) and patients with amnestic mild cognitive impairment (aMCI), a prodromal stage of AD, is lacking. The aim of this study was to investigate the long-term test-retest reproducibility of the DMN in both groups.
Twelve HE and 13 age-matched aMCI patients underwent resting-state fMRI (rs-fMRI) and neuropsychological testing (CERAD test battery) at baseline and on a follow-up examination after 13–16 months. Resting-state fMRI data was decomposed into independent components (ICs) using FSL's Temporal Concatenation Group Independent Component Analysis (TC-GICA) and dual regression. The inter-session reproducibility was determined by calculating voxel-wise intra-class correlation coefficients (ICC) based upon individual ICs.
According to the CERAD test battery, the cognitive performance of both groups did not change substantially over time. The DMN was found in both groups and sessions. Inter-session reproducibility of the DMN was good in either group with specific core regions of the network expressing ICC values >0.9. At equally thresholded ICC maps, reproducibility of the DMN was lower in the aMCI group (less “activated” voxels) compared to healthy elderly subjects.
FIG. 1.
We conclude that - in general - long-term reproducibility of the DMN is good in both healthy elderly subjects and aMCI patients. However, inter-session reproducibility is lower in aMCI patients indicating a lower stability of the network. This finding potentially reflects underlying neurodegenerative changes occurring over time in that group.
Methods and Acquisition
CraddockC.1LisinskiJ.1LaConteS.12
Virginia Tech Carilion Research Institute, Blacksburg, United States
Virginia Tech, School of Biomedical Engineering and Sciences, Blacksburg, VA, United States
Online denoising strategies for real-time tracking default mode network activity
We have recently demonstrated that it is possible to train supervised learning models of default mode network (DMN) activity, such that it can be tracked in independent data (Craddock 2011). One exciting application for this capability is real-time fMRI (rtfMRI), where DMN activity can be used as a control signal for neurofeedback. Judicious and effective preprocessing is a critical aspect for successful application of this technique. We evaluated several different combinations of denoising strategies to identify a parsimonious set of nuisance regressors that improve the accuracy of DMN tracking.
Real-time (RT) denoising was implemented in AFNI using AFNI's pre-existing recursive regression functionality (Cox 1995). Data from 32 subjects that included a high-resolution T1 and two 10 min. RS scans were analyzed. We evaluated regression models of global-mean (GM), white matter (WM) and CSF signals, 6 or 24 head motion parameters (Friston 1995; Fox 2005), nth order polynomial detrending (n=0…4), and smoothing of training data for a total of 120 denoising combinations. The two resting state scans were alternately used as training and testing data. Training involved motion correction, one of the 120 denoising strategies, and learning a model of DMN activity using 3dsvm (LaConte 2005). During testing, unprocessed data were sent to AFNI's RT (Cox 1995) interface via a network connection where it was motion corrected to the training data, denoised, and transferred to 3dsvm (LaConte 2007) for DMN tracking. Accuracy of DMN tracking was assessed by correlating decoded DMN activity for each of the 120 strategies with offline preprocessing. Offline preprocessing included motion correction, regressing out CSF, WM signals, 6 motion parameters and 4th degree polynomial, and smoothing.
We have performed a nearly exhaustive evaluation of RT denoising alternatives for online decoding of DMN activity. Theseprocedures are possible in RT due to the efficiency of AFNI's recursive regression. DMN activity can be decoded in RT with substantial accuracy using GM, CSF, and WM time courses, and very low order polynomials [Table 1]. Spatially smoothing the training data does not have a significant impact on results [Fig. 1]. Future research will incorporate these findings into real-time DMN neurofeedback experiments.
Impact of online denoising strategy on accuracy of real-time DMN tracking.
Methods and Acquisition
BeallE.1ShinW.1LoweM.J.1
The Cleveland Clinic Foundation, Cleveland, United States
Multiband EPI reconstruction is dependent on slice- GRAPPA kernel size
Introduction: Multiband echoplanar acquisitions, exciting and reading out multiple slices simultaneously [1–2] are highly promising methods for increased resolution. Slice-GRAPPA [1–2] has been shown to be an effective method of separating the signal from simultaneous slices. However, optimal values of key parameters in the slice separation have not been explored. In this study, we examined the effect of GRAPPA slice kernel size on functional connectivity in the motor circuit and find there is a surprising reduction in low frequency BOLD fluctuations with higher kernel sizes, despite improved image appearance.
Methods: Resting FC was acquired in one subject in an IRB-approved protocol and reconstructed using the slice GRAPPA algorithm with 24 (multiband factor 3) obliqued axial slices, excited using the method of Moeller et al[1], with voxel resolution of 2 mm isotropic, 200 repetitions (reconstructed with slice-GRAPPA to size 96×96×72×200, TR/TE=1834/29 ms, 6/8 partial Fourier) in a 32ch coil on a Siemens Trio. Slice GRAPPA kernel size was varied from 3×3 to 9×9 in increments of 2 on a 144 node compute cluster. Data corrected for motion and spatially filtered with 3 mm FWHM Gaussian kernel before being analyzed with InstaCorr and visually-identified 9-voxel seed ROIs for connectivity analysis (see Fig 2).
Results:Fig 1: motor cortex connectivity from InstaCorr, Fig 2: ROIs drawn on connectivity map for right primary motor hand knob and left supplementary motor area (radiolog conv R=L). Fig 3: table of motor connectivity pearson correlations.
FIG. 1.
FIG. 2.
FIG. 3.
Discussion: The strong dependence of connectivity on slice GRAPPA kernel size is worrying and further work on optimization is needed. Furthermore, the ability to vary this kernel size would be an important feature of any reconstruction package.
SchottB.123SochJ.13HerbortM.13DanielsJ.2WalterM.13WalterH.2RöpkeS.2
Leibniz Institute for Neurobiology, Magdeburg, Germany
Charité University Hospital Berlin, Berlin, Germany
Otto von Guericke University, Magdeburg, Germany
Alterations of Default Mode resting state network function in borderline personality disorder
Background: Borderline personality disorder (BPD) is a severe psychiatric condition characterized by a pervasive pattern of instability of interpersonal relationships, self-image and affects, as well as marked impulsivity. Traumatic experiences in childhood, particularly sexual abuse, are considered important risk factors for BPD. Given the considerable impairment in both self-image and social functioning, we hypothesized that BPD might be characterized by dysfunction of the Default Mode network (DMN), a cortical midline network involved in self-reference, social cognition and autobiographic memory.
Methods: We acquired resting-state functional magnetic resonance imaging (fMRI) from 22 unmedicated female patients with BPD (age range 19–42) and from age-matched healthy female control participants. 300 whole-brain echo-planar images (EPIs) on a 3T Siemens Trio magnetic resonance system (TR=2 s; 37 axial slices; voxel size=3×3×3 mm). Data preprocessing (slice timing, motion correction, normalization, smoothing) was performed using SPM8, and a subsequent resting-state functional connectivity analysis was performed using DPARSF. Images were detrended and band-pass filtered, and functional connectivity of the DMN was assessed using a spherical volume of interest (VOI) in the left posterior cingulate cortex (PCC) obtained from a meta-analysis of DMN function (Schilbach et al., 2012). A two-sample t-test second level analysis was performed to assess between-group differences in DMN functional connectivity (p<.05, whole-brain FWE-corrected)
Results and Conclusion: We found a significantly reduced functional connectivity within the DMN in the BPD group, most prominently within the PCC/precuneus itself and between the PCC and the medial orbitofrontal cortex (OFC). On the other hand, patients exhibited significantly lower anticorrelation between the DMN and other resting state networks, most prominently structures of the salience network (dorsal anterior cingulate, dACC, and bilateral insula). Both neural findings are consistent with the concept of an impairment of self-functioning in BDP, insofar as the DMN, associated with self-processing is less connected within itself and less decoupled from other networks in BPD compared to healthy controls.
Goethe University Frankfurt, Neurology Department and Brain Imaging Center, Frankfurt am Main, Germany
Are your subjects awake during your resting state study?
Question: In resting state studies, the brain is not supposed to engage in externally induced task activity. During resting conditions the brain remains functionally and metabolically active and despite task absence exhibits coherent activity in characteristic sets of regions. Typically, in wake resting state experiments, data stems from subjects resting with eyes closed in the MRI scanner for usually 10 min. We hypothesized that in this condition the likelihood of falling asleep is high.
Methods: We studied 63 non sleep-deprived subjects with EEG-fMRI for 52 minutes. Vigilance throughout the experiment was classified based on the EEG (30 s epochs) and -independently of the EEG - based on the fMRI data by using a supervised classifier (120 s epochs). The latter classification was also performed on a second fMRI resting state data set without simultaneous EEG (76 subjects, 7.5 min).
Results: ∼50% of the subjects did not maintain steady wakefulness until minute 5 (Figure 1). Application of the fMRI based classifier demonstrated similar loss of vigilance for the independent dataset without concurrent EEG recordings (Figure 2).
Solid line: Kaplan-Meier-estimator for the percentage of subjects sustaining a steady state of wakefulness during an fMRI resting state study. After 5 minutes, already ∼50% of the subjects already had an epoch of sleep. Dashed line: Results for the Kaplan-Meier-estimator computed with sleep staging using a Support Vector Machine (SVM).
Red line: Kaplan-Meier-estimator for the percentage of subjects sustaining a steady state of wakefulness during the first 8 minutes of an independent data set, decoded using a SVM classifier. Blue line: Kaplan-Meier-estimator for our dataset during the first 8 minutes of rest, vigilance level assessed with expert EEG sleep scoring.
Conclusions: Our results stress the high risk of subjects exhibiting unsteady levels of vigilance during resting state experiments. Observations made under resting state conditions should include an objective evaluation of the associated vigilance level (e.g. via simultaneous EEG recording or a classifier). Clinically, these observations have important implications for studies in which resting state fluctuations are proposed to assist diagnosis of neuropsychiatric disorders: resting state fluctuations might be confounded by pathology-associated vigilance profiles systematically different to that of controls.
Methods and Acquisition
RojasG.1GalvezM.1
Clinica Las Condes, Department of Radiology, Santiago, Chile
Study of Functional Connectivity Networks obtained using 10-10 EEG System related seeds: Preliminary Results
Introduction: Electroencephalography (EEG) is the recording of electrical activity of the brain. The main diagnostic application of EEG is in epilepsy. An extension of the International 10–20 system, namely 10-10 system allows 64–256 EEG electrodes. Many papers describe different functional connectivity (FC) patterns in epilepsy patients, and it could be useful to study FC networks that we can get using EEG electrodes coordinate seeds (10-10 system).
Methods: We obtained MNI coordinates of each EEG electrode 10-10 system (65) from Koessler et al, 2009. We changed them slightly to use it as the center of spherical seeds. We processed RS- fMRI scans, 45 (age 18–30, 3T MRI) healthy volunteers (Cambridge-Buckner dataset, 1000 Functional Connectomes Project). After standard preprocessing we used 6 mm radius spherical seeds located in EEG electrodes MNI coordinates (Fig 1) to calculate participant-level connectivity maps. Next we performed group-level analyses. All group maps were corrected for multiple comparisons using Gaussian random field theory (Z>2.3, P<0.05).
Results: Fig 2: the correlation matrix of each electrode-seed. Figs. 3–4: shows the FC 3D-image created with seed in AF4.
In summary and for example, the FC network that we obtained with C3 seed includes the Primary Somatosensory Cortex (left - right BA 3), Primary Motor Cortex (left - right BA 4). With AF4 seed, the network includes Dorsolateral Prefrontal Cortex (left - right BA 9), Premotor Cortex (right BA 6), Ventral anterior cinguIate cortex (right BA 24), Supramarginal gyrus (right BA 40), Associative visual cortex (right BA 19), Insular cortex (right BA 13).By visual inspection of Fig. 2, we could describe:
1) the higher correlation positive values are between mirror electrodes in each hemisphere (for example, AF3-AF4, FP1-FP2, C3–C4, C5–C6, FT7-FT8).
2) some left frontal electrodes (F1, F3, F5, F7) and right ones (F2, F4, F6) are positive correlated.
3) some central electrodes (C3, C1, CZ, C2, C4) are positive correlated between them.
Conclusions: We obtained reliable FC networks with seeds located in EEG standard 10-10 system MNI coordinates. Resting state fMRI is a tool that can help determine the relationship between the signal acquired using EEG electrodes (10-10), but more research must be done.
Leibniz Institute for Neurobiology, Department for Behavioral Neurology, Magdeburg, Germany
Otto von Guericke University, Institute of Biology, Magdeburg, Germany
Otto von Guericke University, Medical Faculty, Magdeburg, Germany
Charité Berlin, Department of Psychiatry and Psychotherapy, Berlin, Germany
Default Mode Network connectivity and autistic personality traits
Background: The Default Mode Network (DMN) shows decreased functional connectivity in patients with so-called Autism Spectrum Disorders (ASD, ASC) during rest (Kennedy & Courchesne, 2008; Monk et al., 2009). Here, we investigated whether this also holds true in subclinical autistic phenotypes, which can be assessed using Baron-Cohen's autism spectrum quotient (AQ).
Methods: We obtained AQ scores from 56 young, healthy adults (25 male, 31 female, 1 left-handed, age range 19–31, mean age 24.33) using the standardized questionnaire (Baron-Cohen et al., 2001). Resting-state functional magnetic resonance imaging (RS fMRI) was acquired from all subjects on a 1.5T GE magnetic resonance system (320 EPIs; TR=2 s; TE=35 ms; 23 slices; 3.1×3.1×4 (+1) mm). Data preprocessing (slice timing, spatial realignment, normalization, smoothing) was performed using SPM8. Resting-state specific data analysis (detrending, band-pass filtering - 0.01∼0.08 Hz) was done using DPARSF. Functional connectivity was assessed using a spherical ROI from the left posterior cingulate cortex (PCC) [−6, −54, 22] obtained from a DMN function meta-analysis (Schilbach et al., 2012). A multiple regression second level analysis was performed to examine the influence of AQ on PCC connectivity in the form of Fisher-transformed voxel-wise time course correlations.
Results and Discussion: We observed a negative correlation between AQ and connectivity of the PCC as a DMN landmark structure with the right hippocampus [27, −16, −8] (p=0.04, small-volume FWE-corrected). We tentatively suggest that there is an impaired connection between the DMN as a network for self-reference and social processing and the hippocampus as a key structure in episodic long-term memory which might contribute to the social behavior deficits found in people with autistic personality traits.
Child Mind Institute, Center of Developing Brain, New York, United States
Nathan Kline Institute for Psychiatric Research, Orangeburg, United States
Virginia Tech Carilion Research Institute, Roanoke, United States
Institute of Psychology, Chinese Academy of Sciences, Beijing, China
New York University Child Study Center, New York, United States
The Faster The Better: Reliability of Resting-State fMRI Measures by Multiband Echo Planar Imaging
Objectives: An important recent advance in echo planar imaging is the emergence of multiband echo planar imaging (MB-EPI, Moeller et al., 2010; Xu et al., 2012), which can provide low TRs or small voxel size to optimize temporal or spatial resolution for fMRI, respectively. The reliability of resting-state fMRI (R-fMRI) analyses performed on MB-EPI data has yet to be established. Here we address the test-retest (TRT) reliability of MB-EPI using intra-class correlation (ICC) for a variety of R-fMRI metrics, including: seed-based functional connectivity (FC, Biswal et al., 1995), amplitude of low frequency fluctuations (ALFF, Zang et al., 2007), fractional amplitude of low frequency fluctuations (fALFF, Zou et al., 2008) and regional homogeneity (ReHo, Zang et al., 2004).
Materials and Methods: We conducted an analysis of R-fMRI data from NKI-RS Multiband Imaging Test-Retest Pilot Dataset (fcon_1000.projects.nitrc.org) which consists of 2 scanning sessions separated by one week. The dataset includes: 1) MB-EPI/TR=645 (3 mm isotropic voxels, 10-min scan), 2) MB-EPI/TR=1400 (2 mm, 10-min), and 3) a standard EPI sequence/TR=2500 (3 mm, 5-min) for each session. R-fMRI data were preprocessed and derivative maps were generated for full-length data (see Fig 1 for details). To match scan length of the sequences, first 5-min data were also extract from preprocessed MB data for the ICC analysis.
R-fMRI data processing steps. Preprocessing: 1) realignment, 2) multiple regression of nuisance variables (ventricular, white matter and whole brain global signal, six head realignment parameters, as well as low order polynomial trend) and 3) temporal band-pass filtering (0.01–0.1Hz). Derivative maps generation: R-fMRI matrices were derived from the preprocessed data. For FC analysis, three seed ROIs (Toro et al., 2008) were selected: the posterior cingulate cortex (PCC, MNI coordinates: −6−58 28), supplementary motor area (SMA, −2 10 48), and the inferior parietal sulcus (IPS, 26–58 48). Derivative maps were then transformed into MNI152 (Montreal Neurological Institute) space and spatially smoothed (Gaussian kernel of full-width half maximum 1.5 times of voxel size). Group level ICC of the derivatives for each scan sequence was then calculated for comparison.
Results: All R-fMRI sequences demonstrated moderate to high TRT reliability across the brain for all measures from both full-length, and 5-min data (Fig 2 & 3); ICC values were most impressive for the MB-EPI/TR=645 ms sequence, especially for seed-based FC and fALFF measures - attesting to the increased utility and reliability of this state-of-the-art sequence with unparalleled sampling rates for full brain acquisition.
ICC maps of R-fMRI measures. Scan length=5 minutes.
Distribution of ICC values in brain voxels.
Conclusion: In summary, the pilot TRT reliability dataset suggests improved TRT reliability for the MB-EPI/TR=645 ms sequence. The MB-EPI/TR=1400 ms sequence offers improved spatial resolution with little or no cost of TRT reliability. Further testing will perform on voxel-mirrored homotopic connectivity, degree centrality, ICA as well as FC for other seed regions.
Data Analysis
MaraisL.1PerlbargV.1PouponC.1ThoprakarnU.1PinsardB.1GolayX.1BarkerG. J.1HajnalJ.1HillD.L.G.1SchwarzA. J.1
The London BioScience Innovation Centre, London, Great Britain
Cross-vendor implementation and test-retest analysis of ADNI2 functional MRI (fMRI) and diffusion tensor imaging (DTI) sequences for multicenter clinical trials in Alzheimer's disease
Introduction: Strong evidence of neurobiological effects in clinical trials could facilitate the development of new treatments for Alzheimer's disease. It is expected that cohorts of ∼100 prodromal subjects per arm are required to obtain significant results with both vMRI and more recently developed methods such as Diffusion Tensor Imaging (DTI) and resting state functional Magnetic Resonance Imaging (rs-fMRI). For time-efficient trial execution, multi-center studies are required to provide rapid enrollment, however the collection of robust data across different scanner types and is essential. The second phase of the Alzheimer's Disease Neuroimaging Initiative (ADNI-2) has established 3T DTI and rs-fMRI sequence parameters for GE and Philips systems only, respectively. Our objective was to implement these sequences on Philips, Siemens, and GE scanners and to evaluate their consistency prior to their use in a multi-center clinical trial.
Methods: The ADNI-2 parameters for each sequence were implemented as closely as practicable across vendors. Four young healthy volunteers were imaged across 5 scanners in 2 countries as described in Table 1. Each session comprised two DTI and two rs-fMRI acquisitions. Images were assessed for the presence of gross artifacts and preprocessed using BrainVISA/Connectomist-2.0 for DTI, Statistical Parametric Mapping (SPM8) and CORSICA for rs-fMRI. The data were assessed quantitatively by mean FA measurements on manually-delineated ROIs in the splenium and genu of the corpus callosum (DTI), and by mean correlation between sets of predefined nodes in the Default Mode (DMN; (0,47,-3), (0,-56,32), (-49,-66,36), (52,-59,33)) and Sensorimotor (SMN; (-51,-11,43), (47,-9,41)) networks (fMRI).
FIG. 1.
Results: For DTI, scan-rescan variability values for the genu and splenium FA values were −7% to 7% and −5% to 7% respectively (Figure (a)). For rsfMRI, scan-rescan variability was −11% to 14% for the SMN. The DMN measure was more variable (-9% to 70%; Figure (b)) but consistent with values calculated from other test-retest rsfMRI data sets. DTI measures were more consistent across scanner vendors.
FIG. 2.
FIG. 3.
Conclusions: The reproducibility and consistency of both sequences was within the range of previously published test-retest values. However, results were less stable across scanner type, which may be an important covariate for statistical analysis, especially for rsfMRI.
Applications: Psychiatry
SilkT.1
Murdoch Childrens Research Institute, Melbourne, Australia
Resting-state functional connectivity anomalies in ADHD and responses to methylphenidatemedication
Attention-deficit/hyperactivity disorder (ADHD) is one of the most common neurodevelopmental disorders of childhood and is associated with multiple, significant impairments persisting into adulthood. The most commonly prescribed treatment for ADHD is the stimulant medication, methylphenidate (MPH). While it is well-established that not all children with ADHD achieve equal benefit from MPH, there is a poor understanding of the mechanisms that underpin their neural response. The advantage of resting-state approaches has recently demonstrated clinical utility and is hypothesized to be able to predict individual responsiveness to medication based on patterns of resting-state functional connectivity.
Methods: This study employed a placebo-controlled, double-blind, randomised, cross-over design of the influence of methylphenidate vs placebo on the neural substrates in participants with ADHD. Children with ADHD perform two fMRI measurement sessions, separated by a minimum of 2 weeks. One session was performed under placebo and the other session under an acute standard clinical dose of MPH (20 mg). The two sessions were counterbalanced to avoid practice effects.
Data were acquired used a 3-Tesla Siemens TIM Trio scanner at the Royal Children's Hospital, Melbourne. 180 whole-brain volumes of Resting state EPI were acquired over the 6 min sequence. Pre-processing and data analysis will be performed using the methods described for the 1000 Functional Connectomes Project and International Neuroimaging Data-sharing Initiative. ROIs were selected in inferior frontal, caudate and parietal regions.
Results: The follow results are an initial pilot analysis within a small group, seeding key front0-striatal and parietal regions. When caudate was seeded, repeated measures analysis showed significantly greater functional connectivity when under MPH compare to placebo, in the supramarginal gyrus. Further analysis with greater numbers may reveal that the striatal- parietal connectivity may be a better indicator of responsiveness to medication than fronto-striatal connectivity based on patterns of resting-state functional connectivity.
Ghent University, Department of Data Analysis, Ghent, Belgium
University of Electronic Science and Technology of China, Key Laboratory for NeuroInformation of Ministry of Education, Chengdu, China
Hangzhou Normal University, Center for Cognition and Brain Disorders and the Affiliated Hospital, Hangzhou, China
Universita degli Studi di Bari and INFN, Dipartimento di Fisica, Bari, Italy
Indiana University, Department of Psychological and Brain Sciences - Programs in Neuroscience and, Indiana, China
A blind deconvolution resting state fMRI data to reveal effective connectivity brain networks
Question: Granger causality (GC) is a broadly used technique for inferring effective connectivity in neuroscience, and relies on statistical prediction and temporal precedence. Although GC is powerful and widely applicable, it could suffer from two main limitations when applied to fMRI data: confounding effect of hemodynamic response function (HRF) and conditioning to a large number of variables in presence of short time series. The purpose of the present study is to introduce a novel approach for detecting causal interactions at deconvolved BOLD level rather from the BOLD level, especially for resting-sate fMRI signal.
Methods: For resting-state fMRI signal, it is difficult to capture neural population dynamics by modeling signal dynamics without explicit exogenous inputs, unless relying on some specific prior physiological hypothesis. A recent study has proposed that relevant information in resting-state fMRI can be obtained by inspecting the discrete events consisting of relatively large amplitude BOLD signal peaks [Tagliazucchi et al., 2012]. Following this idea, we consider resting fMRI as 'spontaneous event-related’. Specifically, we individuated point processes corresponding to signal fluctuations with a given signature. For an alignment procedure, we extracted a region-specific HRF and then use it in deconvolution (Glover's method [Glover, 1999]). We thus apply partial conditioning to a limited subset of variables in the framework of information theory, as recently proposed in [Marinazzo et al., 2012].
Results and Conclusion: We tested this approach on public resting-state fMRI data with different TRs (http://fcon_1000.projects.nitrc.org/indi/pro/eNKI_RS_TRT/FrontPage.html). We compared large-scale network properties, such as small-worldness between two levels effective brain network and discuss the differences introduced by BOLD deconvolution in the network architectures obtained with partially conditioned GC.
References
TagliazucchiE., BalenzuelaP., FraimanD., ChialvoD.2012. Criticality in large-scale brain fMRI dynamics unveiled by a novel point process analysis. Frontiers in Physiology, 3.a-1519a-1594GloverG.1999. Deconvolution of impulse response in event-related bold fMRI. NeuroImage, 9:416–429.a-1595MarinazzoD., PellicoroM., StramagliaS.2012. Causal information approach to partial conditioning in multivariate data sets. Computational and Mathematical Methods in Medicine. arxiv.org/abs/1111.0680.a-1596
Applications: Psychiatry
HahamyA.1DinsteinI.2BehrmannM.2MalachR.1
Weizmann Institute of science, Neurobilogy, Rehovot, Israel
Carnegie Mellon University, Psychology, Pittsburgh, USA, United States
Ventral premotor enhancement of inter-hemispheric resting state functional connectivity in high functioning Autism Spectrum Disorder
Autism spectrum disorder (ASD) is a neurodevelopmental disorder that includes affective, behavioral and cognitive symptoms. In the human brain, related behaviors have been associated with the “mirror neuron network” (MNN), a network including the ventral pre-motor (VPM) and parietal cortices, that may play a key role in social interactions. While much research has focused on activation of the MNN in ASD subjects using task-based functional imaging, an alternative approach for identifying atypical brain function has examined brain activity fluctuation during rest (resting state). However, the results of previous studies examining resting state in ASD subjects have been mixed, with some showing increases in cross regional signal correlations (functional connectivity) in ASD patients and others showing decreases.
To address these existing discrepancies, we used a data-driven approach, which focused on examining functional connectivity across homologous points between the two hemispheres (interhemispheric connectivity). This was examined within a group of 13 autistic individuals and 12 controls. Our results show that the most consistent effect was an interhemispheric connectivity increase in the VPM in the ASD group. Intriguingly, a substantial part of the variance in the interhemisperic correlations of the VPM within the ASD group was explained by the subjects' communication scores, such that the more sever the communication deficit, the higher the correlation between the bilateral VPM (r=0.78, p<0.005).
These results point to functional connectivity enhancements as a possible marker of high functioning ASD. Importantly, the largest of the significant clusters, the VPM, is a sub-region of the MNN, which has been repeatedly implicated in ASD.
Nathan Klein Institute, Orangeburg, NY, United States
Child Mind Institute, New York City, NY, United States
Johns Hopkins, Applied Mathematics & Statistics, Baltimore, United States
Mind Research Network, Albuquerque, New Mexico, United States
Johns Hopkins, Baltimore, United States
Brainstorm Towards Clinically and Scientifically Useful NeuroImaging Analytics
We desire to transform clinical psychiatric practice to take advantage of the vast technological strides in contemporary neuroimaging. We propose three complementary steps will help facilitate this transformation. First, the construction of a computing platform to store and process large datasets. Second, methods to calibrate measurements across individuals and instruments. Third, tools to convert such measurements into clinically useful analytics. We are developing BRAINSTORM (Fig 1) to address these three concerns.
Schematic Illustration of BrainStorm.
First, a high-performance compute cluster and associated scientific database, called “BrainCloud”, for storing, managing, and efficiently querying both multi-modal neuroimaging and rich phenotypic data. BrainCloud will be seeded with data already available from the International NeuroImaging Data Initiative [1] as well as the Mind Research Network [2]. Moreover, BrainCloud will include a simple one-click upload interface so that additional research and clinical facilities can contribute to the growing data corpus.
Second, a robust pipeline optimized to pre-process multimodal image data to infer multi-modal attributed connectomes (MACs). We are developing a highly configurable pipeline [3] that enables us to search for an optimal representation of data for subsequent inference via non-parametric reliabilities estimates. Third, streaming decision theoretic manifold learning algorithms [4] that yield clinically useful outputs, as well as provide insight into brain/behavior relationships. To date, most statistical and machine learning algorithms natively operate on vector valued data; but our data are far more complex: responses to psychological instruments and multimodal images. We are developing complementary tools that natively operate on non-Euclidean data and “stream”, meaning that they continue to learn as new data becomes available.
LinS.-H.1WuC.2ChouK.-H.1LiC.-T.3SuT.-P.3LinC.-P.1
National Yang-Ming University, Taipei, Taiwan
National Central University, Graduate Institute of Biomedical Engineering, Jhongli, Taiwan
Taipei Veterans General Hospital, Department of Psychiatry, Taipei, Taiwan
Evaluating Efficacy of DLPFC TMS Treatments to Resistant Depression Patients
Introduction: Major depressive disorder is a common neuropsychiatric disease, regarded as a large-scale brain-network dysfunction. Repetitive transcranial magnetic stimulation (rTMS)-based therapy becomes popular recently on depression treatments due to its non-invasiveness and antidepressant effect. However, the stimulation protocols have wide varieties, responses are not consistent to treatment-resistant patients, and the corresponding mechanism of brain circuit changes after TMS treatments remains unclear. Specifically, we utilize resting-state fMRI to evaluate baseline brain connectivity prior and post to the rTMS treatments on left DLPFC.
Methods: 29 patients with treatment resistant depression underwent a two-week rTMS protocol (10Hz, 4 s/train and 40trains/day) on left DLPFC. Behavioral scores after treatment showed 17 TMS responders (Rs, 50% HAM-D score improvement) and 12 non-responders (NRs). Resting-state fMRI dataset were collected from the patient pool (3T Trio system using GE-EPI sequence with TR=2 s and TE=30 ms) for functional connectivity evaluations and compared with the fMRI results from 18 healthy controls (HC) using 2-sample t-tests.
Results:Baseline connectivity- Depressed patients had generally decreased connectivity among cortico-limbic circuits (Fig 1, seeded from amygdala). Relative to HCs, Rs showed disconnections to cortical regions, but NRs shows even lower connectivity within both cortical and limbic regions.
Group connectivity maps of HC, Rs and NRs, seeded from amygdale.
rTMS treatments effects- Rs revealed enhanced connections in emotion and rewarding circuits (MPFC-dACC/-Caud, and OFC-amygdala/-hippocampus), while NRs showed frontal-parietal-temporal circuit were enhanced (Fig 2).
Connectivity changes after rTMS intervention in both Rs (left) and NRs (right).
Conclusion: Decreased connections in depressive patients demonstrate reduced modulation of cortico-limbic communications. Intrinsic connectivity maps between groups suggest that Rs/NRs differences of depression patients may originate from distinct functional-network deficits, also reflected on the connectivity changes after treatments. Lastly, our findings indicate that even with the same TMS protocol may lead to diverse effects between populations.
Methods and Acquisition
PaoliniM.1KeeserD.2BermanA.1IngrischM.1KirschV.3ReiserM.1BlautzikJ.1
Ludwig Maximilian University, Institute for Clinical Radiology, Munich, Germany
Ludwig Maximilian University, Institute for Clinical Radiology/Department of Psychiatry and Psychotherapy, Munich, Germany
Ludwig Maximilian University, Department of Neurology, Munich, Germany
Resting-state networks in healthy adult subjects: A comparison between an 32-element and 8-element head coil at 3.0 Tesla
Question: The aim of the study was to explore the potential of a 32-element head coil for recording resting-state networks (RSNs) compared to an 8-element head coil.
Methods: 26 healthy adults (mean age 21.7 years, SD 2.1 years) underwent two runs of resting-state functional magnetic resonance imaging on a 3.0 Tesla standard clinical scanner (Achieva TX, Philips Healthcare). Both runs used the same imaging parameters, one utilizing a 32-element phased array only-receiving SENSE head coil with dual coil imaging, the other utilizing a standard 8-element phased-array SENSE head coil. Independent component analysis (ICA) as implemented in the FSL 4.1.7 software package was performed on all resting-state runs in combination with a validated dual-regression approach. Voxel-wise nonparametric statistical between group contrasts were determined using permutation-based nonparametric inference for all 14 networks. Additionally, the signal to noise ratio (SNR) of both coils was measured in phantoms and compared.
Results: Statistical analysis yielded 14 RSNs for all subjects using the 32-element head coil as well as using the 8-element head coil. All of these 14 RSNs were highly consistent with intrinsic connectivity networks described in previous ICA-based studies of resting-state functional connectivity. There was no significant difference between corresponding RSNs of both coils (thresholds: p<0.05, family wise error rate corrected and p<0.001, uncorrected). This result was in accordance with phantom measurements of the SNR recorded by both coils showing no significant differences.
Conclusions: Regarding the potential for recording resting-state networks, there is no significant advantage of the investigated design model of a 32-element phased array only-receiving SENSE head coil compared to an analogous 8-element head coil using the same sequence parameters.
Maastricht University, Clinical Psychological Disorders, Maastricht, Netherlands
Is default mode network functional connectivity a biomarker of vulnerability to depression?
Objectives: Recent work on spontaneous low frequency fluctuations in BOLD signal has revealed the existence of several resting state networks. Among them the default mode network (DMN) has been identified as a consistent pattern of high degree of functional connectivity across a network of brain regions active when the brain is at wakeful rest engaged in task-independent introspection or self-referential thinking. DMN connectivity has been found relevant to several psychiatric thought disorders, one of them being major depressive disorder. Abnormal connectivity in the DMN of depressed patients correlates with clinical variables such as the length of the current depressive episode or overall refractoriness and is considered a promising biomarker of disease status. However, it has not yet been examined if these abnormalities can serve as a vulnerability marker of depression. The objective of our study was to investigate whether altered patterns of DMN functional connectivity are present in adults at increased familial risk of major depression.
Methods: Twenty participants with a first-degree family relative with major depressive disorder and twenty healthy controls matched for age and gender participated in the study. Six-minute resting state data were acquired while participants kept their eyes open and fixated on a cross presented centrally. Depressive symptomatology and traumatic history of participants was assessed with questionnaires. To investigate the relationship of DMN connectivity to brain activation during task execution we had the participants perform an emotional face perception task during which they were asked to indicate the gender of sad, happy and neutral faces.
Results: Data have been collected and are currently under analysis. They will be presented at the conference. DMN will be defined with an individually optimized seed approach and group-wise whole brain GLM analysis, region based detailed analysis of connectivity profiles and voxel-wise graph analysis will be carried out. Individual variation in connectivity measures will be related to variation in task-induced brain activation measures in several regions of interest.
Conclusions: Results will indicate whether altered functional connectivity within the DMN is associated with familial vulnerability to major depressive disorders.
Methods and Acquisition
DiazB.A.1Van der SluisS.2BenjaminsJ.S.3MoensS.3MansvelderH.D.1Van SomerenE.3Linkenkaer-HansenK.1
Center for Neurogenomics and Cognitive Research, Integrative Neurophysiology, Amsterdam, Netherlands
Center for Neurogenomics and Cognitive Research, Functional Genomics, Amsterdam, Netherlands
Netherlands Institute for Neuroscience, Amsterdam, Netherlands
Resting-state Questionnaire data reveal seven factors of cognition during rest
The past decade has seen many advances in our understanding of resting-state neurophysiology. Despite this progress, research into the cognitive dimension of the resting-state has been limited, even though mind-wandering has been shown to take up a large part of people's daily activities.
To facilitate systematic measurement and characterization of resting-state cognition, we developed a 50-item Resting-State Questionnaire (RSQ). Here, we describe a factor model derived from RSQ data obtained as part of an online test battery implemented in the Netherlands Sleep Registry (www.sleepregistry.org).
While at home, participants (n=992, 75% female, mean age 53+−13 years) were instructed to create a quiet environment around their computer, and follow the procedures presented on-screen. After five minutes of eyes-closed rest, participants were instructed to fill out the online RSQ. The data were preprocessed in MATLAB® to screen for outliers. Additionally, participants who were disturbed during the experiment were removed from further analysis. We performed exploratory (Oblimin rotation) and confirmatory factor analyses on the remaining data (n=801) in Mplus 5.1. Criteria for the selection of factors in the exploratory factor analysis were 1) eigenvalues of the R-matrix >1 and explaining >3% of the total variance and 2) factor loadings >.32.The obtained factors were then used as a template to build and test a confirmatory factor model, which fitted the data well.
Based on the 27 RSQ items associated with the seven-factor solution, we labeled the factors: Discontinuity of Mind, Theory of Mind, Self, Planning, Sleepiness, Comfort, and Somatic Awareness. We show that taking the average of RSQ-items describing a factor rather than estimated model factor scores is justified. These approximate factor scores provide a straightforward means to relate different dimensions of resting-state cognition to measured brain activity, e.g., using EEG or fMRI. In addition, these scores can prove beneficial in investigating the impact of brain-disorders on mind wandering and other aspects of resting-state cognition.
San Diego State University, Psychology, San Diego, United States
University of California, San Diego, United States
Harvard University, Children's Hospital, Boston, MA, United States
Brown University, Neurosciences, Providence, United States
Effects of methodological variables on resting state functional connectivity findings in autism spectrum disorders
Objectives: Increasing evidence suggests that autism spectrum disorders (ASD) are related to aberrant connectivity, involving multiple brain networks. Most fcMRI studies have reported underconnectivity, but the number of inconsistent findings has grown. We assessed the impact of methodological decisions (temporal filtering, field of view [FOV] selection, seed definition) on resting state fcMRI results.
Methods: FMRI data from 21 ASD and 25 typically developing (TD) children and adolescents, matched on age, sex, IQ, and motion, were motion and field map corrected, aligned to high-resolution anatomicals, standardized to the N27 Talairach template, and blurred to a 6 mm global full-width-at-half-maximum. Six rigid-body motion parameters and signals from white matter and lateral ventricles were modeled as nuisance regressors. Time points (and their neighbors) with motion >1.5 mm were censored; data sets with <172 remaining time points were excluded.
A seed was placed in posterior cingulate cortex (PCC) based on literature on the default mode network (DMN). We analyzed high-pass filtering (>.008) vs. low band-pass filtering (.008<f<.08), and a whole-brain FOV vs. a FOV restricted to ROIs within the DMN. Additionally, we used a whole-brain FOV, low band-pass filtering, and a seed in left inferior frontal gyrus (LIFG) derived from an fcMRI study of sentence comprehension in ASD (Just et al., 2004).
Results: For high-pass filtered data with a PCC seed and restricted FOV (DMN only), we found underconnectivity in the ASD group (p<.05). Expanding to whole brain FOV, an even mixture of over- and underconnectivity was found. Replacing high-pass with low band-pass filter, the proportion of over- and underconnectivity remained the same, but the number of voxels with significant group differences increased. For the LIFG seed, low band-pass filtering, and whole-brain FOV we found overconnectivity in the ASD group.
Conclusions: Methodological variables, such as temporal filtering and FOV, had striking impact on the pattern of between-group fcMRI findings. Findings from Just et al. (2004) that triggered the underconnectivity theory of autism were not replicated; instead, extensive overconnectivity was observed. The results indicate that careful attention to methods is required in fcMRI studies of clinical populations.
Max Planck Institute of Psychiatry, RG Neuroimaging, Munich, Germany
GE Healthcare, Global Applied Science Laboratory, Munich, Germany
Comparison of Gradient-Echo EPI and Spin-Echo EPI for functional connectivity of emotional circuitry
Question: Functional connectivity (FC) of emotional circuitry is relevant for neuroimaging of affective disorders, but medial prefrontal regions and amygdala are degraded in term of image quality due to proximity to sinuses. The aim of this pilot study is to investigate if spin-echo EPI (SE) could be favorably used for FC of emotional circuitry, due to its reduced sensitivity to susceptibility artifact, when compared to gradient echo EPI (GRE).
Methods: Resting state fMRI data were acquired on 14 healthy volunteers using GRE (TE=30 ms) and SE (TE=70 ms) with otherwise identical imaging parameters. Then, a seed-based analysis was performed on SE and GRE data separately. Seven seeds were defined within emotional circuitry, and one in the posterior-cingulate cortex (PCC) (Fig 1). The PCC seed was used to identify the default mode network (DMN) to ensure that this network is present. For the comparison of FC maps we contrasted the SE>GRE and SE<GRE for all seeds, using paired t-tests with voxel-wise (whole brain) and cluster-wise (whole brain) FWE correction (p<0.05).
Preprocessed images of GRE (top) and SE (bottom) and the ROIs used for the seed-based FC.
Results: Both SE and GRE depicted the DMN as expected, based on the PCC seed. When analyzing the results with voxel-wise FWE correction, no statistical differences were observed except within the seed itself for SE>GRE. The comparison SE>GRE with FWE cluster correction showed increased strength of FC (see Fig 2).
Differential contrast SE>GRE for all seed analysis, paired t-tests with FWE cluster corrected (p<0.05).
Conclusions: The seeds placed within the emotional circuitry presented robust and anatomically reliable connectivity patterns in the differential contrast SE>GRE. Surprisingly, for almost all networks SE resulted in stronger functional networks than GRE. Even when using a seed in a region not strongly affected by susceptibility artifacts (e.g. the PCC on Fig.2), SE shows stronger FC than GRE. This suggests that signal-to-noise (due to susceptibility induced signal losses) of the acquisitions did not entirely cause the differences. To further elucidate these differences, we are currently investigating this effect by using simultaneous acquisition of SE and GRE with a hybrid EPI to allow for a direct comparison.
Applications: Psychiatry
MingoiaG.12WagnerG.12LangbeinK.12MaitraR.12SmesnyS.12DietzekM.12BurmeisterH.P.12ReichenbachJ.12SchloesserR.G.M.12GaserC.12SauerH.12NenadicI.12
IZKF Aachen, Brain Imaging core facility, Aachen, Germany
University “F. Schiller”, Klinik für Psychiatrie und Psychotherapie, Jena, Germany
Default mode network activity in schizophrenia studied at resting state using probabilistic ICA
Introduction: While functional MRI and PET studies have shown altered task-related brain activity in schizophrenia, recent studies suggest that such differences might also be found in the resting state (RS). Here we used pICA to analyze RS fMRI data to compare connectivity of the default mode network (DMN) between patients with schizophrenia and healthy controls.
Methods: We obtained RS fMRI series (3T, 3×3×3 mm resolution, 45 slices, TR 2.55 s, 210 volumes) in 25 schizophrenia patients (mean age 30a±7.3), on stable antipsychotic medication and 25 matched healthy controls (30.3a±8.6).
Subjects were asked to lie in the scanner keeping eyes closed with no further specific instructions. Data were pre-processed using SPM5 (motion correction, co-registration, normalization and smoothing). Band pass (0.009–0.18Hz) frequency filters were applied. We applied FSL MELODIC (pICA) yielding 30 IC, and an automated routine to select for each subject the component matching the anatomical DMN definition. SPM5 was used for second level analysis, we used two sample t-test to compare DMN functional connectivity between groups. In addition, we used multiple regression to correlate DMN activity components with psychopathology, as assessed with SANS and SAPS scores.
Results: Our method reliably identified a DMN component in every control (Figure 1) and patient (Figure 2). We found significant differences in the anatomical pattern of areas (figures 3, 4, 5). There was a correlation of parts of the DMN component in patients:
we found significant negative correlations between the frontal polar cortex DMN activity and SANS subscales “affective flattening or blunting” (r=−0.52) and “alogia” (r=−0.463), as well as a negative correlation between the right inferior temporal gyrus and the “alogia” subscale (r=−0.546).
Conclusions: DMN components can be identified from RS fMRI in schizophrenia patients. The differences in anatomical distribution point to possible alterations in functional connectivity in schizophrenia, unrelated to cognitive task activity. It supports models of prefrontal cortical dysfunction in the absence of specific cognitive activity. Correlations with psychopathology suggest a direct relation to psychopathological items, which would support a clinical significance of altered DMN activity.
Methods and Acquisition
KielingR.1KielingC.2RohdeL.A.2FrancoA.1
PUCRS, Instituto do Cerebro, Porto Alegre, Brazil
Hospital de Clínicas de Porto Alegre, Child and Adolescent Psychiatry, Porto Alegre, Brazil
Can't stop moving: head motion is a potential problem in resting-state acquisitions of hyperactive children
Question: Recent reports have suggested that spurious but systematic correlations in resting state functional connectivity MRI (rs-fcMRI) networks arise from subject motion (Power 2012, Van Dijk 2011). Control analyses demonstrate that this artifact does not arise from and cannot be adequately countered by common regressions performed during processing. It would be expected that subjects with attention deficit hyperactivity disorder (ADHD), most likely children, would be particularly prone to move during scanning. However, with few exceptions (Epstein et al, 2007; Durston et al., 2003), most imaging studies conducted in patients with ADHD have not reported on attrition related to motion during scanning.Here we perform a head motion analysis in the ADHD-200 sample database (http://fcon_1000.projects.nitrc.org) comparing children and adolescents with ADHD to healthy controls and also analyze the impact of age on in-scanner motion.
Methods: Subject motion was measured based upon head realignment using a rigid body six-parameter affine transform, summing the point-by-point displacement estimates for six parameters (three translational and three rotational displacements). Groups were compared using an inverse Gaussian generalized linear model, with age included as a covariate.
Results: A total of 305 typically developing controls and 119 drug-näive children and adolescents with ADHD were analyzed. There was no difference in mean age between groups. While hyperactive or combined subtype children showed significantly higher movement than controls (p=0.018), this difference was not observed for children with the inattentive subtype (p=0.227). Hyperactive children with ADHD exhibit excessive head motion during imaging acquisition compared to controls.
Conclusions: Optimal handling of rs-fcMRI data will need to take into account the consequence of motion artifacts to avoid the report of artifactual patterns of correlation.
San Diego State University, Psychology, San Diego, United States
University of California, La Jolla, United States
Brown University, Neurosciences, Providence, United StatesIs the resting state the royal road to intrinsic functional connectivity? The impact of methods on fcMRI results in autism
Objectives: By consensus, sociocommunicative impairments in autism spectrum disorders (ASD) require explanation on the network level. Many recent fcMRI studies have used a resting state (RS). While underconnectivity findings for ASD predominate, overconnectivity has also been reported. We aimed to isolate methodological factors at the root of these inconsistencies.
Methods: We included fMRI data for RS (eyes open), visual attention, visual search, and semantic decision from >100 participants with ASD and matched typically developing (TD) controls. Data were analyzed along two competing pipelines, one with low bandpass filter (.1>f>.01Hz) and task regression (except for RS), aiming to isolate intrinsic functional connectivity (FC), and one that retained task effects and higher frequencies (coactivation analysis). For all comparisons, data were motion-matched between groups and “scrubbing” (Power et al., 2012) was performed.
Results: Using imitation network seeds (premotor, IPL, STS), we found no group differences in intrinsic FC for RS, but overconnectivity in ASD for task-regressed semantic decision data. Diverging patterns of seed-specific intrinsic FC group differences were also seen in comparisons (i) between RS and visual search and (ii) between two datasets (RS, visual attention) available for an identical cohort of 46 ASD and TD children. Across all datasets, the intrinsic FC pipeline (task regression, low bandpass filter) tended to boost overconnectivity effects in ASD, whereas the co-activation pipeline boosted underconnectivity, especially when effects were examined only for activation-based regions of interest (ROIs). Differential results for task vs. RS data were not explained by arousal, as no group differences in cardiac and respiratory rates were found.
Conclusions: FCMRI results are heavily impacted by methods. For a given dataset, opposite group differences are found depending on task regression, bandpass filter, and ROIs. Use of RS affects FC findings, which differ from task-regressed intrinsic fcMRI. In the study of special populations such as ASD, differences in cognitive state during uncontrolled RS, which cannot be monitored, may affect low-frequency BOLD fluctuations. Rather than providing a consistent platform for studying intrinsic FC, the RS may introduce new confounds.
Methods and Acquisition
BeallE.1LoweM.1
Cleveland Clinic, Radiology, Cleveland, United States
PESTICA: a toolbox to obtain PMU-equivalent cardiac & respiration signals from BOLD EPI using the data itself!
Introduction: Analysis of functional connectivity (FC) [1–3] and some fMRI [4] data are biased by physiologic noise from cardiac and respiratory cycles. These sources reduce specificity and cannot be separated with ICA[5] or temporal filtering [3] (for typical TR). In order to correct for cardiac/respiration, one must acquire,at time of MRI, signals corresponding to these. If this was not done or failed, noise will not be effectively removed. It is now possible to correct after-the-fact with PESTICA [6].
We announce PESTICA for AFNI, hosted by NITRC. PESTICA is user-friendly and robust. PESTICA includes IRF-RETROICOR, an improved correction method[8] that obtains the impulse response function (IRF) of each heart beat or breath. IRF-RET allows determination of success or failure of PESTICA to estimate noise sources. We demonstrate PESTICA with the 25-subject NYU TestRetest dataset [7] for successful cardiac (one failure out of 75 scans) and respiratory estimation (3 failures out of 75). These estimators are available for download.
Methods: Resting FC was acquired in 25 subjects on 3 sessions[7]. PESTICA was downloaded from NITRC (pestica v1.2 for AFNI) and applied to each dataset. For QA, we used thresholds based on pilot MR data with monitored pulse and respiration: if either 1) the number of IRF-coupled voxels >1000 or 2) the absolute pearson correlation of the first IRF to the ensemble average across subjects with same acquisition >0.5, then estimation was successful.
Results:Fig 1: first IRF for all scans for respiration (arbitrary polarity). Note that if PESTICA fails, or if arbitrary phase data is fed into IRF-RET rather than the appropriate estimators, the IRFs show completely arbitrary shapes [8]. Fig 2: histogrammed correlation b/w a template created from ensemble average and each IRF.
FIG. 1.
FIG. 2.
Discussion: The PESTICA toolbox is now available for all users and will allow correction of physiologic noise long after acquisition. Planned ongoing improvements include QA decision thresholds, usability, and the distribution of validated estimators for many publicly-accessible datasets.
IpserJ.1BrownG.1Bischoff-GretheA.1ConnollyC.1JordanS.1GrantI.11
UCSD, Psychiatry, San Diego, United States
Altered DLPFC intrinsic connectivity in chronic HIV
Introduction & Aims: HIV infection is associated with an increased risk of deficits in cognitive abilities subserved by frontostriatal neural circuitry, with evidence of functional connectivity abnormalities in the dorsolateral prefrontal cortex (DLPFC). The objective of this study was to characterize patterns of DLPFC-referenced BOLD synchronicity during a task-free condition in subjects who have chronic HIV, relative to healthy controls.
Method: Whole-brain 3T T2-weighted images were acquired while subjects participated in a 6.5 minute eyes-open task-free protocol. Left and right DLPFC masks were used as seed ROIs for functional intrinsic connectivity analysis in 17 HIV patients and 8 age and education-matched healthy controls. On an individual subjects level, B0 correction, tissue segmentation and temporal co-registration was followed by physiological and residual motion artifact removal and hemisphere-specific within-subject averaging of the BOLD signal in the DLPFC. Subject brains were subsequently registered to Talairach space for group comparisons and smoothed with a 7 mm gaussian kernel. Within-group and between-group t-tests of Fischer z-transformed correlations were conducted for both the left and right DLPFC, with moderating effects of age, education and cognitive impairment tested in a general linear regression model.
FIG. 1.
Results: Although positively correlated intrinsic co-activation was observed bilaterally in the frontal cortex in both HIV subjects and controls (p<0.05, uncorrected), greater bilateral DLPFC and medial frontal gyrus representation was evident in HIV patients with the strongest correlations apparent in some DLPFC regions among controls. These results were observed for both DLPFC seeds. Increasing age was associated with reduced connectivity of the DLPFC bilaterally.
Discussion: The greater spatial extent and reduced magnitude of bilateral intrinsic frontal correlations in the HIV subjects suggest a compensatory response to brain injury associated with HIV infection. Moreover, evidence of diminished frontal connectivity in older subjects may reflect deterioration of synaptic junctions in this region associated with old age. Additional results from between-group and multivariate analyses will be presented at the conference.
Conclusion: This study provides preliminary evidence for a possible compensatory response to neurodegeneration in chronic HIV, as reflected by differences in intrinsic bilateral connectivity in the frontal cortex.
National Institutes of Health, Section on Functional Imaging Methods, Bethesda, United States
The effect of repetition time on connectivity estimates
Introduction: It is unclear how variation in repetition time (TR) effects resting state connectivity analyses. Changing TR could influence the sampling of cardiac and respiratory signals in fMRI, and also the relative contributions of cerebrospinal fluid (CSF) pulsation and blood in-flow effects to the BOLD signal. Although fMRI is able to resolve hemodynamic responses up to 0.3 Hz, most resting state studies focus on BOLD signal fluctuations below 0.1Hz due to the presence of respiration and cardiac signal artifacts at higher frequencies. It is still unclear whether frequencies above 0.1 Hz contain information about neural activity. We assessed the effects of repetition time (TR) on resting-state connectivity estimates by comparing correlation values at multiple TRs between brain areas known to connect and areas not known to connect.
Methods: Five seven-minute resting scans were acquired at 250, 500, 1000, 2000, and 4000 ms. Data were aligned to the same temporal origin, spatially registered and aligned, detrended, motion corrected, and bandpass-filtered at several frequency ranges, and spatially smoothed. Connectivity estimates within default mode regions, between default mode regions to other cortical regions, and between cerebrospinal fluid and cortex were calculated.
Results and conclusions: Faster sampling rates led to a greater number of correlated voxels, and correlation maps varied with TR. Whether this result reflects true functional connectivity remains to be seen. Correlations between cortex and CSF represent fluctuations that are non-neural in origin. These correlations also varied with TR, particularly in the 0.01–0.1Hz frequency range, and were particularly evident at fastest TRs. Significant correlation differences between regions known to connect and regions not known to connect were also seen at frequencies above 0.1 Hz, suggesting the possibility that frequencies above this range could have information about functional connectivity.
Applications: Psychiatry
OlbrichS.1SanderC.1HegerlU.1
Universitiy of Leipzig, Psychiatry, Leipzig, Germany
Resting State EEG-Vigilance Regulation in Major Depression: From Theory to Treatment Prediction
Recently a framework has been proposed that links vigilance decline (i.e. time series of brain arousal) during the resting state with different symptoms of neuropsychiatric disorders. An unstable vigilance regulation as can be found in mania or attention deficit and hyperactivity syndrome is paralleled by stimuli seeking behavior to stabilize the otherwise rapidly declining vigilance. The opposite can be found in Major Depression (MD) were symptoms like social withdrawal and avoidance have been interpreted as autoregulative mechanisms to counteract an increased vigilance. The question raises to what extend this theoretical framework can be used to 1) separate patients with MD from Healthy Controls (HC) and 2) delineate subgroups within a population of patients with MD for prediction of treatment response.
Method: 1) Using the Vigilance Algorithm Leipzig (VIGALL), 30 unmedicated patients with MD and 30 age and gender matched HC were assigned to one of three different vigilance regulation patterns of a 15 minute resting state EEG-recording: A stable pattern, a slowly declining pattern and an unstable pattern. Using Chi2 Test, the frequency distribution of those patterns in both groups was analyzed. 2) 33 unmedicated patients with MD (different from the population mentioned before) were assigned to one of the three EEG-vigilance regulation patterns. Depressive symptom severity was assessed using Hamilton Depression Rating Scale (HDRS) at baseline prior to medication with an SSRI, Venlafaxine or Mirtazapine and two weeks after baseline. Fisher's Exact Test was used to compare the frequency distribution of EEG-vigilance regulation patterns in responders (>33% reduction from baseline HRDS) and non-responders.
Results: 1) Patients with MD and HC showed a significantly different frequency distribution to the three different EEG-vigilance regulation patterns with chi2=13.34; p
Conclusion: Assessment of EEG-Vigilance regulation during the resting state successfully separates patients with MD from HC. Further, a hyperstable vigilance regulation was predictive for non-response of antidepressant medication. Further cross-validation studies on larger cohorts are warranted to gain more knowledge about discriminative and predictive power of EEG-vigilance regulation during rest in MD.
Methods and Acquisition
WhitlowC.1MaldjianJ.1
Wake Forest School of Medicine, Radiology - Neuroradiology, Winston-Salem, United States
Graph Theory Network Metrics Can Be Accurately Computed from Clinical Task-Based fMRI Bold Signal Acquired During Routine Presurgical Motor and Language Brain Mapping in Patients with Glial Cell Malignancies
Objective: The objective of this study was to determine if accurate graph theory network metrics could be computed from clinical task-based fMRI (T-fMRI) acquired from patients with brain tumors. We hypothesized that there would be no difference between graph metrics computed from T-fMRI and standard resting-state fMRI (RS-fMRI) BOLD data.
Methods: Four patients with brain tumors were scanned for collection of structural anatomic MRI, routine clinical presurgical T-fMRI using motor (finger-tapping) and language (verbal-recall) tasks, as well as RS-BOLD signal. All data were motion-corrected and normalized to a standard template using SPM. T-fMRI data were further processed to remove task-associated temporal interdependencies. A binarized adjacency matrix for each subject was generated at a network cost of 0.3 for the T-fMRI and RS-fMRI data from which graph theory metrics were computed (Figure 1).
FIG. 1.
Results: There were no differences between graph theory network metrics computed from RS-fMRI and clinical T-fMRI BOLD data, including small-worldness (Figure 2), global efficiency (Figure 3) and local efficiency (Figure 4).
FIG. 2.
FIG. 3.
FIG. 4.
Conclusion: Graph theory network metrics can be accurately computed from clinical T-fMRI BOLD signal acquired during routine presurgical motor and language mapping of brain in patients with glial cell malignancies. These data are concordant with prior studies demonstrating similar graph theory metrics computed from T-fMRI and RS-fMRI in basic science research paradigms. Importantly, these methods can be immediately applied to clinical databases of presurgical functional brain mapping for hypothesis testing. The translation of this approach into clinical practice may potentially lead to the discovery of novel functional imaging biomarkers with which to study disease progression, guide therapy and predict outcomes in patients with brain tumors.
Netherlands Institute for Neuroscience, Amsterdam, Netherlands
University Medical Center Groningen, Amsterdam, Netherlands
Hoofd Centrum Ontwikkelingsstoornissen (COS), Deventer, Netherlands
Overconnectivity in primary sensory networks coupled with underconnectivity in higher-order cognitive networks in participants with high-functioning autism spectrum disorder
Background and Aim: Efficient information integration requires a dynamic balance between local processing and information transfer across distant brain regions. Behavioural, functional and anatomical evidence suggest that in autism spectrum disorder (ASD) this balance is disrupted. While fMRI gathered the first evidence of these abnormalities using task-elicited BOLD response, it is possible that they also affect the functional architecture of the brain at rest. We began to test this prediction on resting-state fMRI (RS-fMRI) data applying basic information theoretical measures on functionally-relevant network extracted using probabilistic ICA.
Methods: RS-fMRI data were acquired in 18 male adults (9 ASD) using a GRE FFE sequence (TR 2200 ms, TE 30 ms, voxel size 2.75×2.75×2.72 mm, flip angle 80°, 49 axial slices, no gap). Spatially independent components (ICs) were extracted using FSL Melodic pICA on the temporally concatenated data across all subjects. Subject-specific maps of 17 functionally-relevant components were obtained using dual regression (http://www.fmrib.ox.ac.uk/analysis/dualreg/). Within each ICs, mutual information (MI) was computed between each pair of above-threshold voxels, and binned at different anatomical distances.
Results: MI was found to be increased in ASD vs. Controls within primary sensory networks, while the opposite situation was present in several higher-order cognitive networks (see Fig. 1). Notable exceptions were the right saliency and default-mode networks.
Anatomical distance vs. average (±SEM) mutual information calculated between the time course of each pair of voxels within each functional network, extracted using pICA.
Conclusions: This result is consistent with the hypothesis that in ASD whole-brain information integration is disrupted by local overconnectivity, leading to overprocessing of sensory inputs, coupled with deficits in long-range connections, resulting in desynchronization, delays and generally poor information transfer across distant brain regions.
Methods and Acquisition
WhitlowC.1JungY.1MaldjianJ.1
Wake Forest School of Medicine, Radiology - Neuroradiology, Winston-Salem, United States
Accurate Graph Theory Metrics of Brain Network Connectivity Can Be Computed Across a Range of Pulse Sequence Repetition Times, Including Those Used for Clinical Pulsed Arterial Spin Labeling Perfusion MRI
Objective: The objective of this study was to determine if graph theory methods could be applied to pulsed arterial spin labeling (PASL) time-series data for computation of accurate network metrics. We hypothesized that graph theory analysis applied to PASL data would yield similar network metrics as those computed from RS-BOLD data.
Methods: Thirty-one normal control subjects were scanned for collection of structural anatomic, resting-state blood oxygen level dependent (RS-BOLD), and PASL perfusion data. Each subject's motion-corrected normalized RS-BOLD and PASL data were compared over a range of pulse sequence repetition times (TR) to investigate the effects on computed brain network connectivity metrics. RS-BOLD data were resampled to generate within subject BOLD datasets with incrementally longer TR (2, 4 and 6 seconds). PASL time-series data were extracted to generate within subject datasets with TR of 3 or 6 seconds by using the post-processed full time series PASL images (TR=3 seconds) and tagged+untagged images (TR=6 seconds). As such, 5 datasets (3 RS-BOLD and 2 PASL) were generated for each subject. A binarized adjacency matrix for imaging time series across subjects was generated at a network cost of 0.3 from which common graph theory network metrics were computed.
Results: ANOVA revealed no statistically significant effect of TR for RS-BOLD or PASL data on the magnitude of computed small-worldness [F(4,149)=2.657, p>.01] (Figure 1), global efficiency [F(4,149)=2.623, p>.01] (Figure 2), or local efficiency [F(4,149)== 2.056, p>.01] (Figure 3).
FIG. 1.
FIG. 2.
FIG. 3.
Conclusion: Accurate graph metrics of brain network connectivity can be computed with a variety of different time-series data generated from standard clinical PASL perfusion MRI at TR of 3 and 6, opening the door for implementation of these analysis techniques on existing clinical PASL databases to investigate diseases of the brain. Translation and broad clinical implementation of graph theoretical analysis techniques to clinical PASL perfusion MRI data may lead to the discovery of novel functional imaging biomarkers that improve the ability to diagnose disease and predict outcomes associated with central nervous system dysfunction.
Frequency domains of resting state default mode network activity in schizophrenia
Introduction: Recent studies have demonstrated altered low-frequency BOLD signal fluctuations during resting state (RS) in schizophrenia. It is unclear whether this alteration relates to DMN dysfunction. Here, we analysed the power for different frequency bands from DMN time series extracted using a probabilistic independent component analysis (pICA) of fMRI data, in order to test the hypothesis of altered frequency power in the DMN under RS conditions.
Methods: We obtained RS fMRI series (3T, 3×3×3 mm resolution, 45 slices, TR 2.55 s, 210 volumes) in 25 schizophrenia patients (mean age 30a±7.3), on stable antipsychotic medication and 25 matched healthy controls (30.3a±8.6). Subjects were asked to lie in the scanner keeping eyes closed with no further specific instructions. Data were pre-processed using SPM5 (motion correction, co-registration, normalization and smoothing). Band pass (0.009–0.18Hz) frequency filters were applied. We applied FSL MELODIC (pICA) yielding 30 IC, and an automated routine to select for each subject the component matching the anatomical DMN definition.We then analysed the frequency domains for this extracted DMN, estimating the power of a signal at different frequencies. The time course associated with each individual's DMN component was transformed from the time domain to the frequency domain using Welch's method. For this purpose we used pwelch, a Matlab signal processing toolbox.
Results: We found a significant diagnosis x frequency interaction (F(11, 38)=2.484, p=0.019). Comparison of the frequency bins between groups showed that the schizophrenia group exhibited significantly higher spectral power than controls at frequencies around 0.0784 Hz (F=5.938, p=0.019) and 0.1725 Hz (F=5.463, p=0.024). The power distribution in the frequency domain of the DMN component for the two groups is shown in figure 1.
Discussion: Our results demonstrate that at least a part of the low-frequency alterations found in schizophrenia can be specifically attributed to DMN dysfunction, unrelated to cardiac or breathing artefacts, and task-driven cognitive activity. While the power differences in our results appeared to be rather specific to particular frequency bands, the role of these remains unclear and will need further investigations.
University of Liège, Coma Science Group, Liège, Belgium
University of Liège, Cyclotron Research Center, Liège, Belgium
EEG-fMRI evidence for a thalamic generator for fast but not slow rhythms during propofol sedation
Objectives: Propofol-induced frontal fast rhythms were suggested to be involved in loss of consciousness. Computational modeling proposed that an increase of thalamo-cortical coherence could be at the origin of this phenomenon. However, the precise mechanisms of propofol-induced hyper synchrony in the fast rhythms remain unknown. We therefore investigated and compared the relationship between electroencephalography (EEG) spectral power in different frequency bands and regional BOLD activity during wakefulness and propofol-induced sedation.
Methods: EEG and functional magnetic resonance imaging (fMRI) data were simultaneously recorded from 11 healthy participants. The convolved time course of spectral power in 5 different frequency bands (delta, theta, alpha, beta & gamma) over electrodes O1 and O2 was used as regressor in the fMRI analysis to search for brain regions where blood oxygenation level dependent (BOLD) signal was correlated to variations in frequency power. A repeated measures general linear model tested for significant group effects within and between each condition.
Results: During resting wakefulness there was a significant (p<0.05) negative correlation between alpha power and BOLD activity in thalamus, paracentral lobule and posterior parietal cortex and a trend in prefrontal cortex (p=0.055). During propofol-induced sedation, a significant paradoxical positive correlation was found between thalamic activity and within-session EEG power fluctuations in alpha to gamma frequency bands. This paradoxical thalamic involvement reversed during the following recovery state. In contrast, no thalamic involvement was identified for delta and theta frequencies during propofol sedation. A significant interaction was found for the involvement of thalamus in the generation of propofol-induced fast versus slow EEG rhythms.
Conclusion: Our findings are the first direct demonstration of a thalamic involvement in the generation of propofol-induced fast rhythms in humans; in accordance with previous modeling work. The paradoxical thalamic excitation observed in propofol induced sedation could severely impair normal thalamo-cortical interactions and might play a role in the loss of responsiveness to environment and the decreased level of consciousness observed in this state.
Applications: Psychiatry
PattersonJ.C.1LedbetterC.1
LSU Health - Shreveport, Psychiatry, Shreveport, United States
Resting State Activity within Cognitive Domains of the Cerebellum
Objectives: The function of the cerebellum has traditionally been regarded as relating only to motor learning and coordination. In humans a concomitant expansion of the cerebellum and the cerebral cortex is evident. It has been proposed that with this structural expansion the role of the human cerebellum extended to include coordination of the cognitive processes of this neocortex as well. The objective of this work was to probe for resting state correlations between proposed cognitive domains of the cerebellum and known cognitive domains of the cerebral cortex.
Methods: BOLD dependent fMRI data was collected with a 1.5T MR scanner on 30 normal subjects during working memory (WM) and resting states. For each subject activations associated with the WM task were identified. Resting state correlations between activated cerebellar regions of interest (ROI) and the rest of the brain were assessed in AFNI using a seed-voxel based correlation analysis. Correlation maps were normalized to Z-maps and analyzed at the group level.
Results: During both the WM and the resting states, correlation between the measured BOLD signal within cerebellar ROI's and cerebral cognitive domains was seen (representative results in Figure 1). For one seed placed in lobe VI of the left cerebellar hemisphere, resting state correlations were seen in parietal (Zmax=7.4), temporal (Zmax=7.7) and frontal (Zmax=8) cortex, as well as in the left dentate nucleus (Zmax=8.4), the adjacent lobe in the left cerebellar hemisphere (Zmax=8.8), and the contralateral right cerebellar hemisphere (Zmax=8.4). For one seed within Crus I of lobe VIIA of the left cerebellar hemisphere, correlation to resting state activity was seen within the thalamus (Zmax=6.8), parietal (Zmax=9.2), temporal (Zmax=7.8) and frontal lobes (Zmax=8.6) and with the left dentate nucleus (Zmax=7.1), adjacent lobe (Zmax=10.4) and contralateral cerebellum (Zmax=8.6).
Correlated Activity between Cognitive Domains of the Cerebral Cortex and the Cerebellum during the Resting State
Conclusion: The existence of cerebrocerebellar loop connections linking discrete cognitive domains of the cerebral cortex with discrete regions of the cerebellum is supported by the demonstration of correlated BOLD dependent activity not only during the working memory state but also during the resting state. Of additional significance is the demonstration that the cerebellum is active and involved in cognition even during rest.
Methods and Acquisition
MuschelliJ.1NebelM.2MostofskyS.2CB.1
Johns Hopkins School of Public Health, Biostatistics, Baltimore, United States
Kennedy Krieger Institute, Baltimore, United States
Effects of Preprocessing on Motion-Induced Artifacts in Resting State fMRI
Objective: Several recent publications have noted that subtle motion-induced artifacts may systematically change resting state functional connectivity (RS-fc) data, making it crucial to identify processing methods that can effectively account for motion in statistical analysis (Power et al. 2012, Van Dijk et al. 2011, Satterthwaite et al. 2012). Using the data quality metrics proposed by Power et al: framewise displacement (FD) and Differentiated Variance (DVARS), we examined the influence of different RS-fc processing methods on motion-induced artifacts.
Methods: RS data from Power et al (cohort 1 N=22) and an independent Kennedy Krieger Institute (KKI) sample of 76 typically developing children were analyzed. Standard preprocessing included slice-timing adjustment, motion realignment, and spatial normalization. Two variations of FC processing were then used: 1) the PCA method (M1) and 2) the mean signal method (M2) used by Power et al. M1 and M2 differed in two ways: 1) identification of nuisance covariates from white matter (WM) and CSF and 2) the order in which FC processing steps were performed. For M1, the CompCor approach (Behzadi et al., 2007) was used to identify the principal components of WM and CSF nuisance covariates at the beginning of FC processing. For M2, mean signals from WM and CSF were regressed from the data at the end of FC processing. DVARS was calculated before and after FC processing, and the correlation between FD and DVARS across methods was compared. A reduction in this correlation was used to measure the magnitude of the effect of motion on BOLD signal.
Results: Similar to Power et al, we observed a relationship between FD and DVARS prior to FC processing in both cohorts (Fig 1). Following FC processing, the FD/DVARS correlation was reduced to a greater extent using M1 in both cohorts (Power cohort: M1 r=.25, M2 r=.35, difference p=.03, KKI cohort: M1 r=-.073, M2 r=.30, p<0.001).
Relationship between frame-by-frame changes in head position and mean BOLD signal change. FD (top panel) and DVARS (middle panel) are shown for a single participant. In the middle panel, DVARS Pre-FC Processing (red line) most closely corresponds with FD; this is as expected because realignment parameters have not yet been regressed from the data. The bottom panel is a scaled version of the middle panel highlighting differences between Post M1- and Post M2-DVARS. The same motion estimates were regressed from the data under both methods. The boxes in the bottom panel indicate time points during which the M2 method (mean signal, green line) still showed high correspondence with FD while the M1 method (PCA, blue line) did not.
Conclusion: FC processing choices can differentially compensate for motion-induced artifacts in the BOLD signal. The PCA method, which has been shown to effectively remove physiologic noise fluctuations, also appears to be particularly useful in accounting for the effect of motion.
Applications: Psychiatry
PattersonJ.C.1MenardM.1LedbetterC.1
LSU Health - Shreveport, Psychiatry, Shreveport, United States
Increased Cerebellar Metabolic Activity in Mild Cognitive Impairment and Alzheimer's Disease in the Resting State
Objectives: Evaluation of [18F]-fluorodeoxyglucose positron emission tomography (FDG-PET) brain images using Statistical Parametric Mapping (SPM8) demonstrates early detection of changes consistent with Alzheimer's disease (AD) in patients with Mild Cognitive Impairment (MCI)[1]. During the evaluation of patients with AD, usually only metabolic deficits are examined. Rarely do examinations of MCI/AD using PET look atincreasedactivity. The cerebellum is involved in cognition and active during rest, but few studies of AD with PET report on cerebellar activity - increased or decreased. Changes in brain cerebellar activity may be present and related to disease state, thus helpful to better understand AD.
Methods: This research was conducted in accordance with the guidelines and approval of the Institutional Review Board. Subjects were recruited with an emphasis on MCI or those in the at-risk cognitively normal state. All subjects signed informed consent before enrollment. 31 subjects were examined (15 male, age 71±8). Diagnoses: No deficits: n=13, MCI n=9, mild AD n=4, moderate AD n=5. A normal control database of (n=30) was used for comparison. Single subject scans were compared to the control group using SPM8. Age was factored out. Default global scaling in SPM8 can artificially increase image intensity, so a scalefactor derived from white matter was used. An SPM(T) map was generated and regressed against a covariate representing diagnosis (0 for no Dx, 1 for MCI, 2 for mild AD, 3 for moderate AD). Threshold: p=0.05. Functional connectivity evaluation was done on cerebellar regions and the strongest foci of decreased activity from the second level analyses.
Results: Only cerebellum results are reported. We found significant increased activity in multiple regions of the cerebellum (see Table 1 and Figure 1), including regions associated with the default mode network. Figure 1a shows regions of decreased activity that decreased with increasing disease severity. Fig1b shows regions of cerebellar increased activity that increased with increasing severity of AD.
FIG. 1.
FIG. 2.
Conclusion: We demonstrate increased cerebellar activity during rest that appears to be increasing in activity as AD increases in severity. This may be related to compensatory activity in an attempt to improve degrading cognition due to advancing AD.
References
PattersonJC, LilienDL, TakalkarA, PinkstonJB. 2011. Early Detection of Brain Pathology Consistent with AD Using Objective Evaluation of FDG-PET Scans, International Journal of Alzheimer's. Disease, 2011:9, 10.4061/2011/946590.
Methods and Acquisition
WangZ.1
University of Pennsylvania, Department of Psychiatry, Philadelphia, United States
Stable and Self-Organized Entropy in the Resting Brain
Introduction: Entropy of the world increases as time progresses [1–3], so living organisms have to strive for low entropy. Human brain is highly functionally self-organized [4] as demonstrated by the numerous functional neuroimaging studies even without overt tasks [5]. Maintaining entropy needs energy consumption, and the most energy costly spontaneous brain activity which can be measured by resting fMRI (rsfMRI) might represent a way to sustain entropy. This study aimed to assess brain entropy (BEN) using a large rsfMRI dataset from the 1000 FCP [6] to address: 1. Does BEN increase with aging? Does it differ by genders? How is it spatially distributed?
Methods: 1049 subjects were identified and processed using scripts provided by FCP without global signal regression. Entropy was calculated at each voxel using the negentropy function proposed in [7]. The BEN map was divided by the whole brain mean and subtracted by 1 to get a relative BEN (rBEN) map. Both BEN and rBEN maps were registered to the MNI space using FNIRT of FSL. A one-sample t-test was performed on the rBEN maps. Age and gender effects were assessed using simple regression on BEN maps. rBEN maps were concatenated across subjects and segmented using the spectral clustering method[8]. The silhouette curve[9] was calculated to define the optimal cluster number.
Results: All abbreviations are defined in Fig 4. Fig. 1 shows higher than average BEN (HBEN) in OFC, putamen, MC, and VIS, indicating a less predictable visual-sensorimotor activity in the resting brain. Lower than average BEN (LBEN) was found in the default mode network (DMN) (PFC, ACC, insula, precuneus and PA), ITC, and WM. Resting self-organization has been well defined in DMN [5], but has not been shown in ITC and WM. No regional or global age and gender effects were found. Fig 2 shows that global BEN stays with age. 14 functionally localized BEN clusters were identified and shown in Fig. 3, including 3 HBEN sub-clusters (5, 8, 13 in Fig 3), and 4 LBEN sub-clusters (#7, 9, 11, 12), and 7 other BEN clusters located in specific functional regions. All clusters involve areas in both hemispheres.
Mean BEN map A), and standard deviation B), C) is the HBEN (hot spots) and LBEN (green blobs) network defined using the relative BEN maps with a threshold of p<0.05 (corrected).
Relation of whole brain entropy versus age. a.u. means arbitrary unit.
FIG. 3.
FIG. 4.
Conclusion: We showed the first evidence of BEN mapping results. We showed that resting BEN is independent of age and gender, and spatially divided into HBEN and LBEN, as well as a series of functionally localized sub-clusters.
Applications: Psychiatry
McCabeC.1ParkR.1CowdreyF.1
Oxford University, Psychiatry, Oxford, United Kingdom
Increased resting state functional connectivity in the default mode network in recovered anorexia nervosa
Question: Functional brain imaging studies have shown abnormal neural activity in individuals recovered from anorexia nervosa during both cognitive and emotional task paradigms. It has been suggested that this abnormal activity which persists into recovery might underpin the neurobiology of the disorder and constitute a neural biomarker for anorexia nervosa. However, no study to date has assessed functional changes in neural networks in the absence of task-induced activity in those recovered from anorexia nervosa. Therefore, the aim of this study was to investigate whole brain resting state functional connectivity in non-medicated women recovered from anorexia nervosa. Methods: Functional magnetic resonance imaging scans were obtained from 16 non-medicated participants recovered from anorexia nervosa and 15 healthy control participants. Independent component analysis revealed eight functionally relevant networks. Results: Dual regression analysis revealed increased temporal correlation (coherence) in the default mode network which is thought to be involved in self- referential processing. Specifically, compared to healthy control participants the recovered anorexia nervosa group showed increased temporal coherence in the precuneus and the dorsolateral prefrontal cortex / inferior frontal gyrus (regions implicated in self- monitoring and cognitive control). There were no between group differences in gray matter. Conclusions: The findings support the view that neural network dysfunction underlying self- referential processing and cognitive control might be a vulnerability marker for the development of anorexia nervosa.
Sagittal, coronal and axial slices for eight RSNs, overlaid onto a standard EPI functional template.
Average DMN maps are overlaid onto the MNI-152 standard brain. Blue: Recovered AN group average DMN map (Z>5) Green:Healthy control group average DMN map (Z>5). Red: Group differences in functional connectivity in the DMN: Recovered AN>Healthy controls, corrected (p
Box plots show an increase in the amplitude of the BOLD fluctuation in the DMN, in the recovered anorexia participants compared to the healthy control participants in the (A) precuneus (8,-60, 24)and, (B) DLPFC/IFG (44, 6, 26).
Methods and Acquisition
VuA.12*ChenL.12*ChangA.12FeinbergD.12
Advanced MRI Technologies, Sebastopol, CA, United States
University of California, Helen Wills Neuroscience Institute, Berkeley, CA, United States
Highly Accelerated EPI for BOLD fMRI
Introduction: Recent multiplexed EPI sequences combine m multiband (MB) and n simultaneous image refocusing (SIR) rf pulses, to acquire N=mxn images in one echo train for faster sampling of resting state and task fMRI [1–3]. It remains unclear what values of m, n, and N are optimal since higher SIR and MB result in lower SNR per time and the BOLD response is sluggish. Here we demonstrate unprecedented EPI accelerations, up to N=56, and determine the optimal combination of m and n by measuring temporal SNR (tSNR) and movie-frame classification accuracy in fMRI.
Methods: Subjects were scanned at 3T with a 32 channel coil, 2.5 mm isotropic voxels, TE∼35 ms, and whole brain coverage. The effects of m and n (N=6-56) on tSNR were evaluated on resting subjects while holding all other scan parameters constant (TR=500 ms). Seven subjects fixated while watching a 36 s movie 9 times per combination of m and n at near min TR. Information content of BOLD signals was measured using leave-one-repeat-out classification. Figure 1. Pulse sequence diagrams. Top) Standard EPI. Bottom) Multiplexed EPI with SIR n=2.
FIG. 1.
Results: Figure 2. Temporal mean of EPI images N=6-56. Image quality degrades as m and n increase. Figure 3. tSNR for N=6-56. Top) tSNR vs MB. SIR 1,2, and 3 are in blue, green, and red bars, respectively. Higher MB, m, significantly reduces tSNR (r=− 0.82, p<0.001). Higher SIR, n, also significantly reduces tSNR but only at lower MB (r=−0.78, p<0.02 for MB<12; r=−0.20, p=0.61 for MB >= 12). Bottom left) tSNR vs N. For a given N, SIR 2 and MB m had significantly (∼25%, p<0.001) higher tSNR than MB alone (SIR 1 and MB 2 m). Bottom right) tSNR at very high N. SIR 2 and 3 allow N up to 56 with tSNR ∼ 15. Figure 4. Timepoints classified for N=1-16. At high accelerations (N>8), SIR 2 allows significantly more timepoints to be classified than with MB alone, SIR 1 ( 14;p<0.05).
FIG. 2.
FIG. 3.
FIG. 4.
Conclusions: At high accelerations, multiplexed EPI with SIR 2 (vs MB alone) may be optimal for BOLD fMRI. The max number of classifiable timepoints occurred between N=8–16 (TR=300–600 ms) suggesting that highly accelerated EPI is optimal for single trial classification. This advancement enables new neuroscience questions to be evaluated using fMRI.
LebedevA.1ShmelevaL.2
Stavanger University Hospital, Centre for Age-Related Medicine, Stavanger, Norway
St-Petersburg State I.P.Pavlov Medical University, Psychiatry, Saint - Petersburg, Russian Federation
Default mode network in left-side temporal lobe epilepsy patients with comorbid affective disorders.
Affective disorders are common in patients with temporal epilepsy (TLE), especially cases of left-sided epileptic focus localization.
Aim: the primary aim was to identify features of default mode network (DMN) in TLE patients with comorbid non-psychotic depressive and anxiety disorders.
Methods: There were two groups of participants in this study. The first group contained 12 TLE patients (n=12), 12 healthy controls were included in the second group. Inclusion criteria for the first group were the diagnosis of left-side TLE, confirmed clinically and using EEG. Exclusion criteria for both groups were actual organic brain pathology, severe cognitive impairment and relevant acute or chronic somatic illness.
All the participants underwent comprehensive psychiatric examination. Hamilton Anxiety Rating Scale (HAM-A), Montgomery—Asberg Depression Rating Scale, (MADRS) and self-questionary scales - BDI and Hospital Anxiety and Depression Scale (HADS) were additionally used to assess psychiatric symptoms.
A comprehensive neuropsychological evaluation was administered and included semantic memory tests, assessment of face and geometric shapes recognition, object naming and time recognition.
fMRI scans were acquired on 1.5 Tesla Exelerat Vantage Toshiba MRI machine during 9-min scanning procedure, when no specific instructions except to keep eyes closed and hold still were given. Independent component analysis was used to isolate DMN. The resulted maps were compared in groups using threshold of p<0.001.
Results: All TLE patients had mild and moderate levels of anxiety and depression. Mean [±SD] value for HAMA was 18 [±3,8], for MADRS=12 [±2,5]. In healthy control group mean values for all scales were normal (HAMA=6 [±0,9], MADRS=3 [±0,4]). No significant differences in cognitive tests were observed in TLE group compared to healthy controls.
Default mode network (15 component)
Cerebellar, right parahippocampal and insular functional connectivity were significantly greater in the TLE group compared to healthy controls (Figure 2).
Strengthening functional connectivity in left-side TLE path
Conclusions: DMN is impaired in TLE patients. The affected structures are documented to play role in emotions and affective disorders. Therefore, the results suggest a possible contribution of these abnormalities in development of affective disorders in the left-side TLE patients.
Methods and Acquisition
HiltunenT.12KorhonenV.12MyllyläT.2TervonenO.1KiviniemiV.1
University Hospital, Oulu, Finland, 2University, Oulu, Finland
QUAD-scan Multimodal Scanning Environment
Objectives: Our goal was to assess the interactions of sources of blood oxygen level-dependent (BOLD) signal low frequency fluctuations. Therefore we developed a multimodal scanning environment where we can measure simultaneously human brain's electrical activity, oxygenation/metabolic oscillations and vasomotor waves. We combined functional magnetic resonance imaging (fMRI) with MRI compatible electroencephalography (EEG), near-infrared spectroscopy (NIRS) and non-invasive blood pressure (NIBP) measurements.
Methods: Resting state fMRI data was collected with Siemens Skyra 3 T scanner with a twenty channel receive coil (TR 1620 ms). For BOLD signal we calculated independent component analysis (ICA) with Melodic (40 components).
EEG was recorded with a 32-channel BrainAmp system. The on-line band pass was from DC to 250 Hz. Gradient and ballistocardiographic artefacts were removed with Brain Vision Analyzer.
Raw NIRS data were collected by NIRS probes with three different wavelengths (660, 830 and 905 nm). A fibre pair was attached to the subject's forehead and the source-detection separation was 30 mm. Raw NIRS time courses were converted into the concentration changes of oxyhemoglobin (Δ[HbO2]) and deoxyhemoglobin (Δ[Hb]) according to the modified Beer-Lambert law. EEG, deoxy- and oxy-hemoglobin signals were downsampled to match the BOLD signal frequency.
The raw NIBP data were recorded by two fibre optic accelerometer sensors placed over the chest and carotid artery measuring pulse wave velocity in arterial blood. The device uses the obtained result to estimate diastolic blood pressure.
Results: 10 s of simultaneously measured EEG, NIBP and NIRS signals during fMRI are shown in Fig 1.
FIG. 1.
Fig 2 presents one independent component showing default mode network from BOLD data.
FIG. 2.
Fig 3 shows measured low frequency fluctuations during the whole fMRI session. Top signal is timecourse of IC shown in Fig 2. Below that there is downsampled EEG from channel Fz. After that there is the estimated diastolic blood pressure signal. The lowest two signals represent downsampled deoxy- and oxy-hemoglobin signals.
FIG. 3.
Conclusions: We show that it's possible to measure simultaneously fMRI, EEG, NIRS and NIBP signals. This multimodal setup enables us to study simultaneously the possible sources of low frequency oscillations in brain.
University of Rostock, Department of Aging Science and Humanities, Faculty of Interdisciplinary, Roctock, Germany
University of Rostock, Department of Psychiatry, Roctock, Germany
German Center for Neurodegenerative Diseases, Rostock, Germany
University of Rostock, Institute for Biostatistics and Informatics in Medicine and Ageing Research – IBIMA, Rostock, Germany
University of Rostock, Institute for Diagnostic and Intervention Radiology, Rostock, Germany
Disrupted structural connectivity of the default mode network in Alzheimer's disease
Functional connectivity within the default mode network (DMN) is a sensitive marker of cortical disconnection in Alzheimer's disease (AD). We combined resting-state functional magnetic resonance imaging (rs-fMRI) and diffusion tensor imaging (DTI) to reveal differences in structural connectivity of the DMN between 28 patients with AD and 28 healthy controls (HC). Functional connectivity of the DMN was analyzed using independent component analysis. Structural connectivity was determined using probabilistic fiber tracking and scalar diffusion indices of fiber tract integrity.
Reduced functional connectivity of the DMN in AD was accompanied by a reduction in microstructural integrity of the fiber tracts connecting the posterior cingultate/precuneus/cuneus node to the remaining key nodes of the DMN, including posterior parietal, medial frontal, and medial temporal cortices. However, no linear associations were found between measures of structural and functional connectivity.
Combined rs-fMRI and DTI-based tractography studies may enhance the sensitivity to detect network changes in AD and further our understanding of the complex interactions between structural and functional connectivity in healthy and pathological aging.
Methods and Acquisition
LeeR.1
Princeton University, Neuroscience Institute, Princeton, United States
The default-mode network modulation and coupling during social interaction observed in dyadic fMRI
Introduction: Dyadic fMRI (dfMRI) (1) can directly quantify the social interaction at the brain network level. The objective of this study is to quantify the eye-contact induced default-mode network (DMN) (2) modulation and coupling, as well as the Granger causality of the coupling during social interaction.
Methods: The dfMRI hardware, protocols, and the eye-contact experiment design, are detailed in the Ref. (1). The dyadic data is first preprocessed with in-house Matlab codes. Then using ICA (FSL's MELODIC) generates a set of independent components (IC). The ICs containing DMN are selected as masks to extract the time series from four DMN nodes: PCC, MPFC, left and right IPL. The correlations between the four nodes are calculated; and their correlation differences are tested by Steiger's Z1 and Z2 (3). The Granger causality is calculated using BSMART (4).
Results: 20 pairs of subjects were studied. Three of the major findings regarding DMN are: (i) Any two subjects' DMNs are always independent, as in Fig. 1A. The DMN of one can be coupled with other's non-DMN networks, but no DMN-DMN coupling was observed. (ii) Eye contact causes left-right asymmetry in a subset of DMN (dosal PCC, ventral MPFC, left and right IPL). Using Steiger's Z1 to test both differences in correlation r(dPCC, lIPL) vs. r(dPCC, rIPL) and in correlation r(vMPFC, lIPL) vs. r(vMPFC, rIPL), the average asymmetry scale (Z1) due to eye contact is shown in Fig. 1B. (iii) If Steiger's Z2 is used to describe the DMN modulations due to eye contact, and the coupling between the DMN of one brain and the other brain is defined as the sum of square of all crossing brain correlations, then the coupling is a function of both Z1 and Z2. A romantic couple's dynamic Granger causality of DMN is shown in Fig. 2.
FIG. 1.
FIG. 2.
Conclusion: Certain aspects of social interaction can be directly quantified by measuring asymmetry, modulation and coupling of the DMN.
References
Leeet al. Magnetic Resonance in Medicine. 2011, 10.1002/mrm.23313a-1830a-1832
Buckneret al. Ann N Y Acad Sci, 2008; 1124:1–38a-1831Steiger, Psych, Bulletin. 1980; 87,2:245a-1833Cuiet al. Neural Networks, 2008; 21:1094–1104.a-1834
Applications: Psychiatry
LisoA.1SikogluE.1FrazierJ.1KingJ.1KennedyD.1MooreC.1
UMass Medical School, Psychiatry, Worcester, United States
Neurodevelopment in Healthy Children and Adolescents: A Resting-State Functional Connectivity Study
Objective: In this study, we employed resting-state Functional Connectivity (rs-FC), to characterize neuronal interaction among brain regions in the absence of a task, cross-sectionally in healthy youth. Our goal was to provide a better understanding of how the brain develops across the early stages of the life span and to form a basis for the investigation of various neurological and psychiatric disorders by providing typical neurodevelopmental data from late childhood to adolescence.
Methods: 29 healthy subjects (14 male; ages 5–19; 13.86±3.76 years) were scanned on a 3T Philips MR system using EPI sequences (TE=30 msec, TR=2500 msec, slice thickness:3 mm, 50 slices). Seed based rs-FC analysis (seeds at anterior cingulate cortex (ACC) and dorsolateral prefrontal cortex (DLPFC)) was carried using SPM8 and DPARSFv2.0. The connectivity patterns among young and older subgroups were compared through two-sample t-test.
Results: Areas of interest that had significantly more connectivity with ACC were Superior and Medial Frontal, OrbitoFrontal, Cingulate and Middle Temporal Gyri for the older group and Occipital Lobe, Precuneus, Fusiform Gyrus for the younger group. Connectivity with DLPFC was prominent with Superior Frontal and OrbitoFrontal Regions as well as Middle Frontal, Inferior Temporal and Middle Temporal Gyri for the older group and with the Cerebellum for the younger group.
Conclusion: Our results support the previous findings that brain maturation progresses through a pattern extending from posterior towards anterior of cortical and subcortical structures. Areas involved in executive functions such as ACC or DLPFC present rewiring in their connections from regions underlying sensory and perceptual functions to higher functioning areas within the prefrontal cortex and temporal cortex, as one transitions from early childhood into adolescence. These findings form preliminary database characterizing the typical neurodevelopment in terms of resting-state functional connections and may serve for the future investigation of neurodevelopmental disorders.
Acknowledgement: National Institute of Mental Health (R01MH073998 - CMM) and National Institute on Drug Abuse (RC2DA029475 - DK and JAF) and Swiss National Science Foundation (PBGEP3_139835 - AAL).
Methods and Acquisition
SkudlarskiP.12PearlsonG.12
Hartford Hospital, ONRC/IOL, Hartford, United States
Yale University School of Medicine, Department of Psychiatry, New Haven, United States
Functional Anatomical Connectivity Coherence Can Effectively Measure Clinically Relevant Changes in Brain Connectivity
The Functional Anatomical Connectivity Coherence (FACC) is a measure of spatial coherence between two MRI driven connectivity matrices. The Functional Connectivity is measured as the strength of temporal correlation in the resting state BOLD signal. The Anatomical Connectivity is calculated by integrating number and strength of direct and indirect path that can connect those regions with fiber tracts detected by DTI tractography.
Both methods of measuring connectivity are use different brain tissue, DTI in white matter and BOLD based resting state correlation in gray matter, they do not overlap well and whole brain FACC does not produce clinically or behaviorally relevant measures. To optimize FACC definition we used 565 white matter regions defined in the white matter skeleton obtained from Tract based Tractography (TBSS). Resting state correlations were calculated in grey matter regions surrounding the skeleton. Instead of whole brain, only the network maximizing the spatial coherence between both connectivity measurements was used. This network was defined by first calculating connectivity maps seeded in individual ROIs and later using ROIs that maximized this correlation to define component of the brain that maximizes FACC. It was later optimized in an iterative procedure. This network was later used to calculate FACC for individual subjects that could be correlated with clinical and behavioral measurements.
Two separate large studies have been analyzed using this novel technique. In both cases the network maximizing the FACC was found to lie within the broadly defined Default Mode Network. One study, presented in in abstract 48, showed that FACC strongly differentiates bipolar patients from schizophrenia patients and both groups from healthy controls. Another study, included 100 elderly subjects that were scanned 3 times in two year intervals. Here FACC decreases with age, and shows significant negative correlation with measure of cognitive functions (it is lower for subjects with less compromised cognition). This finding supports the hypothesis that with decrease of white matter connectivity the reorganization of functional connectivity and resulting decrease in FACC allows brain to preserve functions. The procedure of defining brain network maximizing FACC can be used in population for definition of best predictor, or in individual subjects to observe individual spatial changes in coherence between anatomical and functional connectivity.
Baylor College of Medicine, Psychiatry, Houston, United States
The Methodist Hospital, Neurology, Houston, United States
Functional brain networks are affected by tobacco abstinence in humans: implications for tobacco addiction
Tobacco addiction is a major public health concern in the world. Current anti-tobacco therapies are far from satisfactory, mainly due to the lack of knowledge on the circuits mediating tobacco addiction and how these circuits are modified by acute and long term nicotine use. To address this question, we imaged the brain of smokers during the resting state for 5 minutes. Subjects were instructed to stay as still as possible in the scanner (eyes open or closed), while a fixation ÄäúxÄäù was presented in the field of view. The Resting State Functional Connectivity (RSFC) is a relatively new technique to study human brain function in which the functional connectivity among different brain areas is studied. RSFC has shown striking coincidence with networks necessary for certain types of behaviors. Besides a hierarchical, whole brain data-driven RSFC, we measured expired CO (a measure of tobacco use in the previous few hours) and assessed responses to a series of questionnaires such as the Fagerstr√∂m Test for Nicotine Dependence. We have analyzed a sample of 40 smokers in both sated and abstinent conditions (as well as 40 matched controls) and found that the percentage of representation of anatomical brain regions in functional brain networks is affected by abstinence. Several cortical areas are affected, which suggests that when habitual smokers abstain from smoking, several areas of the brain change their connectivity properties, presumably to accommodate to withdrawal of nicotine. We have also included RSFC analysis of 16 subjects who appeared twice, so that we could assess the stability of our methods.