




Abstract
Subjective memory complaints (SMC) are common among elderly. Although subtle changes in memory functioning can hardly be determined using neuropsychological evaluation, neuroimaging studies indicate regionally smaller brain structures in elderly with SMC. Imaging of resting-state functional connectivity is sensitive to detect changes in neurodegenerative diseases, but is currently underexplored in SMC. Here, we investigate resting-state functional connectivity and brain structure in SMC. We analyzed magnetic resonance imaging data of 25 elderly with SMC and 29 age-matched controls (mean age of 71 years). Voxel-based morphometry and volume measurements of subcortical structures were employed on the structural scans using FSL. The dual regression method was used to analyze voxel-wise functional connectivity in relation to eight well-characterized resting-state networks. Group differences were studied with two-sample t-tests (p<0.05, Family-Wise Error corrected). In addition to gray matter volume reductions (hippocampus, anterior cingulate cortex (ACC), medial prefrontal cortex, cuneus, precuneus, and precentral gyrus), elderly with SMC showed increased functional connectivity in the default mode network (hippocampus, thalamus, posterior cingulate cortex (PCC), cuneus, precuneus, and superior temporal gyrus) and the medial visual network (ACC, PCC, cuneus, and precuneus). This study is the first which demonstrates that, in addition to smaller regional brain volumes, increases in functional connectivity are present in elderly with SMC. This suggests that self-reported SMC is a reflection of objective alterations in brain function. Furthermore, our results indicate that functional imaging, in addition to structural imaging, can be a useful tool to objectively determine a difference in brain integrity in SMC.
Introduction
Subjective memory complaints (SMC) refer to a subjectively noticeable decline from previous levels of memory functioning (Vestberg et al., 2010). These subjective complaints are common among elderly (Mitchell, 2008a), but can hardly be confirmed by a neuropsychological evaluation (Hejl et al., 2002). The importance of SMC has been emphasized in both clinical and research-based investigations. Longitudinal population-based studies reported an association with depression (Montejo et al., 2011), future cognitive decline (Dik et al., 2001), and dementia (Jessen et al., 2010). Nevertheless, it is a subject of debate whether SMC is a clinically relevant predictor for future cognitive decline and dementia (Glodzik-Sobanska et al., 2007; Mitchell, 2008b).
Neuroimaging studies in elderly with SMC showed smaller brain structures (Jessen et al., 2006; Saykin et al., 2006; Stewart et al., 2011; Striepens et al., 2010; Van der Flier et al., 2004) and increased brain activation during cognitive tasks (Rodda et al., 2009, 2011). Despite the importance of studying functional connectivity to understand brain function (Mesulam, 1998), and its relevance in the context of neurodegenerative diseases (Pievani et al., 2011), functional connectivity in elderly with SMC is currently underexplored.
Here, we investigate whole brain gray matter volumes and resting-state functional connectivity in elderly with SMC. This is a cross-sectional study in a heterogeneous group of elderly with subjective complaints about their memory. Clinically, these complaints are not confirmed by a neuropsychological evaluation. Elderly with SMC are compared with an age-matched control group of healthy elderly from the general population.
It is hypothesized that imaging of functional brain connectivity is sensitive to detect early brain changes. Evidence for this is provided by studies showing differences in functional connectivity in aging, mild cognitive impairment, and dementia (Hafkemeijer et al., 2012), and moreover in subjects at risk for developing neurodegenerative diseases, either in terms of having amyloid plaques (Hedden et al., 2009; Sheline et al., 2010b) or carrying a genetic mutation (Filippini et al., 2009), even when evidence for brain atrophy or cognitive decline is absent. While mostly decreased functional connectivity in the default mode network has been found in Alzheimer's disease (Greicius et al., 2004; Wang et al., 2006, 2007; Wu et al., 2011; Zhang et al., 2009, 2010; Zhou et al., 2010), mild cognitive impairment (Han et al., 2011; Petrella et al., 2011; Sorg et al., 2007), and subjects at risk for developing neurodegenerative diseases (Fleisher et al., 2009; Hedden et al., 2009; Sheline et al., 2010a, 2010b), some studies showed evidence for increased functional connectivity in Alzheimer's disease (Wang et al., 2006, 2007; Zhang et al., 2009, 2010) and in cognitively healthy subjects at genetic risk for developing dementia (Dennis et al., 2010; Filippini et al., 2009; Fleisher et al., 2009; Westlye et al., 2011).
Based on neuroimaging studies in elderly with SMC (Jessen et al., 2006; Rodda et al., 2009, 2011; Saykin et al., 2006; Stewart et al., 2011; Striepens et al., 2010; Van der Flier et al., 2004) and studies in neurodegenerative diseases (Fox and Schott, 2004; Hafkemeijer et al., 2012), we expect to find differences in both brain structure and functional connectivity in the default mode network, which consists of the medial prefrontal cortex (mPFC), posterior (PCC) and anterior cingulate cortex (ACC), precuneus, parietal cortex, and the hippocampus (Buckner et al., 2008).
Materials and Methods
Participants
In this cross-sectional study, we included 25 subjects with SMC (mean age=71.4 years) and 29 control subjects (mean age=71.3 years). Elderly with self-reported SMC who visited the outpatient clinic for memory deficits of the geriatric department of the Leiden University Medical Center were recruited for this study. The elderly came to the memory clinic with memory complaints experienced by themselves and/or notified by people in their environment. All subjects were evaluated for cognitive complaints using a standardized dementia screening that included a detailed medical history, a general internal and neurological examination, laboratory tests, a neuropsychological evaluation, and an MRI of the brain.
Cognitive functioning was assessed using neuropsychological tests, standardized for the outpatient clinic of memory deficits of the geriatric department of the Leiden University Medical Center. The standardized neuropsychological test battery included a detailed interview, the Mini Mental State Examination, the Stroop Color-Naming test, the Cambridge Cognitive Examination - Revised, the Wechsler Memory Scale, and the Trail Making Test part A and B. Age-based norms and cutoff values that define the lower range of normal test scores were available for the neuropsychological tests (Folstein et al., 1975; Roth et al., 1986; Steinberg et al., 2005; Wechsler, 1945). Test results were interpreted by taking into account both educational and occupational levels. When the neuropsychologist needed additional information, the standardized neuropsychological test battery was extended with the Alzheimer's Disease Assessment Scale, the California Verbal Learning Test, and the Wechsler Adult Intelligence Scale - Revised.
Diagnoses were made in a multidisciplinary consensus meeting according to the National Institute of Neurological and Communicative Disorders and Stroke-Alzheimer's Disease and Related Disorders Association (Mckhann et al., 1984), the Diagnostic and Statistical Manual of Mental Disorders, fourth edition (American Psychiatric Association, 1994), and the criteria of Petersen (Petersen et al., 1997). The diagnosis of SMC was made by interpreting the complete screening profile with the education and past performance of the elderly taken into account. Elderly with SMC did not meet the criteria for mild cognitive impairment or dementia. Elderly with scores of above six on the Geriatric Depression Scale-15 (Sheikh and Yesavage, 1986) and/or cardiovascular diseases were excluded for this study.
Control subjects were recruited from the general population and were matched in terms of age, gender, and years of education (Table 1). Normal cognitive functioning was confirmed by a neuropsychological protocol that included the Mini Mental State Examination, the Stroop Color-Naming test, and the 15-Picture Learning Test. Control subjects did not demonstrate any memory complaints and did not show any abnormalities on neuropsychological evaluation.
Characteristics of Participants
SMC, subjective memory complaints; SD, standard deviation.
This study was performed in compliance with the Code of Ethics of the World Medical Association (Declaration of Helsinki). Furthermore, study approval was obtained by the Medical Ethical Committee of the Leiden University Medical Center.
Data acquisition
Imaging was performed on a Philips 3 Tesla Achieva MRI scanner using a standard whole-head coil for radiofrequency transmission and reception (Philips Medical Systems, Best, The Netherlands). For each subject, a three-dimensional (3D)-T1-weighted anatomical scan was acquired with the following scan parameters: TR=9.7 sec; TE=4.6 msec; flip angle=8
Data analysis
Before analysis, all MRI scans were submitted to a visual quality control check to ensure that no gross artifacts were present in the data. Data analysis was performed with Functional Magnetic Resonance Imaging of the Brain Software Library (FSL 4.1.8, Oxford, United Kingdom,
Voxel-based morphometry analysis
To highlight regions with differences in gray matter volume between elderly with SMC and control elderly, structural scans were analyzed with a voxel-based morphometric (VBM) analysis (Ashburner and Friston, 2000). First, the structural images were brain extracted (Smith, 2002) and tissue-type segmented (Zhang et al., 2001b). To correct for the partial volume effect (i.e., voxels “containing” more than one tissue-type), the tissue-type segmentation was carried out with partial volume estimation. For each partial volume voxel, the proportion of each tissue-type is estimated, that is, a partial volume vector is formed, with each element being a “fraction” of a specific tissue-type and having a sum of one (Zhang et al., 2001a). The segmented images have values that indicate the probability of a given tissue-type (i.e., they are not binary).
The resulting gray matter partial volume images were aligned to the gray matter MNI-152 standard space image (Montreal Neurological Institute, Montreal, QC, Canada) (Jenkinson et al., 2002), followed by nonlinear registration (Andersson et al., 2007). The resulting images were averaged to create a study-specific template. More precisely, to create the study-specific gray matter template, the same number of participants from each group (25 elderly with SMC and 25 (randomly selected) control elderly) was used in order to avoid any bias during the registration step that would have favored one of the groups.
Next, all native gray matter images were nonlinearly registered to this study-specific gray matter template (Ashburner and Friston, 2000; Good et al., 2001). Due to the nonlinear spatial registration, the volume of some brain structures may grow, while others may shrink. To be able to test for regional differences in the absolute gray matter volumes, a further processing step is needed to compensate for these enlargements and contractions (modulation). In this additional step, each voxel of each registered gray matter image was divided by the Jacobian of the warp field, which defines the direction (larger or smaller) and the amount of modulation. The modulated segmented images were spatially smoothed with an isotropic Gaussian kernel with a full width at half maximum of 7 mm.
A general linear model (GLM) approach as implemented in FSL was used to compare maps of elderly with SMC and control elderly. Two-sample t-tests were used for this analysis, including age and gender as covariate in the statistical model. Voxel-wise nonparametric permutation testing (Nichols and Holmes, 2001) with 5000 permutations was performed, correcting for multiple comparisons across space [statistical threshold set at p<0.05, Family-Wise Error (FWE) corrected], using the Threshold-Free Cluster Enhancement (TFCE) technique (Smith and Nichols, 2009), applying a minimum cluster size of 40 mm3.
Volume measurement of subcortical structures
An automatic segmentation method (FIRST as implemented in FSL) was applied to measure volumes of seven subcortical structures: the hippocampus, amygdala, thalamus, putamen, globus pallidus, nucleus accumbens, and the caudate nucleus (Patenaude et al., 2011). First, the structural scans were registered to the MNI-152 standard space image. After subcortical registration, a subcortical mask was applied to locate the different subcortical structures. This was followed by segmentation based on shape models and voxel intensities. After registration and segmentation of all structural scans, all segmented subcortical regions were visually checked for errors in registration and segmentation. After volumetric analysis, the volume in mm3 of each subcortical structure was obtained. To determine whether the subcortical structures volumes in elderly with SMC differ from those of the control elderly, univariate general linear modeling was used (SPSS 18.0). Age and gender were included as covariates in the statistical model.
Functional connectivity analysis
The preprocessing of the resting-state data consisted of motion correction (Jenkinson et al., 2002), brain extraction (Smith, 2002), spatial smoothing using a Gaussian kernel with a full width at a half maximum of 6 mm, and high-pass temporal filtering equivalent to 100 sec (≥0.01 Hz). After preprocessing, the functional images were registered to the corresponding high-resolution echo planar images, which were registered to the T1-weighted images, which were registered to the 2 mm isotropic MNI-152 standard space image (Jenkinson et al., 2002). These registration parameters were combined to obtain the registration matrix from native (fMRI) space to MNI space and its inverse (from MNI space to native space).
The functional connectivity analysis was performed using the dual regression method of FSL, a technique that allows a voxel-wise comparison of resting-state functional connectivity [previously described in (Filippini et al., 2009)]. Functional connectivity can be studied using the dual regression technique based on a data-driven independent component analysis. Another approach to study functional connectivity in a more standardized way is the use of standard resting-state networks as a reference. Here, resting-state functional connectivity is determined in terms of similarity of the BOLD fluctuations in the brain in relation to characteristic fluctuations in eight predefined resting-state networks. Our choice of resting-state networks was based on high reproducibility of these networks from an independent component analysis of different data sets (Beckmann et al., 2005; Damoiseaux et al., 2006). These standardized resting-state networks parcellate the brain into eight templates that represent more than 80% of the total brain volume (Khalili-Mahani et al., 2012): (1) medial visual network; (2) lateral visual network; (3) auditory network; (4) sensorimotor system; (5) default mode network; (6) executive control network; and (7 and 8) dorsal visual stream networks (Beckmann et al., 2005). To account for noise, a white matter and a cerebrospinal fluid template were included in the analysis (Birn, 2012; Cole et al., 2010; Fox et al., 2005).
In the dual regression, individual time series were first extracted for each template, using the eight resting-state networks (Beckmann et al., 2005) and the two additional white matter and cerebrospinal fluid maps (Birn, 2012; Cole et al., 2010; Fox et al., 2005), in a spatial regression against the individual fMRI data set (regression 1). The resulting matrices described temporal dynamics for each template and individual. Next, the ten temporal regressors (eight from the resting-state networks and two additional noise regressors) were used in a linear model fit against the individual fMRI data set (regression 2), to estimate the spatial maps for each individual. This gives ten 3D images per individual, with voxel-wise z scores of functional connectivity to each of the templates. The higher the absolute value of the z score, the stronger the connectivity to a network.
In the final stage of the functional connectivity analysis, the same statistical model as used in the VBM analysis was applied. To obtain group averages, a one-sample nonparametric t-test was used, and a two-sample t-test was applied to obtain group differences for each of the resting-state networks, using a GLM approach as implemented in FSL. Age and gender were included as covariates in the model. To statistically account for potential effects of local structural differences within and between the two groups, gray matter volume of each voxel was included as subject-wise and voxel-wise covariates in the GLM design (Oakes et al., 2007). The feat_gm_prepare script of FSL was used to compute individual gray matter density maps. Per network, the group comparison was masked by the union of the one-sample maps from each group for that network (i.e., voxels that fell within the group map of the elderly with SMC and/or the group map of the control elderly). Voxel-wise nonparametric permutation testing was performed using FSL-randomise (5000 permutations) (Nichols and Holmes, 2001). All statistical maps were FWE corrected using p<0.05, based on the TFCE statistic image (Smith and Nichols, 2009), applying a minimum cluster size of 40 mm3.
Results
Demographic characteristics
Table 1 shows the characteristics of the participants. There were no differences between elderly with SMC and control elderly with regard to age, gender, and years of education. Both groups did not show abnormalities in neuropsychological evaluation (Table 2).
Neuropsychological Test Scores
Cutoff value defines the lower range of normal test scores.
Stroop Color-Naming Test was performed in 13 elderly with SMC.
Cutoff value of 85, mean of 100±15.
MMSE, mini mental-state examination; 15-PLT, 15 picture learning test; WMS, Wechsler Memory Scale; CAMCOG-R, Cambridge Cognitive Examination - revised; TMT, trail making test.
Voxel-based morphometry
The whole-brain voxel-wise structural analysis yielded group differences in gray matter volume in several regions across the brain (Fig. 1). Elderly with SMC show a volume reduction of the right hippocampus, right amygdala, bilateral ACC, mPFC, cuneus, precuneus, and precentral gyrus compared with the control elderly. Left hippocampal volume reduction was visible in the images that were not corrected for FWE (p<0.01, uncorrected images not shown).
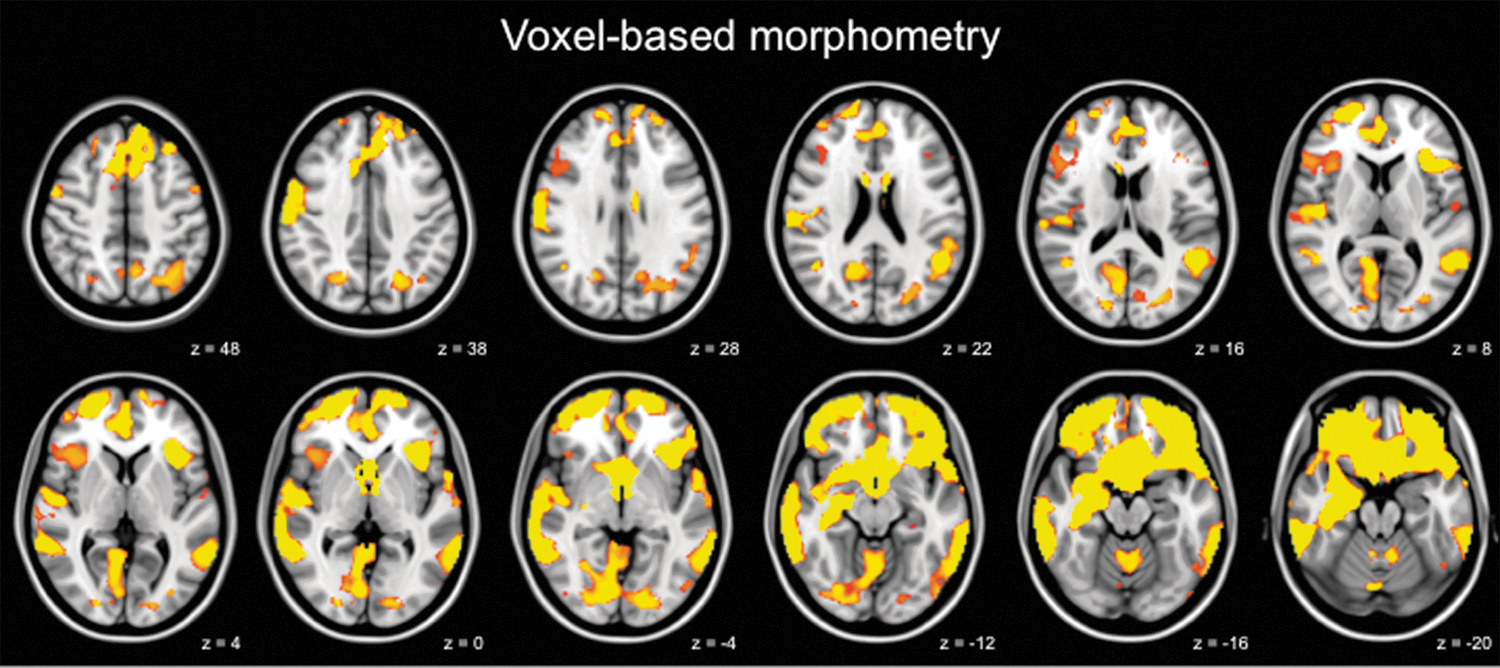
Elderly with subjective memory complaints (SMC) show loss of brain structure. Brain areas showing reduced gray matter volume in elderly with SMC compared with control elderly. The left side of the brain corresponds to the right hemisphere and vice versa. Images are overlaid on the transverse slices of the MNI-152 standard anatomical image. Z-coordinates of each slice in the MNI-152 standard space are given. Voxel-based morphometry results are thresholded using p<0.05, Family-Wise Error (FWE) corrected, based on the Threshold-Free Cluster Enhancement statistic image. Age and gender were included as covariates in the statistical model. p values are color coded from 0.05 FWE corrected (red) to<0.0001 FWE corrected (yellow).
Within the SMC group, correlations between individual neuropsychological test scores and regional gray matter volume were found at the liberal uncorrected threshold. A positive correlation with the scores of the Wechsler Memory Scale (uncorrected p=0.0002) was found in the cerebellum (365 voxels). In the inferior and middle temporal gyrus (218 voxels), we found a positive correlation with the scores of the Trail Making Test (uncorrected p=0.0002). A positive correlation was found with the scores of the Stroop Color-Naming test (uncorrected p=0.0002) in the frontal pole (57 voxels). These correlations did not survive correction for multiple comparisons.
Volumes of subcortical structures
Right hippocampal volume reduction in the elderly with SMC was confirmed in the analysis of subcortical structure volumes (p=0.002) (Table 3). In addition, the volume of the left hippocampus was smaller in elderly with SMC (p=0.017). While the whole-brain structural analysis suggested amygdala volume reduction, this could not be confirmed with the automatic segmentation method. In agreement with the whole-brain voxel-wise analysis, no volume differences were found in the other subcortical structures.
Mean Volumes of Subcortical Structures
Functional connectivity
Given the extensive gray matter differences, we included gray matter volume as a voxel-wise covariate in the fMRI analysis to correct for its potential effect on functional connectivity. Voxel-wise group comparisons revealed increased functional connectivity in two resting-state networks in elderly with SMC compared with the control elderly (the default mode network [Fig. 2] and the medial visual network [Fig. 3]). No decreases in functional connectivity were found in elderly with SMC. In the other six resting-state networks, no changes in functional connectivity were observed.
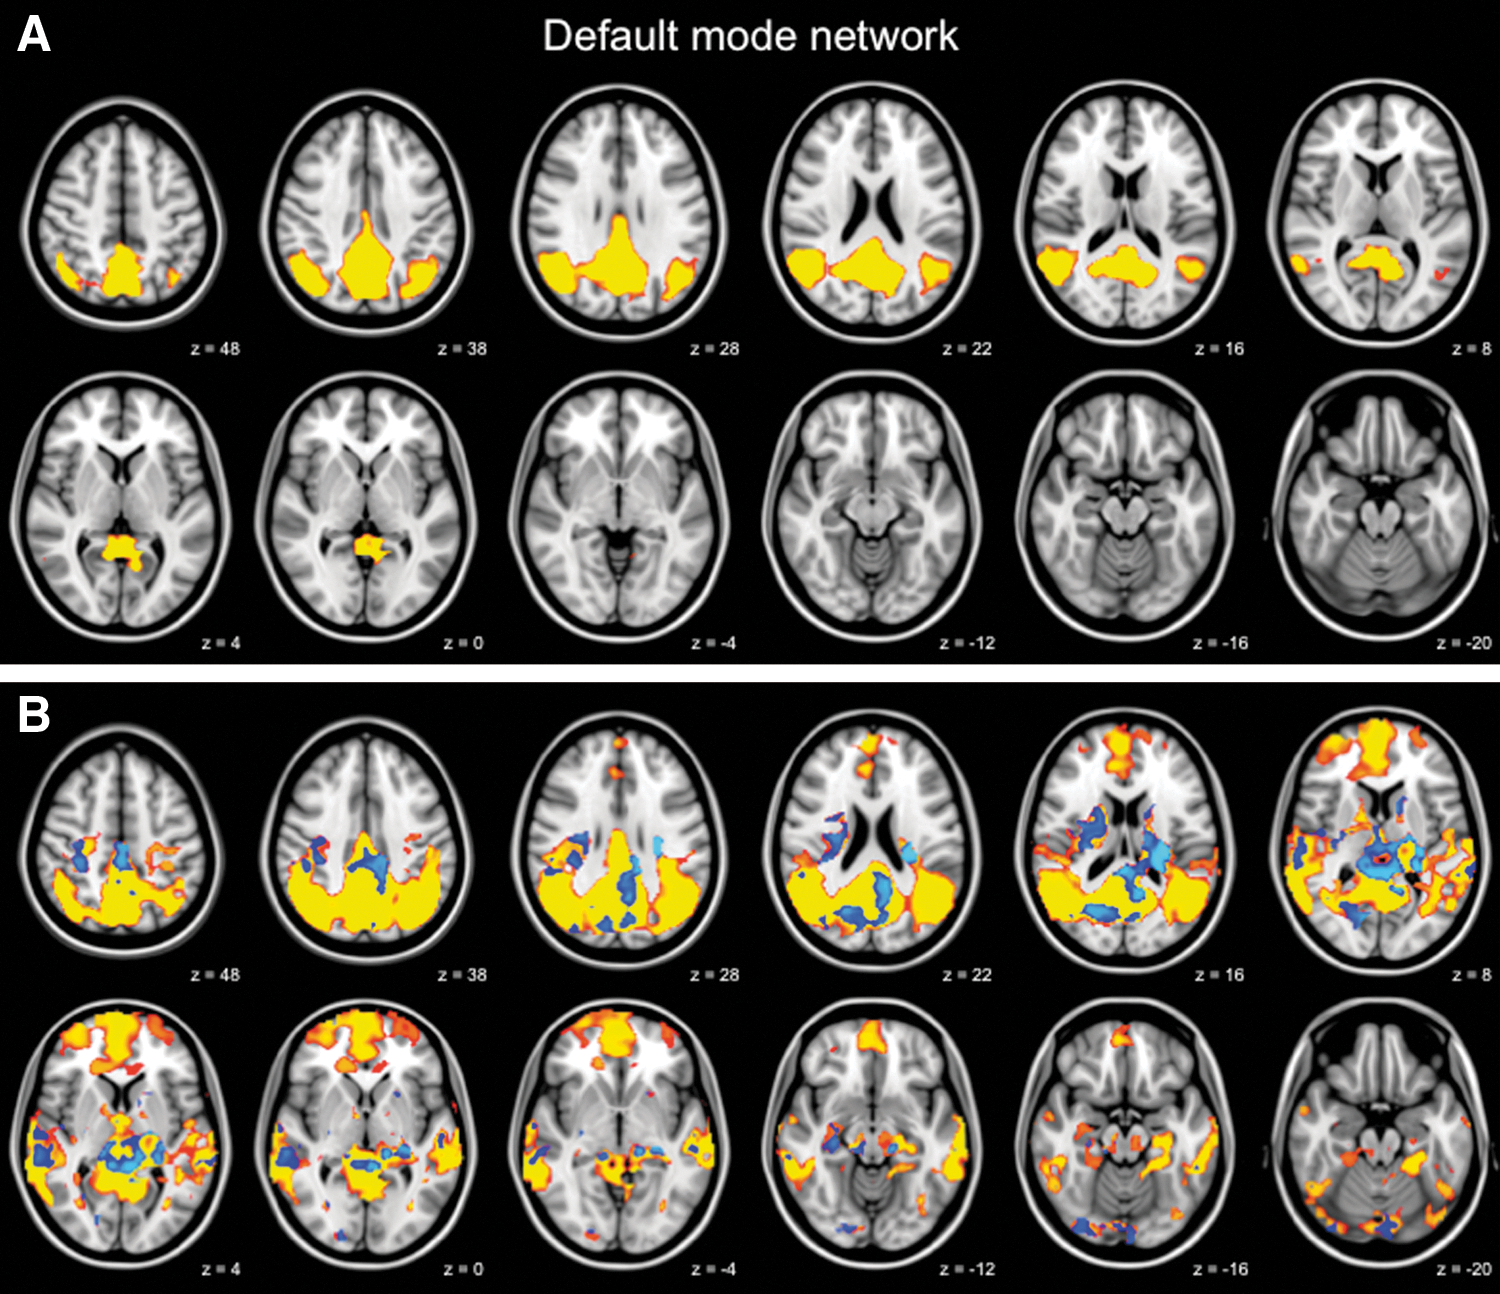
Increased functional connectivity in the default mode network. Functional connectivity in the default mode network in healthy control elderly
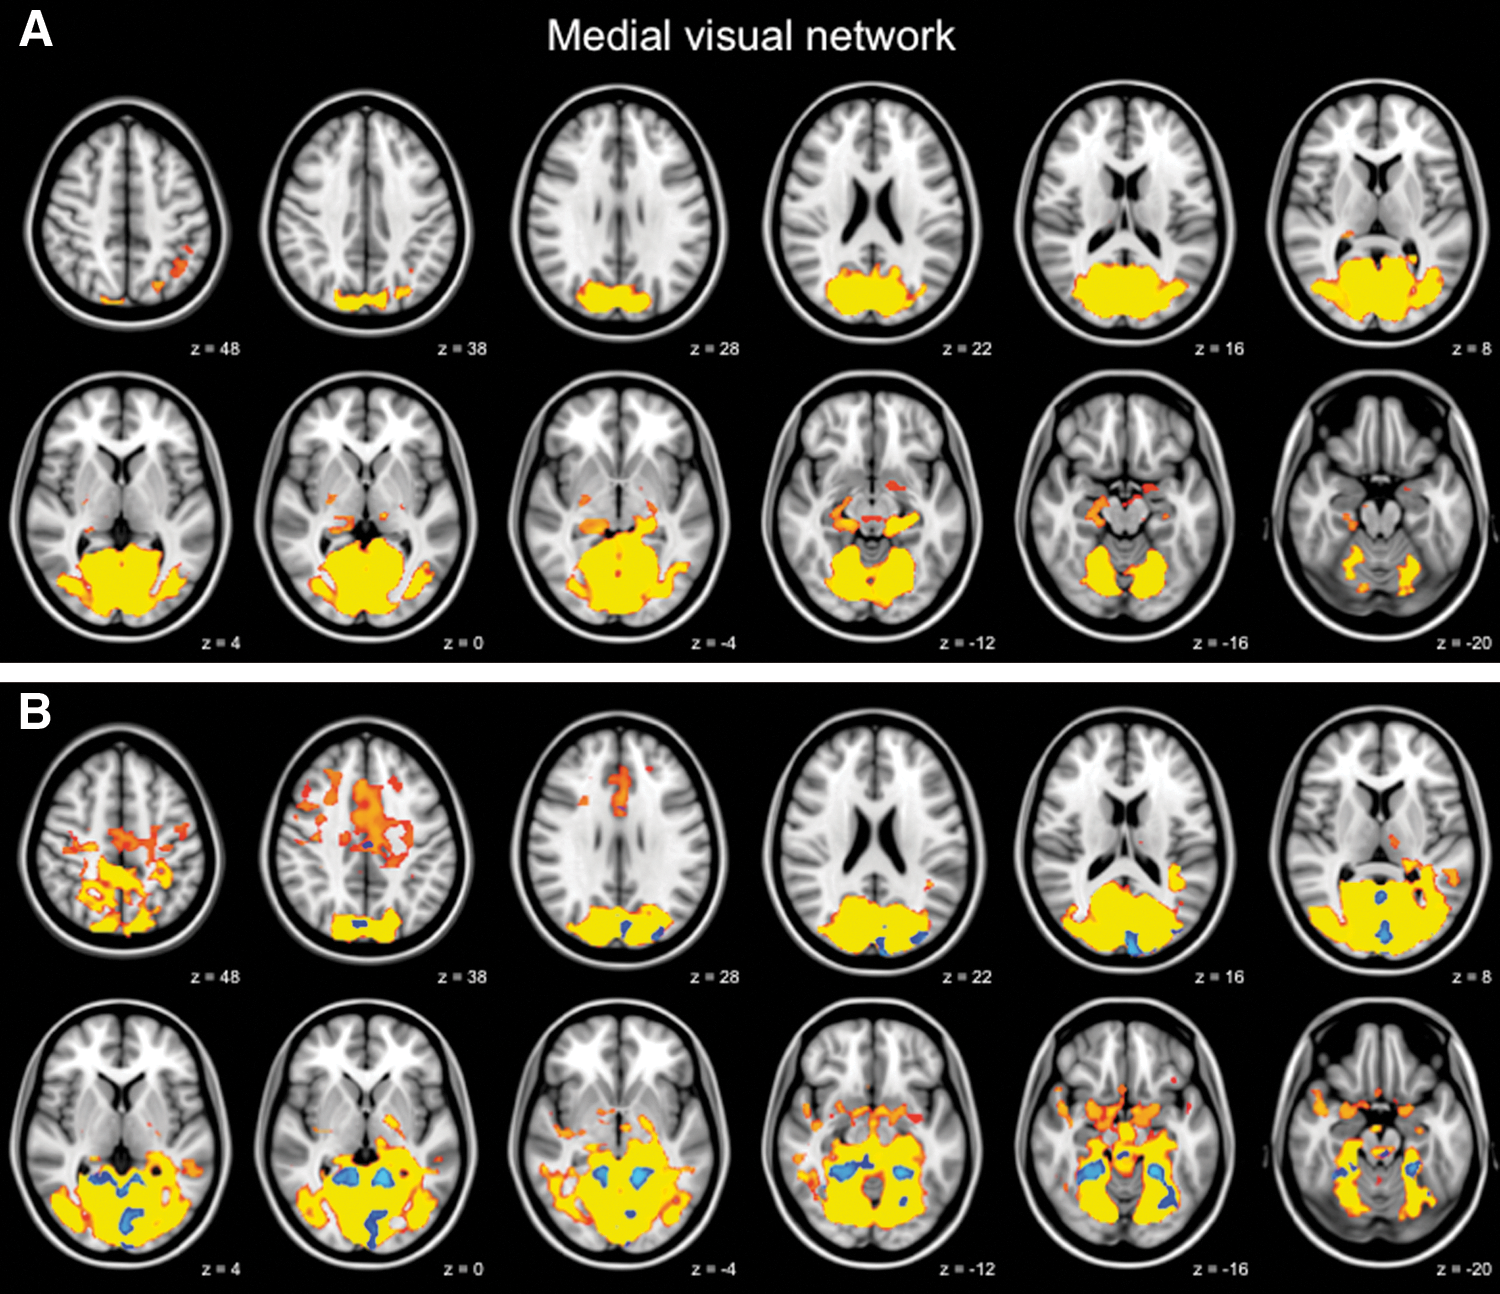
Increased functional connectivity in the medial visual network. Functional connectivity in the medial visual network in healthy control elderly
Regions showing increased functional connectivity in the default mode network included the right hippocampus, bilateral thalamus, PCC, cuneus, left precuneus, and right superior temporal gyrus (Fig. 2B, full list of structures in Table 4). The medial visual network structures with increased functional connectivity included the bilateral ACC, PCC, cuneus, and precuneus (Fig. 3B, full list of structures in Table 4). To further illustrate group differences per network, subjects' mean z scores of regions with increased functional connectivity are plotted separately for the default mode network and the medial visual network (Fig. 4).
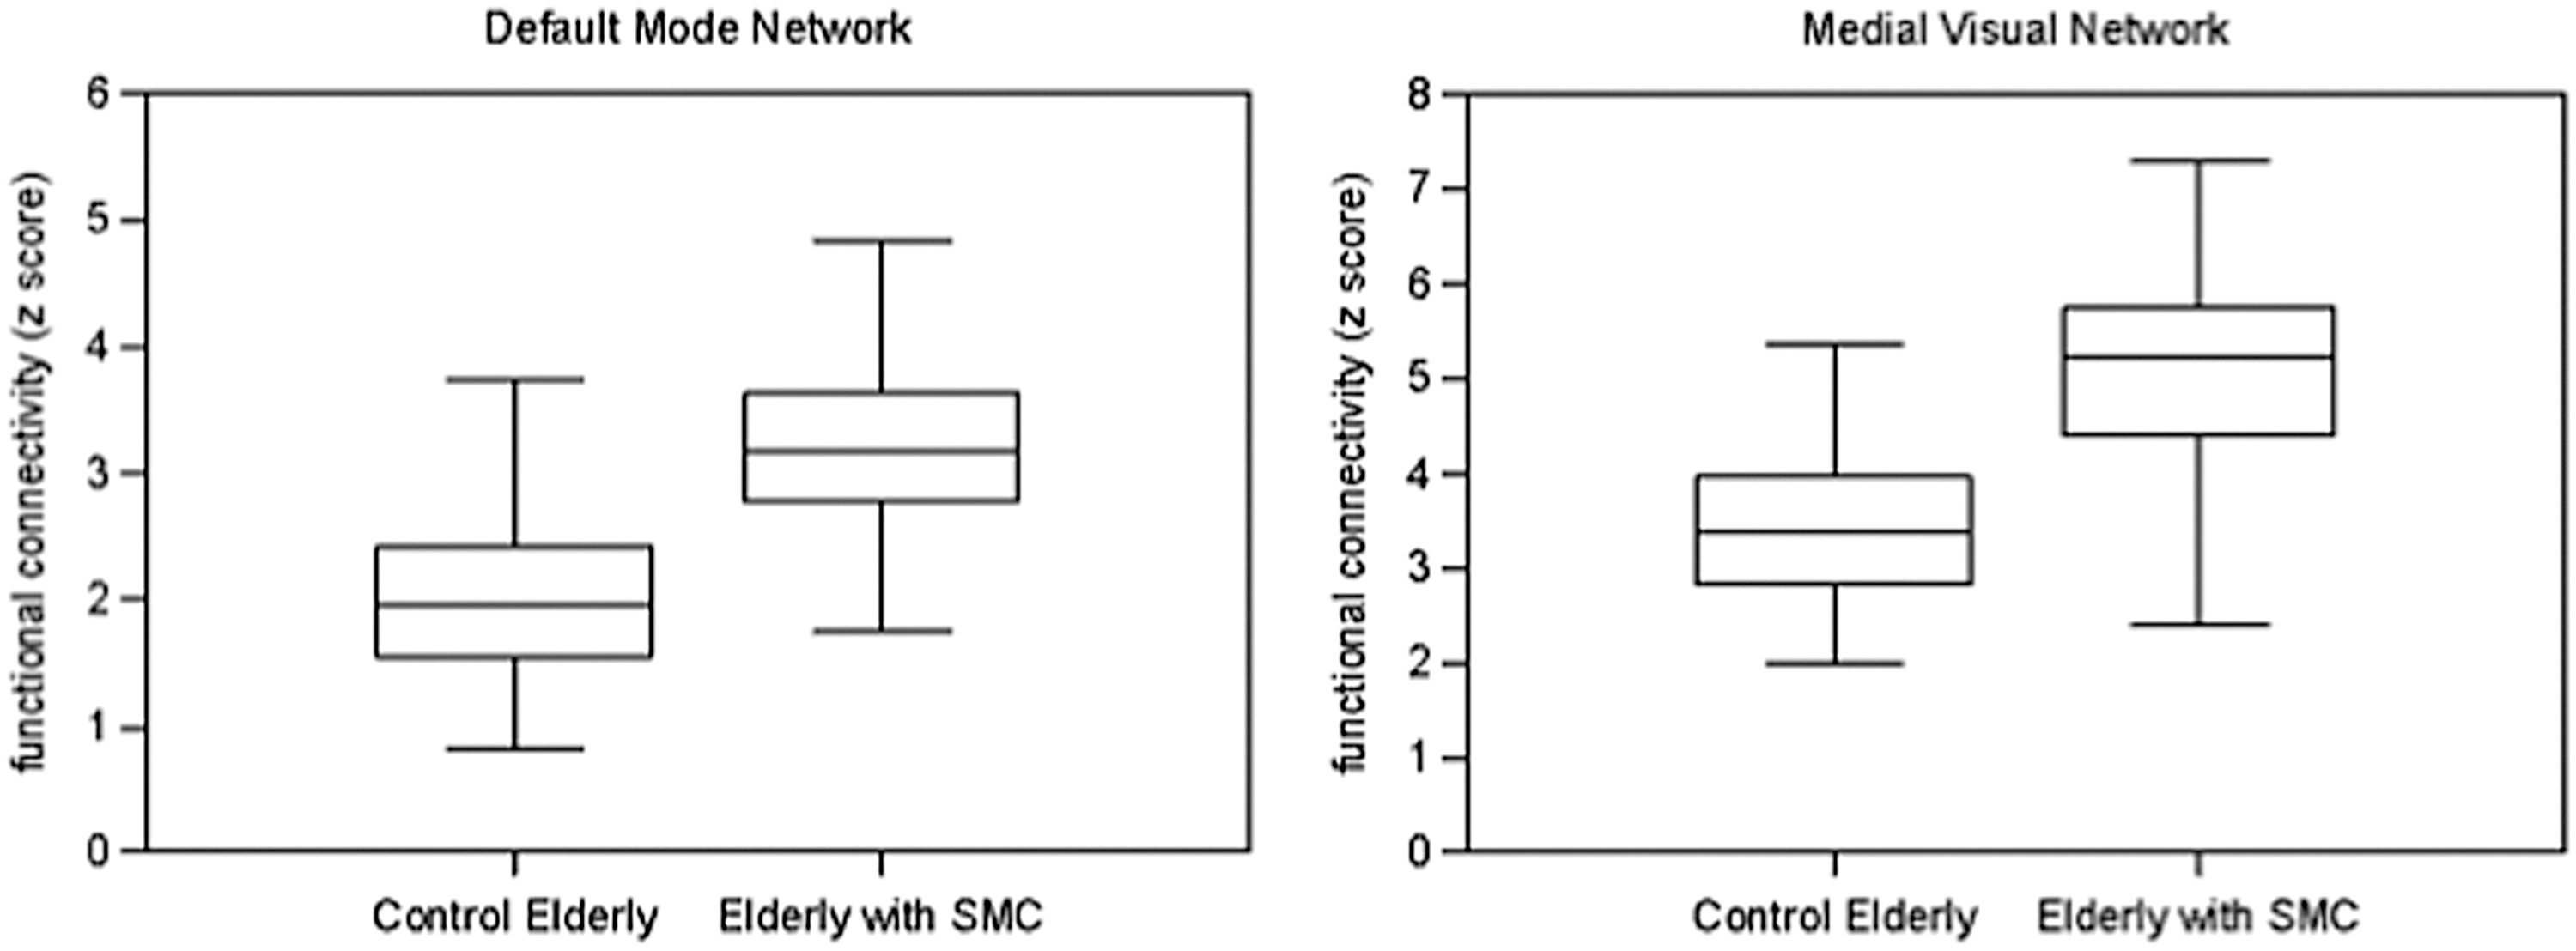
Boxplots of increased functional connectivity in elderly with SMC. For each subject, mean z scores were extracted from the brain areas with increased functional connectivity in elderly with SMC (blue areas in Figs. 2 and 3). Boxplots for the default mode network and the medial visual network, show median, lower and upper quartile, and sample minimum and maximum.
Within the SMC group, no correlations between individual neuropsychological test scores and functional connectivity were found.
Increased Functional Connectivity in Elderly with SMC Compared with Control Elderly
Full list of structures with increased functional connectivity in elderly with SMC (Figs. 2 and 3). Between-group effects are corrected for gray matter volume, thresholded using p<0.05, FWE corrected, based on the TFCE statistic image. For each peak voxel x-, y-, and z-coordinates in the MNI-152 standard space image are given.
MNI, Montreal Neurological Institute, Montreal, QC, Canada; R, right; L, left.
Discussion
The present study is the first which demonstrates that, in addition to structural brain deficits, increases in functional connectivity are present in elderly with SMC. These findings were observed even in a heterogeneous group of elderly with subjective complaints about their memory. This suggests that self-reported SMC is a reflection of objective alterations in brain function.
Our findings of atrophy of the hippocampus, ACC, mPFC, cuneus, precuneus, and precentral gyrus in elderly with SMC are in line with previous studies showing atrophy of the hippocampus (Saykin et al., 2006; Stewart et al., 2011; Striepens et al., 2010; Van der Flier et al., 2004), and less frequently also in the left medial frontal gyrus (Saykin et al., 2006), right cuneus (Saykin et al., 2006), right precentral gyrus (Saykin et al., 2006), and entorhinal cortex (Jessen et al., 2006; Striepens et al., 2010) in elderly with SMC. The voxel-based morphometry analysis showed smaller amygdala volumes, which could not be confirmed with the volume measurements of subcortical structures. This makes it unlikely that amygdala atrophy is present in elderly with SMC.
The volume reductions observed in the present study suggest that self-reported SMC is a reflection of objective alterations in brain structure. These findings of atrophy could be of clinical importance, as atrophy of these regions is associated with dementia (Fox and Schott, 2004). Moreover, cognitively healthy elderly, who during a 10-year follow-up developed mild cognitive impairment or Alzheimer's disease, were at baseline characterized by gray matter atrophy of these regions (Tondelli et al., 2012). The correlation between gray matter volume and individual cognitive performance in the elderly with SMC could have strengthened the clinical relevance of our findings. However, these correlations were found in small areas throughout the brain and did not survive correction for multiple comparisons. Further investigation is highly recommended to confirm the weak correlations found in this study.
Studying resting-state functional connectivity is important to understand brain function (Mesulam, 1998) and is relevant in the context of neurodegenerative diseases (Pievani et al., 2011). While brain activation is studied in elderly with SMC with task-related fMRI (Rodda et al., 2009, 2011), resting-state functional connectivity is underexplored in these elderly. The present study is the first which demonstrates that, even in a heterogeneous group of elderly with SMC, functional connectivity is increased. Mostly decreased functional connectivity has been found in mild cognitive impairment and dementia (Hafkemeijer et al., 2012) and in one study in elderly with SMC applying the magnetoencephalography technology (Bajo et al., 2011); however, there is evidence for increased functional connectivity in Alzheimer's disease (Wang et al., 2006, 2007; Zhang et al., 2009, 2010) and in cognitively healthy subjects at risk for developing dementia as well (Dennis et al., 2010; Filippini et al., 2009; Fleisher et al., 2009; Westlye et al., 2011). It has been suggested that increased task-related activation reflects a greater cognitive effort to compensate for subclinical losses of cognitive function and to maintain task performance (Bondi et al., 2005). This idea is supported by findings of increased functional connectivity in the hippocampus, amygdala, mPFC, and retrosplenial cortex in young cognitively healthy subjects at genetic risk for developing neurodegenerative diseases (Filippini et al., 2009). This compensatory mechanism has been suggested as an explanation for reduced interhemispheric inhibition (Talelli et al., 2008) and may also explain the increased functional connectivity found in elderly with SMC in the current study. An alternative explanation is that the increased functional connectivity is a pathological state that may cause further brain damage (Gallagher et al., 2010; Yassa et al., 2010). Nevertheless, this compensatory hypothesis and the clinical meaning of increased functional connectivity in SMC need to be further investigated.
Since it is not exactly known how brain structure and function are related, the functional connectivity data were analyzed with regional gray matter volume as covariate in the model, to statistically account for the potential effect of local structural differences. Our observations showed that the functional connectivity differences are not simply explained by differences in gray matter volume. The changes in functional connectivity are found in brain areas that are a part of the default mode network. The differences in functional connectivity between hippocampus and PCC are in accordance with the affected hippocampal white matter integrity found with diffusion tensor imaging in mild cognitive impairment and Alzheimer's disease (Mielke et al., 2009). These findings could be of clinical relevance, as changes in functional connectivity in the default mode network have repeatedly been demonstrated in patients with Alzheimer's disease, and, moreover, in cognitively healthy subjects at risk for developing neurodegenerative diseases (Hafkemeijer et al., 2012). However, it should be noticed that these changes are not specific for elderly with SMC, as changes in functional connectivity are found in a wide range of diseases from neurodegenerative disorders to psychiatric diseases (Broyd et al., 2009).
The medial visual network showed differences in functional connectivity. This may appear as a remarkable finding, as histological studies showed that the occipital cortex is one of the latest brain regions affected in Alzheimer's disease (Braak and Braak, 1991). However, previous studies repeatedly showed that functional connectivity and reactivity is altered in the occipital lobe in mild cognitive impairment, and mild, moderate, and severe Alzheimer's disease (Bokde et al., 2008, 2010; Horwitz et al., 1995; Prvulovic et al., 2002; Rombouts et al., 2005; Zhang et al., 2010), showing that fMRI changes may occur in the earlier phases of dementia in the occipital lobe, and may not necessarily follow the same sequential pattern as found in histological studies.
Conclusion
Here, we demonstrated that, in addition to structural brain deficits, increases in functional connectivity are present in elderly with SMC. The present study is the first which demonstrates that functional connectivity is increased in the default mode and medial visual network in these elderly. Our findings in elderly with SMC suggest that self-reported SMC is a reflection of objective alterations in brain function. Furthermore, our results indicate that functional imaging, in addition to structural imaging, can be a useful tool to objectively determine a difference in brain integrity in elderly with SMC. Further investigation is necessary to confirm the present findings, to establish the pathophysiology and clinical meaning of SMC, and to establish the potential role of fMRI in the predictive models of dementia.
Footnotes
Acknowledgments
This study was supported by grants from the Netherlands Organization for Scientific Research (NWO: 91786368 and 05613010), the Innovation-Oriented Research Program on Genomics (SenterNovem: IGE05007), and the Netherlands Consortium for Healthy Aging (NCHA: 050060810).
Author Disclosure Statement
No competing financial interests exist.