




Abstract
In addition to the skeleto-motor deficits, patients with Parkinson's disease (PD) frequently present with oculomotor dysfunctions such as impaired smooth pursuit and saccadic abnormalities. There is increasing evidence for an impaired cortical function to be responsible for oculomotor deficits that are associated with lack of inhibitory control; however, these pathomechanisms still remain poorly understood. By means of “task-free” resting-state functional magnetic resonance imaging (rs-fMRI), functional connectivity changes in PD within the default mode network (DMN) have been reported. The aim of this study was to investigate whether altered functional connectivity within the DMN was correlated with oculomotor parameter changes in PD. Twelve PD patients and 13 matched healthy controls underwent rs-fMRI at 1.5 T and videooculography (VOG) using Eye-Link-System. Rs-fMRI seed-based region-to-region connectivity analysis was performed, including medial prefrontal cortex (mPFC), medial temporal lobe (MTL), posterior cingulate cortex (PCC), and hippocampal formation (HF); while VOG examination comprised ocular reactive saccades, smooth pursuit, and executive tests. Rs-fMRI analysis demonstrated a decreased region-to-region functional connectivity between mPFC and PCC as well as increased connectivity between bilateral HF in PD compared with controls. In VOG, patients and controls differed in terms of executive tests outcome, smooth pursuit eye movement, and visually guided reactive saccades but not in peak eye velocity. A significant relationship was observed between saccadic accuracy and functional connectivity strengths between MTL and PCC. These results suggest that PD-associated changes of DMN connectivity are correlated with PD-associated saccadic hypometria, in particular in the vertical direction.
Introduction
Patients with Parkinson's disease (PD) frequently present with oculomotor abnormalities such as impaired smooth pursuit and abnormalities during rapid gaze shift (saccades) toward a new target in the visual scene (Pinkhardt et al., 2009; Pinkhardt and Kassubek, 2011). Eye movement changes in PD are beyond those deficits that can be fully explained by a loss of dopaminergic projections (Pinkhardt et al., 2012). They may be classified as a part of the broad spectrum of nonmotor dysfunctions in PD (Chaudhuri et al., 2011). The way humans control eye movements offers a unique opportunity to understand the interconnection of the brain in healthy state and pathology (Leigh and Zee, 2006). However, the role of higher-function brain networks in the control of eye movement and their changes in aging and disease (such as PD) still remains poorly understood. Resting-state functional magnetic resonance imaging (rs-fMRI)-based functional connectivity studies have been established as a technique for unbiased analysis of the brain's functional connectome (Lang et al., 2012; Toga et al., 2012; Van Dijk et al., 2010). A multitude of psychiatric and neurodegenerative disorders have already been addressed, including PD (Tessitore et al., 2012; Wu et al., 2009a, 2009b, 2011), whereas clinical applications are still at an early stage of development (Fox and Greicius, 2010; Lee et al., 2012a). Many rs-fMRI studies in PD have been performed with a focus on the default mode network (DMN), which is unique in terms of the higher activity of the idling brain (Zhang and Raichle, 2010).
For the participation of the DMN in internal modes of cognition, different interpretations are discussed in the literature: One possibility is that the DMN reflects spontaneous mentation during mind-wandering, and another is that the DMN supports exploratory monitoring of the external environment during attenuated attention in the manner of a “sentinel” (Buckner et al., 2008). In PD, following the “sentinel” theory, a possible relationship between connectivity metrics within the DMN and oculomotor performance will be hypothesized, as impaired smooth pursuit eye movement is believed to be affected by a lack of inhibitory control (Pinkhardt et al., 2012). Thus, we presume possible correlations between oculomotor symptoms and higher cortical dysfunctions due to a disrupted connectivity pattern within the DMN.
The aim of this study was to investigate functional connectivity changes within the DMN in PD patients compared with age-matched healthy controls by means of seed-based rs-fMRI. From the methodological point of view, we considered a seed-based approach (Van Dijk et al., 2010) to be of specific advantage for this study, because this hypothesis-driven technique was accomplished to be more “straight forward” for a comparison of the predefined network at a group level than an independent component analysis (ICA)-based group analysis (Cole et al., 2010). Possible associations between videooculographically quantified oculomotor performance and the functional connectivity metrics were analyzed. We defined canonical areas within the DMN comprising the major hubs of hippocampal formation (HF), medial prefrontal cortex (mPFC), and posterior cingulate cortex (PCC). Seeds were also placed into the medial temporal lobe (MTL) and the inferior parietal cortex (IPC), as both areas have been described to reveal decreased functional connectivity within the DMN in PD compared with controls (Tessitore et al., 2012; Zhang and Raichle, 2010).
Materials and Methods
Subjects
Twelve patients with sporadic PD (69.6±9.1 years) and 13 age-matched healthy controls (67.2±6.5 years) without any history of neurological or psychiatric abnormalities or other medical conditions underwent both rs-fMRI and oculomotor investigation. The clinical diagnoses of PD were based on the clinical presentation assessed by a movement disorder specialist (E.H.P., J.K.) according to the UK Brain Bank criteria. Severity of symptoms was quantified by Hoehn and Yahr rating scale. None of the patients were demented, yielding a minimum Mini Mental state examination (MMSE) of 26. Subject characteristics are summarized in Table 1.
Demographic and Clinical Data
H&Y, Hoehn & Yahr; MMSE, Mini Mental State Examination; PD, Parkinson's disease.
rs-fMRI image acquisition
To investigate task-free fMRI, a standardized protocol was performed on a 1.5 Tesla clinical scanner (Symphony, Siemens, Erlangen, Germany). Subjects were asked to stay motionless, awake with their eyes closed. The rs-fMRI signal time series contained 120 volumes of echo planar imaging (EPI), in-plane resolution 3.27×3.27 mm2, slice thickness 3.0 mm, repetition time 3080 ms, echo time 28 ms, field of view 209 mm, and flip angle 90°.
rs-fMRI preprocessing
rs-fMRI analyses were performed using the Data Processing Assistant for Resting-State fMRI (DPARSF), which is freely available at
Region-to-region correlation
For rs-fMRI data analysis, the resting-state toolkit (REST) was used, which is an additional software package to DPARSF and is also provided by
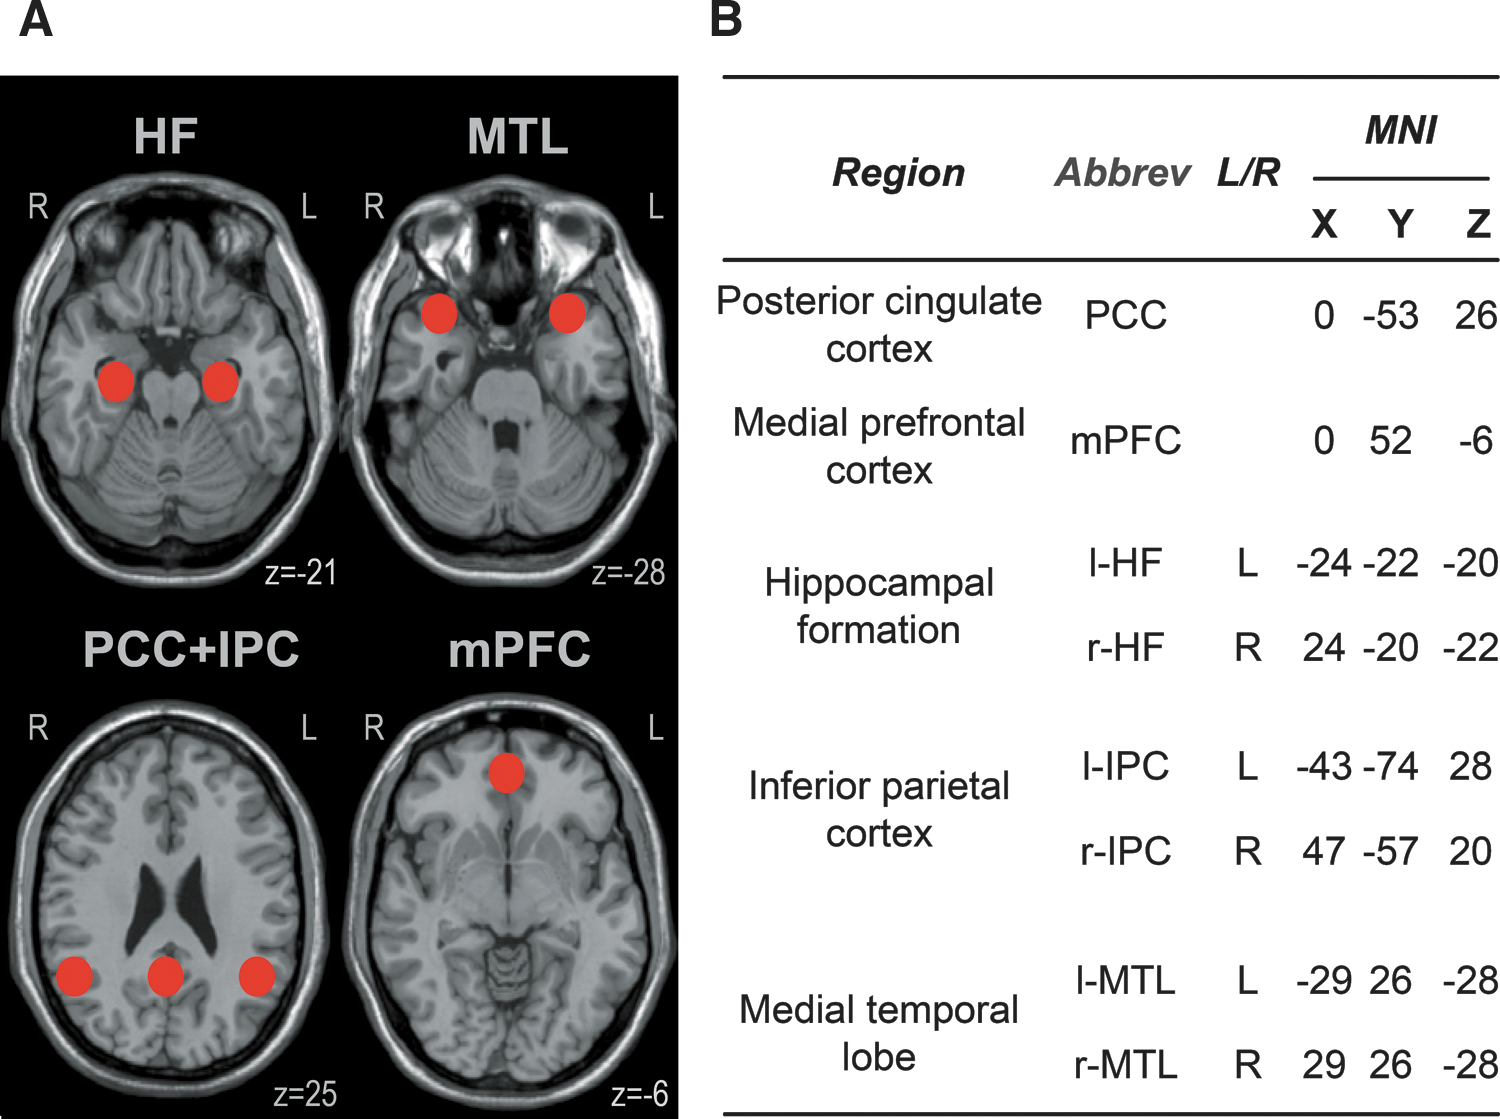
Regions of interest within the default mode network (DMN).
Oculomotor data acquisition
Measurements took place in a darkened, optically, and acoustically shielded room with subjects seated in a comfortable chair at the center of a white hemi-cylindrical screen with a radius of 160 cm. The screen carried pairs of adjacent red and green light emitting diodes (LEDs) placed from every 5° till±40° in horizontal direction and till±15° in vertical direction and that were invisible when not lit. In addition, loudspeakers were placed adjacent to the screen at 90° to the left and right of the center. The movements of both eyes were recorded with an EyeLink I® videooculography (VOG) system (SR Research Ltd., Osgoode, ON, Canada) at a sampling rate of 250 Hz, while the head was stabilized by a chin rest to minimize artifactual head movements. Visually guided reactive saccades were elicited by randomly lighting one of the red LEDs as a target such that horizontal target steps of 5, 10, 20, or 40° and vertical steps of 5, 10, 15, or 30° resulted (32 trials in each direction). Subjects were instructed to re-fixate the target as accurately and as fast as possible after each target step. Smooth pursuit eye movements were elicited by a red laser spot moving sinusoidally at frequencies of 0.125 and 0.375 Hz across the screen in either horizontal (±20°) or vertical (±15°) direction. To test for executive control, we used the following paradigms: In the delayed saccade task used in order to examine disinhibition control, subjects were asked to withhold their reaction to random target steps of the red LED of 5, 10, 20, and 40° horizontal and 5, 10, 15, and 30° vertical (16 trials per direction), until an acoustic “go” cue was given. Rapidly alternating voluntary gaze shifts represent a valuable measure of possible lack of initiation and were evoked in both horizontal and vertical directions by asking subjects to saccade as rapidly as possible back and forth for 30 sec between two red LEDs serving as fixed 20° spaced targets and that were symmetrically arranged left and right to the screen center.
Oculomotor data postprocessing
By use of a previously published software package (Pinkhardt et al., 2008), all data records had been visually inspected in terms of artifacts (e.g., head movements, disrupted registration) in addition to the automatic detection by the semi-automated analysis routine. Having analyzed data records, the following parameters were extracted from the eye movement recordings: Reactive saccades were characterized by (1) the peak eye velocity of saccades of 20° amplitude (obtained from a rational function fit of the main sequence); (2) the gain of responses to 20° target steps (linear fit of values representing amplitude of primary saccade/target step amplitude); and (3) their latency with regard to the main saccade (average of all trials). Smooth pursuit eye movement was characterized by (4) its gain (fundamental component of smooth pursuit eye movements velocity/target velocity). For anti- and delayed saccades, error scores were obtained from (5) the percentages of prosaccades and (6) premature saccades (before “go”), respectively. For rapidly alternating voluntary gaze shifts, we counted (7) the number of gaze shifts containing saccades of at least 10° amplitude. All these parameters were calculated separately for the horizontal, upward, and downward directions and are based on a cyclopean signal representing an average of the left and right eye recordings. Outcomes of executive tests (anti-, delayed saccades, and alternating voluntary gaze shifts) examined in either horizontal or vertical direction were basically identical and were, therefore, arithmetically averaged.
Statistical analysis–complementary analysis of rs-fMRI and oculomotor results
Results are presented as mean±standard deviation. Before statistical analysis of rs-fMRI data, Fisher's z transform (Silver and Dunlap, 1987) was applied to each region-to-region correlation coefficients yielding z(r) scores. To detect possible group differences between PD patients and controls, the corresponding z(r) scores were subjected to Student's t-test. The resulting p-values were corrected for multiple comparisons using a false discovery rate according to the procedure proposed by (Genovese et al., 2002). Presumed differences of oculomotor parameters between PD and controls were analyzed with the Mann–Whitney-U-Test. Individual z(r) scores and oculomotor parameters for PD patients were used to obtain possible relationships between rs-fMRI and oculomotor data by calculating Spearman's rank correlation coefficients (Tessitore et al., 2012). A threshold of p<0.05 was used for statistical interference.
Results
rs-fMRI: functional connectivity changes in PD versus controls
The findings for the analysis of the intrinsic functional connectivity (within the DMN) in PD patients compared with controls are summarized in Table 2 as region-to-region correlation strengths (r-values). In controls, the key hubs IPC, PCC, and mPFC were strongly connected to each other, in accordance with previous studies (Buckner et al., 2008; Vincent et al., 2006)—however, the correlation of these regions across the HF and MTL regions was less prominent. In PD, connectivity strengths between the key hubs IPC and HF as well as between IPC and MTL showed a tendency to negative correlation coefficients (r-values) in the sense of anti-correlations (Fox et al., 2009). The analysis of the DMN between PD patients and controls obtained two differences, that is, an increased connectivity between bilateral HF (p<0.001) as well as a decreased connectivity between PCC and the mPFC (p<0.01), as depicted in Figure 2. The remaining region-to-region connectivities did not differ significantly between groups.

Functional region-to-region connectivity in Parkinson's disease (PD) patients compared with controls. Connectivity strengths coded as line thickness (the thicker the lines, the stronger the connectivity) for
Intrinsic Functional Connectivity Within the Default Mode Network for Parkinson's Disease Patients and Controls
Functional connectivity matrix containing core region-to-region connectivity strengths within the default mode network depicted as averaged r-values (±SD) in PD patients (grey fields) and in age-matched healthy controls (white fields). Abbreviations according to Figure 1B.
Fields with significant differences are printed in italics, a p=0.0007; b p=0.0012.
Videooculography
Oculomotor performance in PD patients compared with controls was impaired in almost all parameters except peak eye velocity, which was in line with previous studies (Pinkhardt et al., 2012). For one PD patient, Figure 3 depicts an example of affected smooth pursuit eye movement and hypometric reactive saccades.
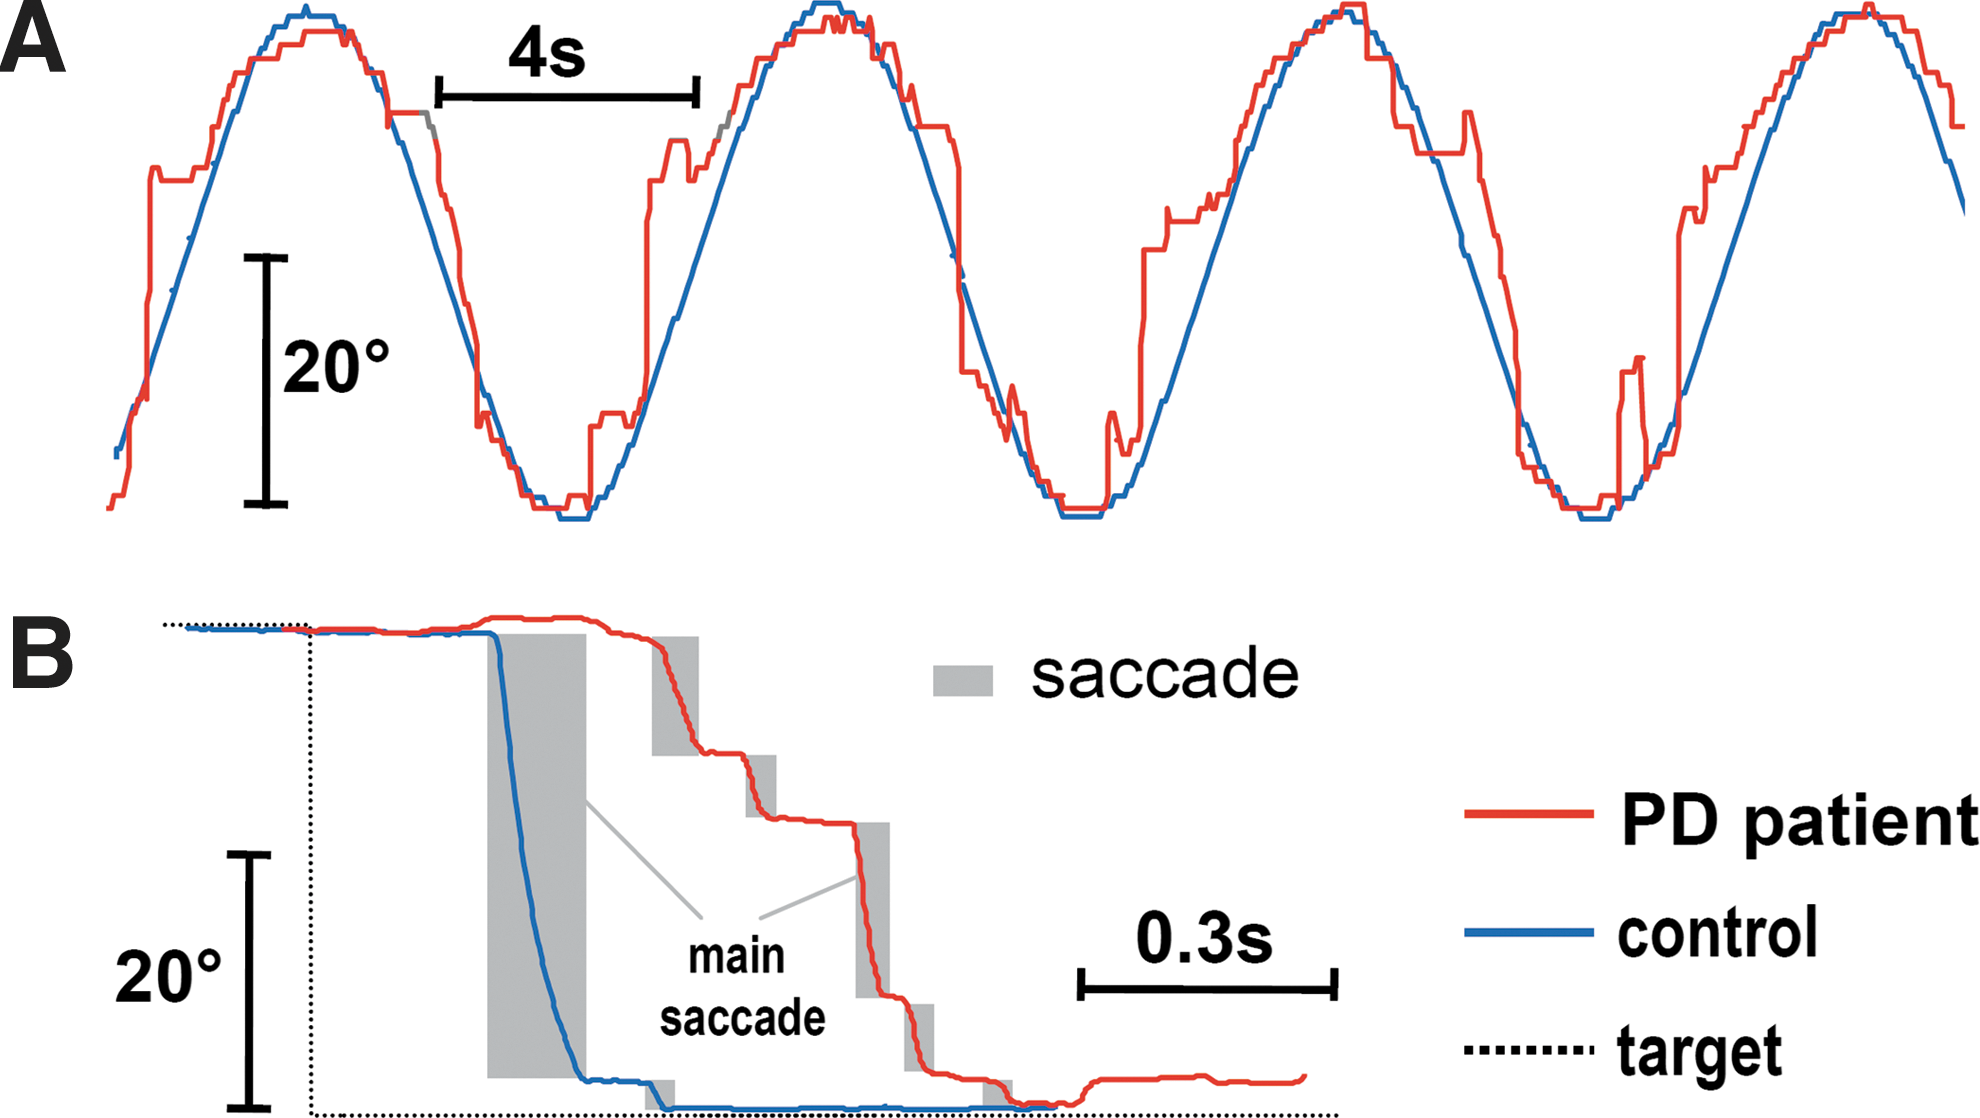
Example of disturbed eye movements in a patient with PD.
PD and controls differed in accuracy of horizontal (p=0.039) and vertical reactive saccades (p=0.003) as well as in prolonged latency of vertical reactive saccades (p=0.017). Moreover, smooth pursuit eye movement gain differed in vertical direction for fast oscillating stimulus (p=0.024) and horizontal direction for both stimulus frequencies (p=0.003 and p=0.008, respectively) due to superimposed saccadic intrusions in PD. In executive functions, PD patients performed significantly worse than controls, that is, they showed a decreased number of rapid alternating gaze shifts between two stationary targets made within 30 sec (p=0.002) and an augmented error rate in delayed saccades test (p=0.016).
Correlation of functional connectivity and oculomotor performance in PD
(For the sake of readability, connectivity between region A and B is written as A—B.) The Spearman's rank correlation analyses between individual region-to-region functional connectivity z(r) scores and oculomotor parameters demonstrated significant negative correlations at p<0.04 for (1) PCC—l-MTL connectivity and both horizontal (ϱ=−0.61) and vertical (ϱ=−0.63) accuracy of visually guided reactive saccades and for (2) PCC—r-MTL and saccadic accuracy (horizontal, ϱ=−0.60 and vertical, ϱ=−0.75, respectively). In addition, vertical accuracy correlated significantly (p<0.04) with l-IPC—r-HF (ϱ=0.72) and r-IPC—l-HF (ϱ=0.67), respectively.
No significant correlations were found between the corresponding z(r) scores as assessments of the connectivity strengths within the DMN and the oculomotor parameters representing horizontal peak eye velocity, latencies, number of rapid voluntary gaze shifts, errors in delayed saccades paradigm, and gain of smooth pursuit eye movement.
Discussion
The aim of this study was to assess the relationship between oculomotor performance and cerebral functional connectivity strengths in PD. The rs-fMRI data were in agreement with previous studies (Andrews-Hanna et al., 2010; Buckner et al., 2008; Vincent et al., 2006) for the region-to-region connectivity within the DMN for controls. For PD, only the finding of increased connectivity compared with controls between the memory system and its related bilateral HF has not been reported so far, while the decreased PCC—mPFC connection supports previous findings (Delaveau et al; 2010, Ibarretxe-Bilbao et al., 2011; van Eimeren et al., 2009). Furthermore, the oculomotor deficits were consistent with what has been described in PD (Leigh and Zee, 2006; Pinkhardt et al., 2009) and revealed significantly worse performance, including the observation that PD patients had difficulties in inhibiting a new target in the visual scene. VOG results encompassed superimposed saccades during smooth pursuit, saccadic hypometria (decreased gain of main saccade), increased latency and error in delayed saccade inhibitory test, as well as slowed ability to elicit rapid alternating gaze shifts. The VOG/rs-fMRI correlation analysis demonstrated significant correlations between both decreased horizontal and vertical ocular saccadic accuracy and region-to-region connectivity strengths within the DMN comprising the canonical regions HF, MTL, IPC, and PCC.
We did not observe any significant differences in region-to-region functional connectivity incorporating IPC and MTL areas by means of ICA, whereas Tessitore and colleagues have demonstrated significant changes in bilateral IPC and right MTL regions in cognitively unimpaired PD patients (Tessitore et al., 2012) and Krajcovicova and coworkers did not report any changed connectivity in PD by use of a similar ICA methodology (Krajcovicova et al., 2012). Nevertheless, the MTL region is known to be involved in the late symptomatic phase according to Braak, that is, Braak's stages 4–6 (Braak and Del Tredici, 2009; Pagonabarraga and Kulisevsky, 2012).
The correlation analysis with oculomotor parameters demonstrated significant negative correlations between PCC—MTL and saccadic accuracy (Fig. 4). Therefore, we assume that saccadic accuracy is also affected by a disturbed higher functional network within the DMN inasmuch as an increased connectivity between the major hubs PCC and bilateral MTL seems to be associated with hypometric saccades. Notably, the averaged connectivity strengths between PCC and bilateral MTL in PD yielded weak negative correlations such that a competing interaction between these areas might be assumed (Cole et al., 2010; Fox et al., 2009). Moreover, we observed positive correlations between connectivity strengths involving bilateral HF and IPC and vertical saccadic accuracy. The increased connectivity of r-HF—l-HF in PD was not correlated with any of the oculomotor parameters. Addressing the bilateral HF alteration separately, an explanation for the increased connectivity strengths in PD might be interpreted as an enhanced compensatory attempt in order to maintain cognitive performance despite loss of dopaminergic innervation (Bohnen et al., 2008; Kelly et al., 2009; Williams et al., 2002). These findings are in line with the Braak staging system with the involvement of HF (temporal mesocortex) in disease stage 4 (Braak and Del Tredici, 2009). Other imaging studies in PD (Tessitore et al., 2012), in contrast, did not find any areas that are thought to underlie compensatory mechanisms. Interestingly, carriers of a genetic risk factor for Alzheimer's Disease also exhibit an increased connectivity in the DMN (Filippini et al., 2009). Remarkably, the hippocampus is additionally involved in nonmnemonic processes such as spatial perception deficit (Lee et al., 2012b) and pure visual discriminating of scenes (Davies et al., 2004). Thus, it may be speculated, based on the correlation with vertical saccadic accuracy, that contributions at the cortical level to vertical saccadic hypometria are potentially caused by dysfunction in visual discrimination.
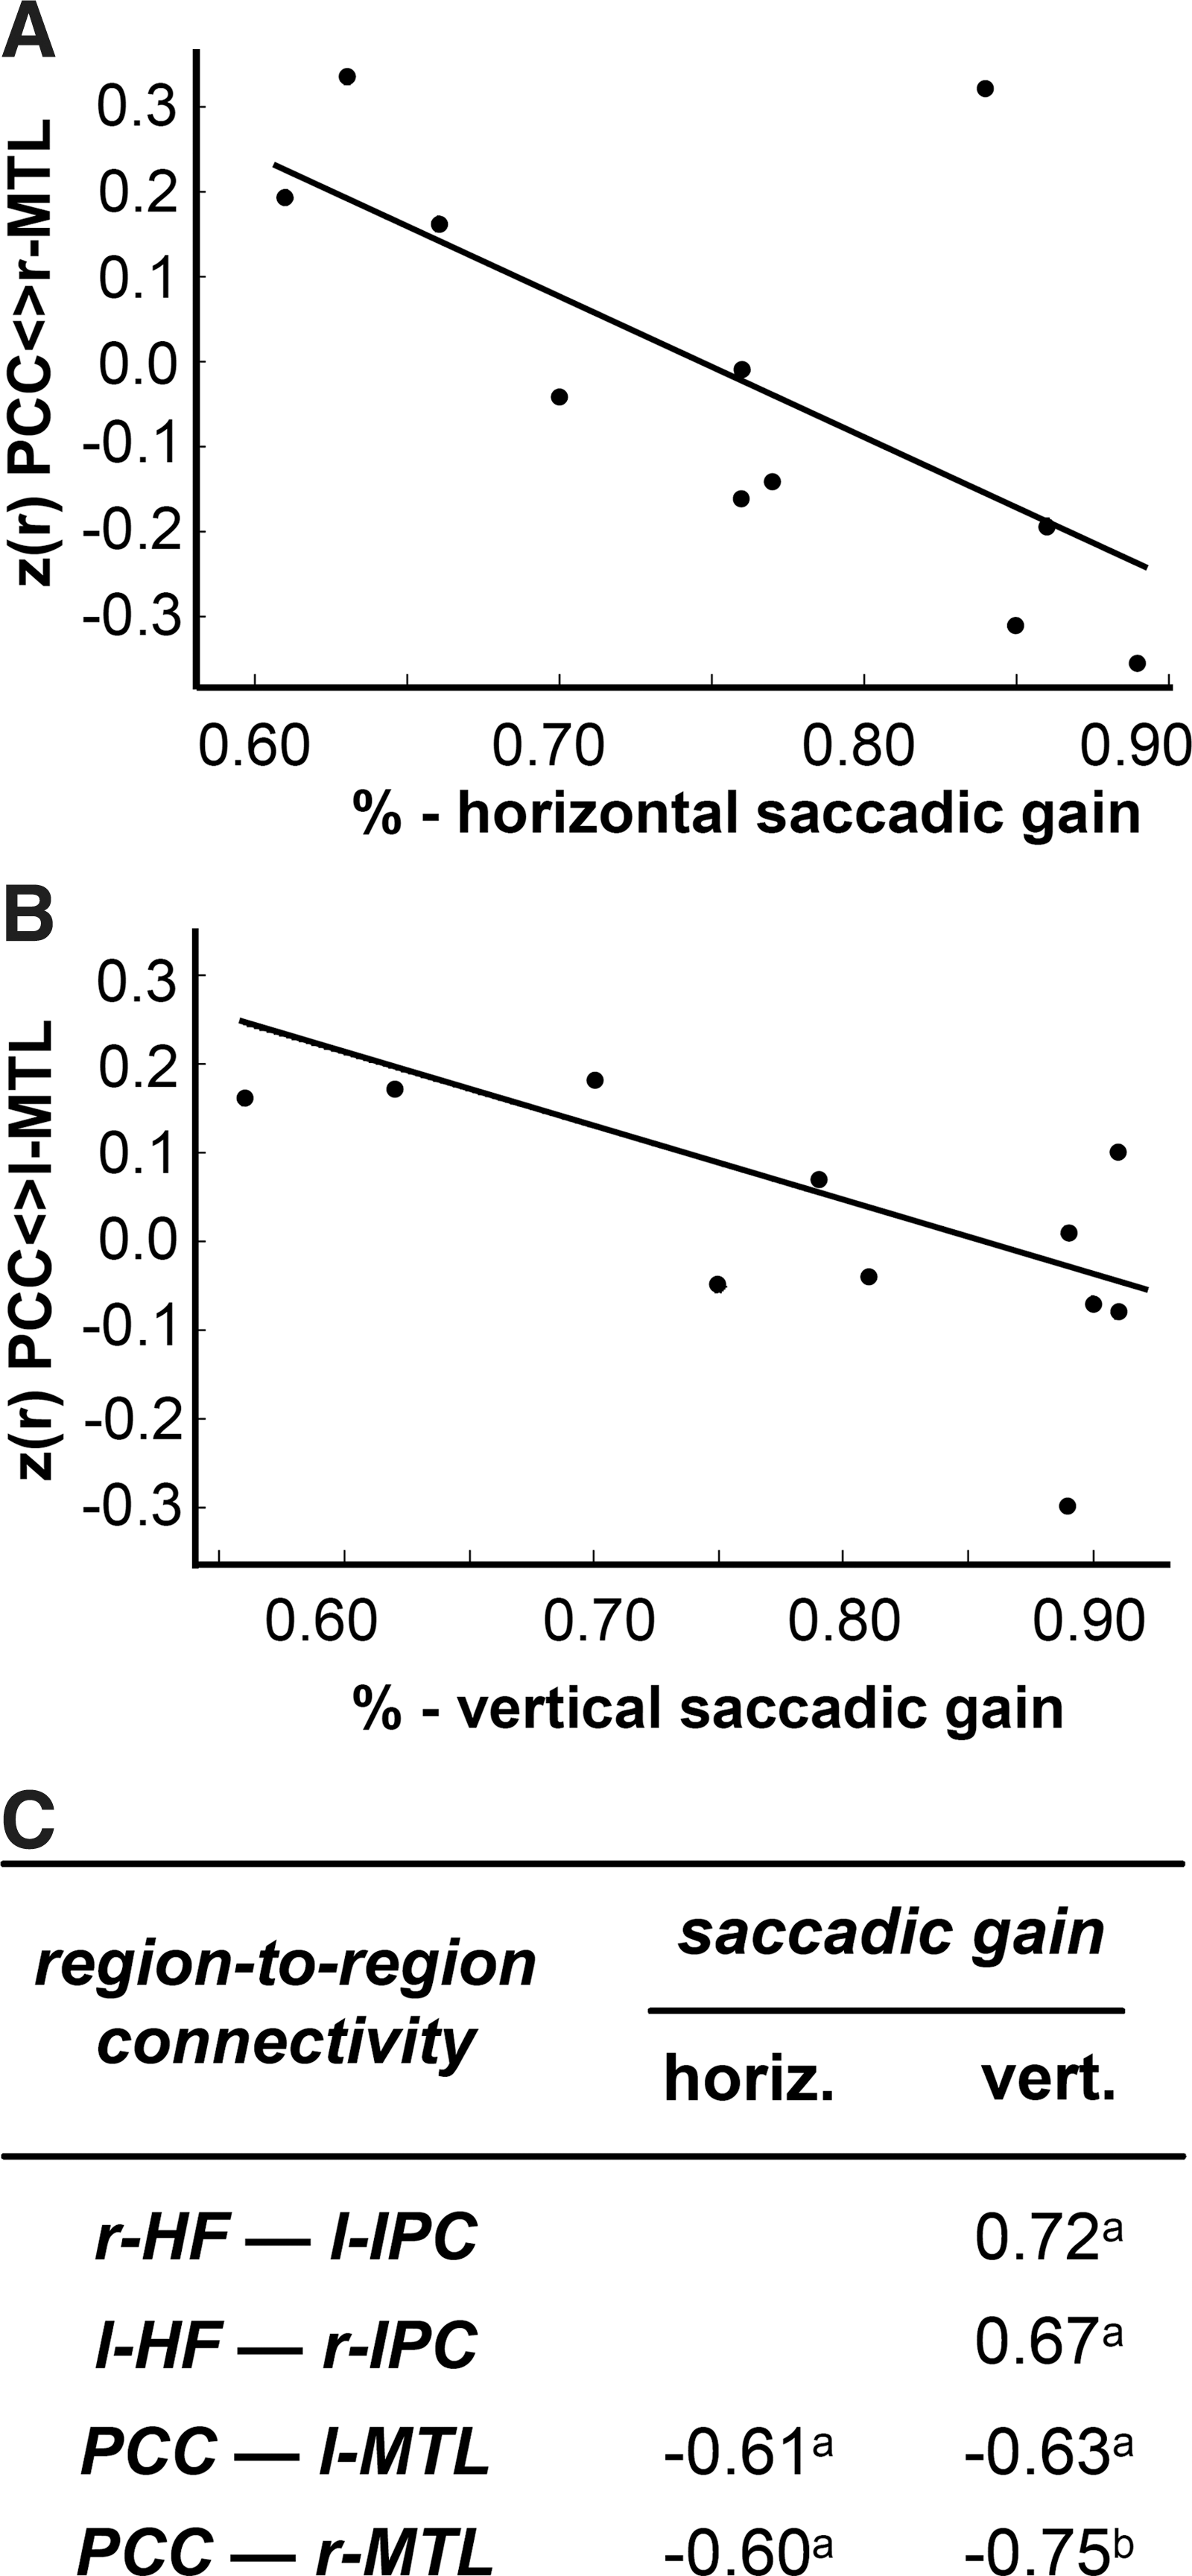
Significant correlations between functional connectivity and oculomotor performance. Significant correlations between functional connectivity and oculomotor parameters in PD. Scatterplots of individual region-to-region z(r) functional connectivity scores against accuracy of main saccades for
Both the long-distance disconnections mPFC—PCC and disturbed eye movements (Armstrong and Munoz, 2003; Munoz et al., 2003) that are similar to PD are also found in attention-deficit hyperactivity disorder ADHD (Zhang and Raichle, 2010). However, we did not find a relationship between the PCC—mPFC connectivity and any oculomotor performance parameters. ADHD patients show dysfunction in “response inhibition,” which is modulated by the frontal lobe, particularly the prefrontal cortex, cingulate cortex, and basal ganglia (Goto et al., 2010) such that ADHD patients have deficits in inhibitory control (e.g., increased error rates in delayed prosaccades) due to reduced ability to suppress unwanted saccades (Armstrong and Munoz, 2003; Munoz et al., 2003). Thus, transferred to our results, there seems to be no direct impact of the connectivity changes in the long-distance core hubs PCC—mPFC on a disturbed ocular inhibition control in PD.
The impairment of voluntary gaze shifts between two fixed targets in PD had no association to the DMN integrity. Therefore, the DMN seems not or not directly to be involved in the generation of voluntary eye movements. We had to reject the so-called sentinel hypothesis which postulates that the DMN has a broad low-level focus of attention when one “sentinel” monitors the external environment for unexpected events (Buckner et al., 2008; Gilbert et al., 2007). This hypothesis does not account for the explanation of oculomotor abnormalities. However, Pinkhardt and Kassubek (2011) speculated about a mainly extradopaminergic top-down fronto-striatal pathomechanism affecting the addressed oculomotor deficits that are associated with disturbed higher control.
There are several limitations to this pilot study. The drawbacks are the low sample size and the fact that all patients were assessed while they were being medicated, so the separation of dopaminergic and nondopaminergic effects was not possible. Further studies in larger samples with a homogenous study population by means of neuropsychological investigation, detailed clinical severity scales, and medication assessment will be necessary. Investigations of other networks of interest and the cortico-striatal pathways were beyond the scope of this hypothesis-guided study and are also the task for future assessment. The network correlation strengths in our aged controls (mean age, 67 years) varied in the sense of slightly lower values compared with younger controls in previous studies (e.g., a mean age of 22 years in the study by Vincent et at., 2006), which was most probably due to a reduced resting-state brain activity in the DMN in normal aging as described by Damoiseaux and colleagues (Damoiseaux et al., 2008).
Conclusions
Our results show—in support of other fMRI studies (Delaveau et al., 2010; Ibarretxe-Bilbao et al., 2011; Tessitore et al., 2012; van Eimeren et al., 2009)—the crucial role of the DMN in cognitive processing and especially addressed its impact on oculomotor saccadic accuracy. The present study falsified the “sentinel hypothesis” with regard to the affectation of smooth pursuit eye movement gain and executive inhibition control; however, it seems safe to assume that the connectivity between regions within the DMN—which revealed no global significant difference between PD and controls—is involved in PD-associated saccadic hypometria, preferentially observed in the vertical direction. However, we did not observe a significant correlation between the altered connectivities (i.e., mPFC–PCC and r-HF–l-HF) and any of the oculomotor parameters. Although our PD patients were not demented (as screened by MMSE), our study demonstrated increased functional connectivity between the memory-related bilateral HF that is considered as acting in a compensatory manner as a subtle clue of possible regional dysfunction. However, these connectivity changes were not correlated with any of the investigated oculomotor parameters. In order to analyze the functional connectivity in greater detail, further studies should include the cortico-striatal pathways that are involved in the pathomechanisms of PD (Di Martino et al., 2008; Robinson et al., 2009) and are known to be associated with oculomotor abnormalities. Larger samples with greater detail in patient characteristics will be necessary to improve our understanding of the in vivo imaging correlates in the course of PD with their association to cognitive function (Braak et al., 2005; Kalaitzakis and Pearce, 2009; Sabbagh et al., 2009) and oculomotor performance.
Footnotes
Acknowledgments
The authors thank Prof. W. Becker and Dr. R. Jürgens for their support and analysis in terms of oculomotor measurements and helpful discussions.
Author Disclosure Statement
There are no competing financial or nonfinancial conflicts of interest to be disclosed.