
Abstract
Since its development, the multivoxel pattern analysis (MVPA) method has been widely used to study high-level cognitive function in the brain. The results of the MVPA indicate that the spatial pattern of functional MRI data contains useful information. In addition to the spatial pattern analysis of the brain functions, effective connectivity can also be analyzed between the spatial pattern-based information. In this article, we propose a multivoxel pattern-based causality mapping method to explore influences between the spatial pattern-based information in the brain. The method applies the Granger causality to interested regions of the brain in terms of spatiotemporal pattern-based data, which are known to play an important role in dealing with high-level functions of the brain. The method can compose a causality map throughout the entire brain for any specified region of interest. Both simulations and experiments were performed to show the performance of the proposed method, and the existence and analyzability of the connectivity between pattern-based information in the brain were verified.
Introduction
Functional magnetic resonance imaging (fMRI) has contributed to objective insights into brain functions by detecting the blood oxygenation level-dependent (BOLD) signals related to cerebral hemodynamic responses. Since the invention of the fMRI, the relationship between the brain regions and functions was the main interest of most research, and many different approaches of brain function interpretation have been proposed to understand high-level brain functions. For instance, various functional connectivity analyses have been proposed and widely used to show the interaction among brain regions in many states (Biswal et al., 1995; Boccalettia et al., 2006; Greicius et al., 2003; Hampson et al., 2002; Lowe et al., 2000; Martino et al., 2008). In particular, the effective connectivity analysis that can reveal directional information of influence between the brain regions has been highlighted as a key technology for understanding the dynamic and parallel functions of the brain (Abler et al., 2006; Deshpande et al., 2008; Friston, 2009; Gao et al., 2008; Goebel et al., 2003; Marreiros et al., 2008; Roebroeck et al., 2005). On the other hand, multivoxel pattern analysis (MVPA) has been proposed to explain virtually unlimited functions of the brain by importing spatial pattern-based brain information (Haxby et al., 2001; Kamitani and Tong, 2005; Norman et al., 2006; Peelen and Downing, 2007). The MVPA proved to be robust, which accelerated brain function studies since its development.
Inspired by the effective connectivity analysis and the MVPA, we can infer that the spatial pattern-based information in the brain is meaningful and can also have a causal relationship. However, there has been no approach to detect the causality of pattern-based information, and the necessity of the method is gathering strength (Anderson and Oates, 2010; Kriegeskorte and Kreiman, 2012; Raizada and Kriegeskorte, 2010). The causal relationship between the pattern-based brain information is expected to show dynamic features of the complex functions; hence, it can improve the understanding of brain functions. Therefore, we present a new method to analyze the causality of the pattern-based brain information.
Granger causality mapping (GCM) is one of the most widely used methods to analyze effective connectivity in the brain. The GCM imports the concept of Granger causality (Granger, 1969, 1980) to detect the influence and its direction by exploiting temporal precedence information. In the context of the Granger causality, the fMRI time series of brain regions are described using the vector autoregressive (VAR) model, which predicts current signals by linear combination of past signals. If the past signals of time series improve the prediction accuracy of the current values, it means that there is informational influence.
In conventional applications of the Granger causality into fMRI data analysis, each interested region or voxel is represented by a single fMRI time series. Recently, there have been several researches of Granger causality while taking into account the spatial information of the brain under the assumption of sparseness (Garg et al., 2011; Tang et al., 2012; Valdés-Sosa et al., 2006). In this article, to reveal the causal relationship between pattern-based information, we propose a new approach to apply the Granger causality to the interested brain regions without regressions or the assumption of sparseness. To do this, the multiple time series data are inferred as the spatiotemporal pattern-based data of the region. Through a process that is similar to the GCM, we can verify whether one pattern-based data has useful information in predicting the other by using the temporal precedence information. In other words, we can analyze the existence and direction of Granger causality between spatial pattern-based data that has been proved to be meaningful by studies using the MVPA. Similar to the GCM, the proposed method can compute directional influence between any selected two regions. The method does not require a predefined region of interest (ROI), and it can compose the Granger causality map through the entire brain for any specified ROI.
We performed simulations to confirm that the neuronal pattern Granger causality can be detected from the simulated fMRI data. We also conducted fMRI experiments using a visuomotor task to show that the pattern-based causality between visual and motor cortices can actually be detected by the proposed method.
Theory
GCM is an application of Granger causality to the brain signal, and the proposed method adopts a similar approach. Applying the VAR model, we can calculate the Granger causality that implies the directional influence using the temporal precedence (Geweke, 1982). The VAR can be applied to fit a discrete timeseries vector
where
For two arbitrary regions of X and Y in the brain, each region can be fit to the VAR independently.
where
In this case, the covariance matrix of noise
In the VAR, each element of current vector is estimated by the linear combination of its past signals and the past signals of the other elements. When the BOLD signals of two regions are considered together as a one time-variant vector, the prediction of each region can be supported by the information of the other region. In contrast, when the two regions are considered separately, each region can only use its own information. Therefore, the directional influence between the two regions can be detected, that is, if the prediction of current signals of
where
Simulation Method
fMRI data can be considered a spatially low-pass filtered and temporally subsampled neuronal signal. We designed a simulation to validate that the proposed method can detect the spatial pattern-based causality of the brain regions with reference to the previous studies which validated the appliance of GCM to fMRI (Roebroeck et al., 2005). We generated the simulated fMRI data of two brain regions, between which there are causal interactions, and analyzed the data with the proposed method to find the existing causality. The simulated fMRI was generated with consideration of the hemodynamics of the brain.
The signals
where
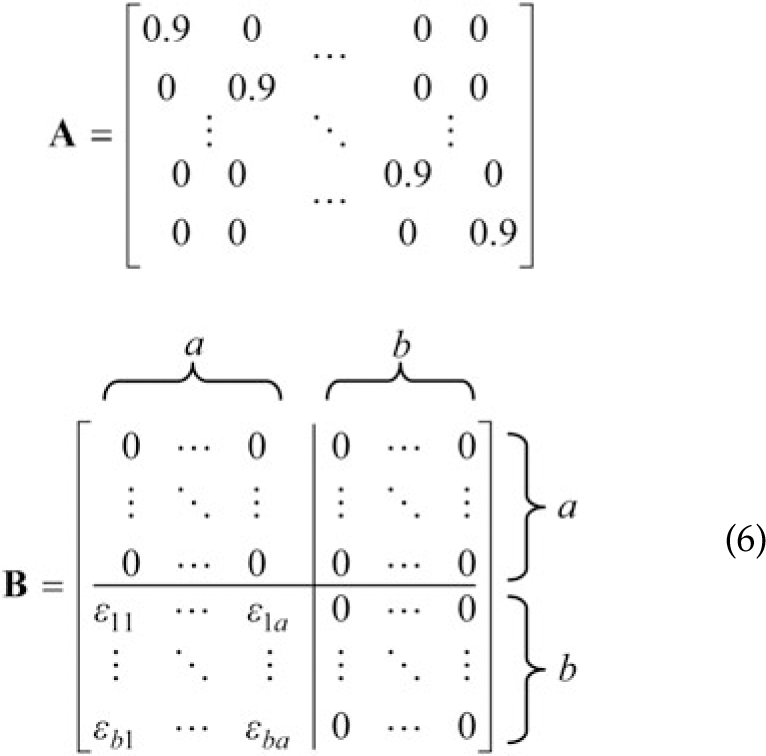
where the size of the matrices
Using this model, we can generate a simulated signal that has an influence from X to Y while adjusting the various parameters such as a and b (the numbers of voxels in the regions X and Y), I (the strength of the influence), and d (the delay of the influence). In this model, there is no influence from Y to X. The autoregressive coefficients on the diagonal of the matrix
The virtual neuronal signal of each voxel was generated with an equivalent length of 11 min with a time interval of 10 msec. The first 1 min signal was discarded for allowing steady states. Then, each resulting signal was filtered by convolution with the hemodynamic function (HRF) to simulate the BOLD signal, where the canonical HRF supplied by SPM8 (
We designed three sets of the simulations to evaluate the performance of the proposed method in different situations, as there are several parameters for the simulation, such as the number of voxels composing pattern-based causality (a and b), the number of voxels in each region used in analysis (V), the strength of the influence (I), the delay of the influence (D), the sampling interval of the scanner (TR), and the acquisition noise (E). In the first set of the simulation, we performed 1000 trials with random elements of
Simulation Result
The distributions of computed
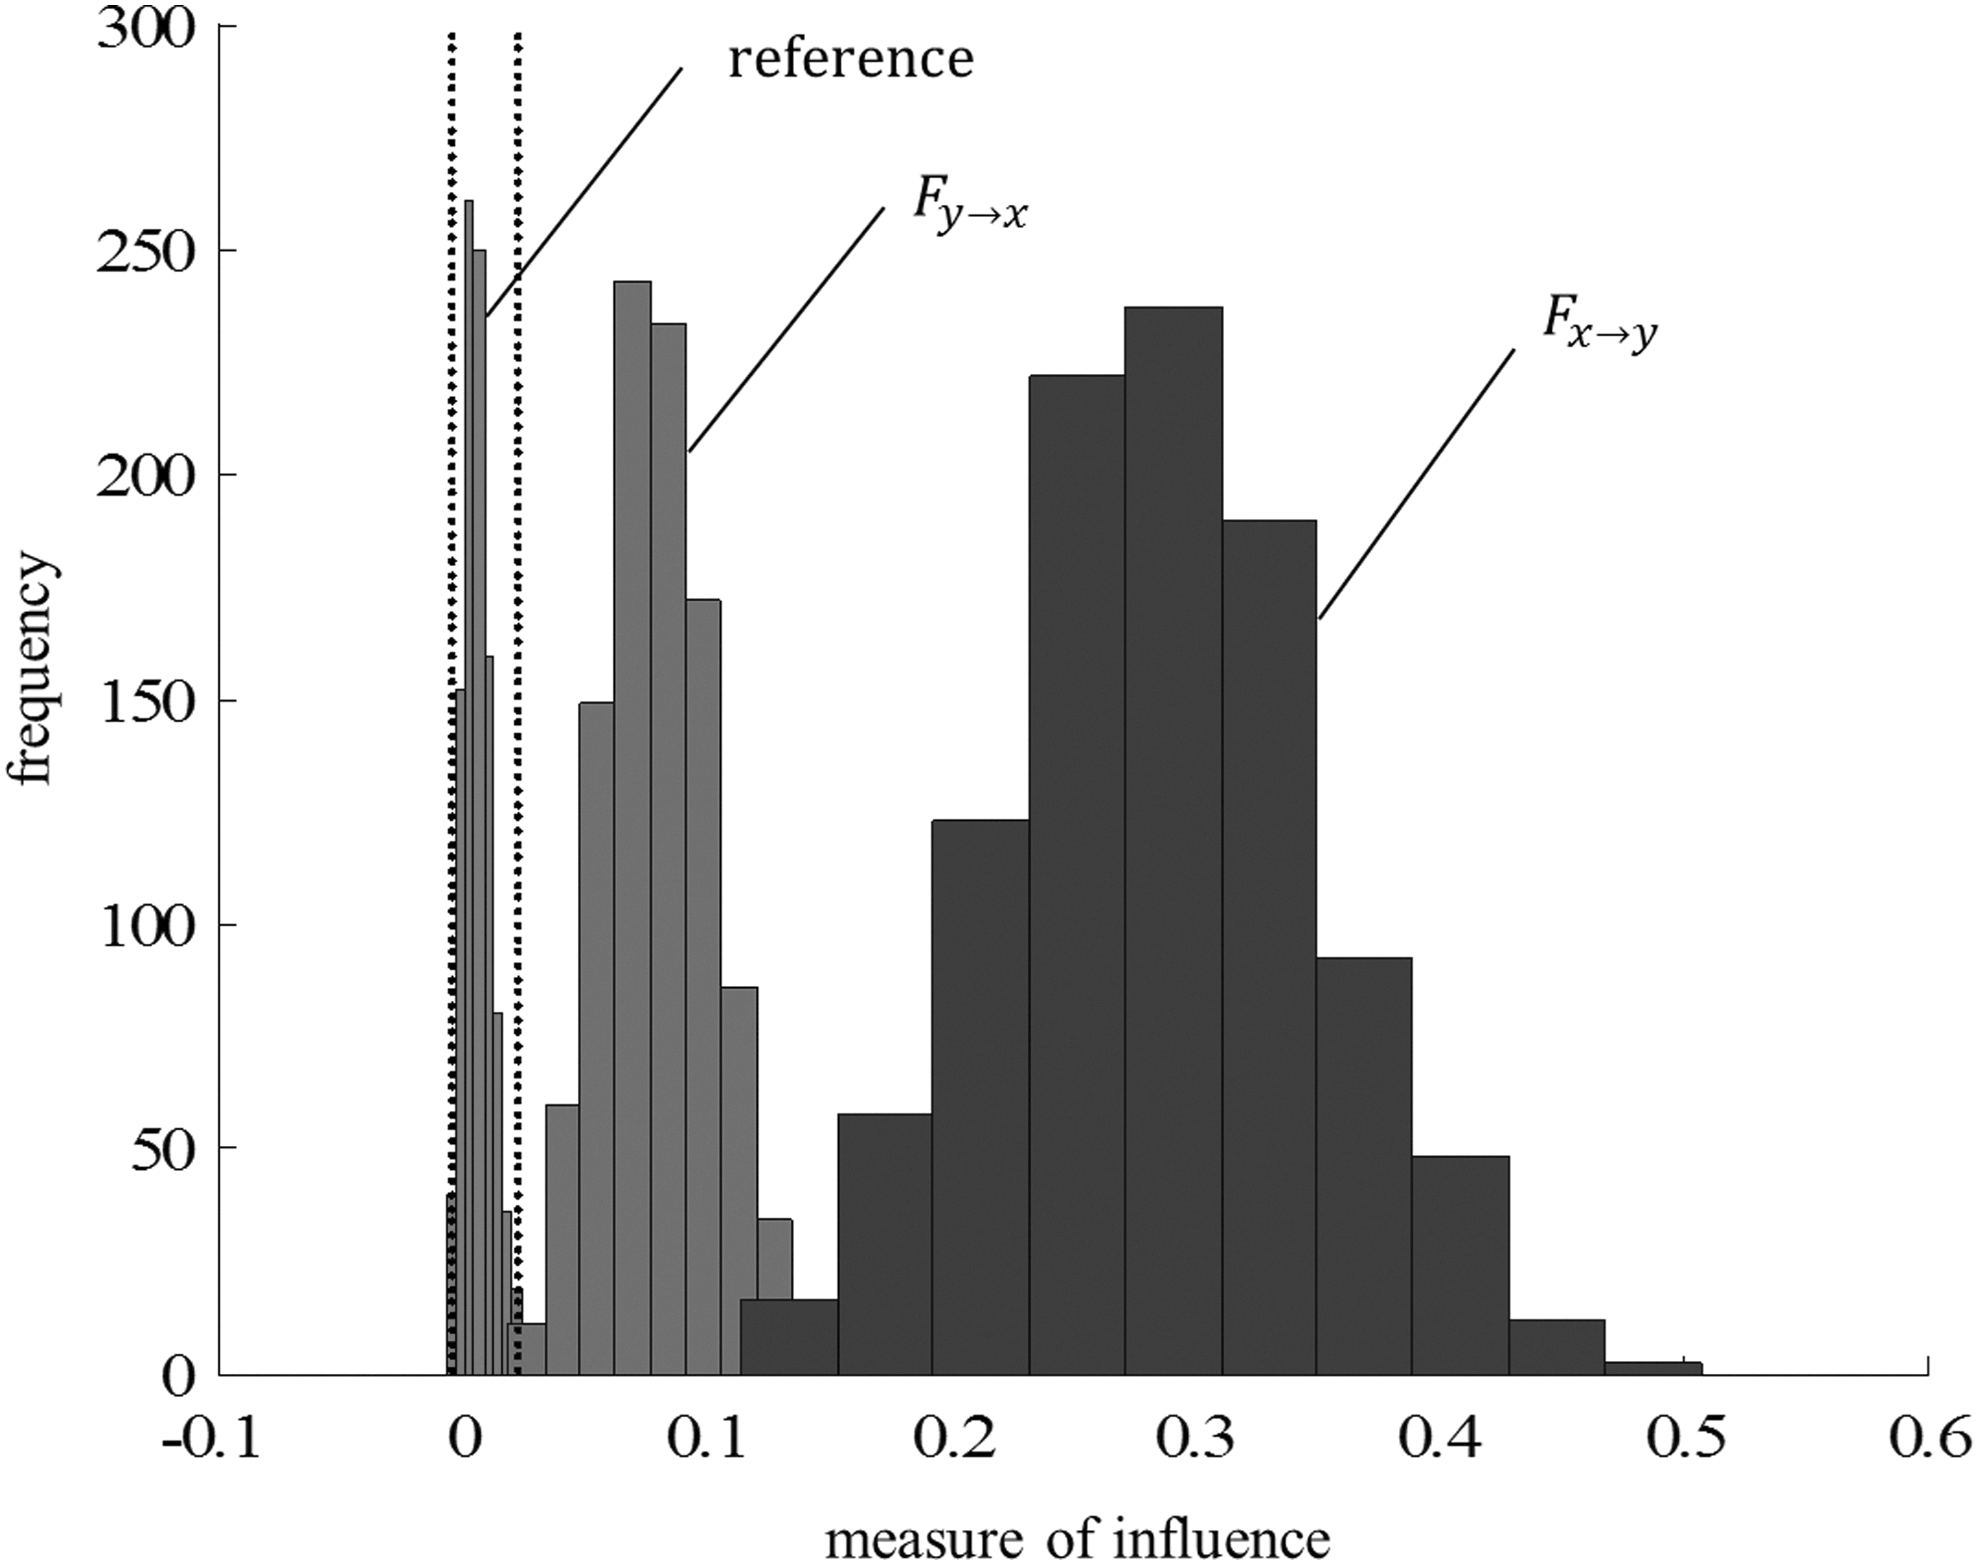
Distribution of
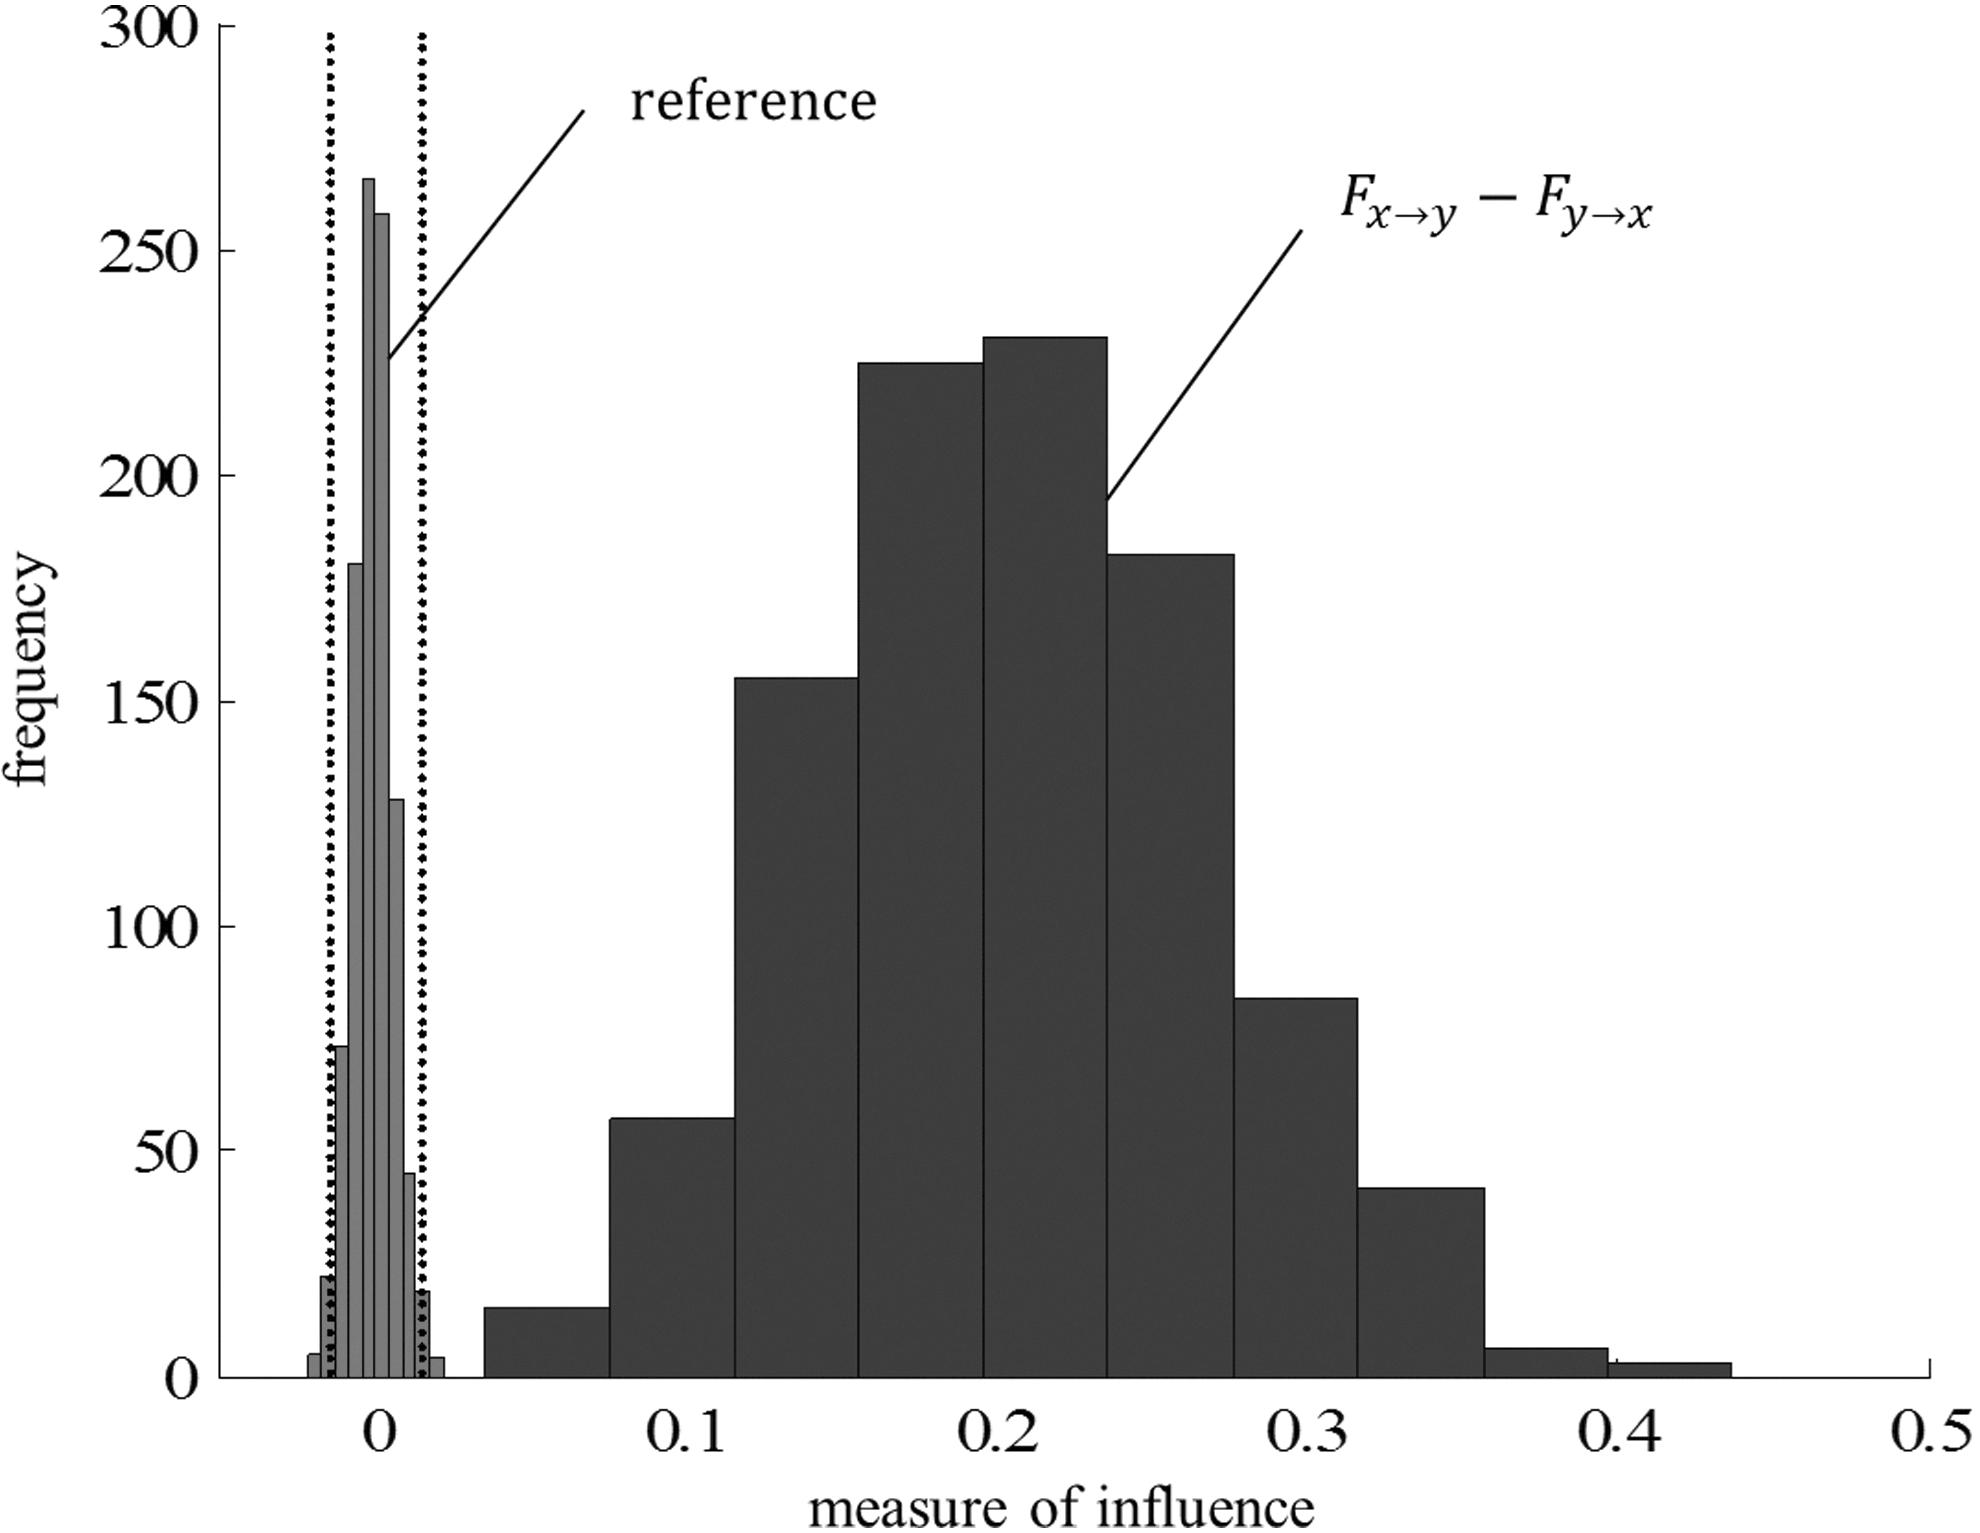
Distribution of difference between two measures,
To examine the performance of the proposed method engaging in various parameters, we performed a z-test with hypothesis
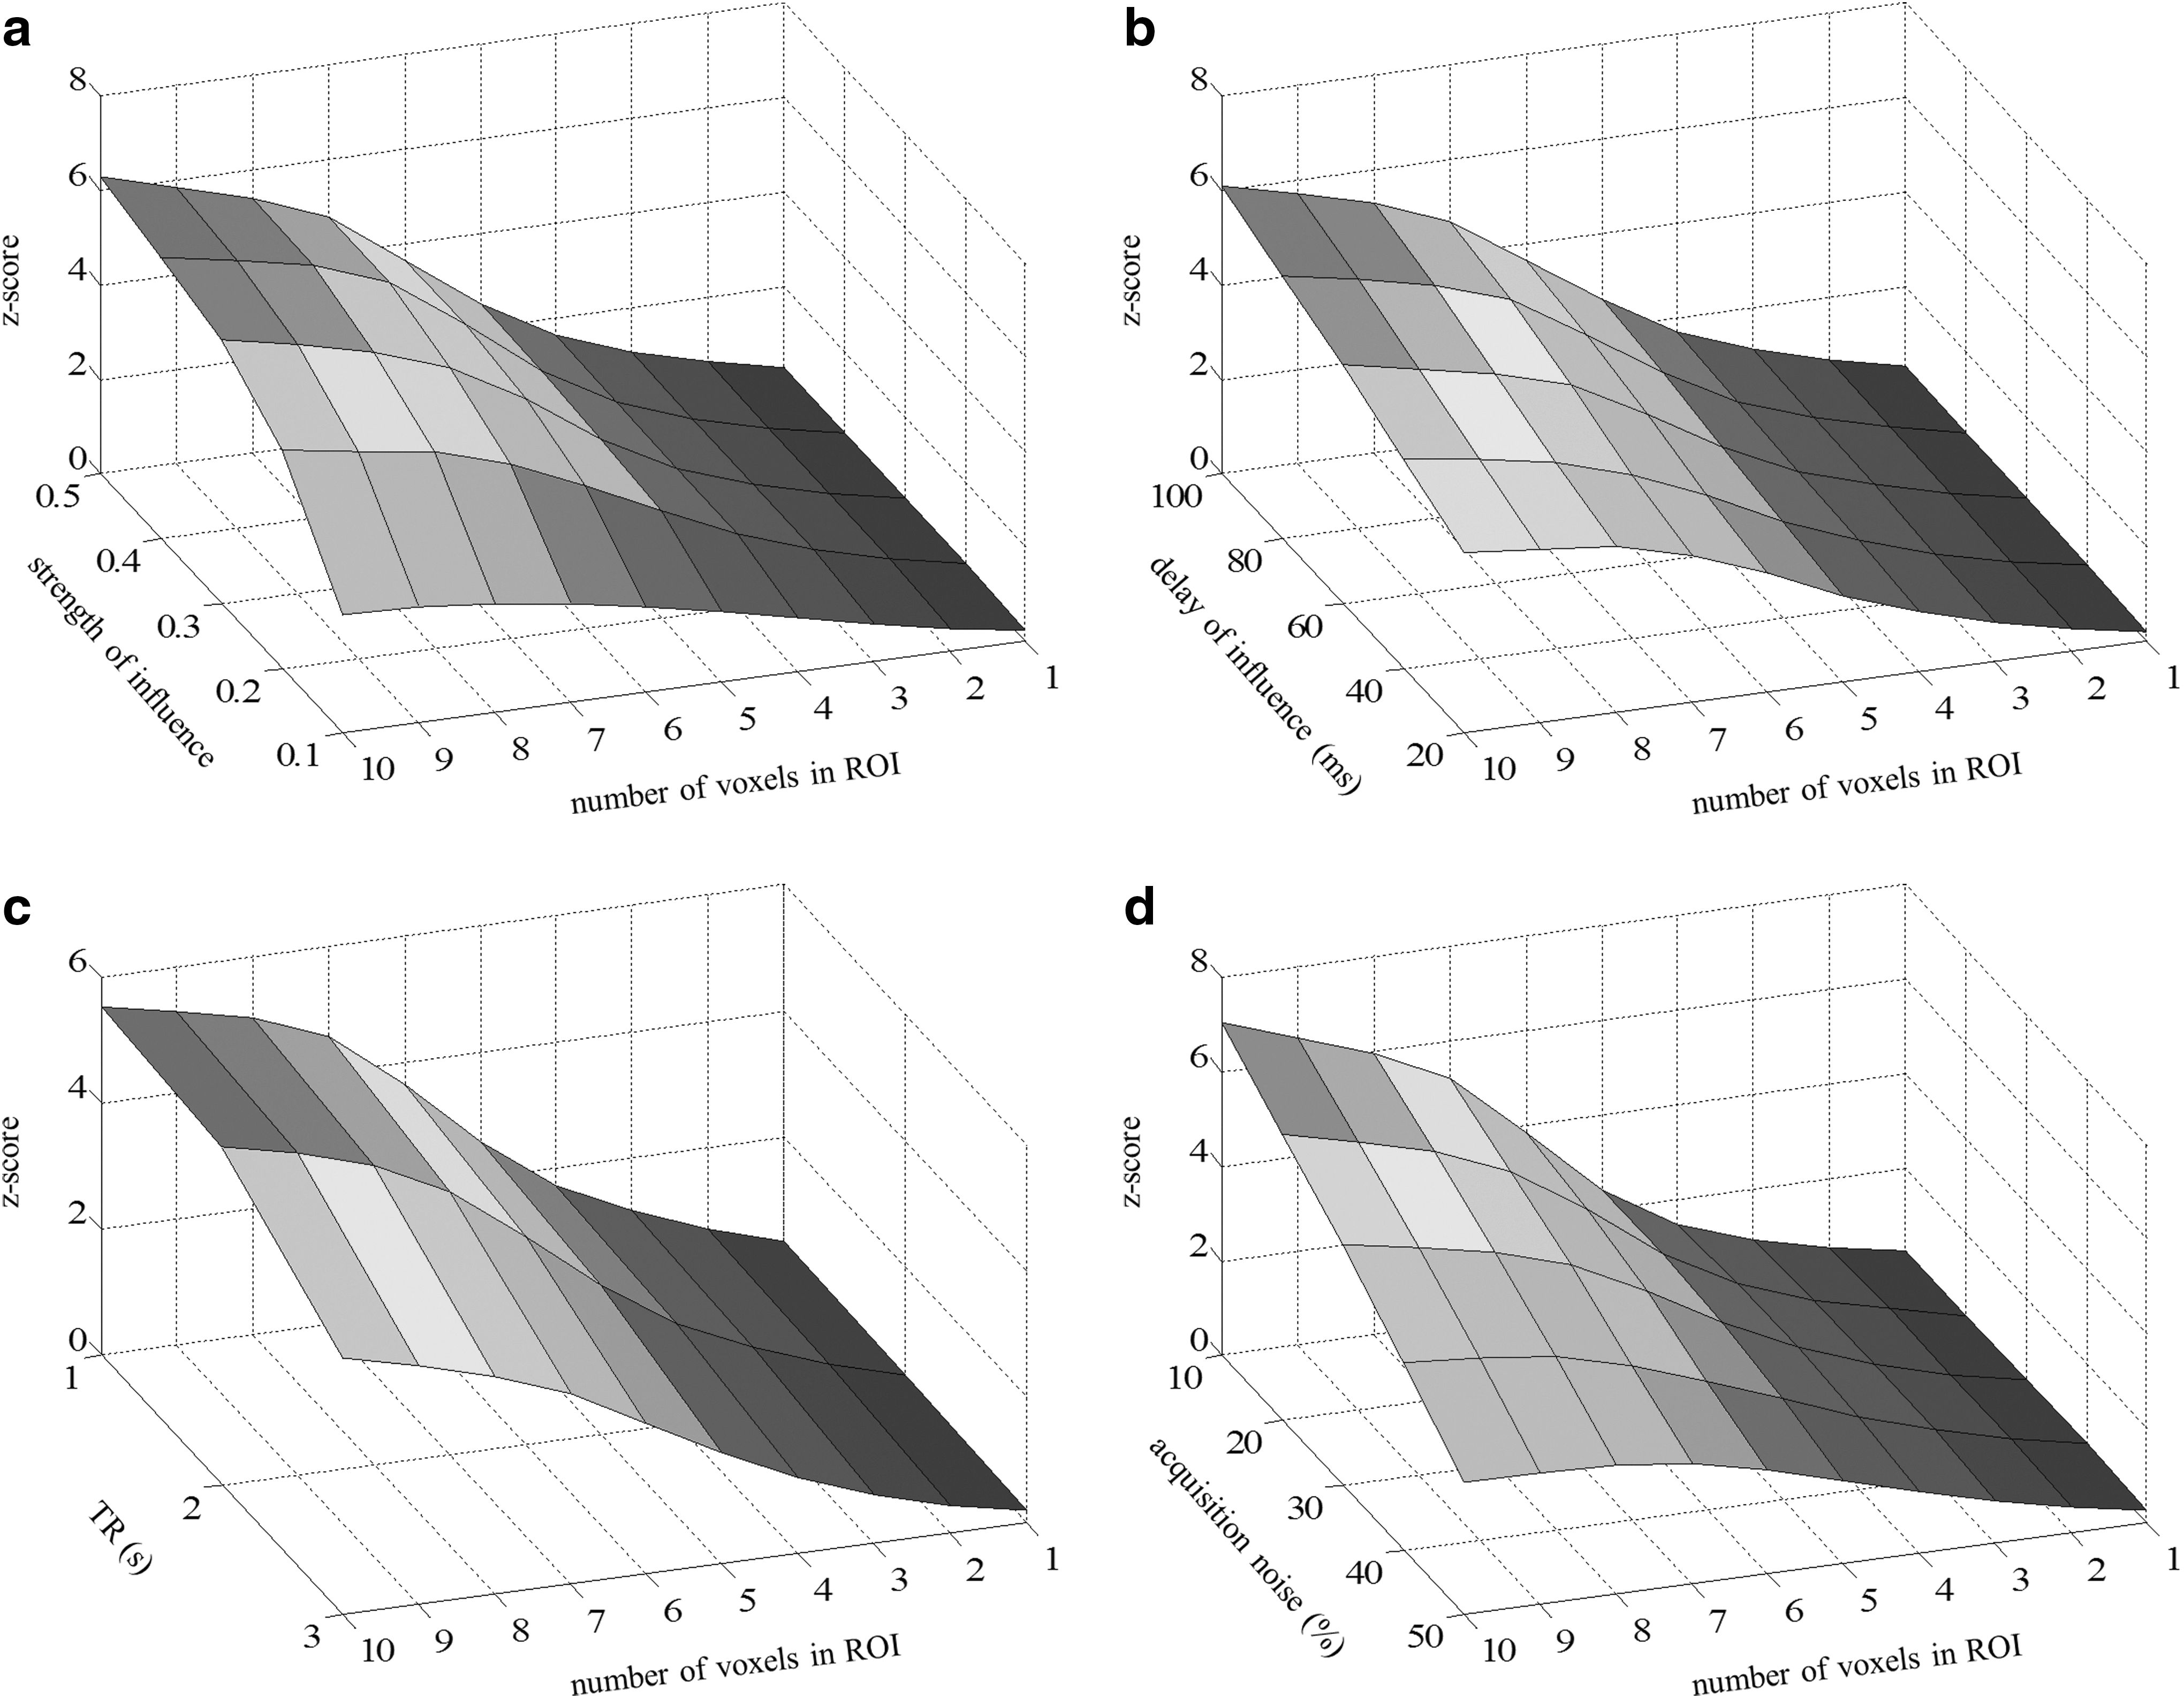
Results of the simulation showing detecting performance of the proposed method according to the number of voxels in ROI and other parameters:
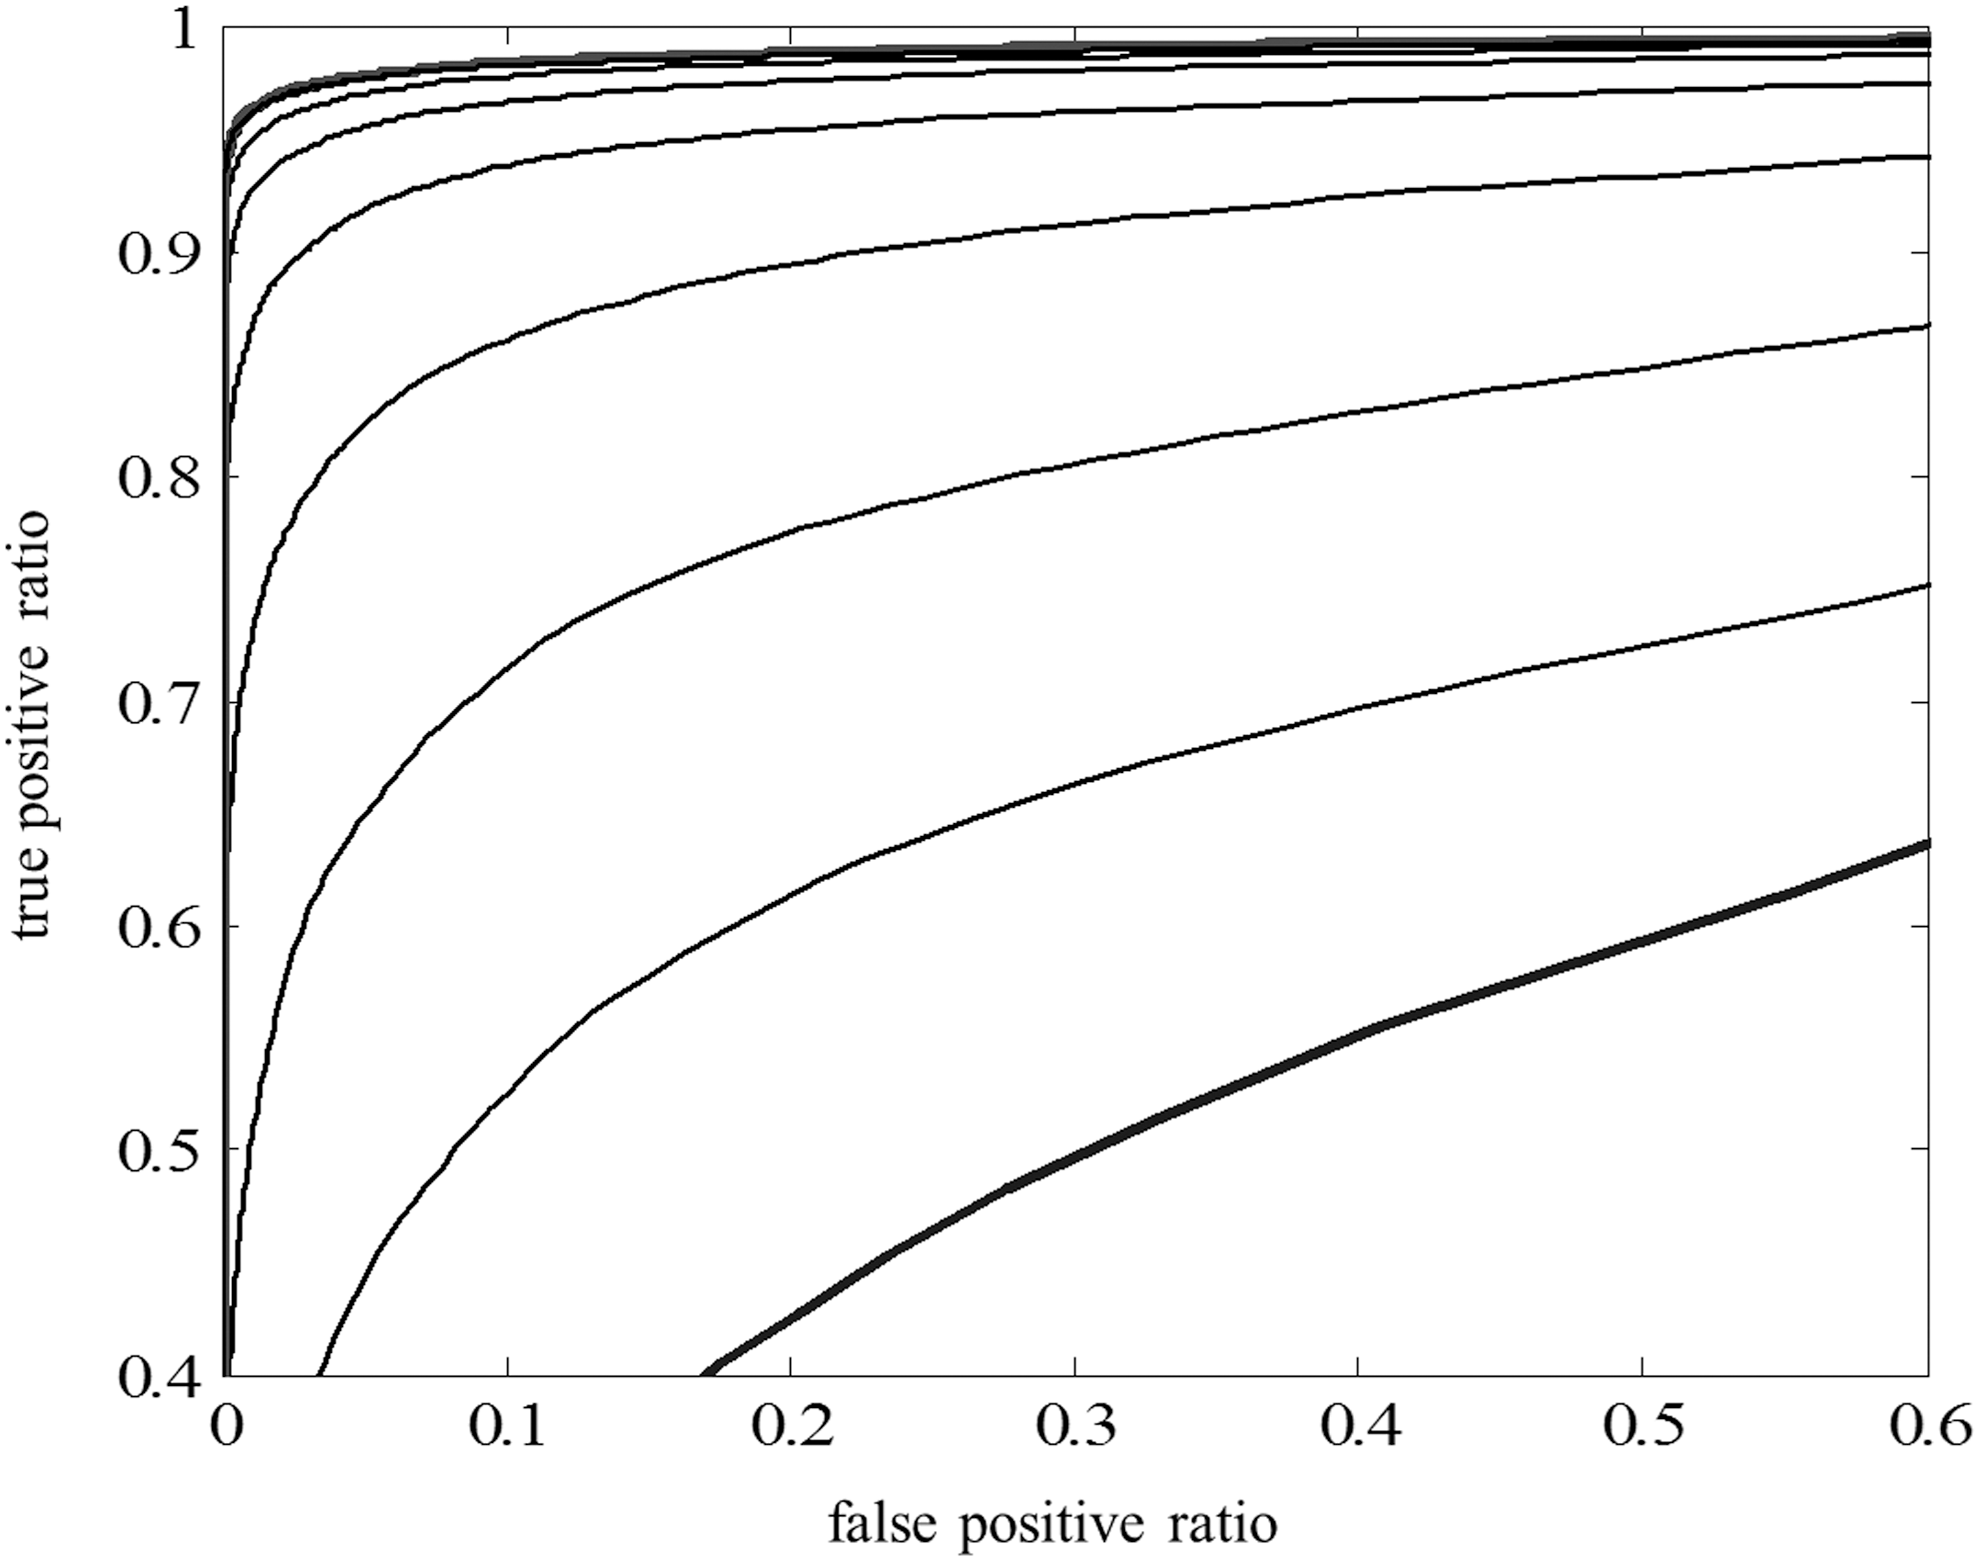
Receiver operating characteristic curve of the proposed method corresponding to the number of voxels in the ROI used in analysis. The results show better performance as the size of ROI becomes larger. The highest line showing the best performance indicates the case of 10, which is equal to the size of regions that contain causal information, and the lowest line indicates the case of one showing a similar performance with the reference case using the average time-course data of each region.
Finally, Figure 5 shows the performance according to the relationship between the number of voxels exerting the influence and the number of voxels in ROI used in analyzing. The overall performance is high when the influence is distributed in many voxels in the ROI. When the influential pattern size is fixed, the performance is improved as the analyzing ROI size becomes larger and saturated at the point that the analyzing ROI size becomes the influential pattern size. When the analyzing ROI size becomes larger than the influential pattern size, the performance is slightly reduced and the performance is practically maintained.
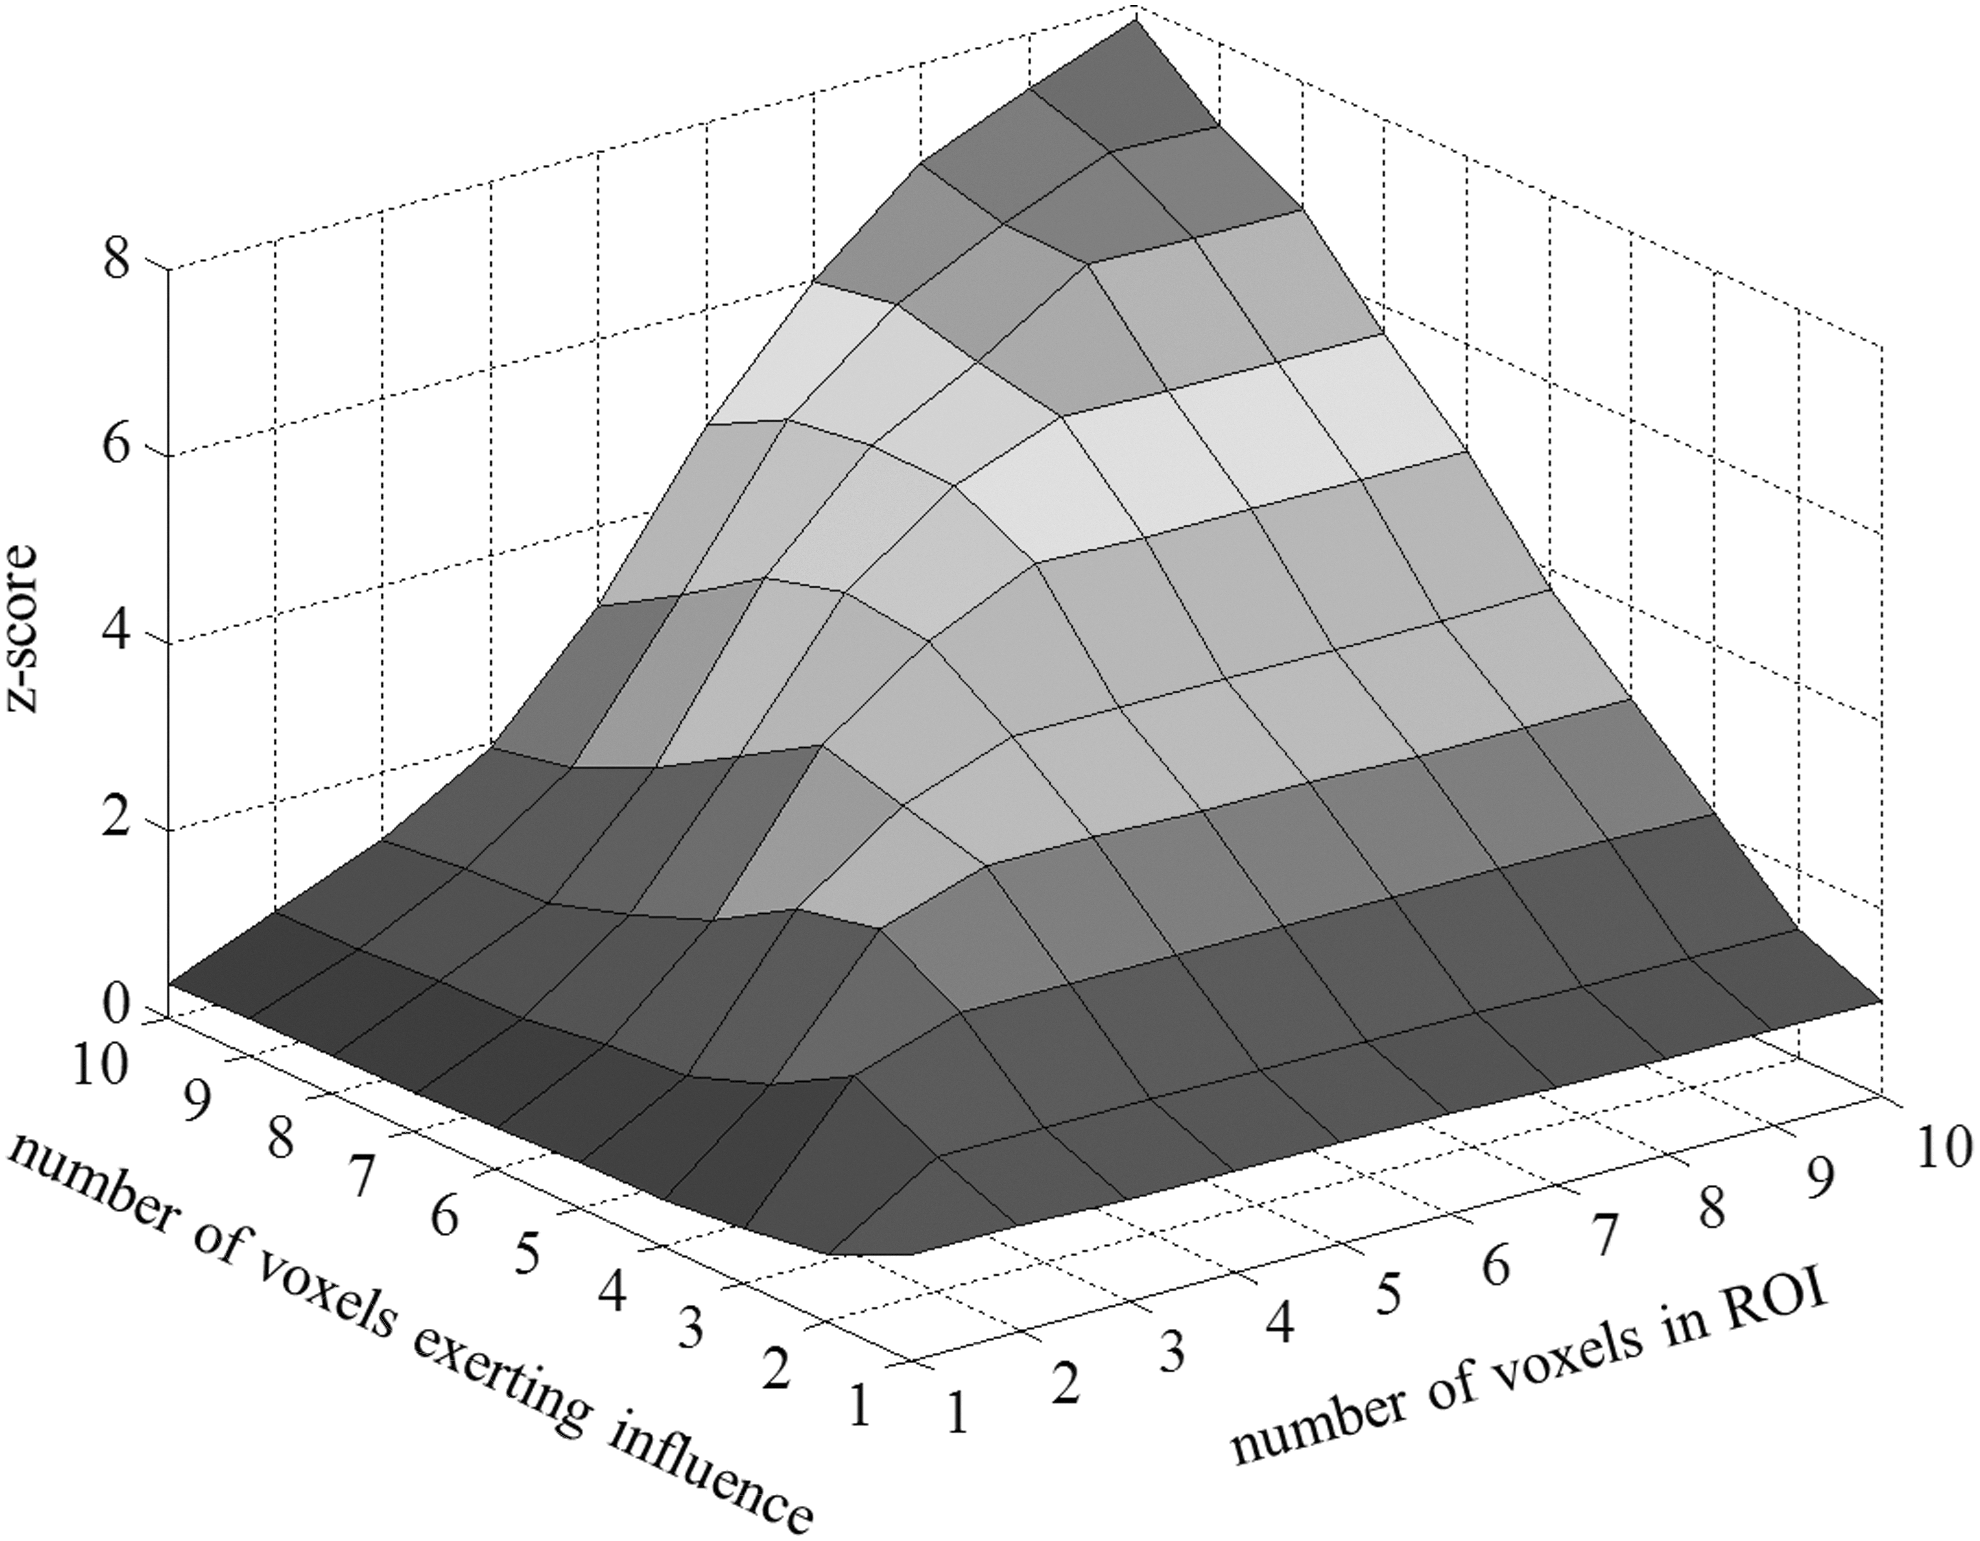
Simulation results showing the performance of the proposed method according to the relationship between the number of voxels exerting influence and analyzing ROI.
The results of the simulation suggest that the proposed method can be used to detect the pattern-based Granger causality over multiple voxels after low-pass filtering and subsampling. It was found that the performance is robust to the strength or delay of the influence, MRI acquisition noise, and TR in the case of a large number of voxels in the pattern.
Experimental Method
We applied the proposed method to actual fMRI experiments to verify the existence of the pattern-based causality in the brain and evaluated the usefulness of the proposed method for understanding brain functions. The experiment design in the previous research for GCM (Roebroeck et al., 2005) was also adopted to verify the proposed method, because the design was known to create a causal relationship between the brain regions and had desired properties. The design imported a rapid event-related paradigm. Subjects performed a visuomotor task of clicking buttons that corresponded to the displayed visual stimuli. The visual stimuli included three categories: face, house, and another object. The face and the house stimuli required a response of clicking the left hand and right hand buttons, whereas another object stimulus required no response. Since there were two responses of the left and right hand click for the two visual stimuli of face and house display, there were two possible stimulus-response mapping (S-R mapping). The S-R mapping was occasionally switched in the experiment. The face visual stimulus was known to activate the fusiform face area, and the clicking buttons caused activation in specific parts of the motor cortex. Using the rapid event-related paradigm, it could be expected that the successful performance of the task created a flow of information passing through these regions. Moreover, it was presumed that contextual information was exploited in the task, and the influences between areas involved in the control processes were persistently sustained. Therefore, the analysis would tolerate relatively low sample rates, and the whole time-course data could be analyzed to detect the causal relationship created by the task.
The experiment was composed of a slow-switching (SS) condition and fast-switching (FS) condition, and each subject participated in the experiment of both conditions. In the SS condition, the S-R mapping was switched periodically and less frequently, while it was switched randomly and frequently in the FS condition. The FS condition had a more engaging context and required a higher degree of executive control than the SS condition. Therefore, the interaction between areas was assumed to be different. If the measured influence was different according to the conditions, we could confirm that the results of the proposed method was not caused by various hemodynamic properties over the brain, as hemodynamics persist over the conditions.
The experiment was performed on 20 subjects who were right handed and had normal vision. All subjects were trained before the experiment and signed a written consent form. The images were acquired using a 3 T MRI system (Siemens Verio), a T2*-weighted echo planar imaging sequence with an echo time (TE) of 28 msec and a repetition time (TR) of 1000 msec. The image matrix size was 64×64, and the field of view was 224×224 mm2. Eighteen oblique axial slices were scanned for each volume with a thickness of 5 mm and a splice gap of 1 mm. 530 volumes were scanned for both SS and FS conditions. Anatomy images were obtained using a T1-weighted MPRAGE sequence with a TE of 28 msec, a 3D image size of 256×256×192, and a voxel size of 1×1×1 mm3. The display of stimuli and the gathering of responses were guided by the E-prime 2.0 software (Psychology Software Tools). The S-R mapping was changed 24 times at every two to six trials in the FS condition, and it was changed eight times at every 15 trials in the SS condition. The stimulus onset asynchrony was 2–6 sec for both conditions. The mapping cue was indicated by changing the color of the fixation cross to magenta for mapping 1 and cyan for mapping 2, and was displayed for 500 msec at the beginning of each trial. Trial stimuli consisted of five pictures for each face, house, and object, and were displayed for 120 msec following the mapping cue. Feedback was displayed for 500 msec at the end of each trial by changing the color of the fixation cross to green for a correct response and red for an incorrect response. Each experiment continued for 45 trials, which consisted of 15 trials for each of the face, house and object stimuli. The face, house, and object stimuli were shown in pseudorandom order.
Preprocessing was performed by SPM8, and the visualization of the experimental results was guided by Brain Voyager QX (Brain Innovation). Each volume was registered to the Colin brain template supplied by Brain Voyager, and corrected for slice timing. The FFA and the visual cortex were detected by SPM8 using a general linear model (GLM). The iterative approach was applied to FFA, and the visual cortex was applied to locate specific regions that contained a distinct influence. The regions having a causal relationship with the FFA are detected by the proposed analysis. The visual cortex that significantly affects the FFA is considered a new ROI of the visual cortex. Next, the most influenced region from the new ROI of the visual cortex is detected and treated as a new ROI of the FFA again. These procedures are repeated until the two regions are not changed. For every subject, the converging 3×3×3 cubic region of FFA was analyzed, and the region was selected as ROI. The spatial smoothing was applied only for the initial GLM analysis, whereas any spatial smoothing filter was not applied for the proposed pattern-based analysis, as it may reduce the spatial pattern information (Norman et al., 2006). Every spatiotemporal data in the 3×3×3 cubic window in the brain were analyzed to map the differential pattern-based Granger causality over the entire brain. For each region, we collected 20 samples of
Experiment Result
The experiment results of the proposed method are shown in Figure 6. The FFA was selected as ROI and is shown in the red circle. The visual cortex indicated by the green color shows a negative influence, confirming that the visual region influences the ROI. The motor cortex indicated by the blue color shows a positive influence. Thus, the motor region is influenced by the ROI. Overall, it can be inferred that there is a relay of information flowing through the visual cortex, FFA, and the motor cortex. From this result, a specific part in the frontal robe also shows a strong positive influence. Possibly the processing system involved in the given task is not direct from the visual cortex to the motor cortex, but requires additional functions, and it can be inferred that the frontal lobe is also related to the performing of the task. The frontal robe is known to be engaged in the decision making (Andersen and Cui, 2009; Barraclough et al., 2004; Bechara et al., 2000; Heekeren et al., 2004; Lee et al., 2007), and we presume the function is required to accomplish the task successfully.
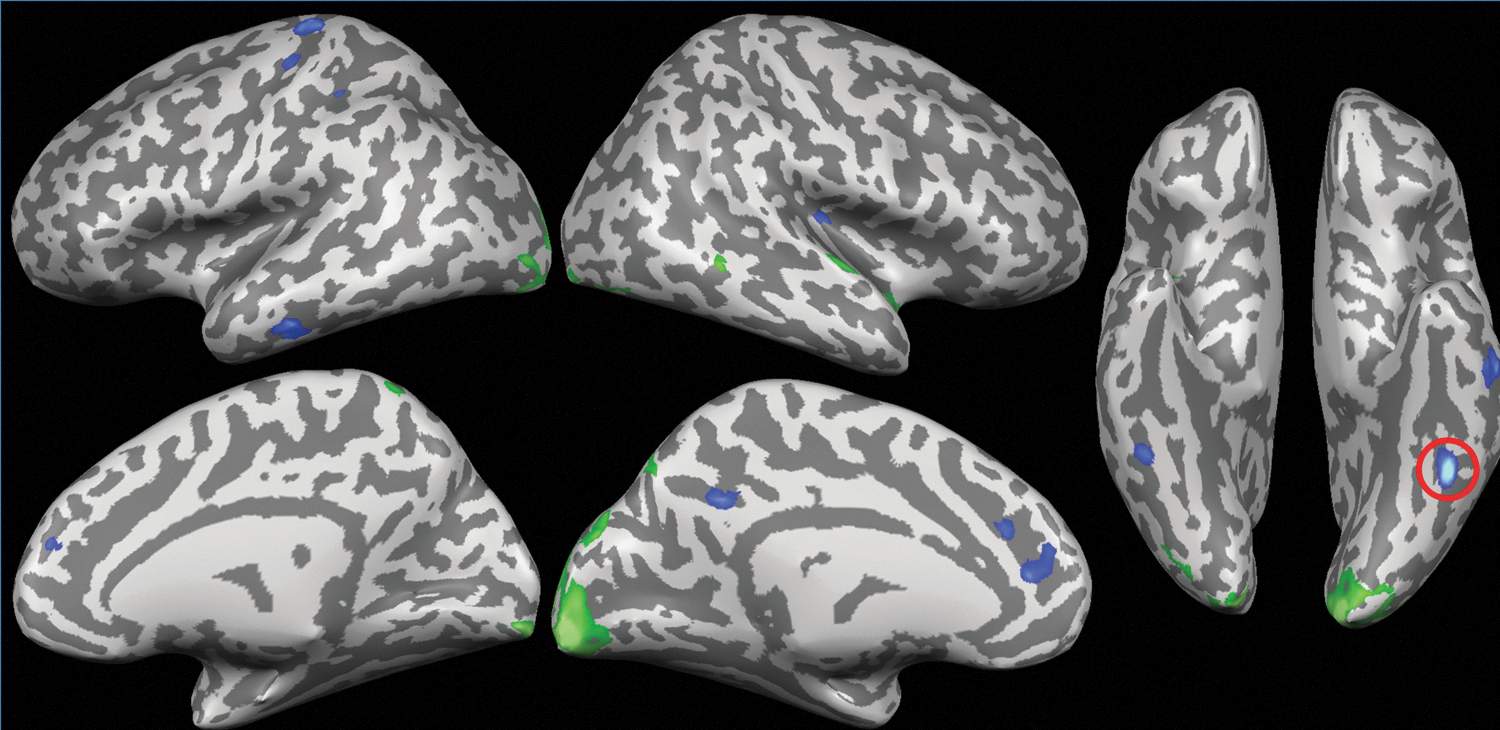
Experimental results of the proposed method applied to the functional magnetic resonance imaging experiment showing the regions that interact with ROI. The circled face-selective region was selected as ROI. A significant negative differential Granger causality (p<0.001) was detected in the green regions of the visual cortex, which exert influence on the ROI. The blue regions were analyzed to have a positive differential Granger causality (p<0.01), which received influence from the ROI.
We investigated the SS and FS conditions separately to confirm that the resulting interaction is caused by the influences between regions, not by the variability of the hemodynamic response over the brain. The results from SS and FS conditions are shown in Figure 7. Both results show the connection between the visual and motor cortex, while the shapes of the detected regions have different patterns. In particular, in the frontal lobe and the motor region, a stronger positive influence was detected in the FS condition. A statistical test was performed to show that there was a significant difference between the results of the SS and FS conditions. The null hypothesis was that there was no difference between the results of the two conditions. We adopted the method controlling the false discovery rate (FDR) (Genovese et al., 2002). The FDR-based hypothesis testing controls q, which was the expected proportion of false positives within all tests. The result showed that there was a significant difference between the results of the SS and FS conditions (q=0.05), whereas the difference was not affected by the hemodynamic responses. Therefore, we can conclude that the proposed method works as intended.
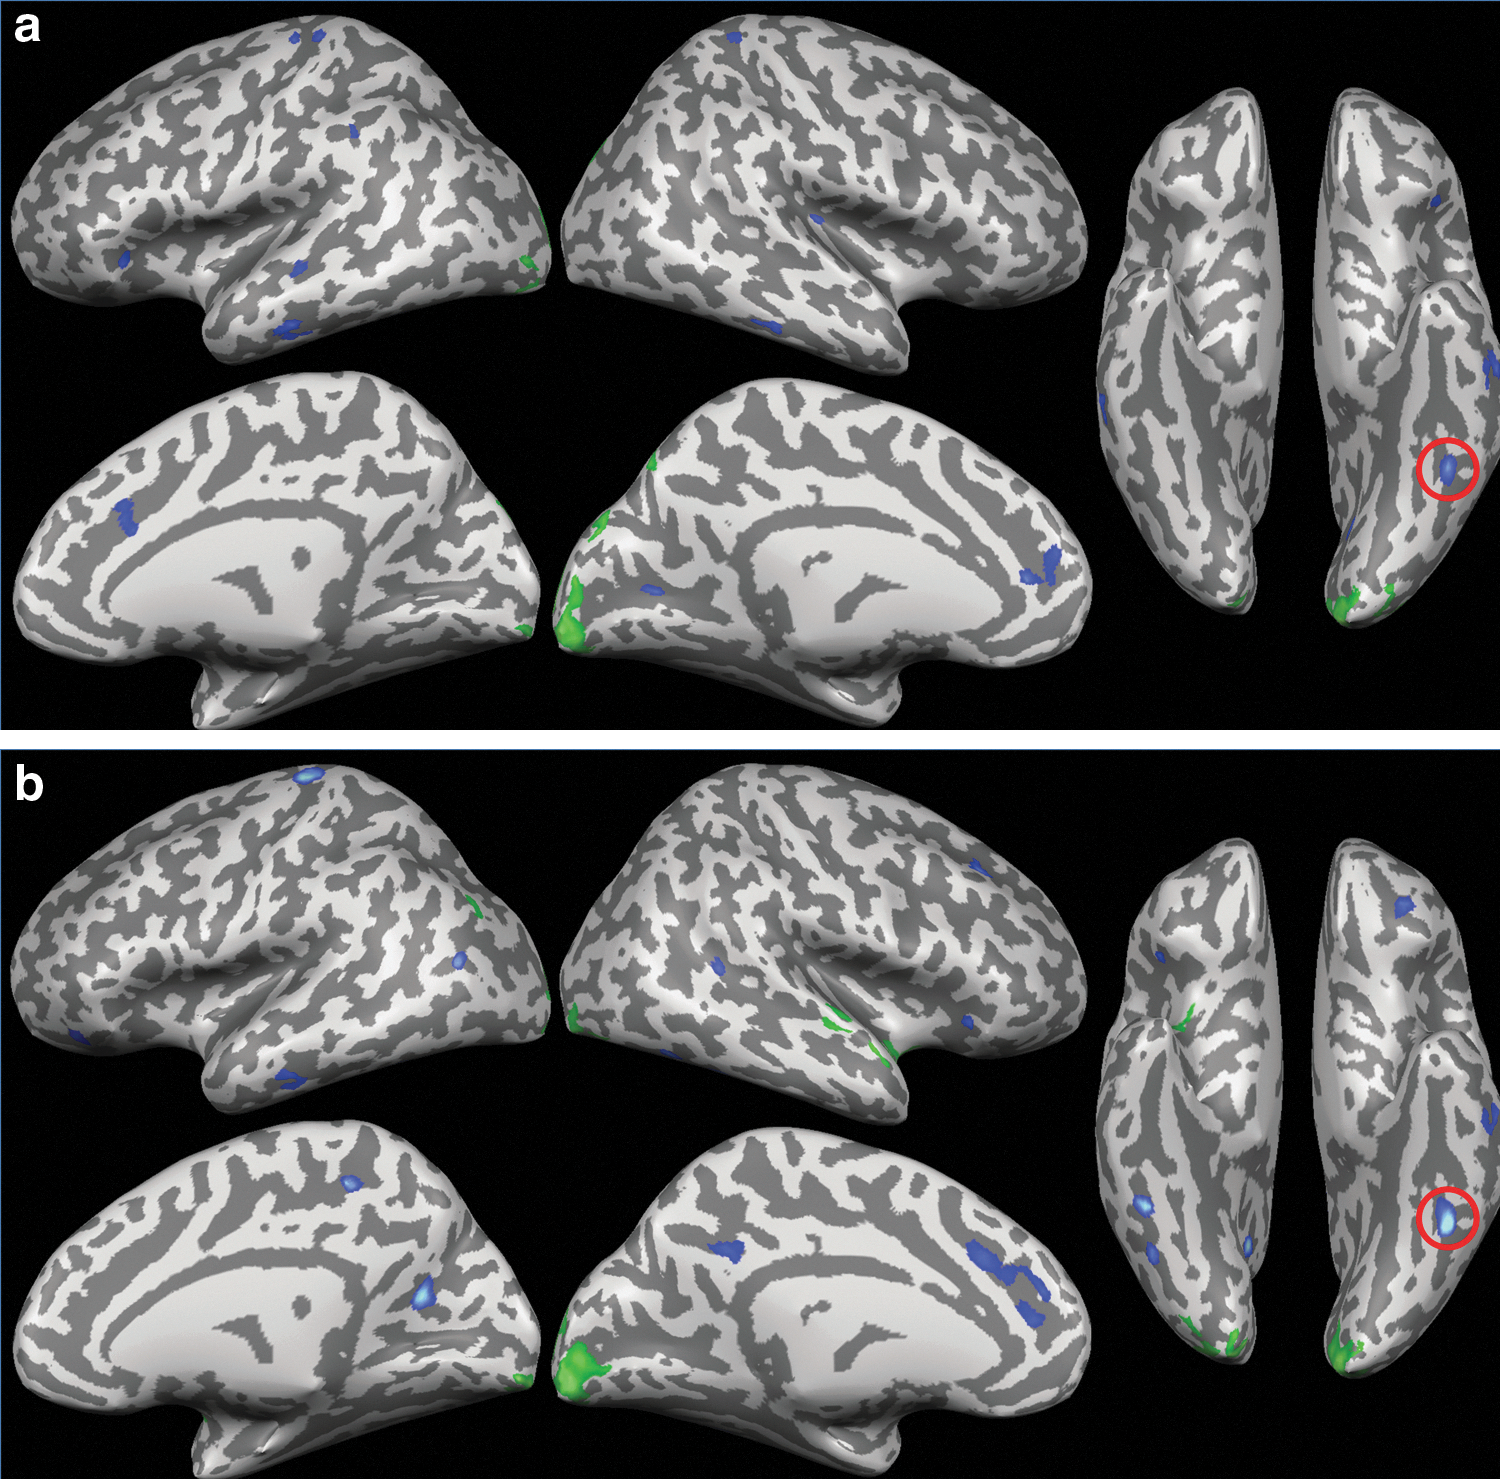
The experimental results that were analyzed separately with
It was also needed to confirm that the analyzed influences are based on pattern-based information and not on overall changes of intensity in the regions. To exclude this confound, we analyzed the data again in the same way except for spatially averaging over voxels within each region. As a result, we confirmed that there is no significant region showing an interaction with the ROI (p<0.01), as the pattern-based influence information was removed by spatial averaging.
Discussion
We proposed the multivoxel pattern-based GCM to explore the influences between high-level spatial pattern-based information in the brain. The proposed method can be applied to fMRI data using the same procedure of GCM (Roebroeck et al., 2005), except for taking the ROI as a spatial region of the brain. The simulation results showed the ability of the proposed method in detecting the influence after the hemodynamics and MRI acquisition process, and the experiment results showed the practical application of the proposed method in analyzing the existing influence.
There have been considerable debates whether the Granger causality can reveal the underlying neuronal influence, while variation in the hemodynamic latency and subsampling exists. Some simulation studies (Smith et al., 2011) insisted that the Granger causality was determined by the confounding hemodynamic latencies. Nonetheless, many studies (Schippers et al., 2011; Wen et al., 2012) have shown different results. They concluded that the influence detected by the Granger causality was likely to be true even at the neuronal level, and Granger causality was a reliable method for analyzing influence in fMRI data. In addition, Deshpande and Hu concluded that simulations should not be treated as the final results, because they were bounded by assumptions and simplifications (Deshpande and Hu, 2012). Since we assumed that there were meaningful pattern-based interactions based on the model, we adopted the VAR model to the proposed method and validated the proposed method in detecting the pattern-based Granger causality in fMRI signal under the circumstance of hemodynamics and subsampling.
The order of the VAR model in the proposed method was determined by the SC. It is known that the optimal order of the GCM is almost exclusively one when TR is 1000 msec (Roebroeck et al., 2005), and the tendency is maintained when detecting the pattern-based information.
The shape of the window in analyzing the experimental data was set to 3×3×3 cubic. The pattern-based information in the brain is presumed to be dependent on functions, and most studies using MVPA have adopted a larger window. As shown in Figure 5, there is a considerable possibility that the accuracy of the proposed method can be improved by using a larger window. Therefore, it is encouraged to apply a large window in the proposed method. However, a required temporal length of the time-course data to fit the VAR model is exponentially increased as the size of ROI increases when we apply the conventional fitting algorithm. Thus, it can generate problems related to the concentration or fatigue of subjects. There is a tradeoff between the ROI size and the required experiment time. A possible solution to fit the VAR model with the shorter time-course is the ridge-regression approach (Ahmad et al., 2012; Douglas et al., 2001), which introduces an additional parameter in order to solve an ill-posed problem. Since the ridge regression is a regularization method and does not guarantee ideal output, further research about the tradeoff between increasing the size of the window and importing the ridge-regression can be helpful in dealing with this issue.
Since any spatial smoothing was not applied to the experimental fMRI data in order to preserve the spatial pattern-based information, the noise model of the fMRI data can be more ambiguous than the conventional fMRI data analysis. To confirm that the proposed method has robust performance against the noise model, we performed a simulation that the simulated fMRI data were generated using the noise models of the uniform, skewed-normal, and bimodal-normal distribution, respectively. All noises were applied to all three stages of exerting error in the simulation, such as generation of the neuronal signal, BOLD signal, and the fMRI data. All noises had the same mean and standard deviation. Though the noise models were different, the performances were much similar in all cases of the noise models. From the result, we concluded that the proposed method had robust performance against the noise model.
Recently, it has been reported that the GCM is robust to changes in hemodynamic response properties unless the changes are accompanied by severe downsampling (Seth et al., 2013); therefore, it can be a helpful further research that investigates the properties when the proposed method is applied.
In conclusion, we proposed a method that could explore the influence between multivoxel pattern-based information, which was known to deal with high-level function in the brain, by adopting the concept of Granger causality. The existence and the analyzability of the influence were verified through the simulations and the real fMRI experiments. The proposed method can be applied to map the pattern-based influence related to ROI over the entire brain. The proposed method is expected to contribute in improving the understanding of the dynamic features of high-level information in the brain.
Footnotes
Acknowledgment
This work was supported by the National Research Foundation of Korea (NRF) grant funded by the Korea government (MEST) (No. 2010-0018833 and No. 2009-0079457).
Author Disclosure Statement
No competing financial interests exist.