
Abstract
Distinctive cortico-striatal circuits that serve motor and cognitive functions have been recently mapped based on resting state connectivity. It has been reported that age differences in cortico-striatal connectivity relate to cognitive declines in aging. Moreover, children in their early teens (i.e., youth) already show mature motor network patterns while their cognitive networks are still developing. In the current study, we examined age differences in the frontal-striatal “cognitive” and “motor” circuits in children and adolescence, young adults (YAs), and older adults (OAs). We predicted that the strength of the “cognitive” frontal-striatal circuits would follow an inverted “U” pattern across age; children and OAs would have weaker connectivity than YAs. However, we predicted that the “motor” circuits would show less variation in connectivity strength across the lifespan. We found that most areas in both the “cognitive” and “motor” circuits showed higher connectivity in YAs than children and OAs, suggesting general inverted “U”-shaped changes across the lifespan for both the cognitive and motor frontal-striatal networks.
Introduction
Resting state functional connectivity magnetic resonance imaging (rs-fcMRI) is a noninvasive imaging technique that measures correlations in spontaneous low-frequency blood oxygenation level dependent (BOLD) signals when participants are at rest. Brain regions that show temporally coherent signals purportedly comprise integrative networks with similar functions and anatomical connections (Fox and Raichle, 2007; Fox et al., 2007). Compared with task-related functional MRI, rs-fcMRI is more child and older adult (OA) friendly due to its short scanning time and avoidance of confounds of age differences in task difficulty. Within the last decade, a growing number of studies have utilized rs-fcMRI to explore changes in brain networks over development and aging, and have identified age differences in multiple brain networks, such as the default mode network (Fair et al., 2009), and motor and cognitive control networks (Fling et al., 2011, 2012; Kelly et al., 2009a; see Vogel et al., 2010 for review).
Recently, several studies have identified distinctive cognitive, motor, and reward cortico-striatal circuits based on connectivity between individual striatal seeds and their cortical projections (Di Martino et al., 2008; Kwak et al., 2010). In healthy young adults (YAs), it has been reported that the caudal putamen is correlated with primary and supplementary motor cortices (i.e., the “motor” circuits) whereas the rostral putamen has patterns of connectivity with frontal cortical regions (Di Martino et al., 2008). In addition, there is a dorsal/ventral distinction in caudate connectivity. Specifically, the most dorsal caudate (DC) seed is primarily associated with dorsal lateral prefrontal cortex (PFC) and other cognitive control regions (i.e., the “cognitive” circuits), and the most inferior caudate seed is primarily associated with limbic areas (Di Martino et al., 2008). Using the same approach, Kwak and coworkers (2010) observed similar “cognitive” and “motor” cortico-striatal circuits in normal aging and patients with Parkinson's disease. In addition, the authors found that medication (i.e., L-dopa) could cause differential changes between these two circuits; L-dopa restored connectivity strength much more in the “motor” circuits than in the “cognitive” circuits. Similar L-dopa modulations on the “cognitive” and “motor” circuits have also been reported in healthy YAs (Kelly et al., 2009b). These results have illustrated that the distinctive striatal circuits exist in healthy YAs and OAs as well as patient population.
A number of developmental studies in early school age children have demonstrated that maturation of primary sensory and motor areas precedes that of association areas involved in cognitive functions (Giedd et al., 1999; Gogtay et al., 2004). This sequence is consistent with early developmental milestones where sensory and motor functioning matures earlier than the major cognitive abilities. Recently, a handful of rs-fcMRI studies have revealed that the brains of infants, children, and YAs possess qualitatively similar functional architectures [see Power et al. (2010); Vogel et al. (2010) for review]. Children at ages of 11–13 had similar patterns of functionally connected networks compared with YAs (19–25 years of age). However, the size and the strength of the functional connectivity were different between children and YAs, suggesting continuous development during adolescence (Jolles et al., 2011). It has been suggested that the organization of functional networks shifts from short-range local architectures to more distributed networks in YAs, by weakening short-range functional connectivity and strengthening long-range connectivity (Wang et al., 2012). Further, a recent study has suggested differential developmental patterns between primary sensorimotor and cognitive networks (de Bie et al., 2012). In a group of children aged 5–8 years, networks supporting basic motor function and sensory processes had functional organization similar to mature adults while networks involved in higher-order cognitive functions had immature characteristics (i.e., fragmented networks), indicating less-developed functional connectivity (de Bie et al., 2012). It is not clear whether healthy aging would demonstrate a reverse pattern compared to early development. In other words, it is unknown whether cognitive networks decline earlier than the sensory and motor networks in aging.
It is known that aging has a detrimental impact on many cognitive functions (Fiocco and Yaffe, 2010; Park et al., 2001; Rosano et al., 2005; West, 1996). However, normal aging does not necessarily affect OAs' performance on some simple motor tasks although they may recruit additional cognitive resources compared with YAs (Bo and Seidler, 2010; Huxhold et al., 2006; Lindenberger et al., 2000). Previous anatomical studies have consistently reported that aging brain undergoes differential changes across regions; the prefrontal areas show the greatest volumetric declines compared with other parts of the brain (Lemaitre et al., 2012; Raz et al., 1997, 2005; Tisserand et al., 2002, 2004). Such selective declines have been associated with compromised cognitive functions, including executive functions (Cardenas et al., 2011; Du et al., 2006) and episodic memory in aging (Pardo et al., 2007; Petersen et al., 2000; Rusinek et al., 2003). Thus, it can be argued that cognitive networks may decay earlier or to a greater extent than motor networks, showing the inverse pattern to what is observed during early development. However, the distinct cortico-striatal circuits in aging are still unclear.
It appears that the cognitive networks exhibit more extensive developmental changes in children (de Bie et al., 2012; Jolles et al., 2011), and more declines in aging (Ystad et al., 2011) than motor networks. Since previous studies have focused on either children or OAs, it was the goal of the current study to combine children, YAs, and OAs in one single study and employ the distinctive “cognitive” and “motor” frontal-striatal circuits as a test-bed to examine age differences. This approach allowed us to directly compare connectivity strength of each circuit across all age groups. Three “cognitive” seeds (inferior ventral striatum [VSi] 9, 9, −8; superior ventral striatum [VSs] 10, 15, 0; dorsal caudate [DC] 13, 15, 9) and three “motor seeds” (dorsal caudal putamen [DCP] 28, 1, 3; dorsal rostral putamen [DRP] 25, 8, 6; and ventral rostral putamen [VRP] 20, 12, −3) based on Di Martino and colleagues (2008) and Kwak and associates (2010) were employed. We predicted that the strength of the “cognitive” frontal-striatal circuits would follow an inverted “U” pattern across age. That is, children and OAs would have weaker connectivity (i.e., activity would be less positively correlated between striatal seed regions and frontal areas) than YAs. However, we predicted that the “motor” circuits would show little age differences on connectivity strength compared with the “cognitive” circuits.
Methods
Participants
Participants who were reported in the current article were pooled from three different projects at the University of Michigan. They included 21 children and adolescents between the ages of 10 and 17 years (mean±SD=13.5±2.9 years, 9 boys, from Project 1), 17 YAs between the ages of 18 and 33 years (24.2±4.1 years, 7 men, from Project 2), and 22 OAs between the ages of 53 and 74 years (64.1±10.9 years, 11 men, from Project 3). All the participants were recruited from communities surrounding the University of Michigan. There was no difference in the years of education between the YA and OA groups (mean=15.75±2.14 for YAs and 15.00±3.00 for OAs; t (37)=0.92, p>0.05). None of the participants reported any neurological or psychological disorders. For the OA group, the mini-mental state exam (MMSE) (Folstein et al., 1975) and the Mattis dementia rating scales (Mattis, 1998) were used to screen out any participants with Dementia. A minimum MMSE score of 27 and a Mattis score of 123 were required. Children's parents or legal guardians were fully informed of the task purpose and signed the consent forms prior to the child's participation in the study. Adult participants provided their consent before the experiment started. The Institutional Review Board at the University of Michigan approved the experimental procedure.
fMRI data acquisition
Participants were positioned in a 3.0 Tesla GE MRI scanner (General Electric, Waukesha, WI) at the University of Michigan's Functional Magnetic Resonance Imaging Center. A visual fixation cross was presented through a mirror mounted on the head coil, reflecting the video projection screen at the rear of the scanner. Participants were instructed to keep their eyes centered on the cross and not to think about anything in particular. The standard GE head coil was used. Two-hundred and forty T2*-weighted BOLD images were acquired using a custom single-shot gradient-echo reverse spiral pulse sequence (Glover et al., 2000). The repetition time (TR) was 2000 msec, time echo (TE) was 30 msec, flip angle (FA) was 90, field of view (FOV) was 220×220 mm2, and the voxel size was 3.44×3.44×3 mm3. Forty 3.0-mm-thick, slightly oblique axial slices (no gap) were acquired. Anatomical localization was based on 3D T1 axial overlay (TR=8.9 msec, TE=1.8 msec, FA=15, FOV=260×260 mm2, slice thickness=1.4 mm, 124 slices; matrix=256×160). A 110-sliced (sagittal) inversion-prepped T1-weighted anatomical image using spoiled gradient-recalled acquisition in steady state (SPGR) imaging (FA=15, FOV=260×260 mm2) was acquired to facilitate normalization.
The duration of functional data collection was 8 min since it has been suggested that network stability and distinct correlation strengths can be obtained after ∼5 min (Van Dijk, 2010). To monitor respiratory activity, a pressure belt was placed around the abdomen of each participant. A pulse oximeter on the participant's finger monitored the cardiac signal. The respiratory and cardiac data acquisition was synchronized with fMRI data collection.
fMRI data analyses
All the data were preprocessed using standard procedures at the University of Michigan. First, if any k-space data were higher than two standard deviations from the mean, the average of their temporal neighbors replaced those outliers. Then, images were reconstructed using field map correction to remove distortions from magnetic field inhomogeneity. Regression analysis was used to remove physiological variations from the cardiac and respiratory rhythms (Glover et al., 2000). The effects of the first- and second-order harmonics of the externally collected physiological waveforms were removed based on this procedure. Slice timing differences were then corrected using local sinc interpolation (Oppenheim et al., 1999). Lastly, motion correction using the 10th image volume as the reference was performed using MCFLIRT in the fMRIB Software Library (Jenkinson et al., 2002). Participants who showed maximum head motion more than 0.3 mm in any direction were excluded from the analysis. For the included participants, head motion was <0.1 mm in the x, y, and z directions (detailed descriptions in the “Results” section). To further address the possible influence of head motion in connectivity analyses, one-way ANOVAs on head movements in the x, y, and z directions were performed. In addition, to minimize the motion effects on the imaging data, the head motion in x, y, z, roll, pitch, and yaw directions for each participant was treated as motion regressors in the following first-level (within-subject) analyses. Then, these results were carried forward to the group-level analyses. The motion regressors were not included at the group-level analyses since they were already corrected in the single-subject analyses.
Statistical Parametric Mapping version 5 (SPM5; Wellcome Department of Cognitive Neurology, London, UK:
To generate functional connectivity images (low-frequency time course correlation maps), we used the following procedure. (1) The data were low-pass filtered by convolving the time courses with a rectangular filter with a cutoff frequency of 0.08 Hz in order to exclude higher frequency sources of noises (such as heart rate and respiration) and to examine the frequency band of interest. (2) The data were spatially smoothed at FWHM of 8 mm. (3) The time course of activity was extracted from the six right striatal seed regions based on Di Martino and coworkers (2008) and Kwak and colleagues (2010). Figure 1 depicts the MNI x, y, and z coordinates for these seeds (VSi 9, 9, −8; VSs 10, 15, 0; DC 13, 15, 9; DCP 28, 1, 3; DRP 25, 8, 6; and VRP 20, 12, −3). Right hemisphere seeds were used because little hemispheric differences were found in our previous data (Bernard et al., 2013). A 4-voxel square on the axial plane was placed around each seed. (4) The time course of each seed was unit normalized to avoid individual differences. (5) The averaged (across four voxels) filtered time course for each striatal seed in each participant was correlated with all other low-pass-filtered voxels in the brain to form functional connectivity maps. Positive correlations were employed due to our original research question as well as the literature (Kwak et al., 2010). To simplify interpretation of results and avoid confusion on multiplication of decimal points (see Kwak et al., 2010), all the Z scores were multiplied by 1000 before being entered into the group-level analyses in SPM5.

Location of the six striatal seed regions (Kwak et al., 2010). The left shows (x=11) the location of the three caudate seeds: inferior ventral striatum (VSi), superior ventral striatum (VSs), and dorsal caudate (DC). The right (x=28) shows the locations of the three putamen seeds: dorsal caudal putamen (DCP), dorsal rostral putamen (DRP), and ventral rostral putamen (VRP). Color images available online at
To examine whether each age group had similar cortico-striatal connectivity characteristics to the results reported in previous studies (Di Martino et al., 2008; Kwak et al., 2010), we first performed three whole brain analyses within the children, YA, and OA groups using a threshold of p<0.001; family-wise error (FWE) was corrected with an extent voxel threshold of 100 (Nichols and Hayasaka, 2003). We predicted that the “motor” seeds were mainly correlated with primary and supplementary motor cortices whereas the “cognitive” seeds were mainly correlated with cognitive frontal regions for children, YAs, and OAs.
Before group-comparison analyses, we ran a frequency content analysis on the BOLD signal time courses from the six striatal seed regions to evaluate whether age-related differences in the frequency content might affect the group comparisons. The procedure was the same as that reported in Kwak and associates (2010). First, we de-trended the data to remove low-frequency drifts and applied Fast Fourier Transformation (Matlab) on the extracted fMRI BOLD time series from the striatal seeds. Since all the data were low-pass filtered at 0.08 Hz, we were able to look only at the power spectrum between 0.0 and 0.08 Hz. The frequency content of the band-passed signal can affect the connectivity measures in two main ways. By limiting ourselves to the low-frequency BOLD band of interest, we can help to eliminate some high-frequency sources of noise such as the respiratory and cardiac rhythms; then by applying methods such as detrending and RETROICOR, we can mitigate their effects within the band itself. Additionally, the number of discrete frequency samples that we have can determine the degrees of freedom of the low-pass-filtered data. To normalize the data, we divided the 0.08 Hz spectrum into eight frequency bands. We then computed the percentage of the total power within each frequency band. Repeated-measures ANOVA with frequency bands (0.0–0.08 Hz) as the within-subject factor and age group as the between-subject factor was performed.
Since we were interested in the age differences between “cognitive” and “motor” frontal-striatal circuits, we performed ANOVAs using anatomical masks based on WFU_Pickatlas (Maldjian et al., 2003) (fmri.wfubmc.edu/software/PickAtlas). The mask areas included the entire frontal cortex (including prefrontal, premotor, primary, and secondary motor areas), thalamus, caudate, and putamen. We used a threshold of uncorrected p<0.001 and an extent voxel threshold of 10. For each area showing significant age main effect from the ANOVAs, Bonferroni post hoc corrections were used to compare the connectivity differences among children, YA, and OA groups. We predicted that children and OAs would have weaker connectivity than YAs for the “cognitive” areas, whereas little age differences would be found for the “motor” areas.
Results
Within each age group
We performed whole-brain analyses within each age group to evaluate whether there were qualitatively similar cortico-striatal networks in children, YAs, and OAs (detailed results are illustrated in Tables 1 –3). The results were mostly consistent with those reported in previous studies (Di Martino et al., 2008; Kwak et al., 2010). In YAs, the “cognitive” ventral striatum primarily correlated with parahippocampal and the cingulate gyri (BA 24). The DC was connected to the cingulate gyrus (BA 24), precuneus (BA 7), and superior and middle frontal areas (BA 8, 10). The “motor” putamen seeds had extensive connections to premotor areas (BA 6), middle frontal (BA 9), temporal (BA 38), and parietal areas (BA 40). Generally, the results from the children and OAs were similar to the findings in the YA group; that is, distinguishable cognitive and motor networks were also found in children and OAs. The “cognitive” seeds (including ventral striatum and dosal caudate) were mainly connected to cingulate and medial frontal areas and the putamen seeds had connections to motor-related areas.
Areas Showing Significant Connectivity with the Striatal Seeds in Children (p<0.001, Family-Wise Error-Corrected, Cluster Size >100)
The coordinates listed in the tables represent peak voxel coordinates. Each one can represent local maxima from the same cluster; the highest peak values (or only peak value) in a cluster are listed in bold; the remaining values are not. Z scores represent the z values from the peak voxel at MNI space.
DC, dorsal caudate; DCP, dorsal caudal putamen; DRP, dorsal rostral putamen; Inf, infinite; VRP, ventral rostral putamen; VSi, inferior ventral striatum; VSs, superior ventral striatum.
Areas Showing Significant Connectivity with the Striatal Seeds in Young Adults (p<0.001, Family-Wise Error-Corrected, Cluster Size >100)
The coordinates listed in the tables represent peak voxel coordinates. Each one can represent local maxima from the same cluster; the highest peak values (or only peak value) in a cluster are listed in bold; the remaining values are not. Z scores represent the z values from the peak voxel at MNI space.
Areas Showing Significant Connectivity with the Striatal Seeds in Older Adults (p<0.001, Family-Wise Error-Corrected, Cluster Size >100)
The coordinates listed in the tables represent peak voxel coordinates. Each one can represent local maxima from the same cluster; the highest peak values (or only peak value) in a cluster are listed in bold; the remaining values are not. Z scores represent the z values from the peak voxel at MNI space.
Group comparisons
Before making group comparisons, two control analyses on head motion and frequency content were performed. Recent studies have emphasized the importance of head motion in the connectivity analyses (e.g., Power et al., 2012). In addition to the standard realignment of images to correct for head motion, we took several steps to address the potential effects of head motion on our results. First, we excluded participants whose head motion exceeded 0.3 mm in the x, y, or z direction. The head motion for all the included participants was <0.1 mm in the x, y, and z directions (children average=0.002, 0.004, and 0.010 mm, YA average=0.056, 0.003, and 0.001 mm, and OA=0.049, 0.007, and 0.001 mm, in the x, y, and z directions, respectively). Second, we performed one-way ANOVAs to investigate age differences in head movement in the x, y, and z directions during the scanning sessions. No significant age effects were found (all Fs<1.02, p>0.35). Lastly, we treated head motion measures as covariates for all the connectivity analyses to minimize the motion effect.
Then, we ran a frequency content analysis of the BOLD signal time courses in the six striatal seed regions. Results from the repeated-measures ANOVA showed no age group differences in the percentage of the total power within each frequency band between 0.0 and 0.08 Hz (all p>0.05), suggesting that the following connectivity differences were not related to age differences in either head motion or signal frequency content.
The ANOVAs on the six striatal seed networks were limited to the frontal cortex, thalamus, caudate, and putamen. Among the three “cognitive” seeds, no regions showed connectivity age differences with the VSi. Areas that showed significant age effects with the superior ventral striatum were inferior prefrontal gyrus (BA 47, Fig. 2), orbitofrontal area (BA 11), and thalamus (Table 4). Post hoc analysis revealed that the age effect in the inferior prefrontal gyrus (BA 47) was due to stronger connectivity in YAs compared with both OAs and children (Fig. 2). Age effects in the orbitofrontal area (BA 11) and thalamus were due to the fact that YAs and OAs had higher connectivity strength than children (Table 5). For the DC seed, thalamus, inferior, and ventromedial prefrontal areas (BA 47 and 25) had significant age effects on connectivity strength. Except for the left ventromedial PFC and one of the thalamus areas, all other areas showed higher connectivity in YAs than children and OAs (all p<0.05; Bonferroni correction; the right panel of Figure 2 is representative of the general U-shaped pattern in those clusters.). Increasing connectivity in the left ventromedial PFC across the three age groups was found. One thalamus area had higher connectivity strength in YAs than children but not OAs.
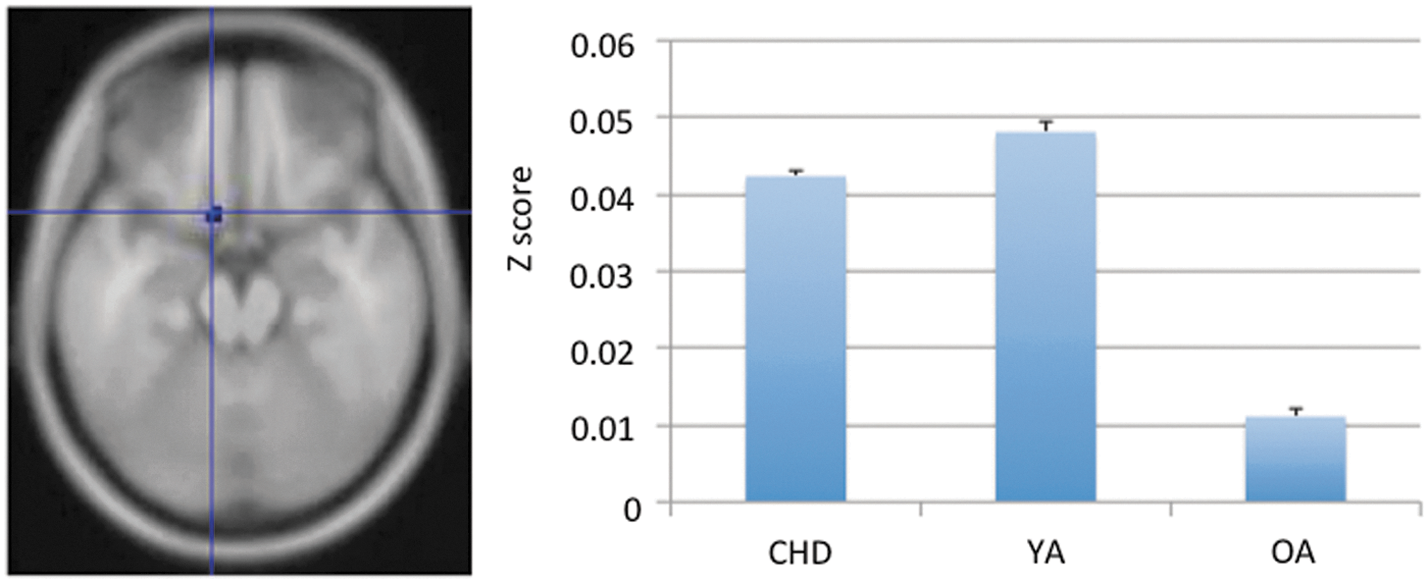
Inferior prefrontal gyrus (BA 47) showed significant age effects on the connectivity strength with VSs (i.e., one of the “cognitive” seed) with age (ANOVA with anatomical masks). The bar-plot at the right represents the average connectivity strength that we extract from the correspondent cluster (at the inferior prefrontal gyrus) for each participant. The y-axis represents the group mean of these averaged connectivity scores for each age group. Age differences were found across three groups (Bonferroni correction). Color images available online at
Areas Showing Significant Age Main Effects in the ANOVA with Anatomical Masks (Uncorrected p<0.001, Cluster Size >10)
Connectivity Strength for Areas Showing Significant Age Main Effects in the ANOVA with Anatomical Masks
Also see Figure 2.
Also see Figure 3.
CHD, children; OAs, older adults; YAs, young adults.
Among the three “motor” seeds, areas that had significant age effects for the DCP were inferior prefrontal gyrus (BA 47), primary motor cortex (BA 4), and putamen (Table 4). Higher connectivity strength in the inferior prefrontal and primary motor areas was found in YAs compared with those in children and OAs (Fig. 3; the right panel is representative of the general U-shaped pattern in those clusters.). Two of the putamen regions had higher connectivity in children and YAs than OAs. The only two brain regions that showed significant age effects with the VRP seed were the putamen and the thalamus. Again, YAs had higher connectivity than children and/or OAs (detailed in Table 5). No regions showed age differences in resting state connectivity for the DRP seed.
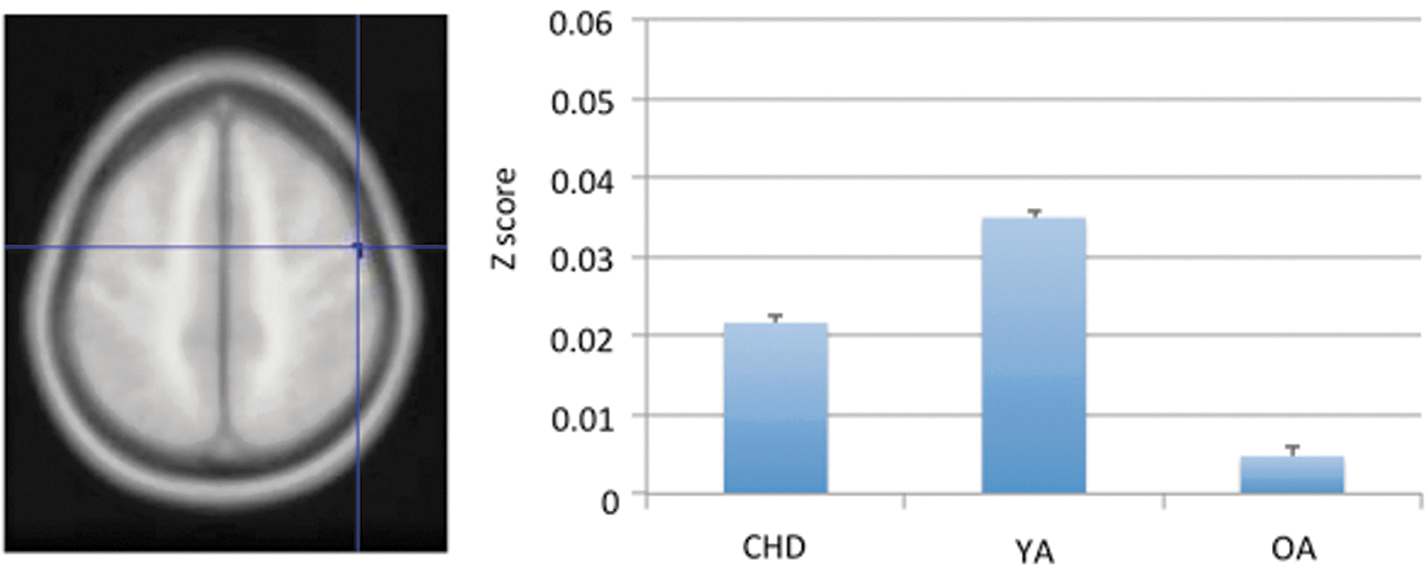
Primary motor cortex (BA) showed significant age effect on the connectivity strength with the DCP (i.e., one of the “motor” seed) with age (ANOVA with anatomical masks). The bar-plot at the right represents the average connectivity strength that we extract from the correspondent cluster (at the primary motor cortex) for each participant. The y-axis represents the group mean of these averaged connectivity scores for each age group. Age differences were found across the three groups (Bonferroni correction). Color images available online at
Finally, to explore whether children and OAs had different striatal networks outside of frontal regions, we performed ANOVA whole-brain analyses. Areas that showed significant age effects for the inferior and superior ventral striatum seeds were left cerebellum H VI and cingulate gyrus. For the DC seed, inferior parietal gyrus, fusiform gyrus, and left cerebellum H IX had significant connectivity differences across the three age groups. Post hoc tests revealed that the correlation between DC and cerebellum H IX for YAs was significantly higher than that for children and OAs (Table 6). In terms of the “motor seeds” in putamen, we did not find any regions showing connectivity differences except the DCP at a threshold of uncorrected p<0.001 and a cluster extent of 20. The inferior prefrontal gyrus (BA 47), putamen, and parahippocampal gyrus (BA 35 and 30) had significant connectivity differences among groups. Table 6 illustrates the detailed areas that had a significant age effect with all seeds (including post hoc tests).
Areas Showed Significant Age Effect on Whole-Brain ANOVA (Uncorrected p<0.001, Cluster Size >20)
Discussion
The current study examined age differences in the frontal-striatal “cognitive” and “motor” circuits in children, YAs, and OAs. We predicted that the strength of the “cognitive” circuits would be weaker in children and OAs compared with that in YAs. However, we expected that the “motor” circuits would show reduced or no age effects. Our results, however, showed that most areas in both the “cognitive” and “motor” circuits showed higher connectivity in YAs than children and OAs, suggesting an inverted “U” pattern of differences across the lifespan for the frontal-striatal networks. That is, differential developmental and aging effects between the “cognitive” and “motor” frontal-striatal circuits were not supported.
Previous developmental studies have documented qualitatively similar patterns of functionally connected networks between children and adults (Jolles et al., 2011). The core regions of all functional networks are present in children as young as 11–13 years. In addition, de Bie and associates (2012) reported that the motor networks matured much earlier than the cognitive networks. Children at 6–7 years of age had shown a robust adult-like functional organization in the motor networks. In contrast, other networks, especially for higher-order cognitive functions, were weak and incomplete. Our current results, however, showed a different pattern of changes. Regardless of cognitive or motor-related circuits, most frontal-striatal networks showed a similar inverted “U” pattern among three age groups, suggesting similar development and aging processes across the two types of circuits. Multiple developmental studies have documented that children can have adult-like performance in a wide range of motor tasks (e.g., Mall et al., 2005; Thomas et al., 2004). For example, Mall and coworkers (2005) have reported that children as young as 6 years of age could perform simple-paced unilateral motor tasks (e.g., squeezing a ball) at the mature adult level. In several studies that involved learning fixed short sequences, little or no age differences were found (Meulemans et al., 1998; Thomas and Nelson, 2001). These behavioral findings seem to be consistent with recent fcMRI studies, revealing that children as young as 5–8 years of age have already mature adult-like functional organizations in networks supporting their basic motor functions (e.g., de Bie et al., 2012). However, several recent task-related neuroimaging studies reported that despite significant overlap in the neural systems and behavioral similarities between children and YAs, developmental differences were observed in the recruitment of motor systems. Mall and coworkers (2005) showed that children had weaker recruitment in the bilateral sensorimotor cortex, parietal cortex, the supplemental motor area, and the cerebellum during a squeezing movement. Thomas and colleagues (2004) reported that children had relatively greater recruitment of subcortical areas (e.g., putamen) while adults had greater recruitment of cortical regions including the premotor cortex during a manual button-press task. All these findings as well as the results from the current study suggest that the frontal-striatal projections may undergo continuous “fine-tuning” processes well into adolescence. The “efficiency” of both the “cognitive” and “motor” networks improves continuously during early development.
In comparison to early development, neural functions and organizations decline with normal aging. It has been claimed that the last brain regions (mainly higher-order cognitive-related frontal areas) that mature in early development are the first “to go” during normal aging (Casey et al., 2000). In other words, the most plastic regions over prolonged periods of development are more sensitive to aging. Previous behavioral studies have suggested that normal aging does not necessarily affect OAs' performance on basic motor tasks (Huxhold et al., 2006; Lindenberger et al., 2000) but it does impact many cognitive functions, including working memory, attention, and processing speed (Lustig and Meck, 2001; Parasuraman and Giambra, 1991; Reuter-Lorenz et al., 2000). Such behavioral phenomena seem consistent with the idea of differentiated “cognitive” and “motor” changes in normal aging. However, multiple studies revealed that OAs rely more on additional resources when performing simple motor tasks than YAs (Huxhold et al., 2006; Lindenberger et al., 2000). For example, Mattay and coworkers (2002) reported a greater extent of activation in the contralateral sensorimotor, premotor, and supplementary motor areas in OAs relative to YAs when participants did a simple button-pressing task. Additional areas of activation, which were absent in the YAs, were seen in the ipsilateral sensorimotor cortex, putamen, and contralateral cerebellum of the OAs. These additional activations have been interpreted as being “compensatory” for age-related changes. Thus, although motor performance could be similar between young and OAs, the functional capacity within motor networks declines for OAs. Our current data are consistent with the existing literature. The frontal-striatal circuits, regardless of whether they are “cognitive” or “motor” related, undergo a similar pattern of changes in normal aging. Here, it is important to note that a threshold of uncorrected p<0.001 was used for the group analyses. Thus, the likelihood of Type 1 error increased with multiple comparisons. In addition, in order to explore whether networks may become dedifferentiated instead of compensational with age (i.e., tuning down certain areas), further studies on negative connectivity may be helpful.
It is interesting that not all the frontal-striatal networks showed an inverted U-shape pattern. For example, we found that the connectivity strength between the left ventromedial PFC and the DC demonstrated age-related increment from children to OAs. It is not so surprising to find increased connectivity from children to YAs. Christakou and coworkers (2011) reported that the activation coupling was strengthened between ventromedial PFC (left side) and striatal clusters from early adolescence to mid-adulthood (12–32 years of age) in task-related connectivity. What is interesting here is the increased connectivity from young to OAs while the prefrontal areas normally show large volumetric declines in aging (e.g., Raz et al., 1997). Recently, Addis and coworkers (2010) explored the neural correlates for improved memory on positive events in OAs. They found that aging did not impact the connectivity among regions engaged in negative information but did affect the networks for positive information. The connectivity strength related to ventromedial PFC increased in OAs for positive events. Thus, it is possible that not all the areas in PFC exhibit the same patterns of change with aging. Asymmetrical declines have been found in the PFC area (Zhu et al., 2011). Further studies are needed to understand the differential changes within frontal networks.
To further explore whether OAs and children might recruit additional areas to compensate for declines in cognitive and motor circuits, we conducted follow-up ANOVAs on the whole brain without anatomical masks. Most additional areas beyond fontal cortex were quite far from the seed area (e.g., cerebellum, inferior prefrontal gyrus, parahippocampal cingulated, and fusiform gyri). Previous studies report that long-range connections (e.g., long-range connectivity cortical-subcortical regions) are more vulnerable to aging than short-range connections (e.g., Tomasi and Volkow, 2012). The findings from the current whole-brain analyses seem consistent with the literature. However, in order to validate whether these additional areas were “compensational,” correlations between connectivity results and behavioral, cognitive measures would be required. Unfortunately, we did not perform consistent cognitive assessments across all three age groups in the current study. Growing evidence has suggested that resting state connectivity relates to cognitive functions, such as working memory (e.g., Bluhm et al., 2011; Mevel et al., 2010). The social economic status and educational level for participants may also affect the current results. The limitation on behavioral measures restricted us from making these interpretations. Further, the connectivity measures could potentially be confounded by cognitive function and socioeconomic status. However, the two adult groups did not differ in years of education. Future studies are needed to interpret the age effect on brain connectivity in general.
Control analyses
It is known that the frequency content of spontaneous neuronal oscillations can affect functional connectivity measures in fcMRI. Studies on patients with Parkinson's disease revealed that abnormal cortico-striatal connectivity was related to the increased alpha band frequency in the basal ganglia (Stoffers et al., 2008). Kwak and colleagues (2010) selected the same seeds as the current study and reported that the enhanced connectivity in patients with Parkinson's disease was related to increased power in the frequency band 0.02–0.05 Hz (i.e., 0.02–0.03 Hz for VSi and DC, and 0.03–0.04 Hz for DCP) and decreased power in the frequency band <0.02 Hz. In addition, the authors found that L-dopa affected a specific frequency range of resting state BOLD signal oscillations, which in turn, decreased the abnormal hyperconnectivity in the basal ganglia thalamo-cortico networks. Thus, before comparing age groups in connectivity strength, we first evaluated the frequency content of the resting state BOLD signals among three age groups. Previous developmental studies have documented that there is a decreased power in the lower frequency band and an increased power in higher frequencies with age, throughout childhood and early adolescence (Cragg et al., 2011). By contrast, normal aging shows the opposite pattern; as a function of age, lower frequency power increases and higher frequency power decreases (Zhu et al., 2011). In addition, cognitive-related areas, such as the PFC, undergo more extensive changes compared with the other parts of the brain (Zhu et al., 2011). Thus, we anticipated some differences in these striatal seeds among the three age groups. Interestingly, we observed no age differences in any of the frequency bands. This might due to the fact that our current frequency range (0–0.08 Hz) was significantly lower than what has been reported in the literature [e.g., 0.5–40 Hz in Cragg et al. (2011); 2–13 Hz in Zhu et al. (2011)]. Thus, differences in the frequency content of resting state neuronal oscillations is unlikely to have impacted our findings of age differences in network connectivity strength.
The influence of head motion on functional connectivity is another potential concern when comparing groups that may differ in head motion (Power et al., 2012; Van Dijk et al., 2012). Recently, several studies have reported that the excessive head motion that has been normally found in young children can potentially weaken the long-distance networks and enhance short-distance connectivity effects (Satterthwaite et al., 2012). In the current study, we excluded participants who showed head motion that was more than 0.3 mm in any directions. Most of the young participants were older than 9 years of age. Thus, it is not surprising that no group differences were found on head motion in the current data. In all of the connectivity analyses, head motion measures were treated as covariates. Therefore, we are confident that the effect of head motion on our connectivity analyses is very minimal.
Summary
We have shown qualitatively similar distinctive “cognitive” and “motor” frontal-striatal circuits (Di Martino et al., 2008) among children, YAs, and OAs. Although we predicted an inverted “U” pattern of changes on the “cognitive” circuits across age and little age differences in the “motor” circuits, our results revealed an interesting pattern; most frontal-striatal networks showed similar inverted “U” changes across the lifespan, regardless of whether they were “cognitive” or “motor” circuits. These results lead to our claim that the strength of “cognitive” and “motor” functional connectivity within the frontal-striatal circuits undergoes similar processes in adolescence and normal aging.
Footnotes
Acknowledgments
This work was supported by the Gustavus and Louise Pfeiffer Foundation (R.D.S.) and Autism Speaks grant no. 2570 (C.S.M). The authors wish to thank all of the research assistants who helped with data collection and the participants who gave willingly of their time and effort.
Author Disclosure Statement
No competing financial interests exist.