




Abstract
Functional brain networks are sets of cortical, subcortical, and cerebellar regions whose neuronal activities are synchronous over multiple time scales. Spatial independent component analysis (sICA) is a widespread approach that is used to identify functional networks in the human brain from functional magnetic resonance imaging (fMRI) resting-state data, and there is now a general agreement regarding the cortical regions involved in each network. It is well known that these cortical regions are preferentially connected with specific subcortical functional territories; however, subcortical components (SC) have not been observed whether in a robust or in a reproducible manner using sICA. This article presents a new method to analyze resting-state fMRI data that enables robust and reproducible association of subcortical regions with well-known patterns of cortical regions. The approach relies on the hypothesis that the time course in subcortical regions is similar to that in cortical regions belonging to the same network. First, sICA followed by hierarchical clustering is performed on cortical time series to extract group functional cortical networks. Second, these networks are complemented with related subcortical areas based on the similarity of their time courses, using an individual general linear model and a random-effect group analysis. Two independent resting-state fMRI datasets were processed, and the SC of both datasets overlapped by 69% to 99% depending on the network, showing the reproducibility and the robustness of our approach. The relationship between SC and functional cortical networks was consistent with functional territories (sensorimotor, associative, and limbic) from an immunohistochemical atlas of the basal ganglia.
Introduction
Functional brain networks are defined as sets of gray matter regions showing synchronous neuronal activities (Varela et al., 2001). Low-frequency fluctuations in the blood-oxygen-level dependent (BOLD) signal (0.01–0.1 Hz) during resting-state functional magnetic resonance imaging (fMRI) should reflect intrinsic neuronal activity, which represents the condition of the human brain in the absence of external stimuli (Biswal et al., 1995; Fox and Raichle, 2007). Regions with similar low frequency fluctuations correspond to relevant functional networks reflecting cognitive, emotional, and sensorimotor processes (Damoiseaux et al., 2006; Smith et al., 2009).
Numerous reports in monkeys using biological tracers that diffuse through antero- or retrograde axonal transport have demonstrated the presence of cortico-subcortical loops (Parent et al., 2000; Smith et al., 2004), which connect cortical regions to specific subcortical regions and are recognized as being crucial to functions such as motor skills or cognition (Alexander et al., 1986; Purves et al., 2004). Zhang and colleagues (2008) used resting-state fMRI in humans and an approach based on regions of interest and partial correlation to study functional connectivity between thalamic nuclei and specific cortical regions. Similarly, using regions of interest to analyze functional connectivity between the striatum and cortical regions, Gopinath and coworkers (2011) demonstrated that the striatum had strong functional links with sensorimotor and attentional networks as well as with emotional networks.
Resting-state fMRI networks have also been explored using data-driven approaches where the brain is analyzed in its entirety without any a priori information (Beckmann et al., 2005; Perlbarg et al., 2008). Habas and associates (2009) extracted subcortical regions associated with cortical and cerebellar regions by using a group spatial independent component analysis (sICA), albeit only on a limited number of functional networks (the default mode, executive control, and salient networks). However, they did not conduct any reproducibility study on the results. In previous articles (Damoiseaux et al., 2006; Perlbarg et al., 2008; Smith et al., 2009), the authors differentiated functional networks by the presence or absence of specific cortical regions. Subcortical regions (when present) were only listed and not actually taken into consideration in the classification of functional networks. Most of the time, sICA found the striatum and the thalamus gathered in a few number of components (Damoiseaux et al., 2008; Kim et al., 2013; Robinson et al., 2009) and was not able to subdivide these regions into subcortical structures associated with patterns of cortical areas.
Thus, sICA as it is usually conducted, that is, on the whole brain, mostly gives access to a set of cortical networks with scarce subcortical components (SC) and does not actually identify cortico-subcortical networks. Intuitively, this suggests that subcortical and cortical regions should be considered separately through distinct analyses and that a functional hypothesis is needed to further ensure a correct association between subcortical and cortical regions belonging to the same functional network. In this work, we assume that the time courses (i.e., the variation of acquired BOLD signals over time) in the striatum and the thalamus are similar to those in associated cortical components.
The objective of this work is to propose a robust and reproducible approach to identify the SC of functional networks from resting-state fMRI data. We first describe the method: On the one hand, sICA is carried out for cortical regions only, which yields functional cortical networks. On the other hand, SC are identified by means of a general linear model (GLM) applied to the striatum and the thalamus, based on the hypothesis that the time course in these regions should covary with that of cortical components belonging to the same network. The resulting SC are validated by a comparison with an immunohistochemical functional atlas (Bardinet et al., 2009; Yelnik et al., 2007), which provides a specific labeling of subcortical functional territories (SFT). Then, reproducibility is assessed using an additional dataset. Lastly, limitations and perspectives are discussed in view of the existing literature.
Methods
The proposed method consisted of several steps. First, the striatum and the thalamus were masked out and sICA combined with a hierarchical procedure was carried out on cortical data, extracting group and corresponding individual spatial components. We then linked the cortical components to regions in the striatum and the thalamus based on time course similarity, using a GLM. The procedure yielded a parametric map of SC associated with each cortical component. These cortical and subcortical regions, once associated, finally defined cortico-subcortical functional networks. Figure 1 shows a flowchart of the procedure.
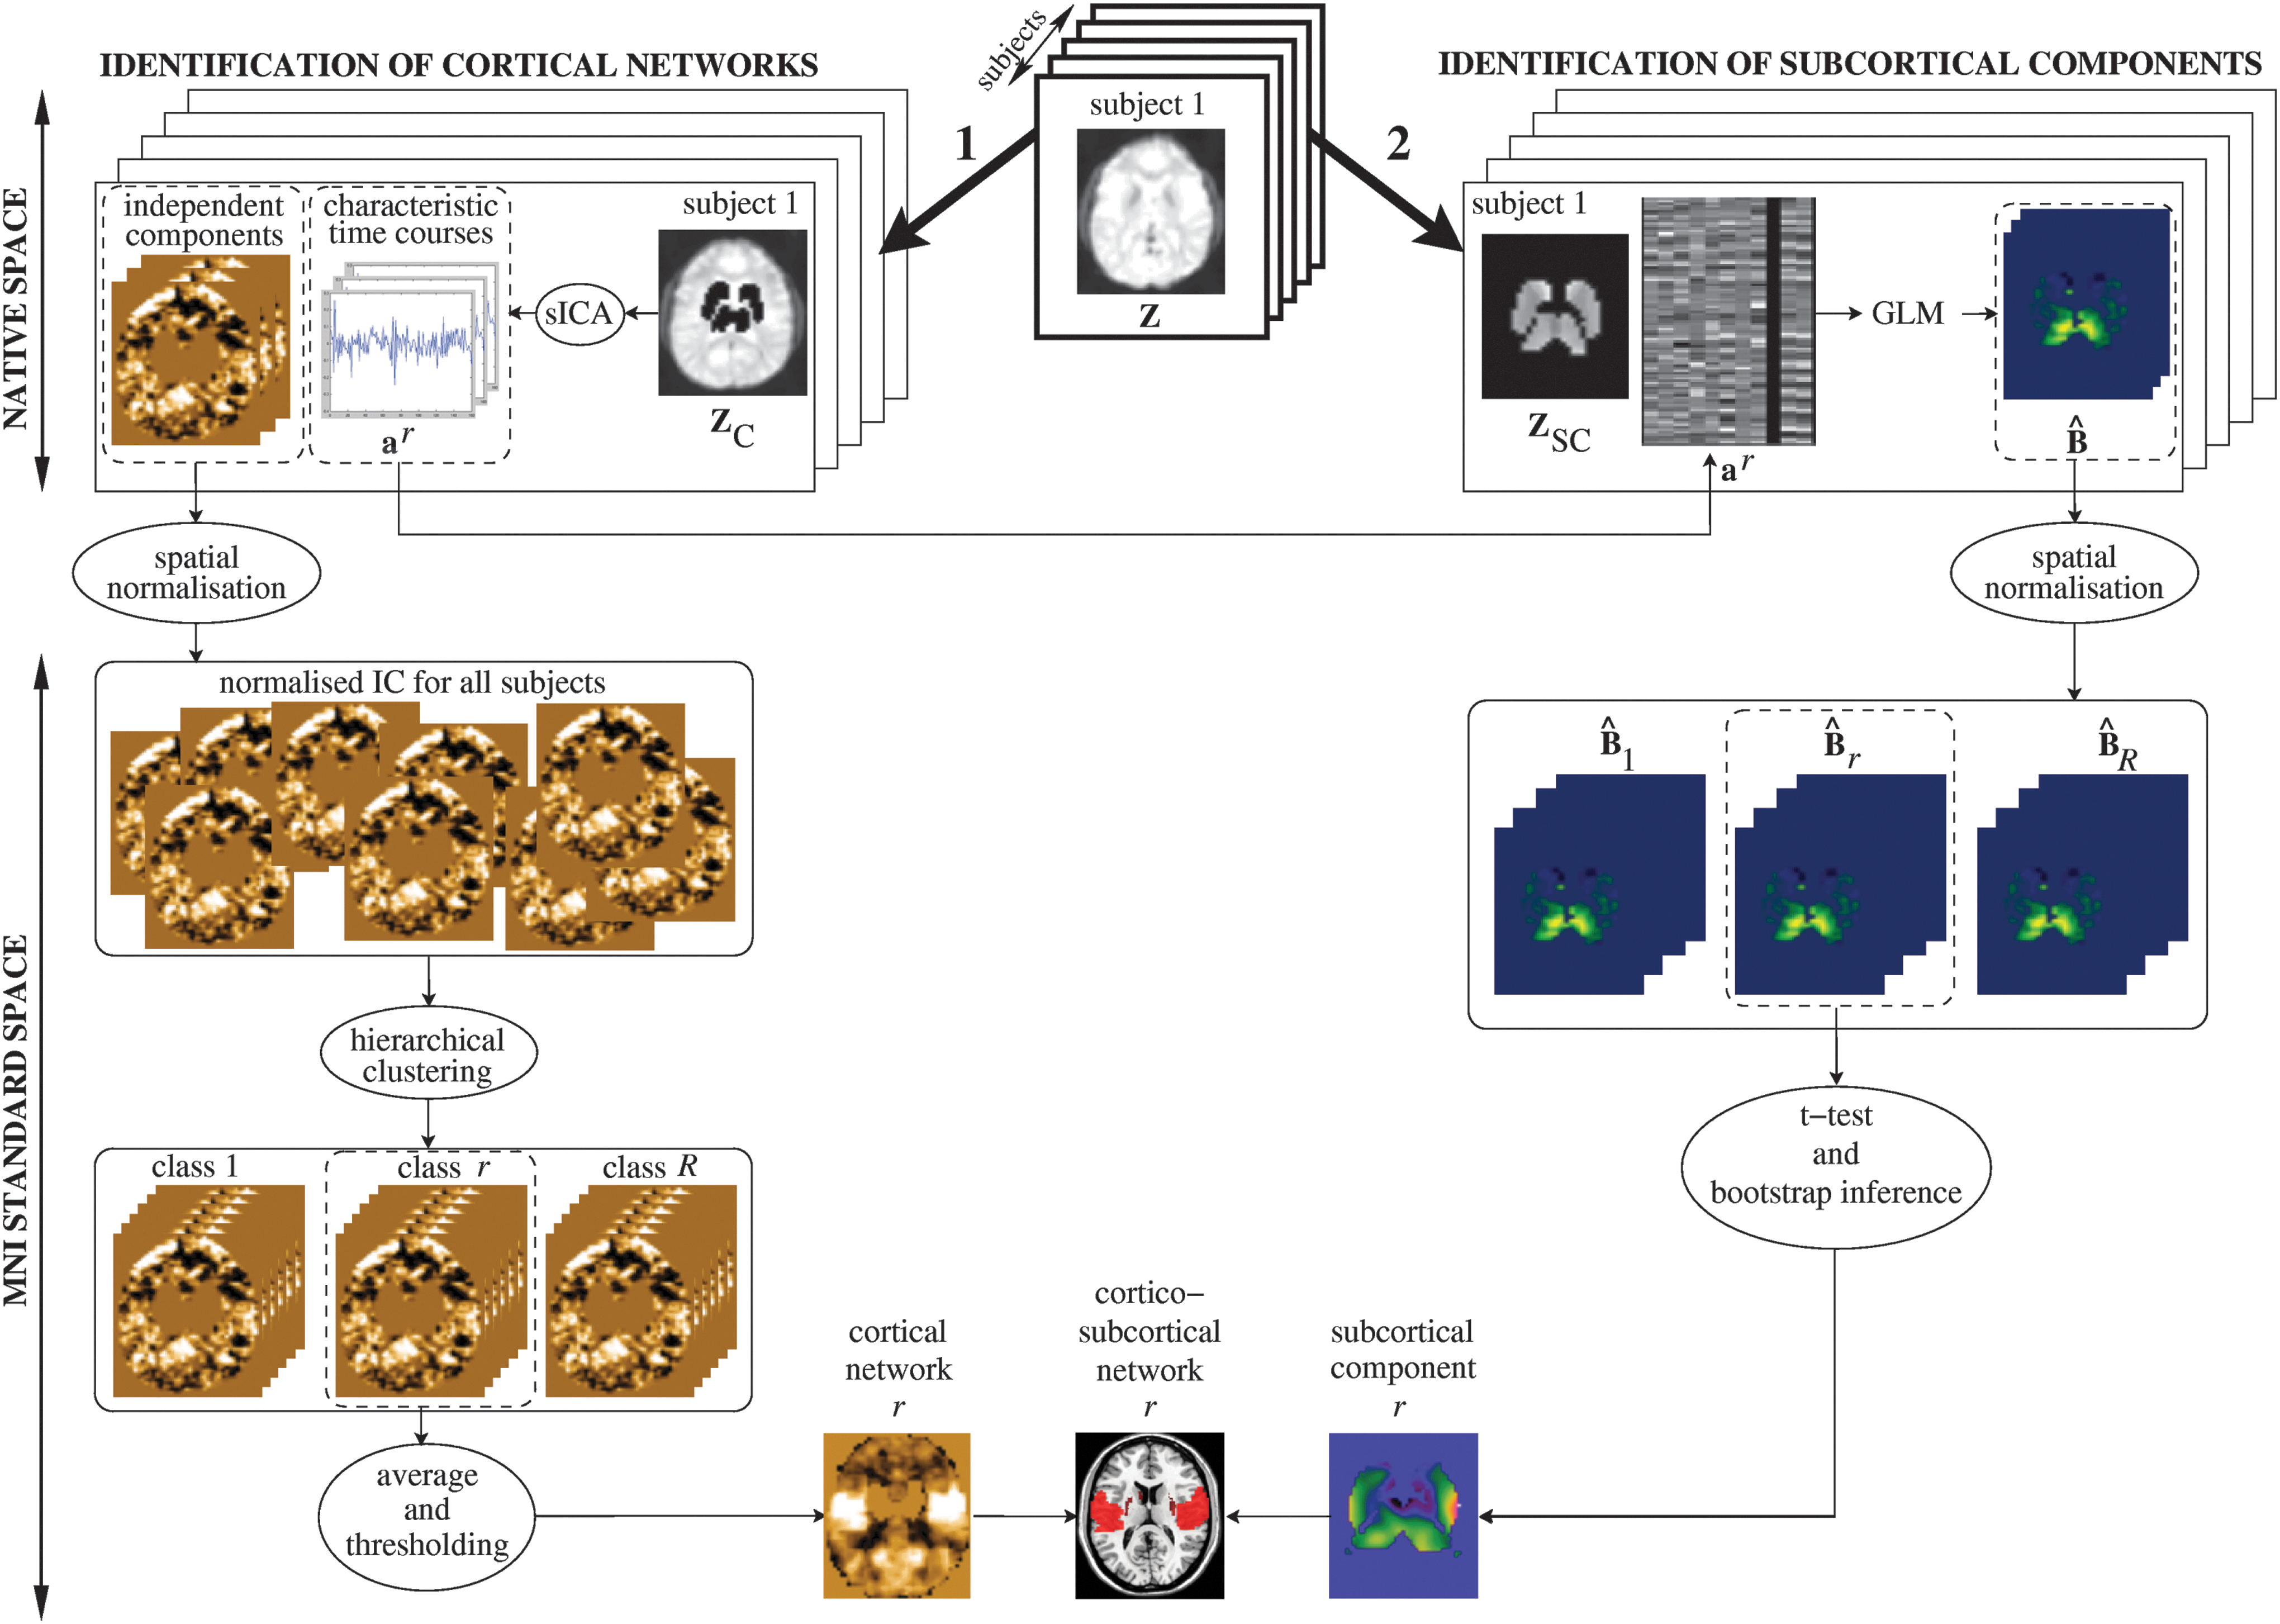
Flowchart of the method. Individual analyses are conducted in the native space of each subject. Group analyses are conducted in the standard MNI space.
Identification of functional cortical networks
Let
The first step of the analysis consisted of extracting cortical networks from
From the similarity tree, all IC were partitioned into classes that were the most representative of the population, using an ad hoc automatic procedure detailed in Appendix A. Note that a subject may not contribute to a class at all or contribute with one or several components. All normalized spatial maps in each class were then averaged, and the resulting average map was thresholded at p<0.05 using t-test statistics (corrected for multiple comparisons by using the false discovery rate approach [Genovese et al., 2002]). Finally, thresholded average maps of all classes were visually inspected to select a number R of maps that exhibited a known spatial organization. These maps are further referred to as cortical networks. The remaining maps were related to noise processes (either physiological or physical).
Identification of SC
The second step consisted of assigning each voxel in the striatum and the thalamus to one cortical network, based on the hypothesis that the time course of subcortical voxels should covary with that of cortical components belonging to the same network. For each subject in his/her native space, we first regressed the signal within each subcortical voxel on the R characteristic time courses of the cortical networks (Worsley et al., 2002)
where
For each subject, this analysis provided one map
For each network r, a parametric random-effect analysis was then performed and a voxelwise Student's t-test was carried out to test the null hypothesis that the average of the Sr
maps was zero. This provided us with a t-value for each voxel, denoted by t0
. A nonparametric bootstrap approach was then used to ensure robust inference. More precisely, a set of 10,000 samples were created by resampling 10,000 times the Sr
maps with replacement. For each sample, a new voxelwise t-value was computed, denoted by t*. Final statistical inference was finally conducted based on the achieved significance level Q, defined as follows (Efron and Tibshirani, 1993):
where card(A) denotes the cardinality of set A. As a result of this procedure, the group maps comprising subcortical voxels were reproducible across subjects. These maps are further referred to as SC.
Lastly, cortico-subcortical functional networks were obtained by combining the cortical group maps from NEDICA analysis and the associated SC obtained from GLM and bootstrap inference.
Validation
Cortical networks
Spatial and frequential comparisons were carried out in order to validate the functional cortical networks obtained from
To compare their spatial patterns, matching between group networks extracted from
To compare their temporal patterns, we resorted to frequency analysis. The power spectra of the signals from sICA components were compared as follows. First, the power spectrum for a given group network r was obtained by calculating the power spectra of all individual characteristic time courses [
To further quantify temporal similarity at the individual level, the correlation (with associated p-value) between the time course obtained from
Subcortical components
In this section, we wished to validate the location of the subcortical regions corresponding to the different functional networks. More precisely, the purpose was to accurately classify which parts of the striatum and the thalamus were specific to a given functional network to assess whether the proposed functional segregation was consistent with a segmentation from an atlas. In order to do this, we used an immunohistochemical atlas (Bardinet et al., 2009; Yelnik et al., 2007), which describes the caudate nucleus, the putamen, and the thalamus, and their functional segmentation in sensorimotor, limbic, and associative territories. Each subcortical territory from the atlas is indexed according to its functional domain. For example, the putamen is divided into three different and disjoint structures: the associative, sensorimotor, and limbic putamen. These structures are referred to as SFT in the rest of this article. The right and left hemispheres are differentiated for each structure.
Specifically, for each functional network at the group level, the corresponding SC (i.e., thresholded group maps in the MNI standard space obtained from Identification of SC section) were mapped to the atlas with a specific procedure (Bardinet et al., 2009) so as to verify whether these components were parts of specific SFT. In order to quantify the overlap between the atlas and the SC, we computed
• the volume of the intersection between each atlas territory (SFT
j
) and each subcortical component obtained for a network r and a threshold p (
• the relative importance of a functional territory within the subcortical component of a given network, defined as follows:
Reproducibility
In this section, the aim was to assess the reproducibility of the method by applying the proposed approach to two different datasets. Only the subcortical group components were studied, as reproducibility of the cortical regions has been widely reported in the literature. We examined the overlap between thresholded SC (p<0.01, uncorrected) for both datasets and each cortical network. To do so, we calculated N id as the number of voxels identified with the same network label for both datasets and N diff as the number of voxels with different labels. The overlap was then defined as in Cortical Networks section by the ratio: N id/(N id+N diff). Furthermore, differences in spatial distribution of the SC in atlas SFT (V comp) between datasets were assessed using a two-sample nonparametric test that tests the equality of two distributions, the Kolmogorov–Smirnov (KS) test.
MRI Data
Dataset 1
Twenty healthy volunteers (right handed, age 24 – 30, 12 men) provided their informed consent and took part in a study comprising the acquisition of two resting-state fMRI sessions and a high-resolution anatomical image. The protocol was approved by the ethics committee of the Centre de Recherche de l'Institut Universitaire de Gériatrie de Montréal (CRIUGM; Montreal QC, Canada). Subjects lay down in the magnet and were asked to stay still, to keep their eyes closed, and to restrain from overt activity. Functional MRI series were recorded using a single-shot, gradient-recalled echo planar imaging sequence (field of view: 224×224 mm2; repetition time [TR]: 2500 msec; echo time [TE]: 30 ms, flip angle: 90°). One hundred and sixty volumes were acquired for each run, and each volume consisted of 41 contiguous axial slices (3.5 mm isotropic voxels). The anatomical volume (128 axial slices, voxel size: 1 mm isotropic) was acquired using a three-dimensional, spoiled gradient echo sequence (TR: 22 msec, TE: 4 msec, flip angle: 30°; matrix size: 256×256 voxels). All data were recorded using a 12-channel 3T Siemens TRIO magnet at the CRIUGM.
Dataset 2
We used a dataset kindly provided by A. Villringer and freely available from the 1000 Functional Connectomes Project website (
Preprocessing of fMRI data
All preprocessing was performed using the SPM5 software (
Normalization procedure
When necessary for group analyses, the transformation from the individual space to the standard MNI space was computed as follows: Functional images were first coregistered to the structural T1-weighted image of each subject; then, a nonlinear transformation was calculated to map the structural image to the SPM5 T1-weighted template in the MNI space. This transformation was subsequently applied, on the one hand, to all individual cortical IC obtained from
Results
Results obtained for dataset 1
At the group level, NEDICA extracted 11 functional networks from
The only network extracted from

Component obtained with NEDICA from
Comparison Between Cortical Regions of Networks with the Same Label Obtained from
First column: network label; second column: relative overlap of cortical regions for networks with the same label but obtained from
dATT, dorsal attentional network; DM, default mode network; EXCTR, network relating to executive control; LIMB, limbic network; LvATT, left ventral attentional network; MOT, premotor network; MOT2, sensorimotor network; RvATT, right ventral attentional network; SAL, salient network; VIS, visual network.
Figure 3 shows the MOT network obtained from
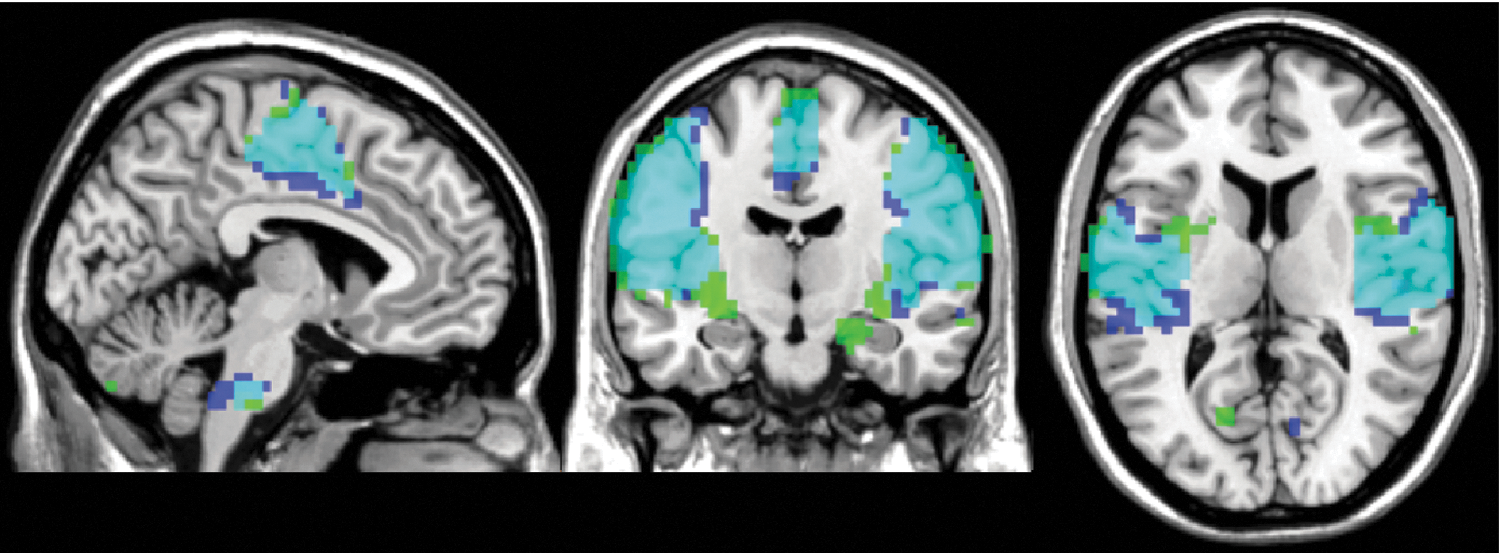
MOT networks obtained from
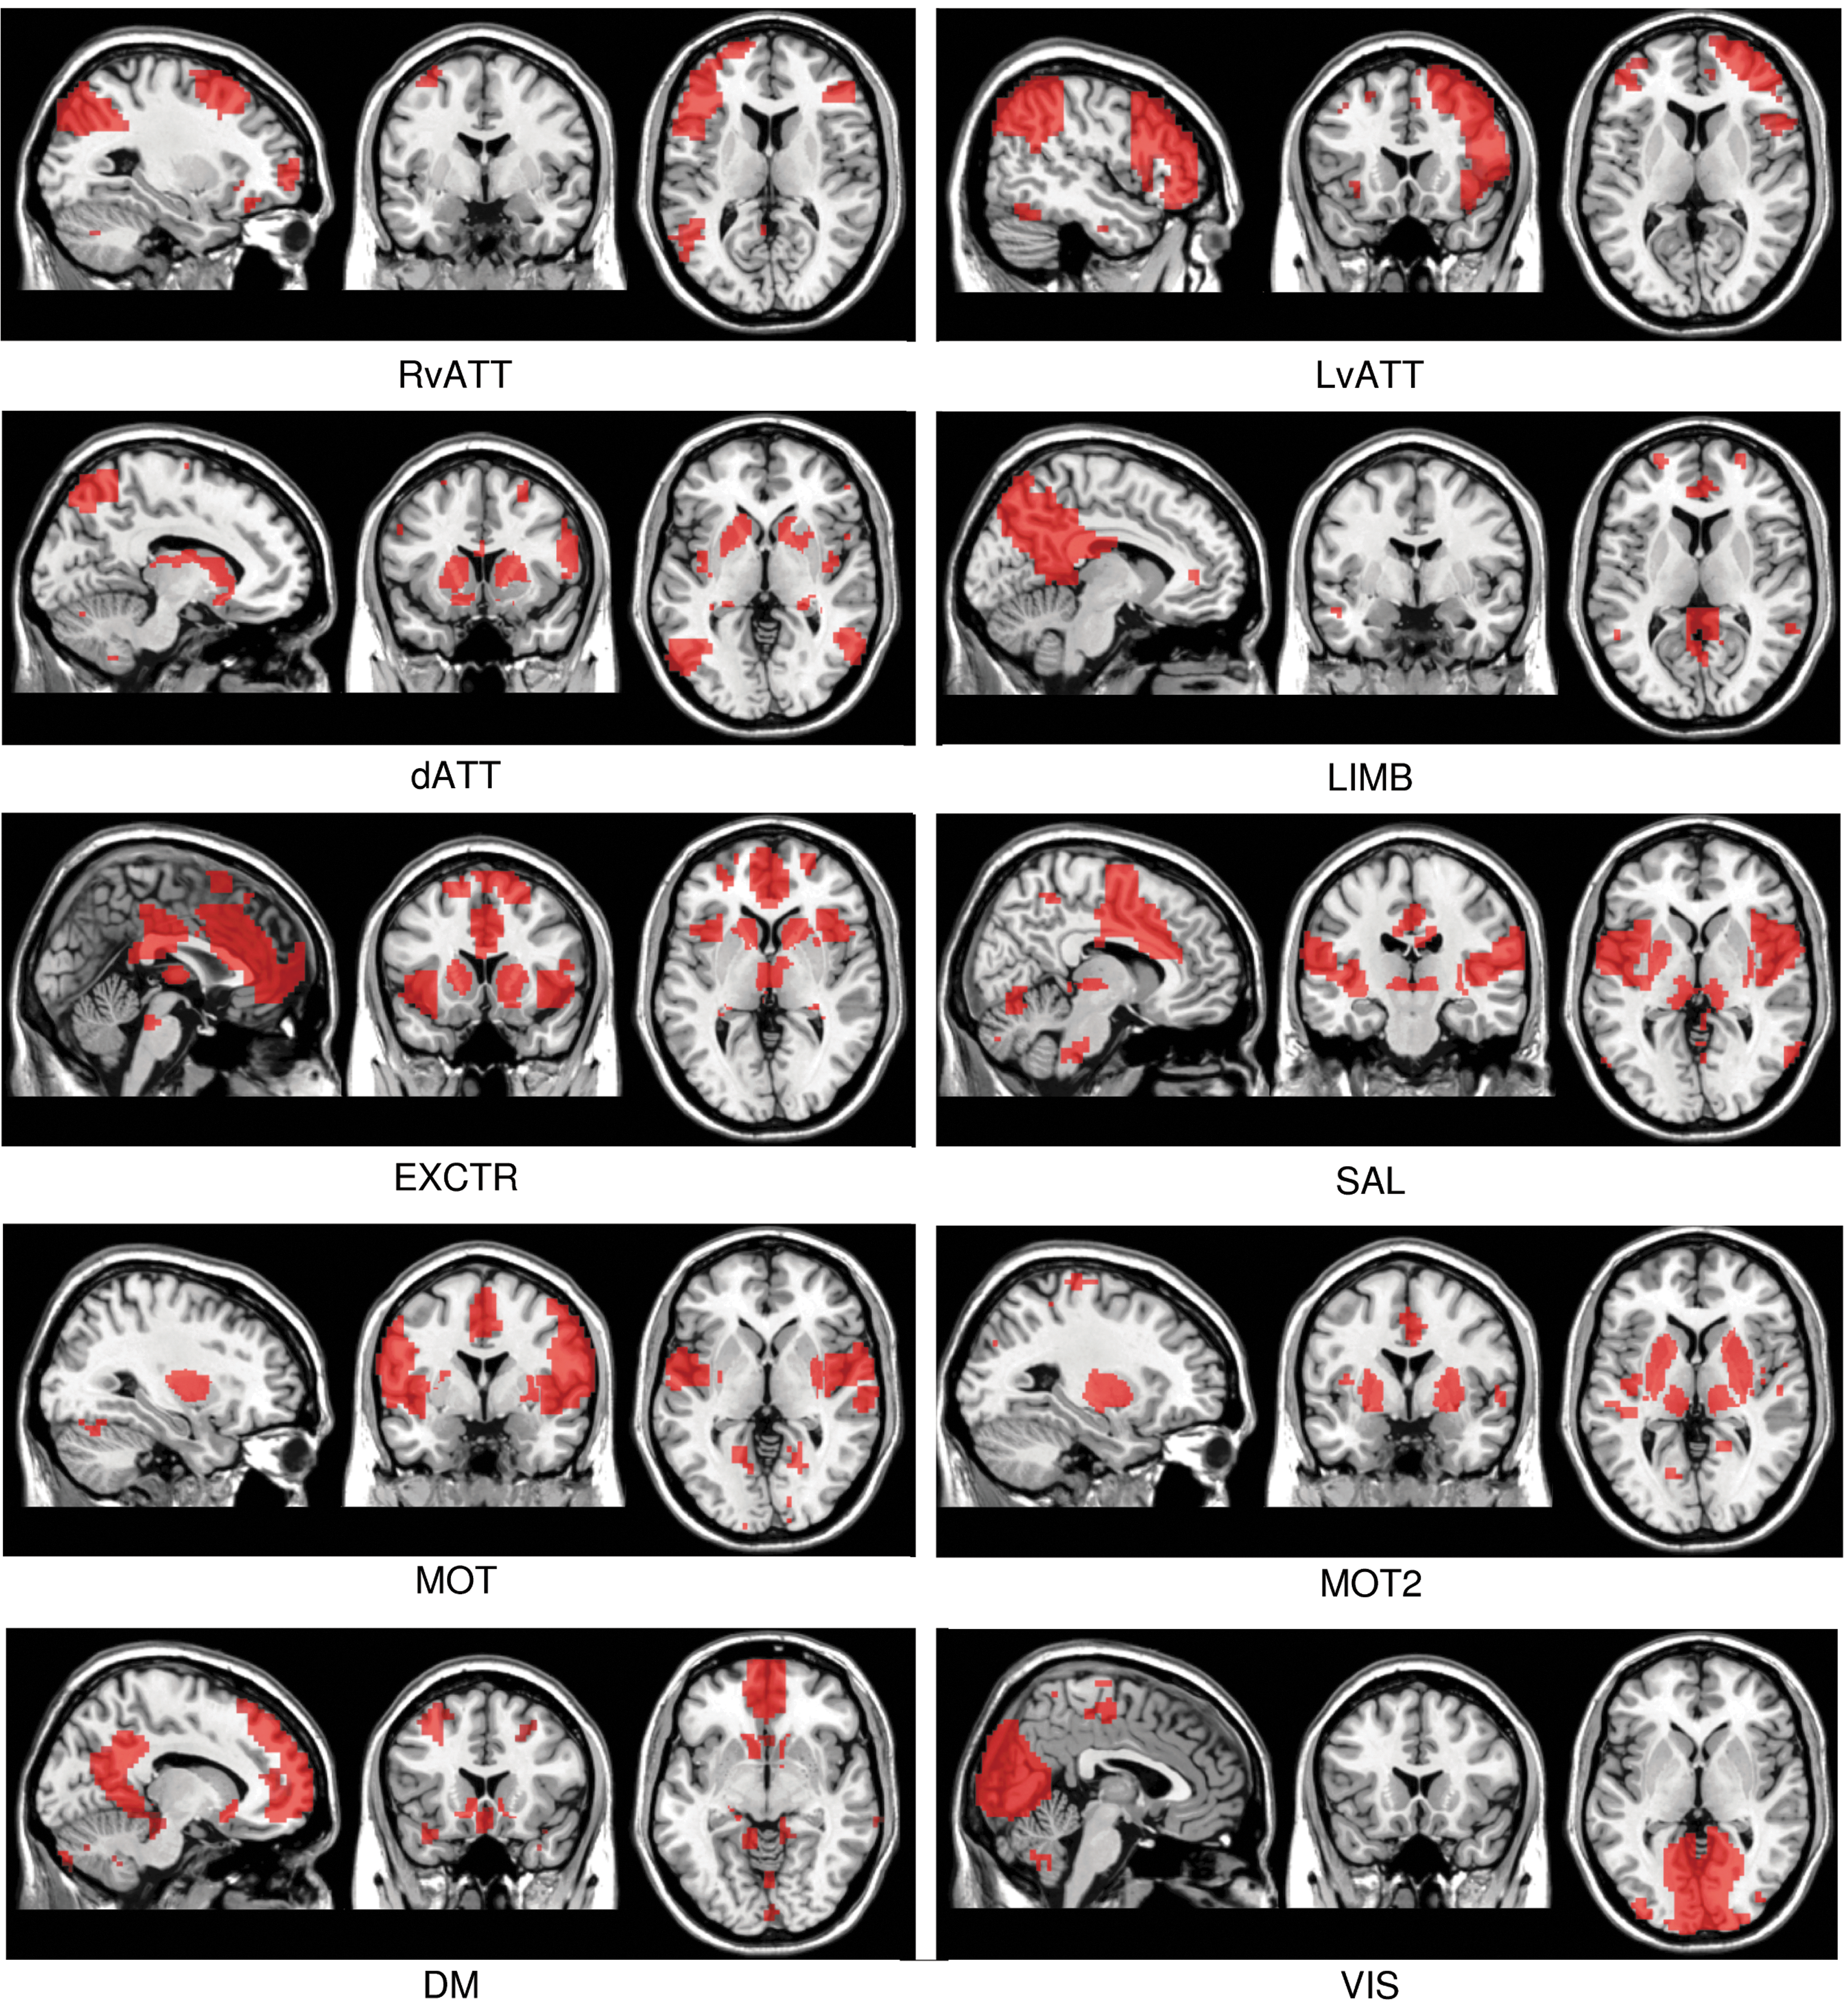
Networks obtained with the proposed method (cortical and subcortical components [SC] in red) superimposed on an anatomical template.
The comparison between SC obtained using the proposed method and functional territories from the atlas is illustrated in Figure 5, which shows for the MOT network the regions classified as sensorimotor, such as the sensorimotor putamen and the pulvinar in the thalamus.
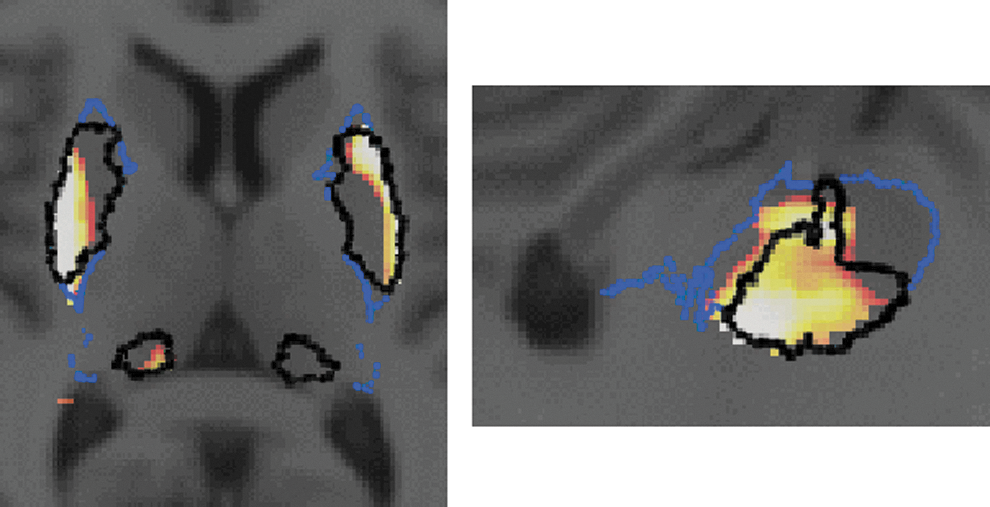
Comparison between SC obtained using the proposed method and the postmortem atlas. Axial view (left) and sagittal view (right) of the SC for the MOT network (color scale from red to white), superimposed on the postmortem atlas. The atlas segmentation for the motor territory of the putamen and pulvinar is outlined in black; the outline of the entire putamen is shown in blue.
Comparison of datasets 1 and 2
Figures 6 and 7 show V comp (SC thresholded at p<0.01, uncorrected) for the right and left hemispheres, respectively. In the first dataset, the most involved SFT were the right and left sensorimotor putamen for both motor networks (MOT and MOT2) and the associative putamen for the MOT2 network. For the default mode network, the main SFT were the associative and limbic caudate nucleus, the limbic putamen, as well as several (ventro-lateral and medio-dorsal) thalamic nuclei. A comparison of datasets 1 and 2 revealed greater stability of the results in the right hemisphere than in the left hemisphere.
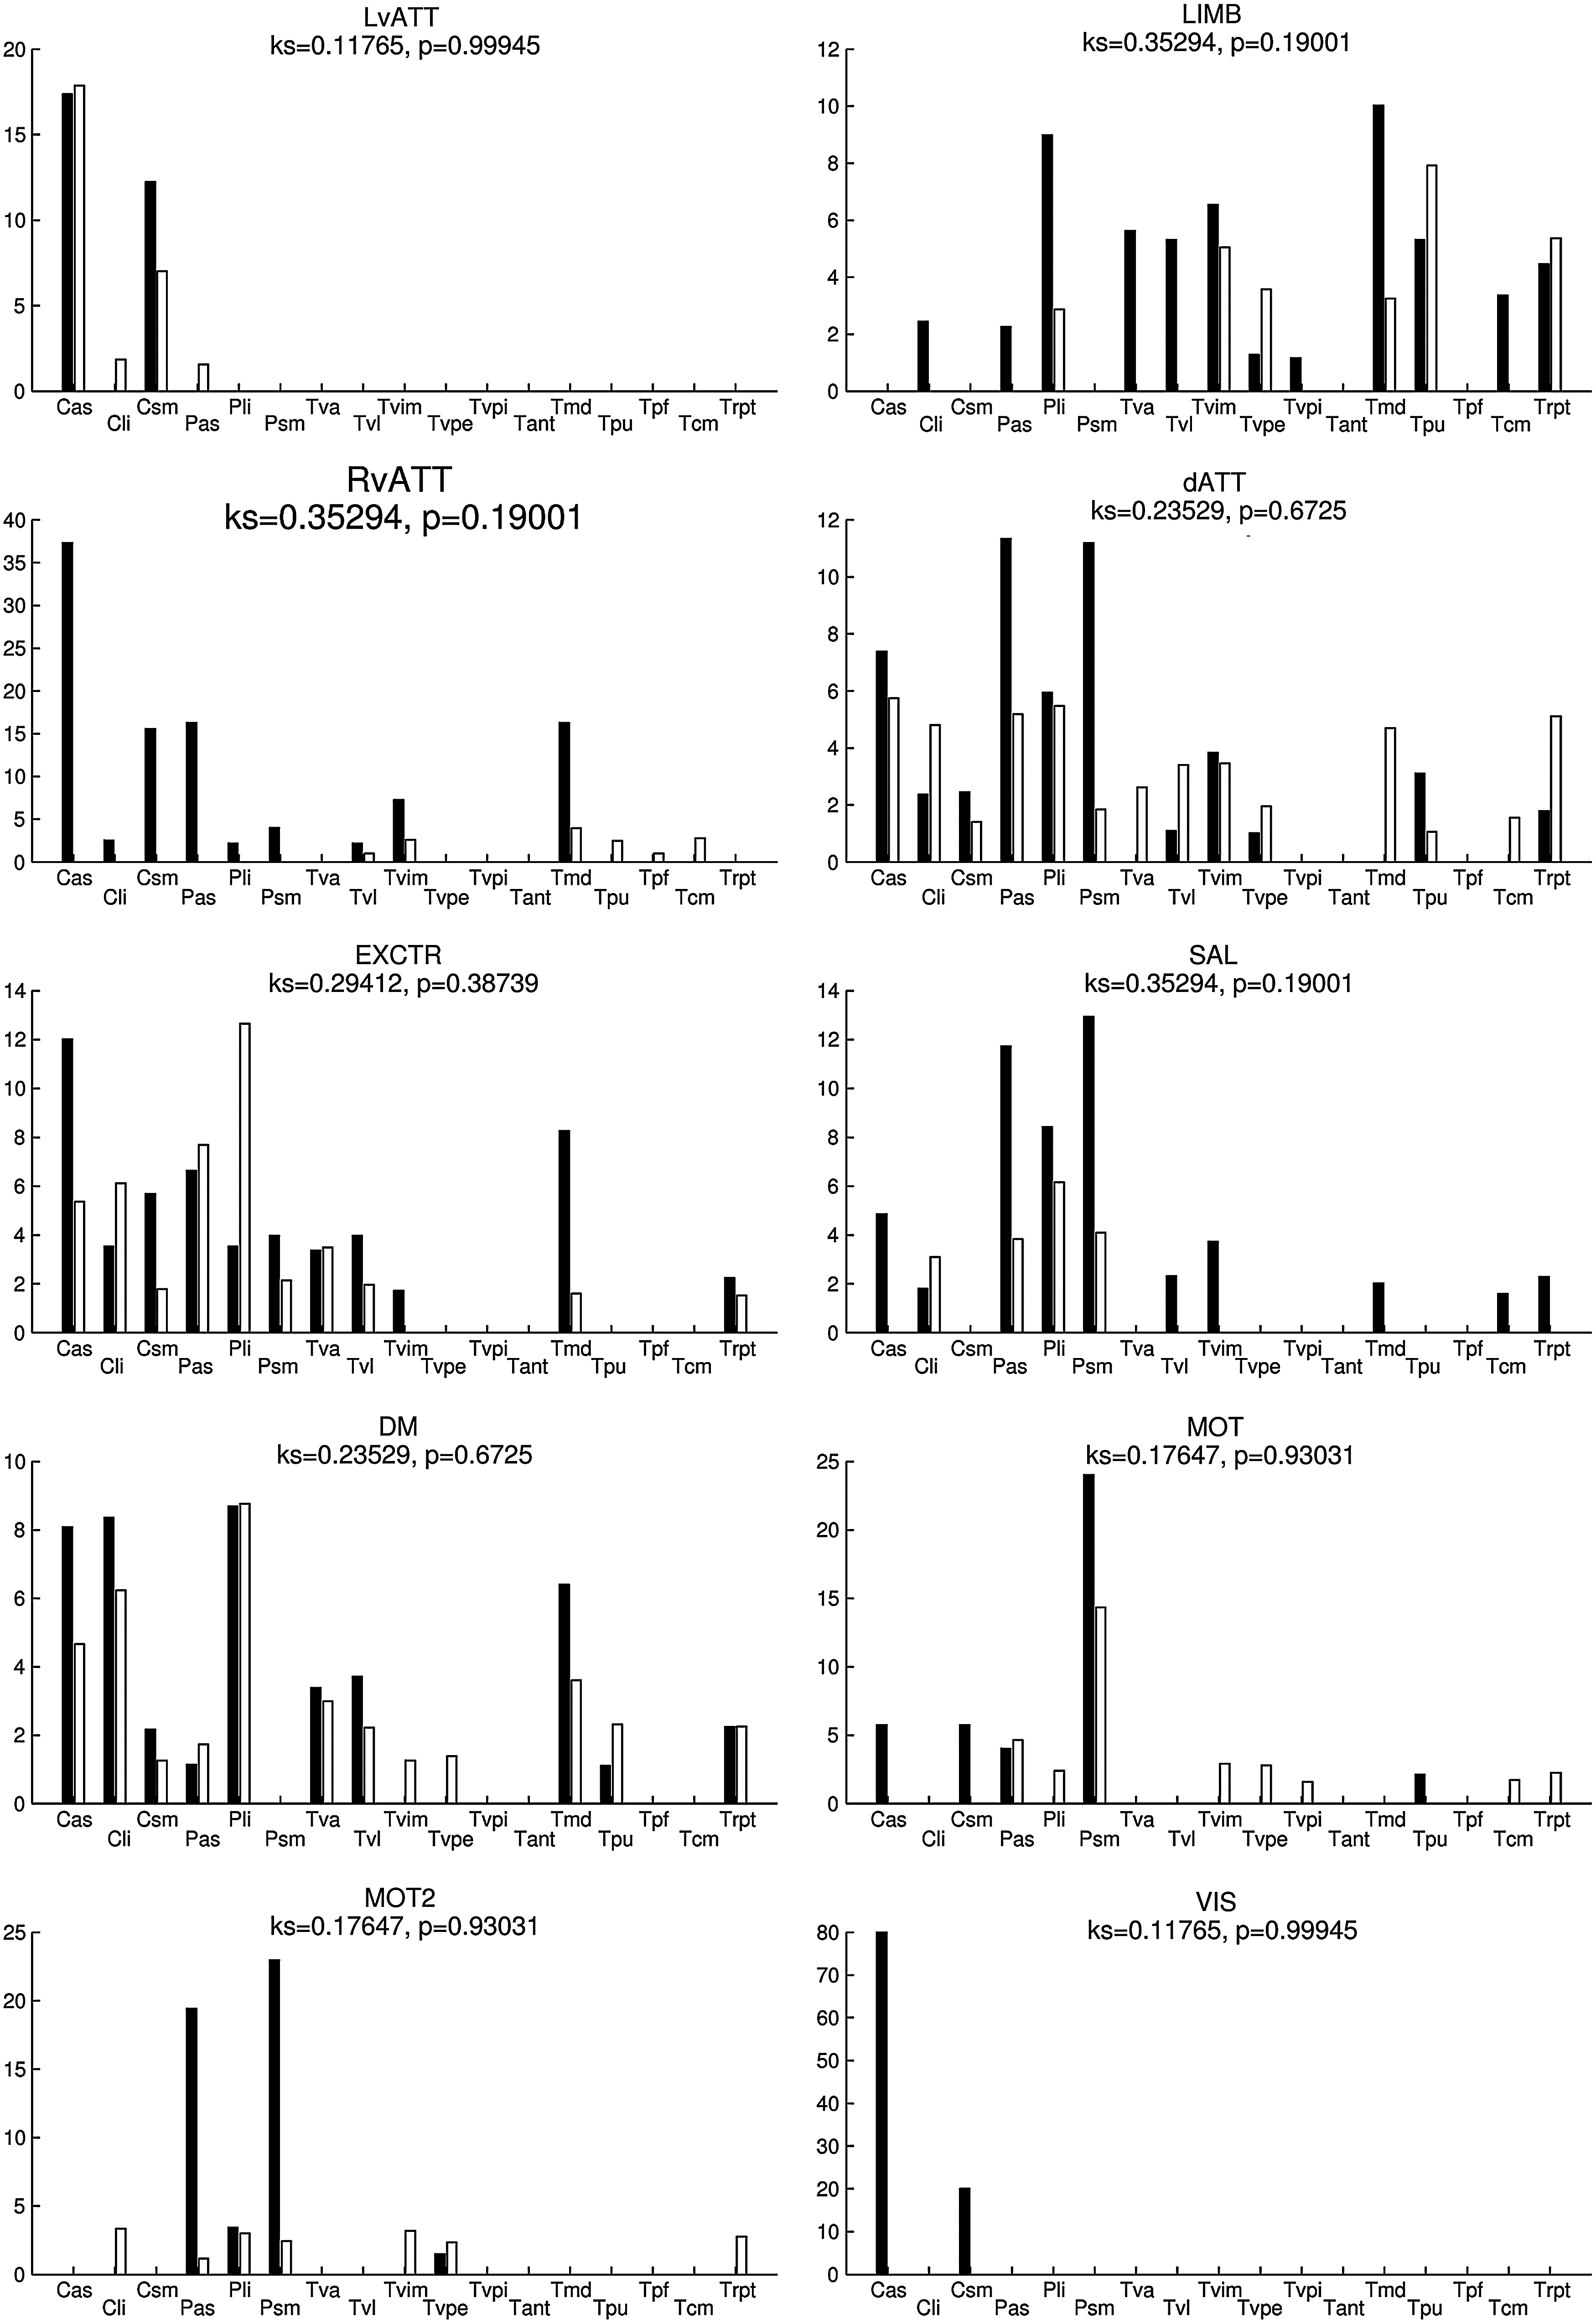
Percentage of voxels (V comp) of the SC maps (thresholded at p<0.01, uncorrected) in each subcortical functional territory (SFT) of the atlas for each functional network, for the right hemisphere. The results from dataset 1 (resp. dataset 2) are shown in black (resp. white). The structures examined included the caudate nucleus (C) and the putamen (P) and their respective associative (as), limbic (li), and sensorimotor (sm) territories, and the thalamus (T) with the anterior ventral (va), ventrolateral (vl), intermediary ventral (vim), ventral posterior external and internal (vpe and vpi, respectively), anterior (ant), mediodorsal (md), parafascicular (pf), and centromedian (cm) parts, the pulvinar (pu), and the reticular peri-thalamic nucleus (rpt).
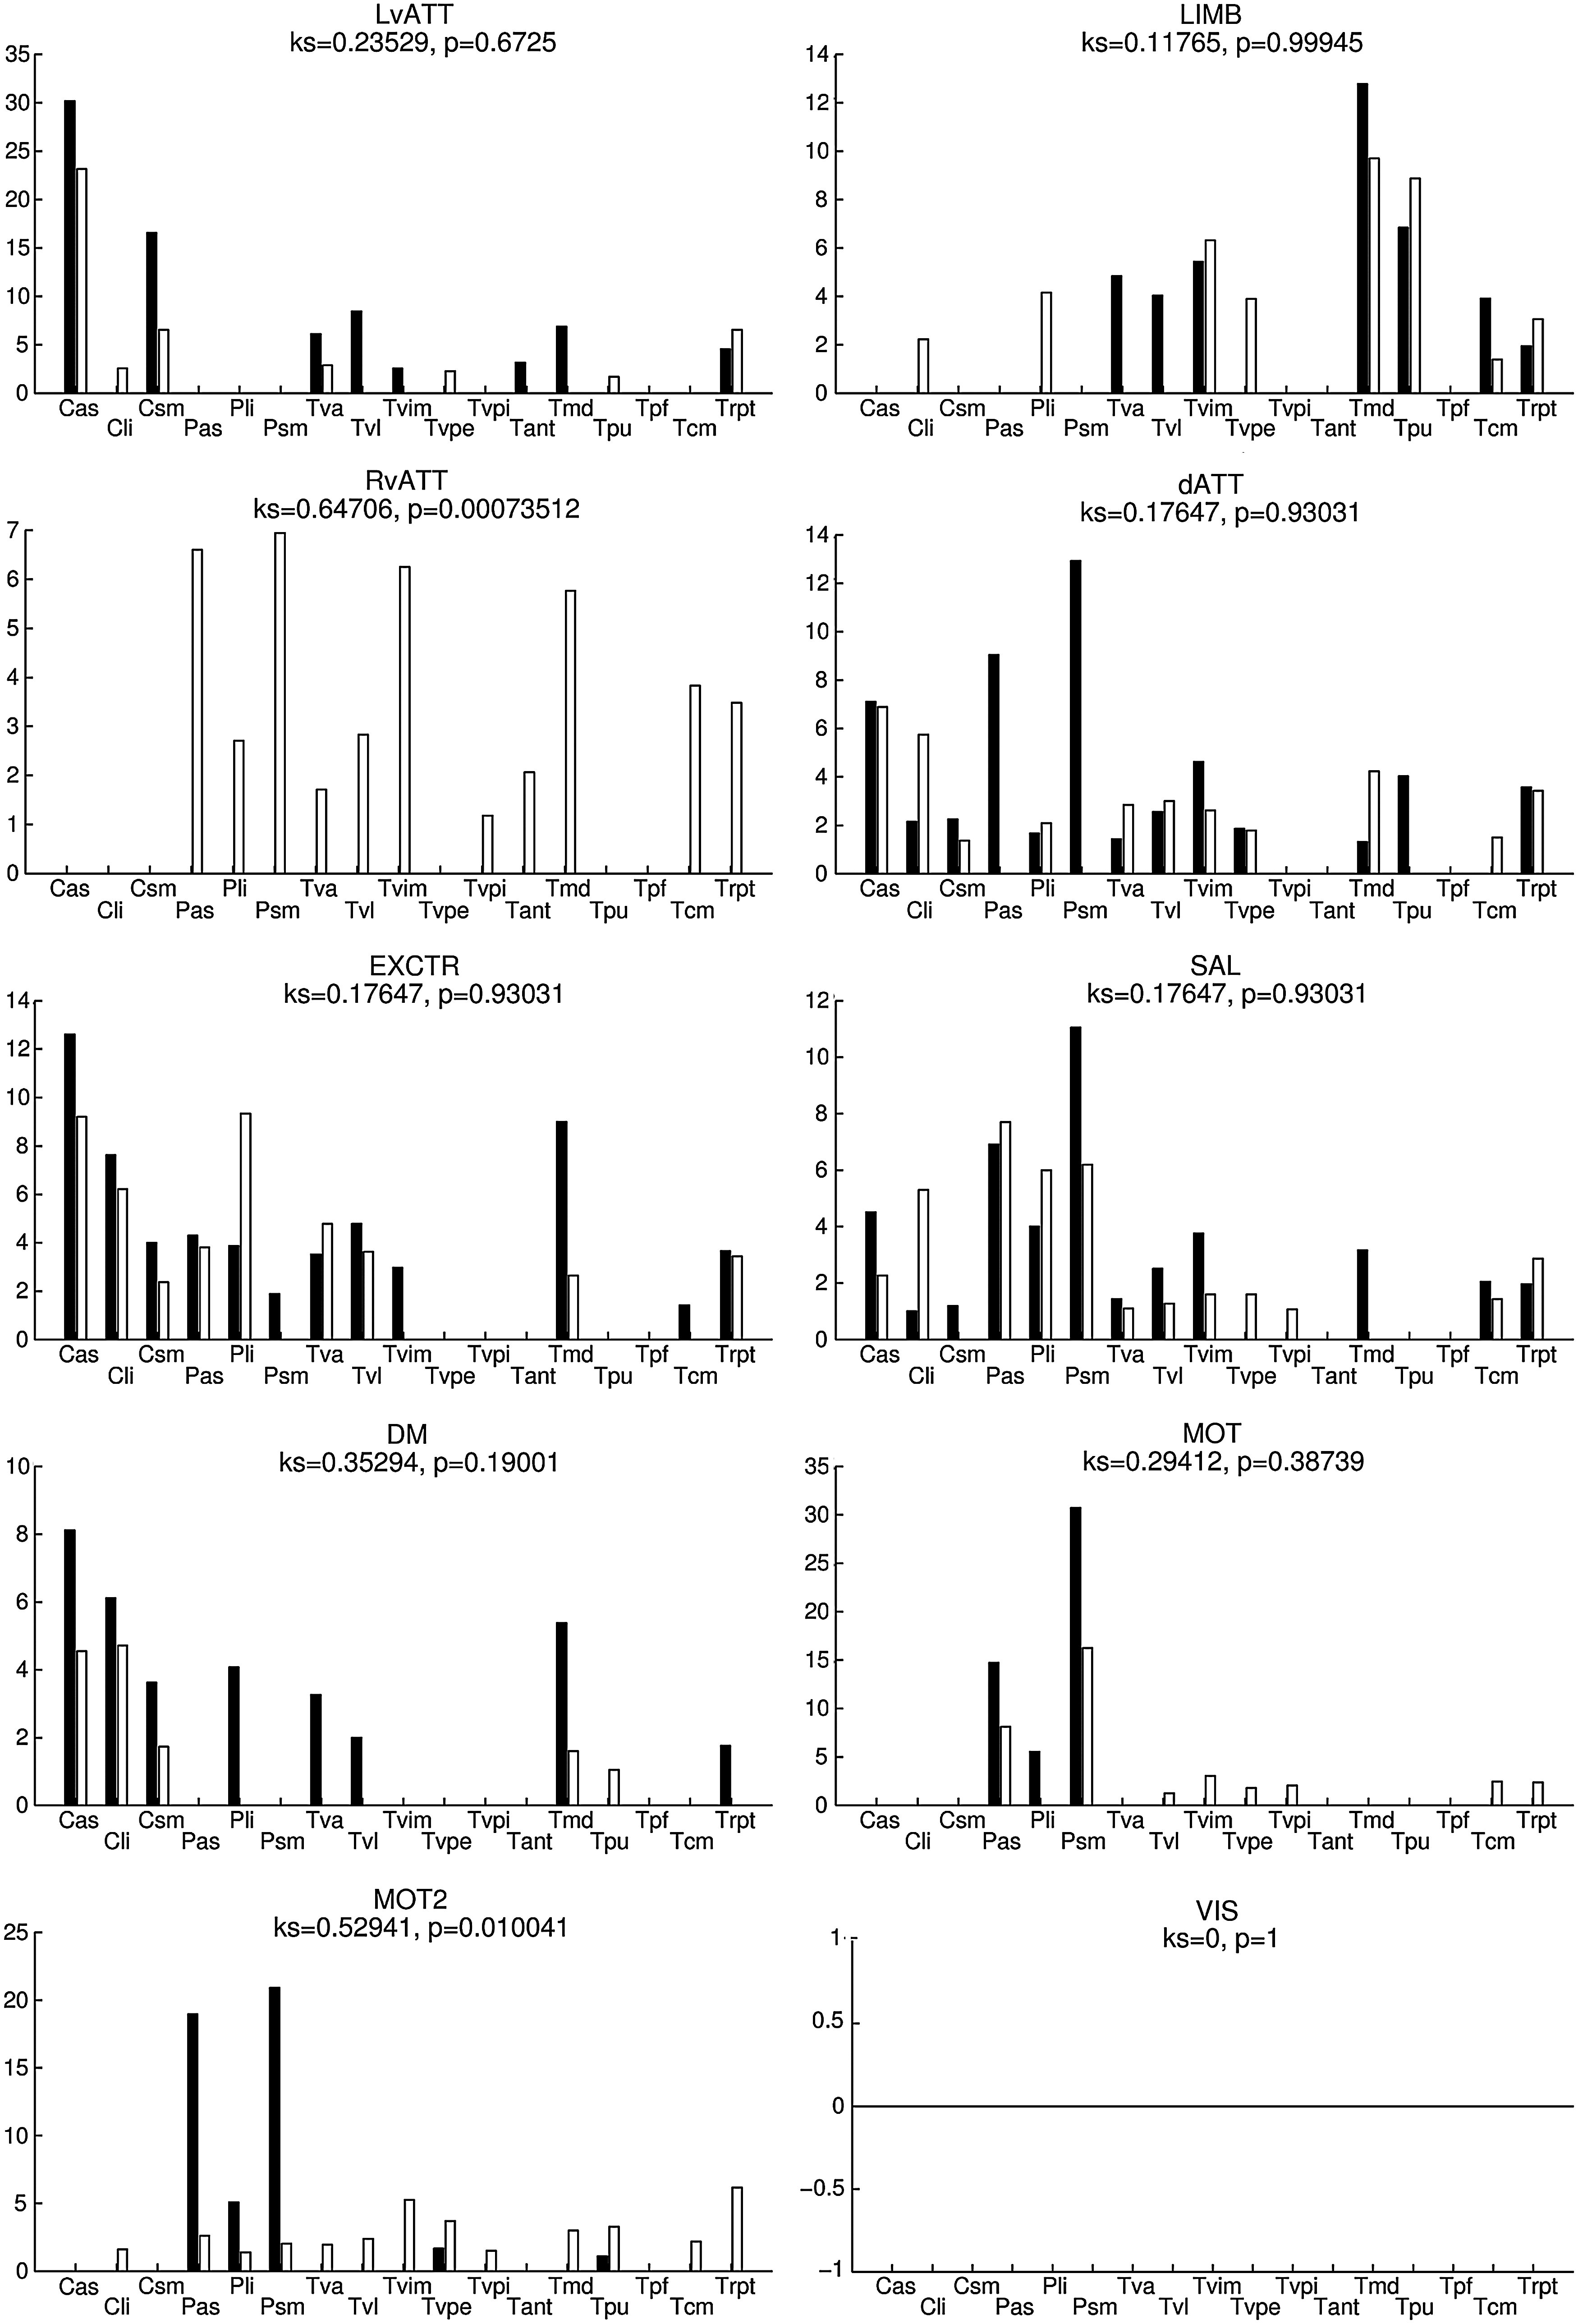
Percentage of voxels (V comp) of the SC maps (thresholded at p<0.01, uncorrected) in each SFT of the atlas for each functional network, for the left hemisphere. See Figure 6 for notations.
Furthermore, no statistical difference was observed (KS tests, all nonsignificant) when comparing the spatial distributions of the LvATT, LIMB, dATT, EXCTR, SAL, DM, MOT, and MOT2 networks, bilaterally, confirming a very stable extraction of SC. Reproducibility for the RvATT network was less satisfactory for the left hemisphere only (KS test, p<0.05).
Table 2 summarizes the overlap scores between datasets 1 and 2. Overlap scores were greater than 69% for all networks; more than 90% overlap was achieved for the DM network. This highlights the good consistency between the two datasets.
Relative Overlap of Subcortical Components Obtained from the Two Datasets, for Each Functional Network, with Group Maps Thresholded at p<0.01, Uncorrected
Discussion
In the past years, studies conducted on resting-state fMRI data have mainly reported functional networks on the basis of their cortical components (Damoiseaux et al., 2006; Perlbarg et al., 2008; Smith et al., 2009) and only a few studies extracted subcortical regions, either in a few number of components (Damoiseaux et al., 2008; Kim et al., 2013; Robinson et al., 2009) or associated to cerebellar and cortical regions (Habas et al., 2009).
In this article, we put forward a new method for extracting cortico-subcortical networks from resting-state fMRI data. First, using sICA at the individual level followed by a hierarchical classification at the group level, cortical networks were extracted from data where the striatum and the thalamus had been masked out. Then, SC associated to the cortical regions were extracted from the striatum and the thalamus data exclusively, by means of an individual GLM and statistical inference at the group level, using a bootstrap technique.
The proposed method better characterized cortico-subcortical functional loops than the NEDICA method alone. Damoiseaux and coworkers (2008) and Robinson and associates (2009) demonstrated that when extracting functional networks using sICA, they obtained a single component grouping together a large part of the pallidum, putamen, substantia nigra, subthalamic nucleus, and thalamus, bilaterally, which we also detected in both datasets using NEDICA on
An intuitive idea would have been to apply sICA directly on the striatum and the thalamus extracted from the rest of the brain to identify the SC of the functional networks. For instance, Kim and coworkers (2013) applied a group ICA on a volume of interest comprising subcortical regions. However, such a method should be taken with caution, because sICA requires the presence of noise in the data, whether physiological (cardiac or respiratory) or not, to detect reproducible spatial components. In fact, for NEDICA to extract these independent spatial components, the type of noise present in the striatum and the thalamus should be similar to that in cortical areas. The areas most often studied for noise components are the CSF, the white matter, the outline of the brain, and so on. Therefore, it is necessary to include these structures when extracting the components. Cordes and Nandy (2007), indeed, demonstrated that the addition of noise in sICA model increased the accuracy of the mixing matrix by 5% and, as a result, the accuracy of the spatial sources. The alternative could have been to apply sICA on a dataset where only the cortical ribbon would be masked, hence containing subcortical gray matter, white matter, and CSF. However, we suspect that the proportion of gray matter would have been low compared with that of white matter and CSF, therefore preventing sICA from separating gray matter subcortical regions into individual components. On the other hand, if sICA had succeeded in segregating individual SC, this would not have solved the issue of matching these components to cortical functional networks. We still would have needed a functional criterion to associate striatal and thalamic regions to the cortical areas and this would have led us anyway to assume time course similarity.
Kim and associates (2013) addressed this issue by computing a functional connectivity index (namely, the correlation) between cortical IC from a group ICA conducted on the whole brain, and subcortical IC from a separate group ICA conducted on subcortical regions, looking for significant correlations between pairs of IC time series. This approach is similar to connectivity analyses based on regions of interest. By contrast, we proposed to use a GLM to parcellate the striatum and the thalamus into different subregions that can directly be associated with the different cortical networks. Indeed, the GLM tries to determine the subcortical voxels whose measured time course is closely related with the average time course of the cortical networks. The cortical information is taken into account in the GLM through the choice of regressors, which are nothing but the average signals in cortical regions for each functional network. The proposed procedure is a mixed-effect statistical analysis, including a first-level individual GLM accounting for within-subject variance and a second-level group analysis accounting for between-subject variance, using bootstrap-based inference to ensure robustness of the regions at the group level.
The method presented in this article enables voxels in the striatum and the thalamus to be segmented according to their functional links with the voxels in the cortex and classified into regions belonging to different functional networks. This has been visually and quantitatively validated with two datasets, thanks, in particular, to the use of an immunohistochemical functional atlas (Bardinet et al., 2009; Yelnik et al., 2007). We showed good consistency between SC detected in the striatum and the thalamus and functional territories from the atlas. Furthermore, within the striatum and the thalamus, the regions obtained for a given cortical network overlapped by at least 69% between both analysed datasets. The atlas also played a vital role in classifying the subcortical regions for each functional network, leading to the determination of functional belonging for these regions. We found that sensorimotor territories were mainly present in the motor functional networks, and associative sections from the atlas were found mainly in the right and left attentional ventral and attentional dorsal networks; limbic sections from the atlas were found mainly in the default mode network and the executive control network. In particular, for the default mode network, the subcortical regions that were detected included the associative and limbic caudate nucleus, the limbic putamen, and several (ventro-lateral and medio-dorsal) thalamic nuclei. These regions with limbic dominance are in agreement with the literature. For the VIS, the functional territories of the atlas were not involved, which may seem surprising as some thalamic structures (namely the lateral geniculate nucleus [LGN], the pulvinar, and the reticular peri-thalamic nucleus [Trpt, also known as the thalamic reticular nucleus]) are known to be involved in visual function (Saalmann and Kastner, 2011). Indeed, the LGN sends inputs to the primary visual cortex V1; however, this very small structure was not referenced in the immunohistochemical atlas, and hence was not present in the subcortical mask used in our procedure. This explains why we did not find any overlap between the SC of VIS and the atlas. “Top-down” inputs from V1 to the Trpt have also been suggested to be a consequence of attentional activation in V1 (Montero, 2000); however, our study was based on resting-state data with eyes closed and no external stimulus, and this may explain why no implication of this structure was found. On the other hand, we found that the pulvinar and the Trpt were involved for instance in the dorsal and ventral attentional networks, which contained associative visual regions.
Besides, it should be noted that the functional networks extracted did not belong exclusively to one functional category, sensorimotor, associative, or limbic. Indeed, in most cases, they belonged to two categories with a dominant component. For example, the motor network MOT2 mainly overlapped not only the sensorimotor putamen but also the associative putamen. Similarly, the default mode network overlapped not only limbic regions (limbic caudate nucleus and limbic putamen), but also the associative (medio-dorsal) thalamus and the caudate nucleus. This demonstrates that the functional networks identified cannot be considered purely associative, limbic, or sensorimotor, but rather, they result from a set of cognitive functions interacting with one another, through common regions.
The results also show that the striatum was highly involved in all functional networks. This finding conforms to other studies, which indicate that the striatum receives projections from the entire cortex (Alexander et al., 1986; Gopinath et al., 2011). This implies that this subcortical region has many connections with the sensorimotor cortex as well as with associative and limbic cortices.
Furthermore, the fact that results from both datasets were similar for the majority of functional networks (at least 69% subcortical overlap between the two datasets, and nonsignificant KS tests when comparing the datasets network by network, hemisphere by hemisphere) demonstrates the robustness of the method put forward in this work.
The most important limitation that we can raise about the method is related to the actual lack of independence in spatial components extracted by sICA. Indeed, Daubechies and colleagues (2009) highlighted that algorithms such as InfoMax and FastICA accurately capture spatial variability in activity patterns, but these algorithms are barely selective for independence. Moreover, they showed that the components were more sparse than independent. Another limitation comes from the low threshold used to compare datasets and SFT. Due to possible normalization inaccuracy in the striatum and the thalamus, and since the studied SFT are really close to one another, the detection of accurate SC is far from easy. If we chose a higher threshold, the overlaps between the two datasets would be less significant. Moreover, the lack of independence of individual spatial components may hinder the detection of accurate SC with a high threshold, across many datasets.
Later on, it would be interesting to study cortico-subcortical interaction using diffusion MRI (dMRI). Indeed, dMRI enables noninvasive access to cortico-subcortical loops, by tracking white matter fibers. It can be used alone (Draganski et al., 2008; Lehéricy et al., 2004) or combined with fMRI (Johansen-Berg et al., 2005). Behrens and coworkers (2003) segregated the thalamus using anatomical connections obtained by probabilistic tractography between the thalamus and the cortex. We plan to compare their segregation with the results obtained with the proposed method.
Another aspect of the study would be to compare results obtained from healthy subjects with those from patients suffering from pathologies associated with a documented dysfunction of cortico-subcortical loops.
Conclusion
We have proposed a mathematical data-driven method that, for the first time, provided access to both cortical and subcortical components of functional networks using resting-state fMRI. The proposed method accurately identified cortico-subcortical functional networks, as shown by the agreement between these networks and well-known anatomical and functional cortico-subcortical networks. The similarity of the results obtained from two different datasets further demonstrated the robustness of the method.
Footnotes
Acknowledgments
The authors are grateful to the Centre de Recherche de l'Institut Universitaire de Gériatrie de Montréal, Montréal QC, Canada, for providing data for this work. They are also very grateful to A. Villringer for making his data freely available on the 1000 Functional Connectomes Project website. C.M. was funded by the French National Agency for Research (ANR 07 NEURO 023-01).
Author Disclosure Statement
No competing financial interests exist.