
Abstract
Researchers have recently focused their attention on the intrinsic functional connectivity (FC) in the brain using resting-state functional magnetic resonance imaging. Seed-based correlation analysis (SCAC), which correlates a predefined seed region with other voxels in the brain, is a common index for FC. However, definition of seed sizes and locations was ambiguous in previous studies and this may lead to spurious results for people with a unique functional anatomy. To address this issue, this study proposes a novel method (SCAReHo) that provides a data-driven seed selection (including sizes and locations) method by incorporating regional homogeneity (ReHo) in the SCAC method. The disparities between SCAC and SCAReHo methods among 12 healthy participants were evaluated in the FC of default mode network (DMN), task-positive network (TPN), and amygdala network. The SCAReHo method bypasses the seed-selection ambiguity and enhances the sensitivity in detecting FC of the DMN, TPN, and amygdala network. This study suggests that the SCAReHo method improves the sensitivity of FC analysis and reduces the uncertainty of seed selection. Thus, this method may be particularly useful for psychiatric and neurological investigations.
Introduction
The brain consists of a number of regions with comprehensive local connections and inter-region integrations, forming specific cognitive functions in everyday life (van den Heuvel and Hulshoff Pol, 2010). However, little is known of its network-based neural assembly. To better understand how the brain works, researchers have used blood oxygenation level-dependent functional magnetic resonance imaging (fMRI) to investigate the hemodynamic consequences of neural activity (Martuzzi et al., 2010; Matthews and Jezzard, 2004). This approach is particularly successful in mapping task-evoked brain areas. Conversely, using the resting-state fMRI (RS-fMRI) technique, Biswal and colleagues (1995) found that the brain regions in charge of specific cognitive functions are intrinsically synchronized by low-frequency (<0.1 Hz) fluctuations. These fluctuations arise from perturbations of blood oxygenation or cerebral blood flow underlying the spontaneous neural activity (Biswal et al., 1995; Craddock et al., 2009). The RS-fMRI technique has recently proliferated in investigations on the intrinsic ongoing human functional architecture (Cole et al., 2010), identification of brain networks (Zou et al., 2009), and examination of functional abnormality in neurodegenerative pathologies or psychiatric disorders, such as Alzheimer's disease (Zhang et al., 2010a), schizophrenia (Jang et al., 2011), and major depression (Sheline et al., 2010).
Recent advances in RS-fMRI analysis methods, including seed-based correlation analysis (SCAC) and independent component analysis (ICA), have facilitated the investigation of functional connectivity (FC) at rest (Cole et al., 2010; van den Heuvel and Holshoff Pol, 2010). Unlike the unsolved determination of meaningful ICA components, the hypothesis-driven SCAC method provides a more straightforward metric to identify the functional connections among brain networks, with the support of prior neuroanatomical knowledge. However, because the literature shows various seed sizes and locations, the uncertainty of seed shapes, sizes, and locations can affect the resulting connectivity maps, and even lead to unexpected patterns (Cole et al., 2010; Zhong et al., 2009). For the SCAC method, seed location is commonly determined based on template coordinates or functional activation analysis (Ma et al., 2007), regardless of an imperfect registration algorithm and comprehensive subject variability (Golestani and Goodyear, 2011; Van Essen and Dierker, 2007). Seed locations must be modified in clinical cases because of functional changes in neurological pathologies or psychiatric disorders (Golestani and Goodyear, 2011). By combining both SCAC and ICA strategies, Beckmann and Smith proposed a novel dual-regression method that combines multisubject ICA with general linear model (GLM) analysis to estimate consistent connectivity regions in multiple participants (Beckmann et al., 2009; Filippini et al., 2009). Although it successfully bypasses the seed-selection issue, this method, which is based on the common components within a specific group, may cause the problem of circularity, increasing the chance of distorted statistical inferences (Kriegeskorte et al., 2009).
Beyond SCA- and ICA-based analysis, local indices, such as amplitude of low-frequency fluctuations (ALFF), fractional ALFF, and regional homogeneity (ReHo), are sensitive to clinical pathologies (Hoptman et al., 2010; Qiu et al., 2011; Zhang et al., 2010b). ReHo index, which is based on the calculation of Kendall coefficient of concordance (KCC), measures the temporal similarity between a given voxel and its neighborhood (i.e., 26 nearest neighboring voxels) involved in a specific condition (Zang et al., 2004). ReHo analysis is a local metric that determines the range of local synchronized (or connected) regions without dramatic variations, and is therefore less sensitive to the location of seed selection than SCAC. In addition, He and colleagues stated that ReHo analysis reflects brain activities during rest without any prior knowledge of seeds (He et al., 2004). This implies that ReHo can be used as an alternative seed-selection method. Thus, incorporating ReHo analysis into the SCAC method could be an effective strategy for solving the uncertainty of seed selection (including sizes and locations).
The main purpose of this study is to propose a novel seed-selection method (SCAReHo) to improve seed selection and increase the sensitivity of the SCAC method by incorporating ReHo information in the seed definition. This method is based on the assumption that all voxels within a seed region should exhibit temporal similarity because their time courses are to be averaged to form a reference time course for the SCAC. To ensure similarities between the intraregional time courses in the preselected seed region, the proposed method combines the preselected seed region with KCC information, and then obtains the reference time course by averaging the time courses of the regions of interest (ROIs). This study uses ROIs mediated by ReHo to generate seeds for correlation analysis, and then compares the SCAReHo-based connectivity maps with the SCAc-based results for three well-known functional networks: default mode network (DMN), task-positive network (TPN), and amygdala network (Fox et al., 2005; Fransson, 2005; Gu et al., 2010; Raichle et al., 2001).
Materials and Methods
Subjects
Twelve healthy young volunteers (six women, ranging in age from 23 to 28 years) without histories of neurological or psychiatric diseases were recruited to participate in this study. Before scanning, all participants were fully informed of the research process and provided written informed consent. During the RS-fMRI scan, participants lay supine in the scanner with their heads fixed with cushions to minimize head motion. They were instructed to relax, to keep their eyes closed, to remain awake, to think of nothing, and to perform no specific tasks. After scanning, all participants reported that they did not fall asleep during the scan.
MRI acquisition
The RS-fMRI experiments in this study were performed at the Taipei Tzu Chi Hospital using a 3 T GE HDx whole-body scanner (GE Healthcare Systems, Milwaukee, WI) equipped with an eight-channel receive-only head coil. The resting-state functional images were acquired parallel to the anterior commissure–posterior commissure plane using a T2*-weighted single-shot gradient-echo echo-planar imaging (EPI) sequence with the following parameters: repetition time (TR)/echo time (TE)=2000/30 msec, flip angle (FA)=90°, field of view (FOV)=230×230 mm2, in-plane matrix=64×64, and slice thickness=3 mm with a 1-mm gap. Twenty-eight axial slices per volume were acquired with 325 measurements. A high-resolution T1-weighted anatomical image was acquired with a three-dimensional magnetization-prepared rapid gradient echo sequence (TR/TE=8.7/1.7 msec, FA=15°, FOV=230×230 mm2, matrix size=256×256×156, slice thickness=1 mm, covering the whole brain).
Data analysis
Data preprocessing
The first 10 volumes acquired from each subject were discarded to achieve a steady-state signal and allow subjects to become accustomed to the acoustic noise of EPI (Chang and Glover, 2010; Long et al., 2008). To prevent head motion because of discomfort during the long scanning period, the following 180 volumes were adopted for subsequent analysis. Figure 1 shows a flowchart of the data processing stream. Data preprocessing was carried out using SPM2 (
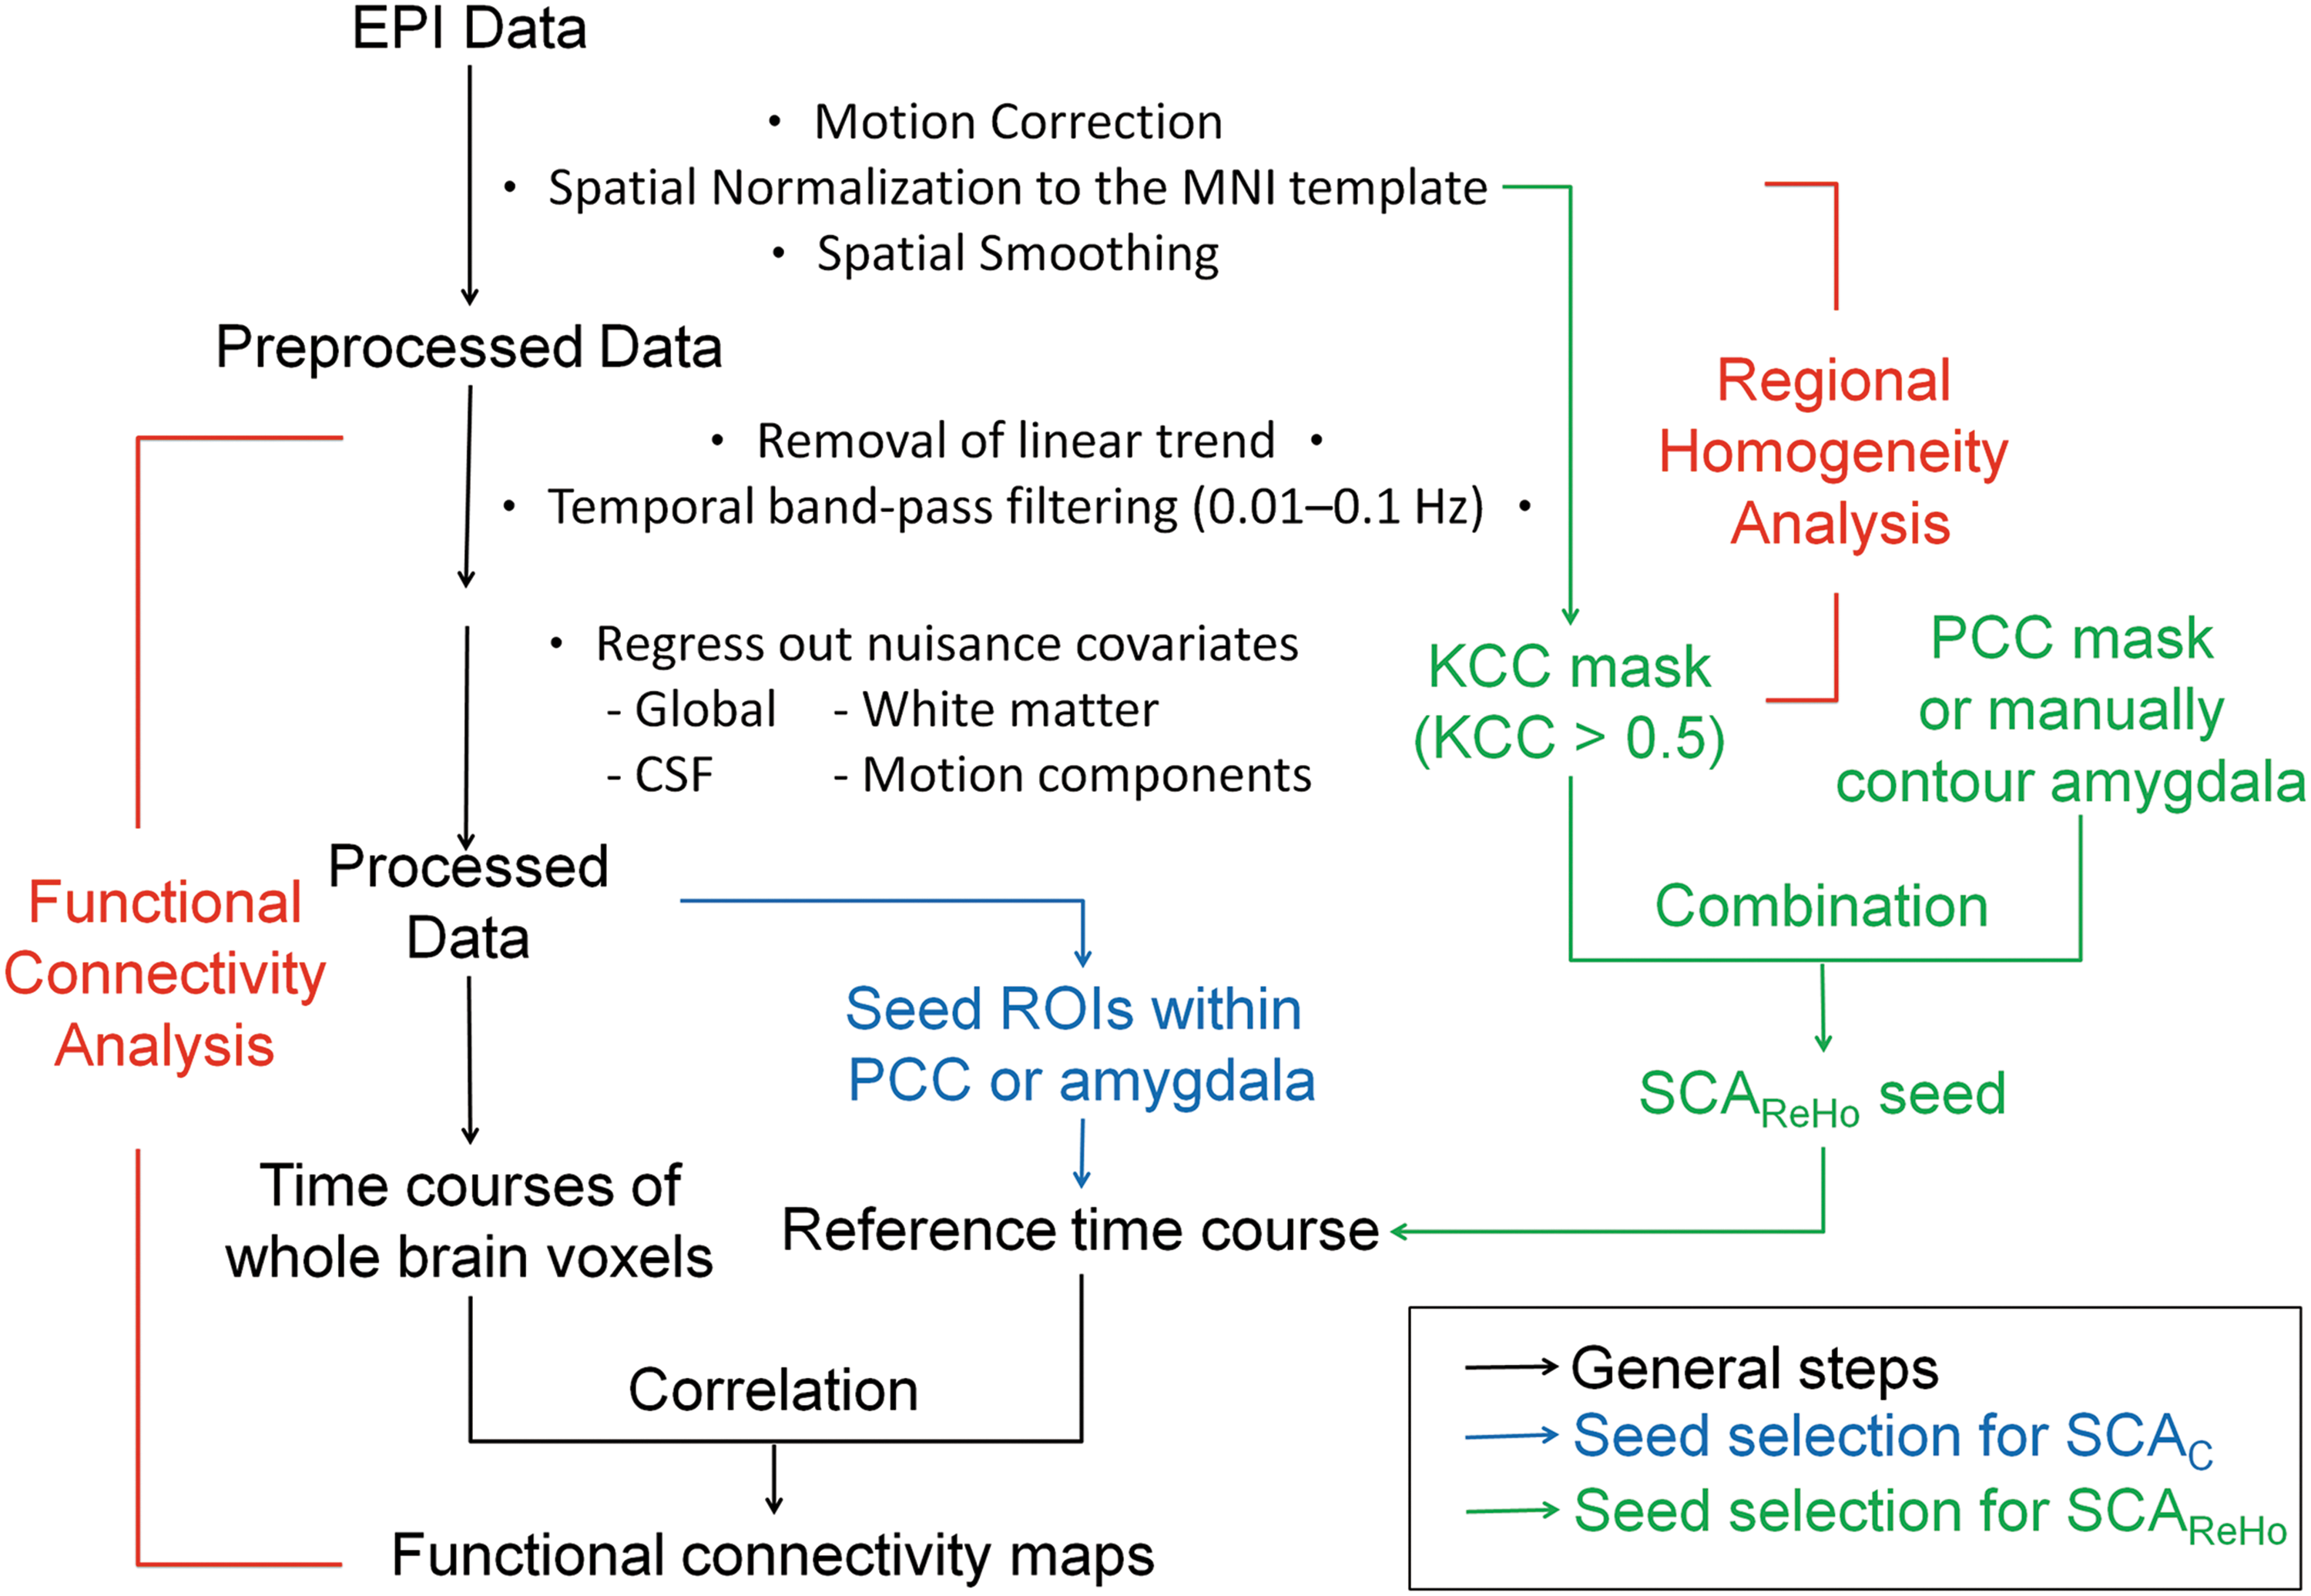
A flowchart depicting the data processing procedure. Black arrows indicate the steps for both the SCAC and SCAReHo methods. Blue arrows indicate the seed selection steps for the SCAC method. Green arrows indicate the seed selection steps for the SCAReHo method. SCAC, seed-based correlation analysis; ReHo, regional homogeneity.
Selection of seed ROIs
For the SCAC method, five spherical seeds previously used in the literature were defined, which included three seeds for the DMN/TPN and two for the amygdala network. Three DMN/TPN seed regions were the ROIs within the posterior cingulate cortex (PCC):
seed1: (1, −55, 17), radius=6 mm (Woodward et al., 2011);
seed2: (2, −51, 27), radius=4 mm (Uddin et al., 2009); and
seed3: (−5, −49, 40), radius=10 mm (Sadaghiani et al., 2009).
Two amygdala seed regions were the left (−23, −5, −15) and the right (23, −5, −15) side of amygdala, with radius=3 mm (Gu et al., 2010). Besides seed1, all other coordinates were defined in the Talairach space (Talairach and Tournoux, 1988), and converted to MNI coordinates using an algorithm implemented in the MATLAB script (tal2icbm_spm.m,
For the SCAReHo method, the normalized images were preprocessed with detrending and band-pass filtering (0.01–0.1 Hz) before generating the KCC maps. The KCC was used to identify the voxels that exhibited high temporal similarity with their neighboring voxels. Two parameters could be selected during the KCC-ReHo analysis: the cluster size (K) for KCC calculation and the threshold for masking the KCC map. The preprocessed images were then used to calculate the KCC values between the time courses of every given voxel and its 26 nearest neighbors (K=27) (Zang et al., 2004). The individual PCC seeds for the DMN/TPN were then generated by multiplying the binary KCC masks (KCC thresholds >0.5, 0.6, and 0.7, respectively), with a PCC mask obtained from the Stanford University ICA-derived default mode template (Greicius et al., 2004). In addition, three SCAReHo seed regions with their sizes similar to the three SCAC seeds were obtained for each subject by appropriately adjusting the KCC thresholds. Moreover, KCC maps with three K values (7, 19, and 27, respectively), were obtained for each subject and thresholded with KCC >0.5. Conversely, the individual amygdala seeds were generated from the common voxels within both the binary KCC mask (KCC threshold >0.5) and two unilateral amygdala masks, which were manually determined by referencing the corresponding T1-weighted anatomical images.
fMRI FC analysis
FC analysis was performed for each subject using REST. The reference time course was extracted by averaging the time courses of all voxels within subject-specific seeds. The particular FC map for each seed was then obtained by computing the Pearson's correlation coefficient (r) between the reference time course and the time course from every other voxel in the brain. The r map was then transformed to approximate Gaussian distribution using Fisher's z transformation (Long et al., 2008).
Statistical analysis
Group analysis was performed on the transformed z maps. For each seed, a one-sample t test was conducted to identify the voxels with significant correlations with each seed (p<0.01, corrected for multiple comparisons with a false discovery rate [FDR] criterion; cluster threshold=10 voxels). The connectivity differences of DMN or TPN between SCAC and SCAReHo methods were computed by the paired t test comparison (p<0.05, corrected with FDR; cluster threshold=10 voxels). To avoid the possibility that a significant between-group finding with a positive t value might come from a null-minus-negative effect or vice versa, the paired t test results were masked by using the union of two individual one-sample t test results (Ma et al., 2011). For amygdala connectivity, differences between SCAC and SCAReHo methods were tested using a paired t test comparison with p<0.001 uncorrected. This yielded a significance of p<0.05, corrected for multiple comparisons, determined by the AlphaSim program in REST, within the amygdala mask based on the automated anatomical labeling template (Tzourio-Mazoyer et al., 2002). To examine the effect of KCC threshold for the SCAReHo method, one-way analysis of variance (ANOVA) was conducted to assess the DMN/TPN connectivity results from three different thresholds (KCC >0.5, 0.6, and 0.7, respectively).
To compare the sensitivity of both SCA methods, the average z scores and cluster sizes were obtained in three DMN regions, including the medial prefrontal cortex (MPFC), and left and right inferior parietal cortex (L_IPC, R_IPC), based on the Stanford University ICA-derived default mode template (Greicius et al., 2004). The significantly connected voxels in each subject were determined based on a statistical threshold of two-sided, uncorrected p<0.001. This ROI analysis was also applied to examine the differences between three different KCC thresholds using one-way ANOVA.
MNI coordinates of regions showing a significant difference between both SCA methods were converted to Talairach coordinates (Talairach and Tournoux, 1988) using an algorithm implemented in the MATLAB script (icbm_spm2tal.m,
Analysis of New York University data
Another resting-state data set was adopted to analyze the DMN/TPN connectivity with the proposed method and used to evaluate the efficacy of seed3 in different normal populations. The FC pattern obtained with seed3 was distinct from other groups in this study (see Results); however, this seed has been commonly used to analyze the DMN connectivity in the literature (Bai et al., 2009; Long et al., 2008; Sadaghiani et al., 2009).
A total of 25 right-handed native English-speaking participants were selected from the New York University (NYU) Test–Retest Reliability dataset (publicly available as part of the 1000 Functional Connectomes Project,
With the exception of seed selection, all the data preprocessing, data analysis, and group analysis procedures were the same as described. For this dataset, only the seed3 was used for the SCAC method, and only one KCC threshold (KCC >0.5) was applied for the SCAReHo method.
Results
DMN and TPN
Selection of seed ROIs
Figure 2a–c show three PCC seed regions for the SCAC method, and Figure 2d shows the probability maps of the PCC seed for the SCAReHo (KCC >0.5) method. Figure 2e shows the relative positions of these seed regions. Three PCC seed regions produced by SCAC did not overlap, and the center of each PCC seed was far from the others. Compared with other predefined seeds, the PCC seed region of SCAReHo was relatively wide (cluster size=1053±67 voxels), covering PCC and precuneus regions.
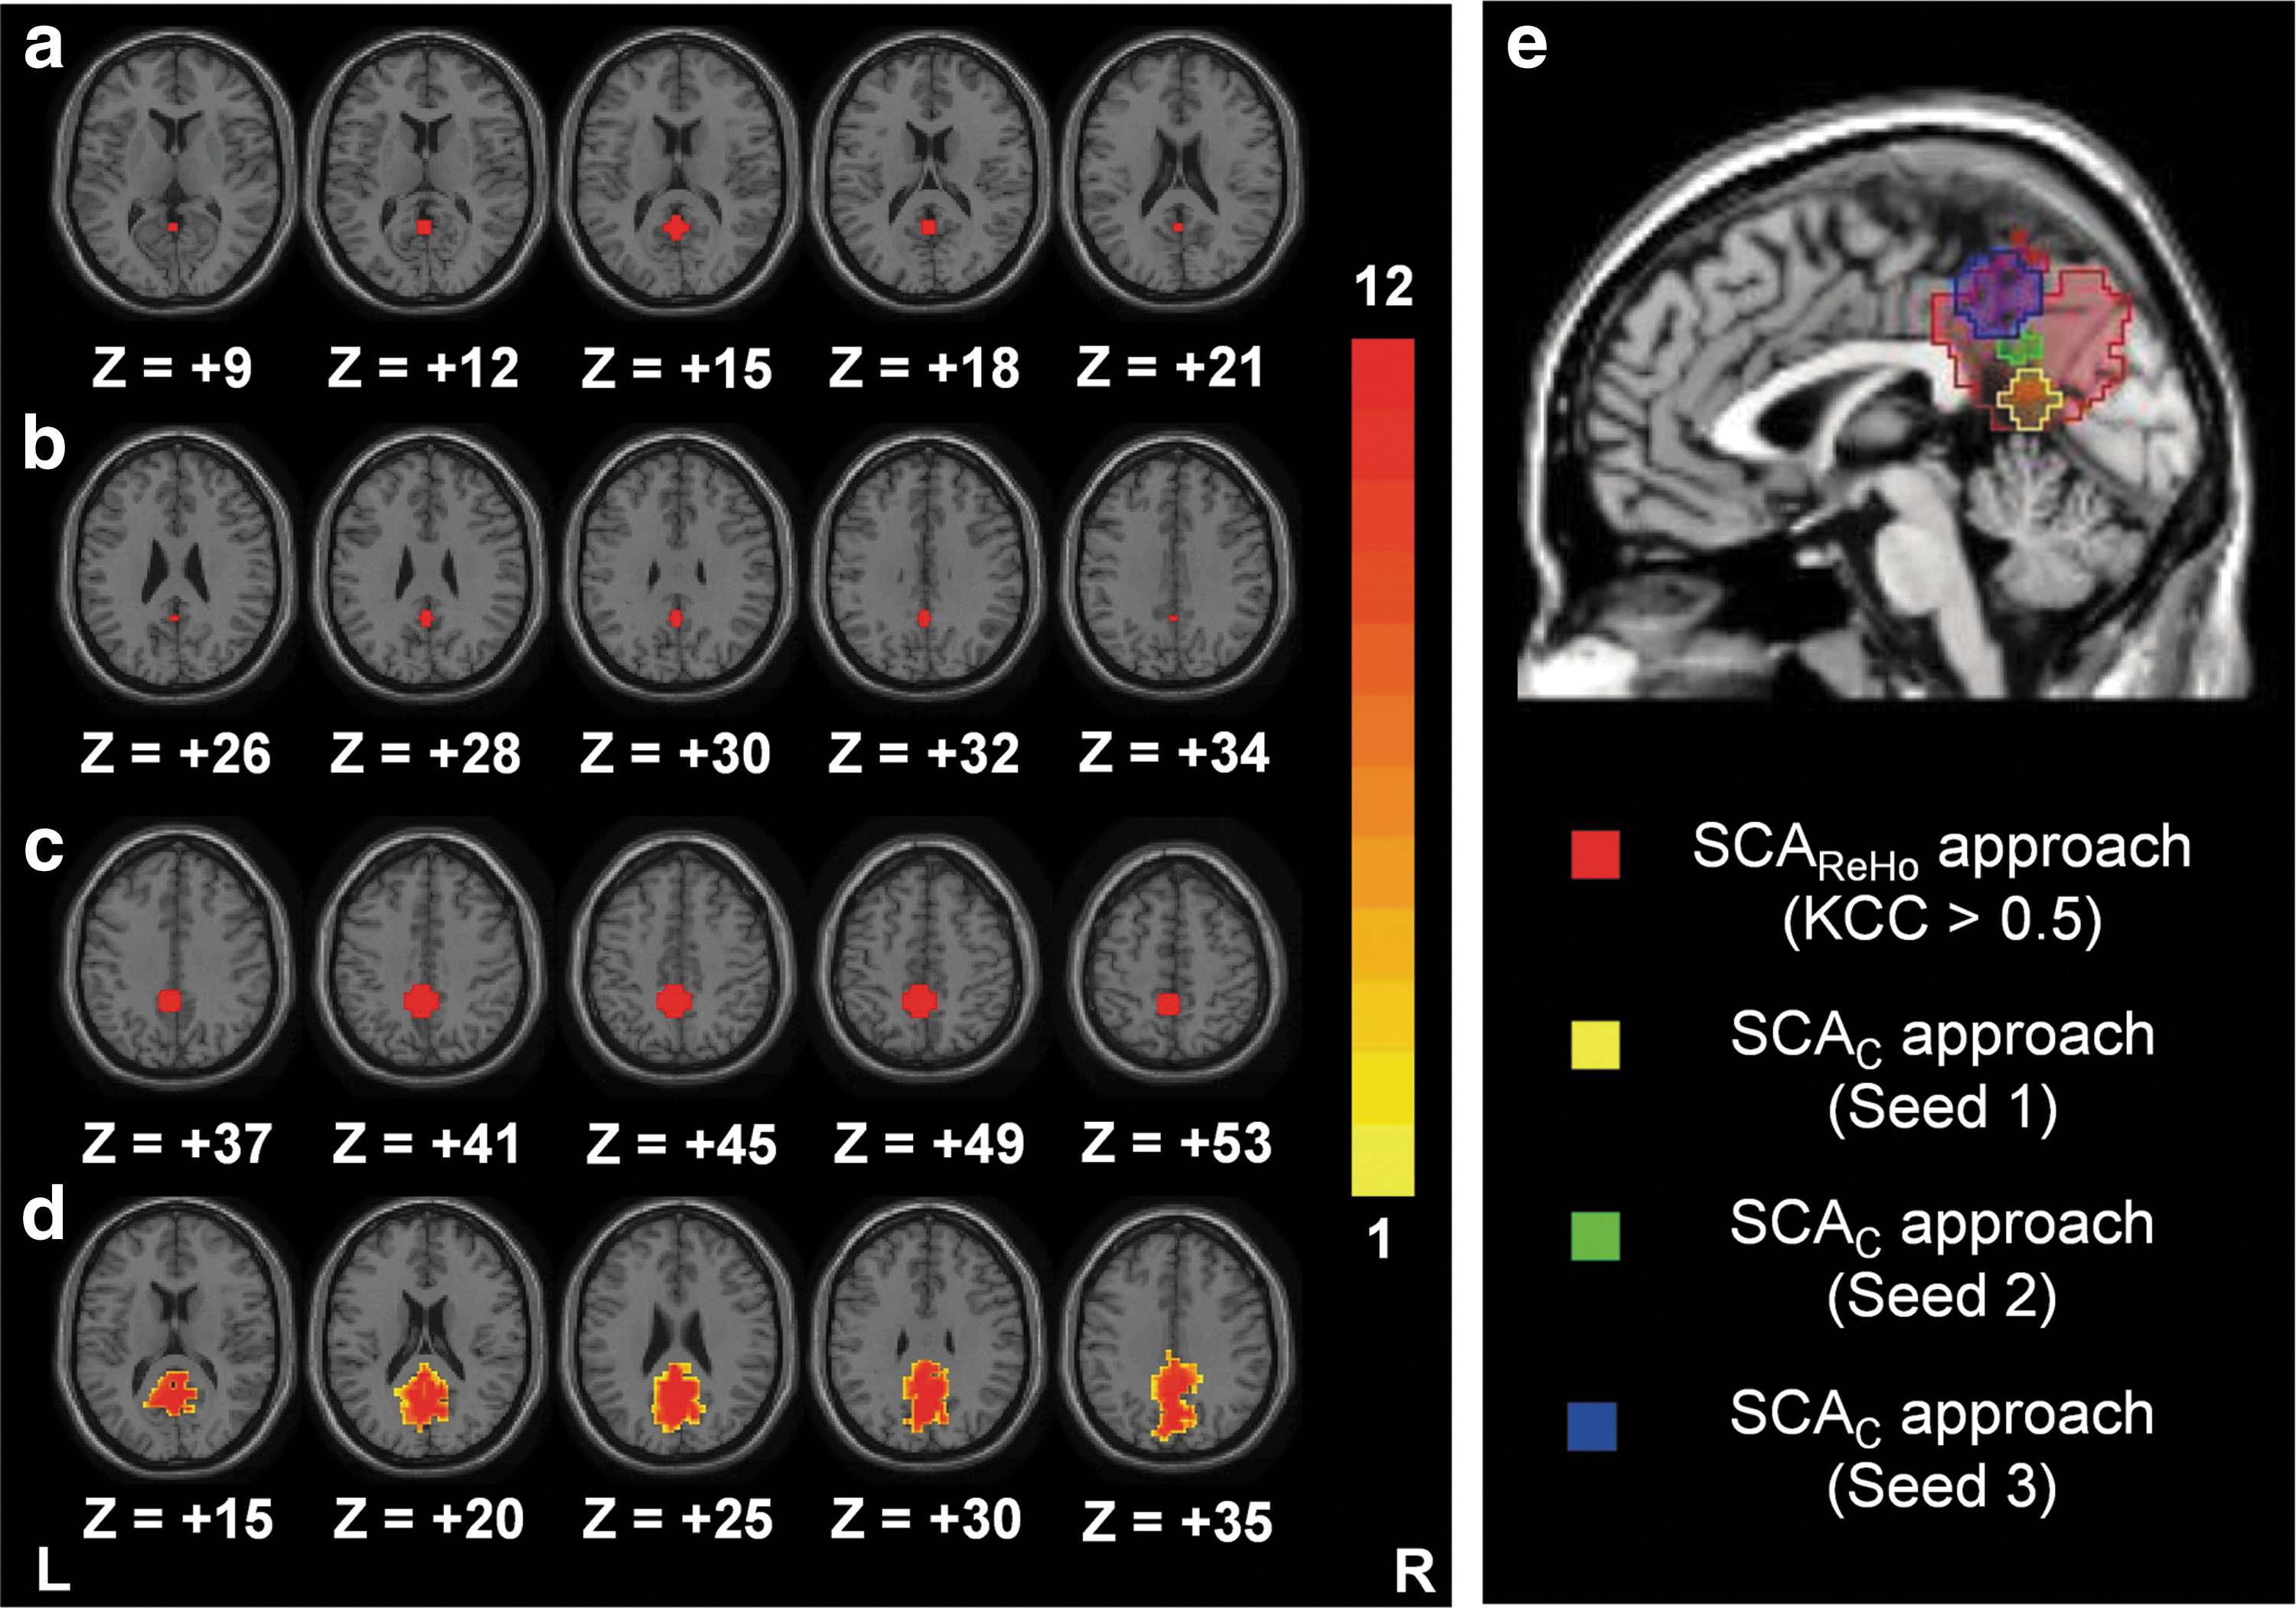
Probability maps (n=12) describing the PCC seed regions for the SCAC [seed1
FC maps
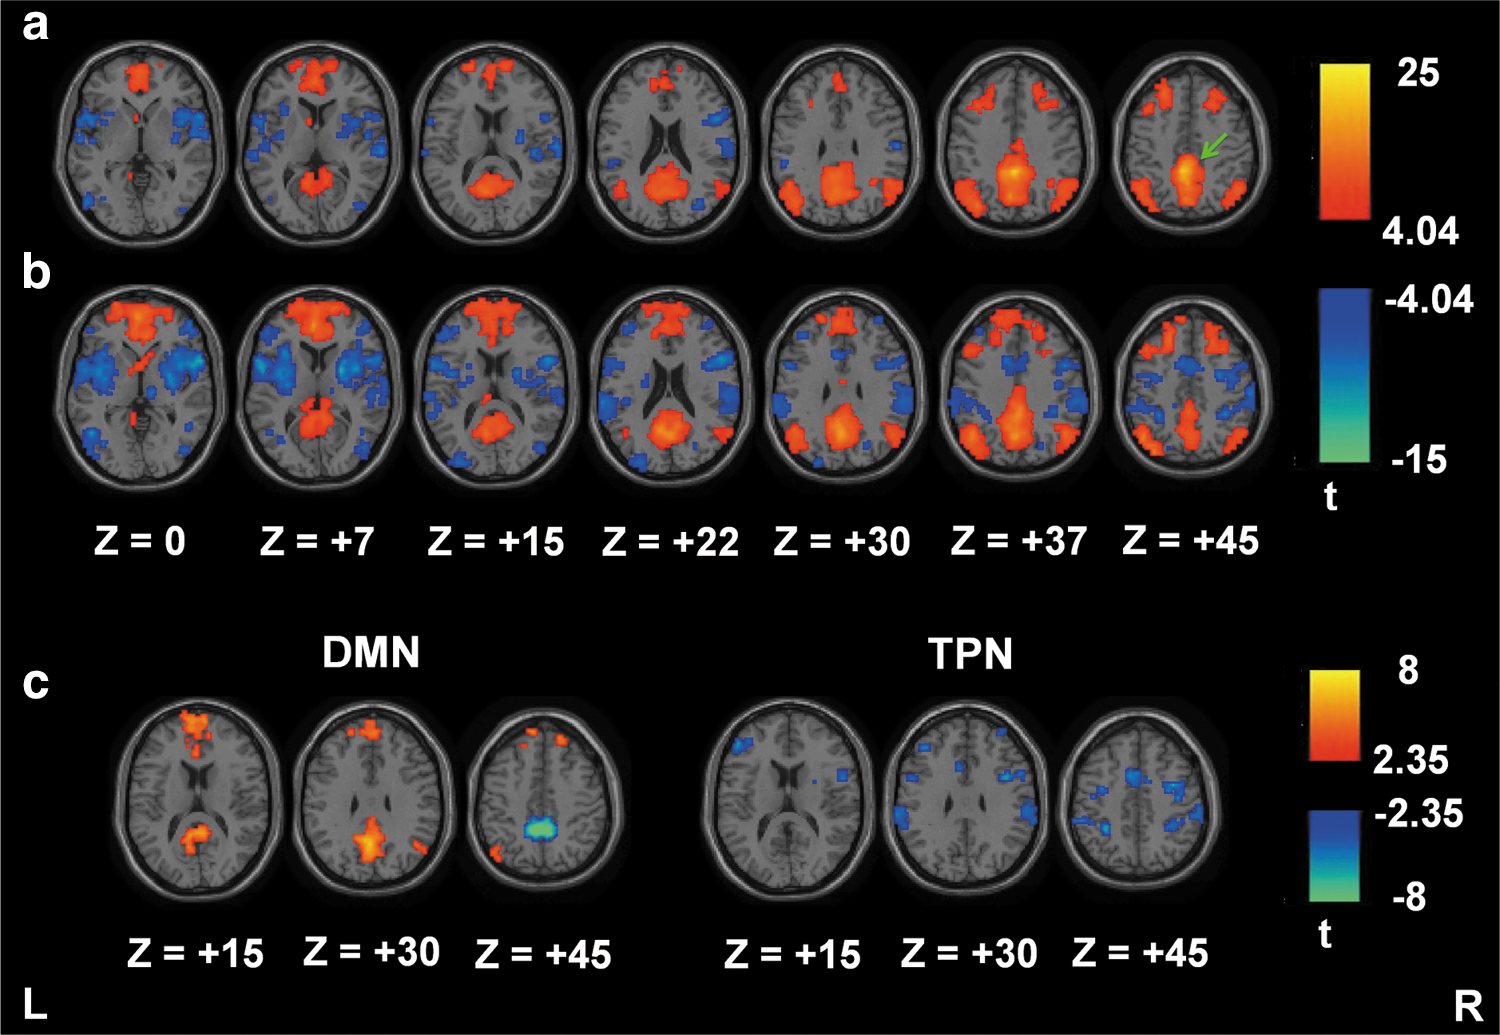
Figure 3 shows the one-sample t test results of DMN/TPN connectivity for 12 healthy young participants using SCAC and SCAReHo (KCC >0.5). Consistent with previous reports (Long et al., 2008; Uddin et al., 2009; Zhong et al., 2009), FC results from seed1, seed2, and SCAReHo seed show that brain regions in MPFC and bilateral IPC had a significantly positive correlation with PCC/precuneus (i.e., the DMN) (Fig. 3a, b, and d). In addition, other regions in the bilateral dorsolateral prefrontal cortex (DLPFC), bilateral insula, bilateral inferior parietal lobule (IPL), supplementary motor area (SMA), and postcentral gyrus had a significantly negative correlation with PCC/precuneus (i.e., the TPN). However, the SCAC method using seed3 only demonstrated local brain connections around the PCC region without explicit long-distance connectivity using the same statistical threshold (Fig. 3c). According to previous studies (Cole et al., 2010; Zhong et al., 2009), these results indicate that variations in seed locations with SCAC affect the resulting connectivity maps.
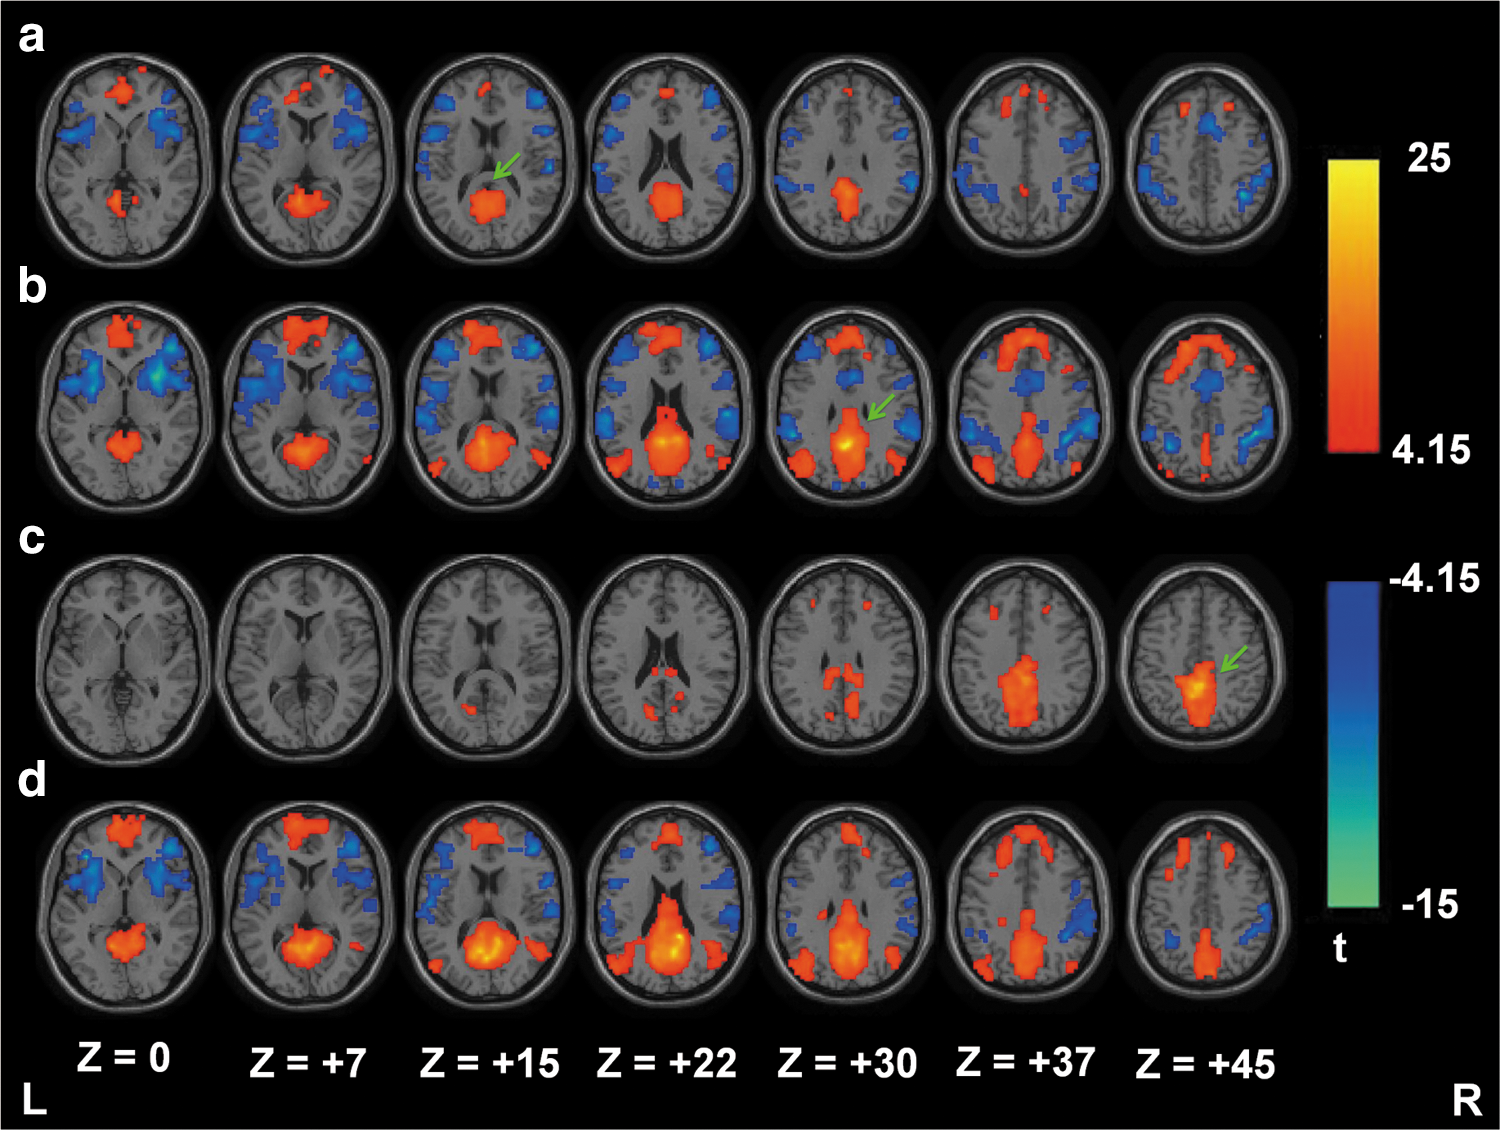
One-sample t test results of DMN/TPN connectivity (n=12) for the SCAC [seed1
Consistent with Figure 3, Table 1 lists the average z scores and cluster sizes in three ROIs (MPFC, L_IPC, and R_IPC) with SCAC and SCAReHo (KCC >0.5) methods. The quantitative results of SCAReHo are either significantly superior or comparable to those of SCAC in both connectivity strength (average z scores) and spatial extent (cluster sizes), indicating that the SCAReHo method provides stronger connectivity with greater spatial extents.
Quantitative Results, Including Average z Scores and Cluster Sizes in the DMN Regions, Obtained by Using the SCAC and SCAReHo (KCC >0.5) Methods
p<0.05; ** p<0.01; *** p<0.005; **** p<0.001, compared with SCAReHo results.
The DMN regions include MPFC, and left and right IPC.
DMN, default mode network; SCAC, seed-based correlation analysis; ReHo, regional homogeneity; KCC, Kendall coefficient of concordance; MPFC, medial prefrontal cortex; IPC, inferior parietal cortex.
Another comparison was performed based on SCAReHo seed regions with sizes similar to the three SCAC seeds. These SCAReHo seed regions were obtained by appropriately adjusting the KCC thresholds for each subject. The resulted KCC thresholds and SCAReHo seed sizes were 0.85±0.05 and 33.3±3.2 voxels, respectively, for the comparison with seed1; 0.88±0.04 and 9.3±4.0 voxels, respectively, for the comparison with seed2; 0.80±0.06 and 155.4±9.0 voxels, respectively, for the comparison with seed3. Table 2 lists the average z scores and cluster sizes in three ROIs (MPFC, L_IPC, and R_IPC) for these three corresponding seed regions. The comparisons with results from three SCAC seeds demonstrated the same trends as the comparisons based on our original SCAReHo seeds (KCC >0.5), as listed in Table 1, except for one comparison with seed2 became insignificant in cluster size in L_IPC. This analysis demonstrated that the seed size was a minor factor that contributed to the superior performance of the SCAReHo method.
Quantitative Results, Including Average z Scores and Cluster Sizes in the DMN Regions, Obtained by Using the Three SCAReHo Seed Regions with Sizes Similar to the Three SCAC Seeds
p<0.05; ** p<0.01; *** p<0.005; **** p<0.001, compared with SCAC results listed in Table 1. Results from seed region 1, 2, and 3 were compared with those from seed1, seed2, and seed3, respectively.
The DMN regions include MPFC, and left and right IPC.
Figure 4 shows the significant differences of the DMN and TPN connectivity between SCAC and SCAReHo (KCC >0.5) methods. Compared with the results of SCAC, the SCAReHo method found increased DMN connectivity in the superior frontal gyrus, middle frontal gyrus, medial frontal gyrus, middle temporal gyrus, precuneus, middle occipital gyrus, and lingual gyrus. In addition, reduced DMN connectivity was also observed using SCAReHo, especially in local regions around seed points. Consistent with Figure 4, Tables 3 and 4 show detailed quantifications, including the cortical area, BA, cluster size, MNI coordinates, and peak z-score, of activated voxels for DMN and TPN, respectively. These results demonstrate that the SCAReHo method increases long-distance connectivity and maintains or reduces local connectivity.
Paired t test results showing the significant differences of DMN (left) and TPN (right) connectivity (n=12) between SCAC [seed1
Brain Regions with Significant Differences Between SCAC and SCAReHo Methods in DMN Connectivity
BA, Brodmann area; MNI, Montreal Neurologic Institute; L, left hemisphere; R, right hemisphere.
Brain Regions with Significant Differences Between SCAC and SCAReHo Methods in Task-Positive Network Connectivity
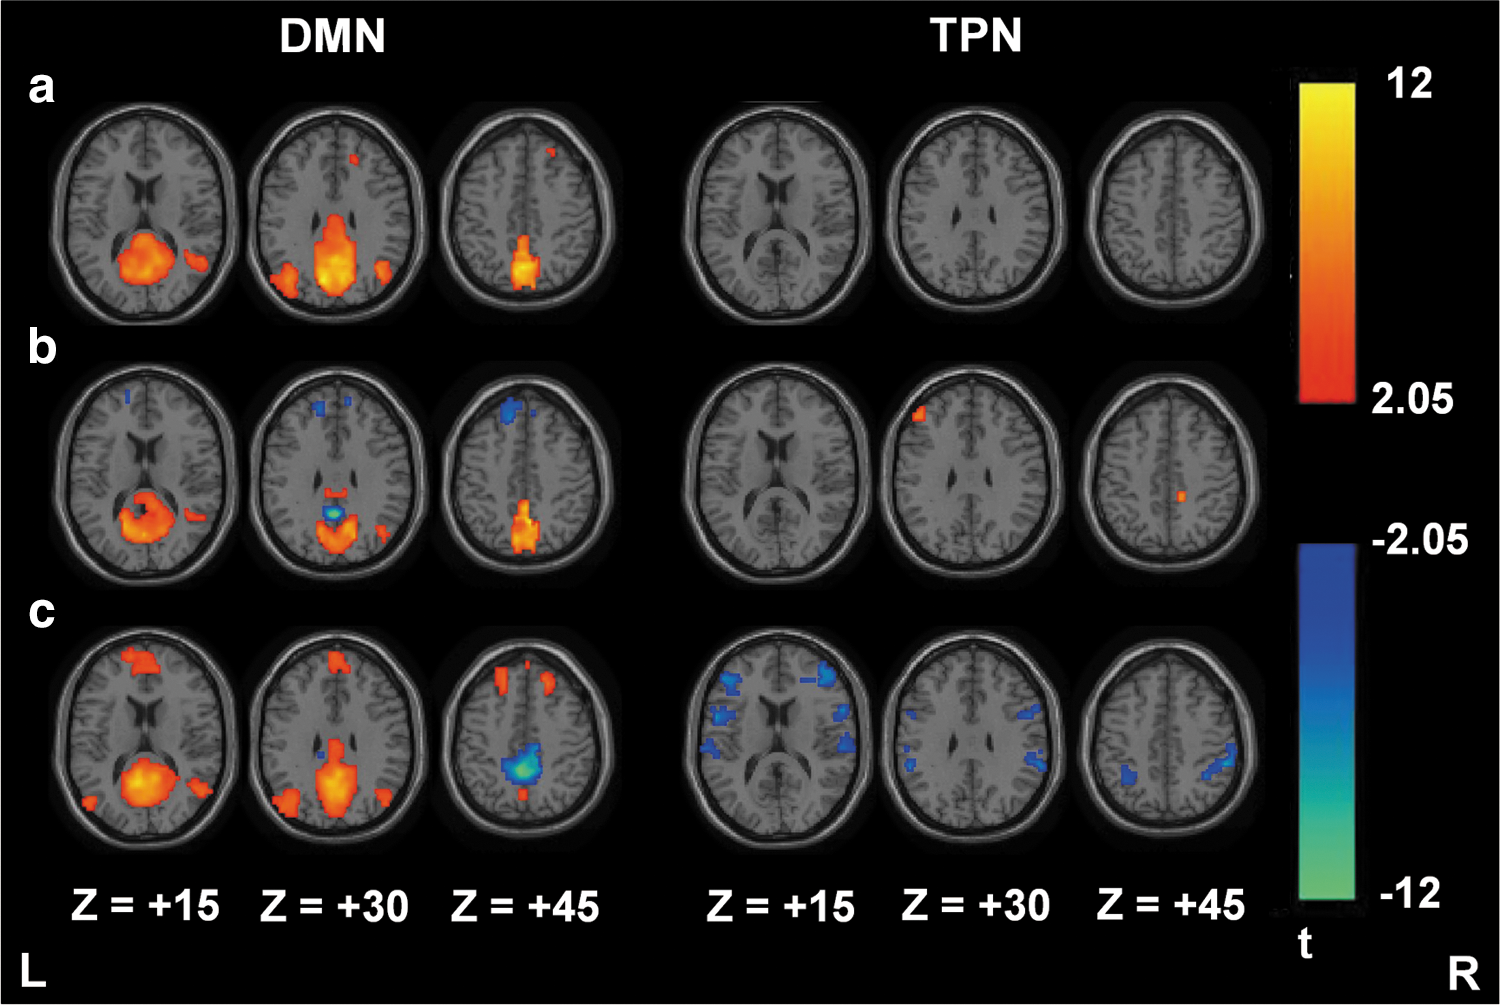
Additional RS-fMRI data obtained from the NYU dataset were used to evaluate the efficacy of seed3 for analyzing the DMN connectivity in different normal populations. One-sample t test results of DMN/TPN connectivity from the SCAC method (Fig. 5a) demonstrate an improved connectivity pattern from Figure 3c, although still not identical to the SCAReHo results (Fig. 5b). Paired t test results (Fig. 5c) show the differences of DMN and TPN connectivity between both SCA methods. Compared to the SCAC method, the SCAReHo method found increased connectivity in MPFC, right IPC, and PCC for the DMN, and left DLPFC, bilateral insula, bilateral IPL, SMA, and postcentral gyrus for the TPN. In contrast, the SCAReHo method reduced local connectivity to PCC (or precuneus).
One-sample t test results of DMN/TPN connectivity based on the New York University data (n=13) for the SCAC (seed 3)
Amygdala network
Selection of seed ROIs
To verify the applicability of the proposed method to the limbic system, we applied the SCAReHo method to detect the amygdala connectivity. Figure 6a shows the bilateral amygdala seed regions for the SCAC method, and Figure 6b shows the probability maps of bilateral amygdala seed regions for the SCAReHo (KCC >0.5) method. The locations of unilateral amygdala seeds are similar for both SCA methods. However, the high between-subject variability of anatomical structures in amygdala regions may lead to inaccurate seed selection when using a predefined seed region. The SCAReHo method, which is based on the individual amygdala structure, can reduce anatomical variability and retrieve amygdala connectivity more accurately compared to the SCAC method.
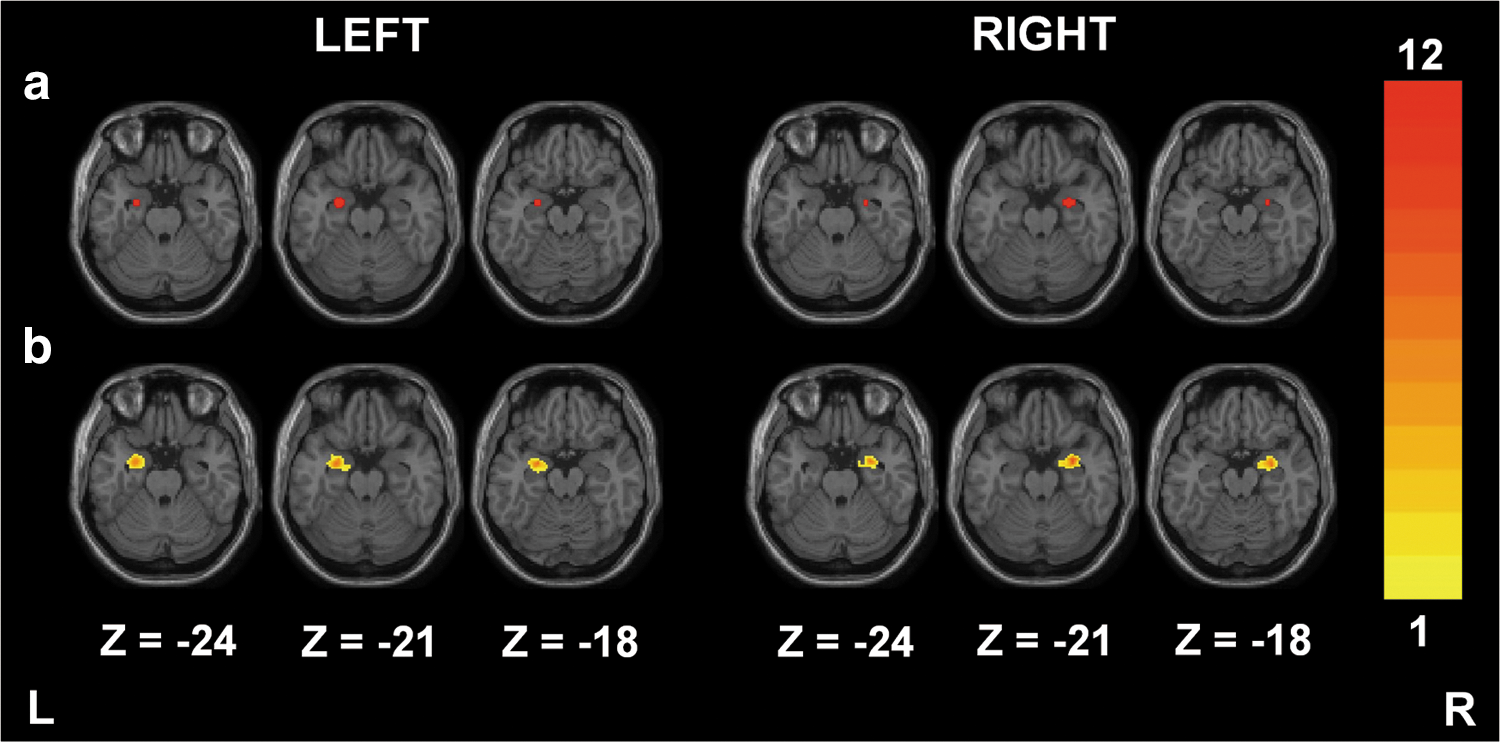
Probability maps (n=12) describing the bilateral amygdala seed regions for the SCAC
FC maps
Figure 7a and b show the one-sample t test results of amygdala connectivity for 12 healthy young participants using SCAC and SCAReHo (KCC >0.5), respectively. The results of both the SCA methods show that the amygdala seed has a stronger ipsilateral connectivity than the contralateral amygdala region. Unlike the SCAC method, the SCAReHo method results in more homogeneous connectivity in bilateral amygdala regions. Paired t test results (Fig. 7c) show the differences between SCAC and SCAReHo (KCC >0.5) methods in amygdala connectivity, further demonstrating that the SCAReHo method showed a higher sensitivity in the contralateral amygdala region compared to the SCAC method. Additionally, the SCAReHo method found a significantly increased connectivity in the left hippocampus, left claustrm, right lateral globus pallidus for the left amygdala seed, and left parahippocampal gyrus and bilateral putamen for the right amygdala seed.
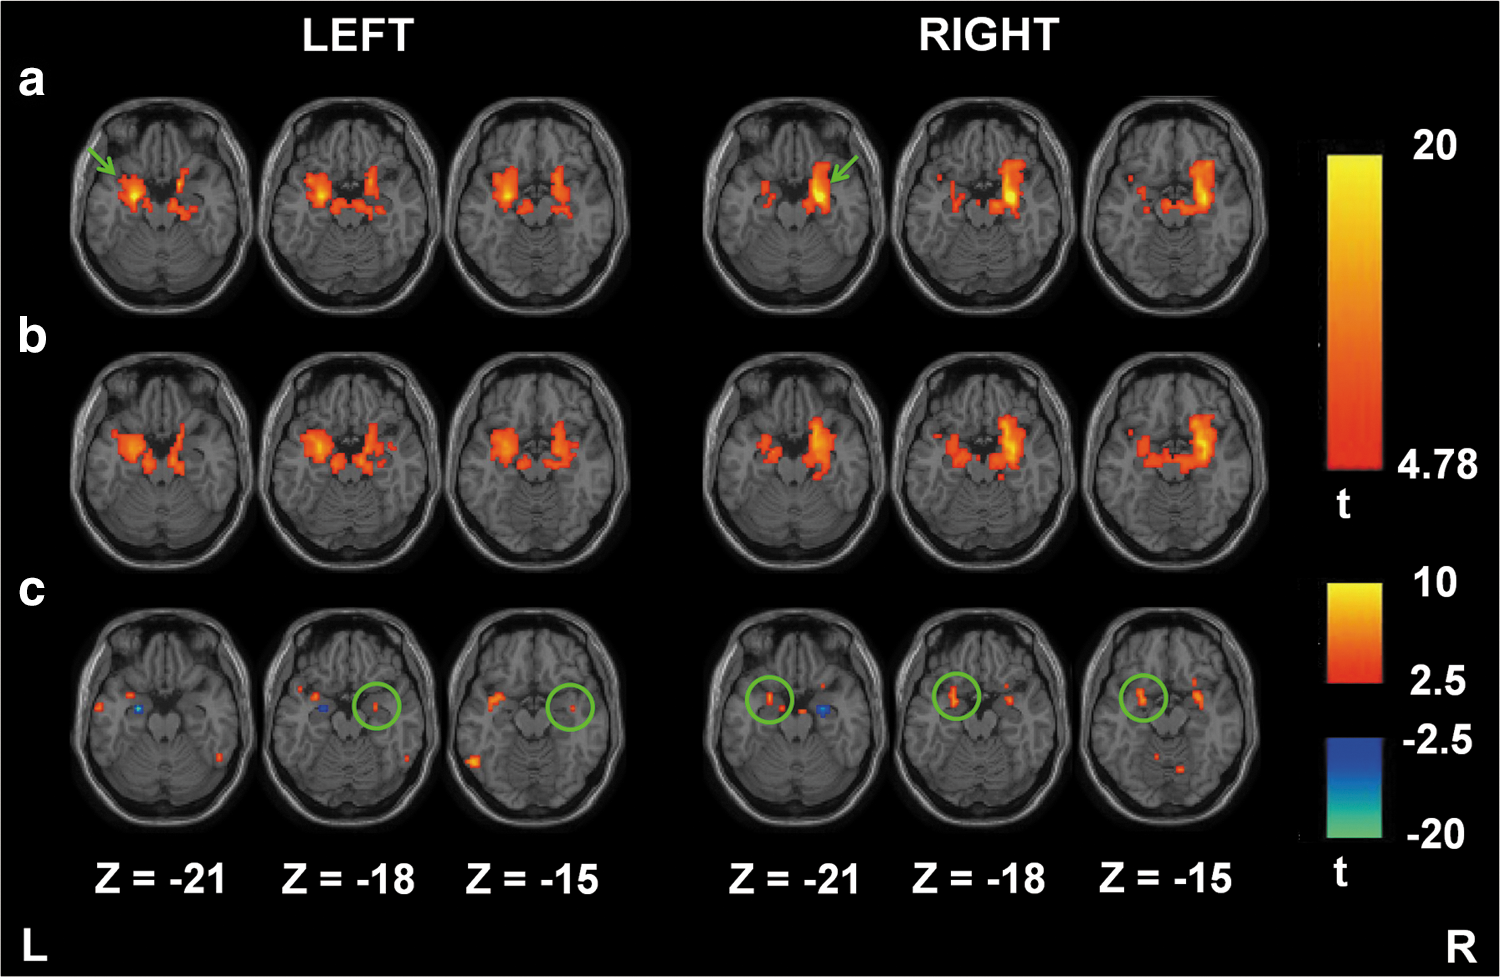
One-sample t test results of amygdala connectivity (n=12) for the SCAC
Effect of KCC or K selection on the PCC seed regions
Figure 8a shows the probability maps of three PCC seed regions corresponding to different KCC thresholds (KCC >0.5, 0.6, and 0.7, from top to bottom) for the SCAReHo method. With higher KCC values, PCC seed regions became smaller in each individual subject and exhibited greater intersubject variation in the probability maps. Figure 8b shows the one-sample t test results of DMN/TPN connectivity using SCAReHo with three different KCC thresholds (KCC >0.5, 0.6, and 0.7, from top to bottom). The connected regions across three groups largely resembled each other using the same statistical threshold (p<0.01, corrected with FDR; cluster threshold=10 voxel), agreeing with previous reports (Long et al., 2008; Uddin et al., 2009; Zhong et al., 2009). In addition, slightly weaker connectivity in TPN was found with lower KCC thresholds. One-way ANOVA was conducted to assess the performance of KCC characteristics on the FC maps with SCAReHo. Results showed no significant differences across the three groups (p>0.05, corrected with FDR). Agreed with the voxel-based results, the ROI-based analysis found no significant differences between three KCC thresholds, with F values of 0.18 (p=0.84), 0.001 (p=0.999), and 0.004 (p=0.996) for MPFC, L_IPC, and R_IPC, respectively, when comparing the averaged z scores, and 0.17 (p=0.85), 0.004 (p=0.996), and 0.06 (p=0.94) for MPFC, L_IPC, and R_IPC, respectively, when comparing the cluster sizes. Combined with the results in Figure 8a, this connectivity pattern is insensitive to different KCC thresholds even if three PCC seeds were significantly distinct in the spatial extent (cluster sizes=1053±67, 854±138, and 528±233 voxels, for KCC >0.5, 0.6, and 0.7, respectively; one-way ANOVA: F=32.5, p<1.58×10⁻⁸). Figure 8c shows the time courses within three particular PCC seeds from a single participant. These results show that the fluctuation magnitudes of the seed time courses were consistent across three KCC thresholds, despite lower signal intensity found from the seed with KCC >0.7.
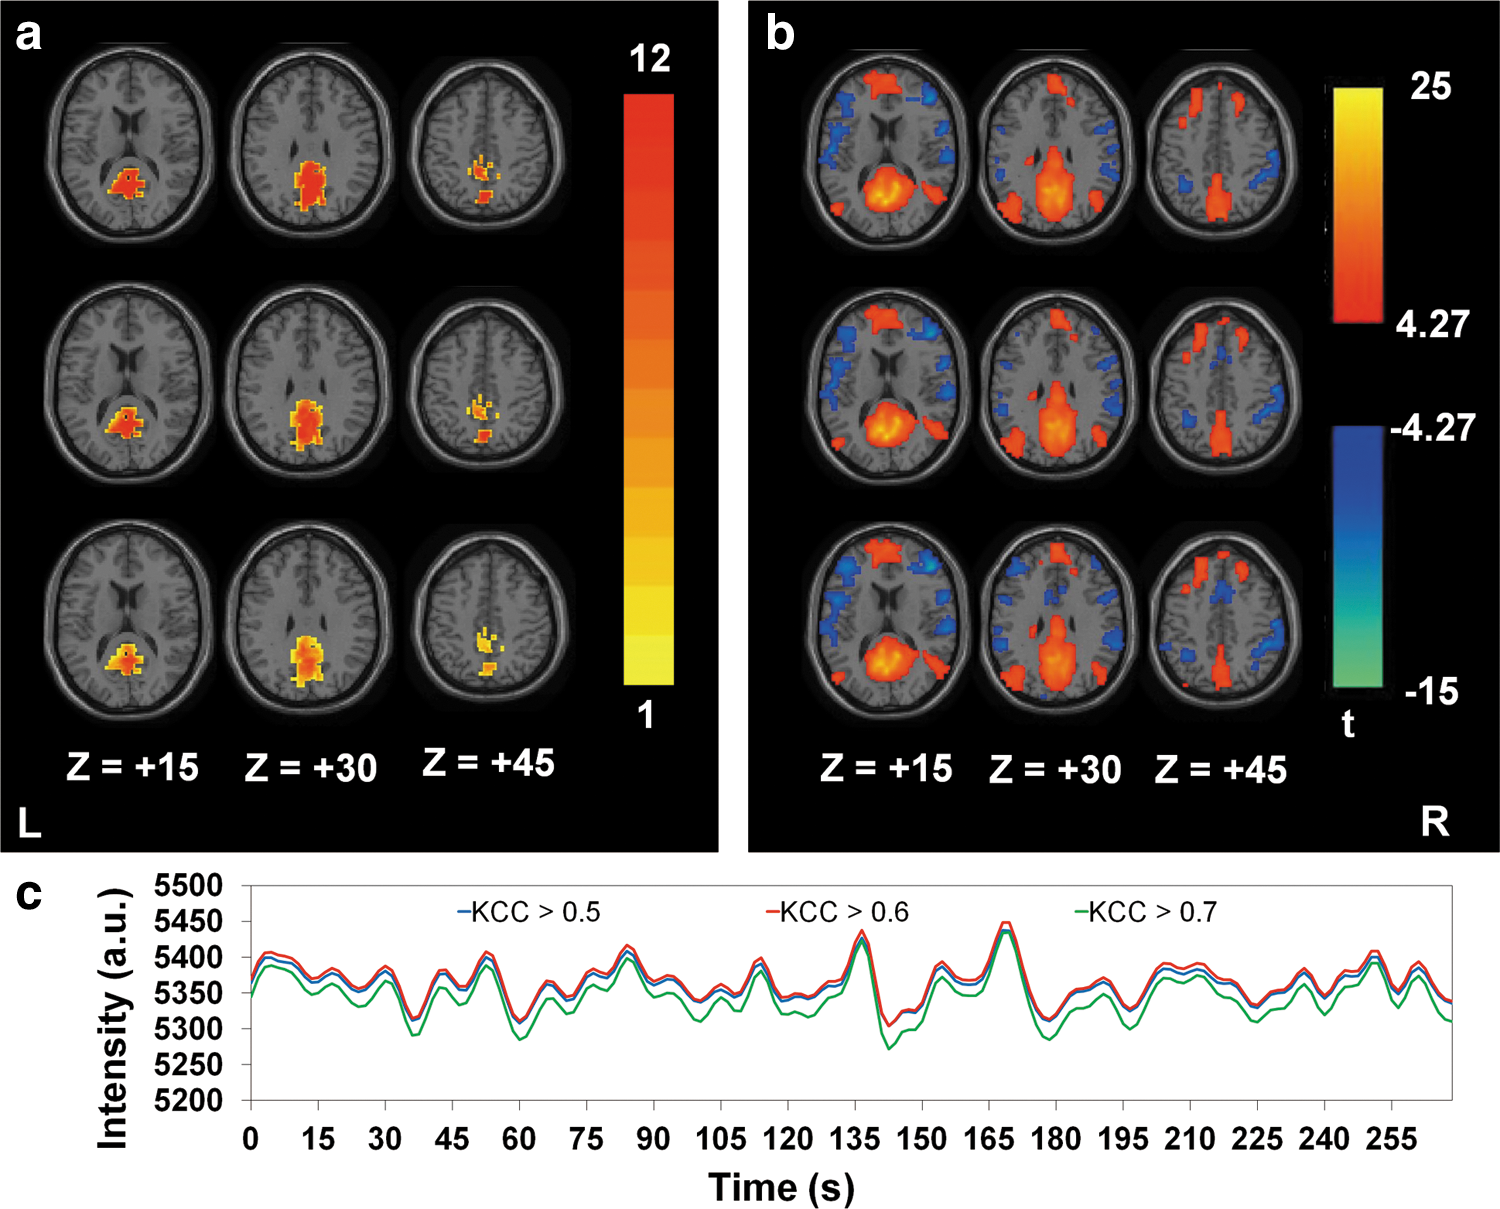
Probability maps (n=12) describing the PCC seed regions for the SCAReHo method with different KCC thresholds (from top to bottom: KCC >0.5, 0.6 and 0.7)
Mean and standard deviation of the average z score (Fig. 9a) and cluster size (Fig. 9b) in three DMN regions with different K (7, 19, and 27 voxels) chosen for the ReHo approach. The quantitative results in three ROIs are comparable among three K groups. Consistent FC maps were yielded with three K values (results not shown). The analyses demonstrated that both KCC and K selection were minor factors that contributed to DMN connectivity results for the SCAReHo method.
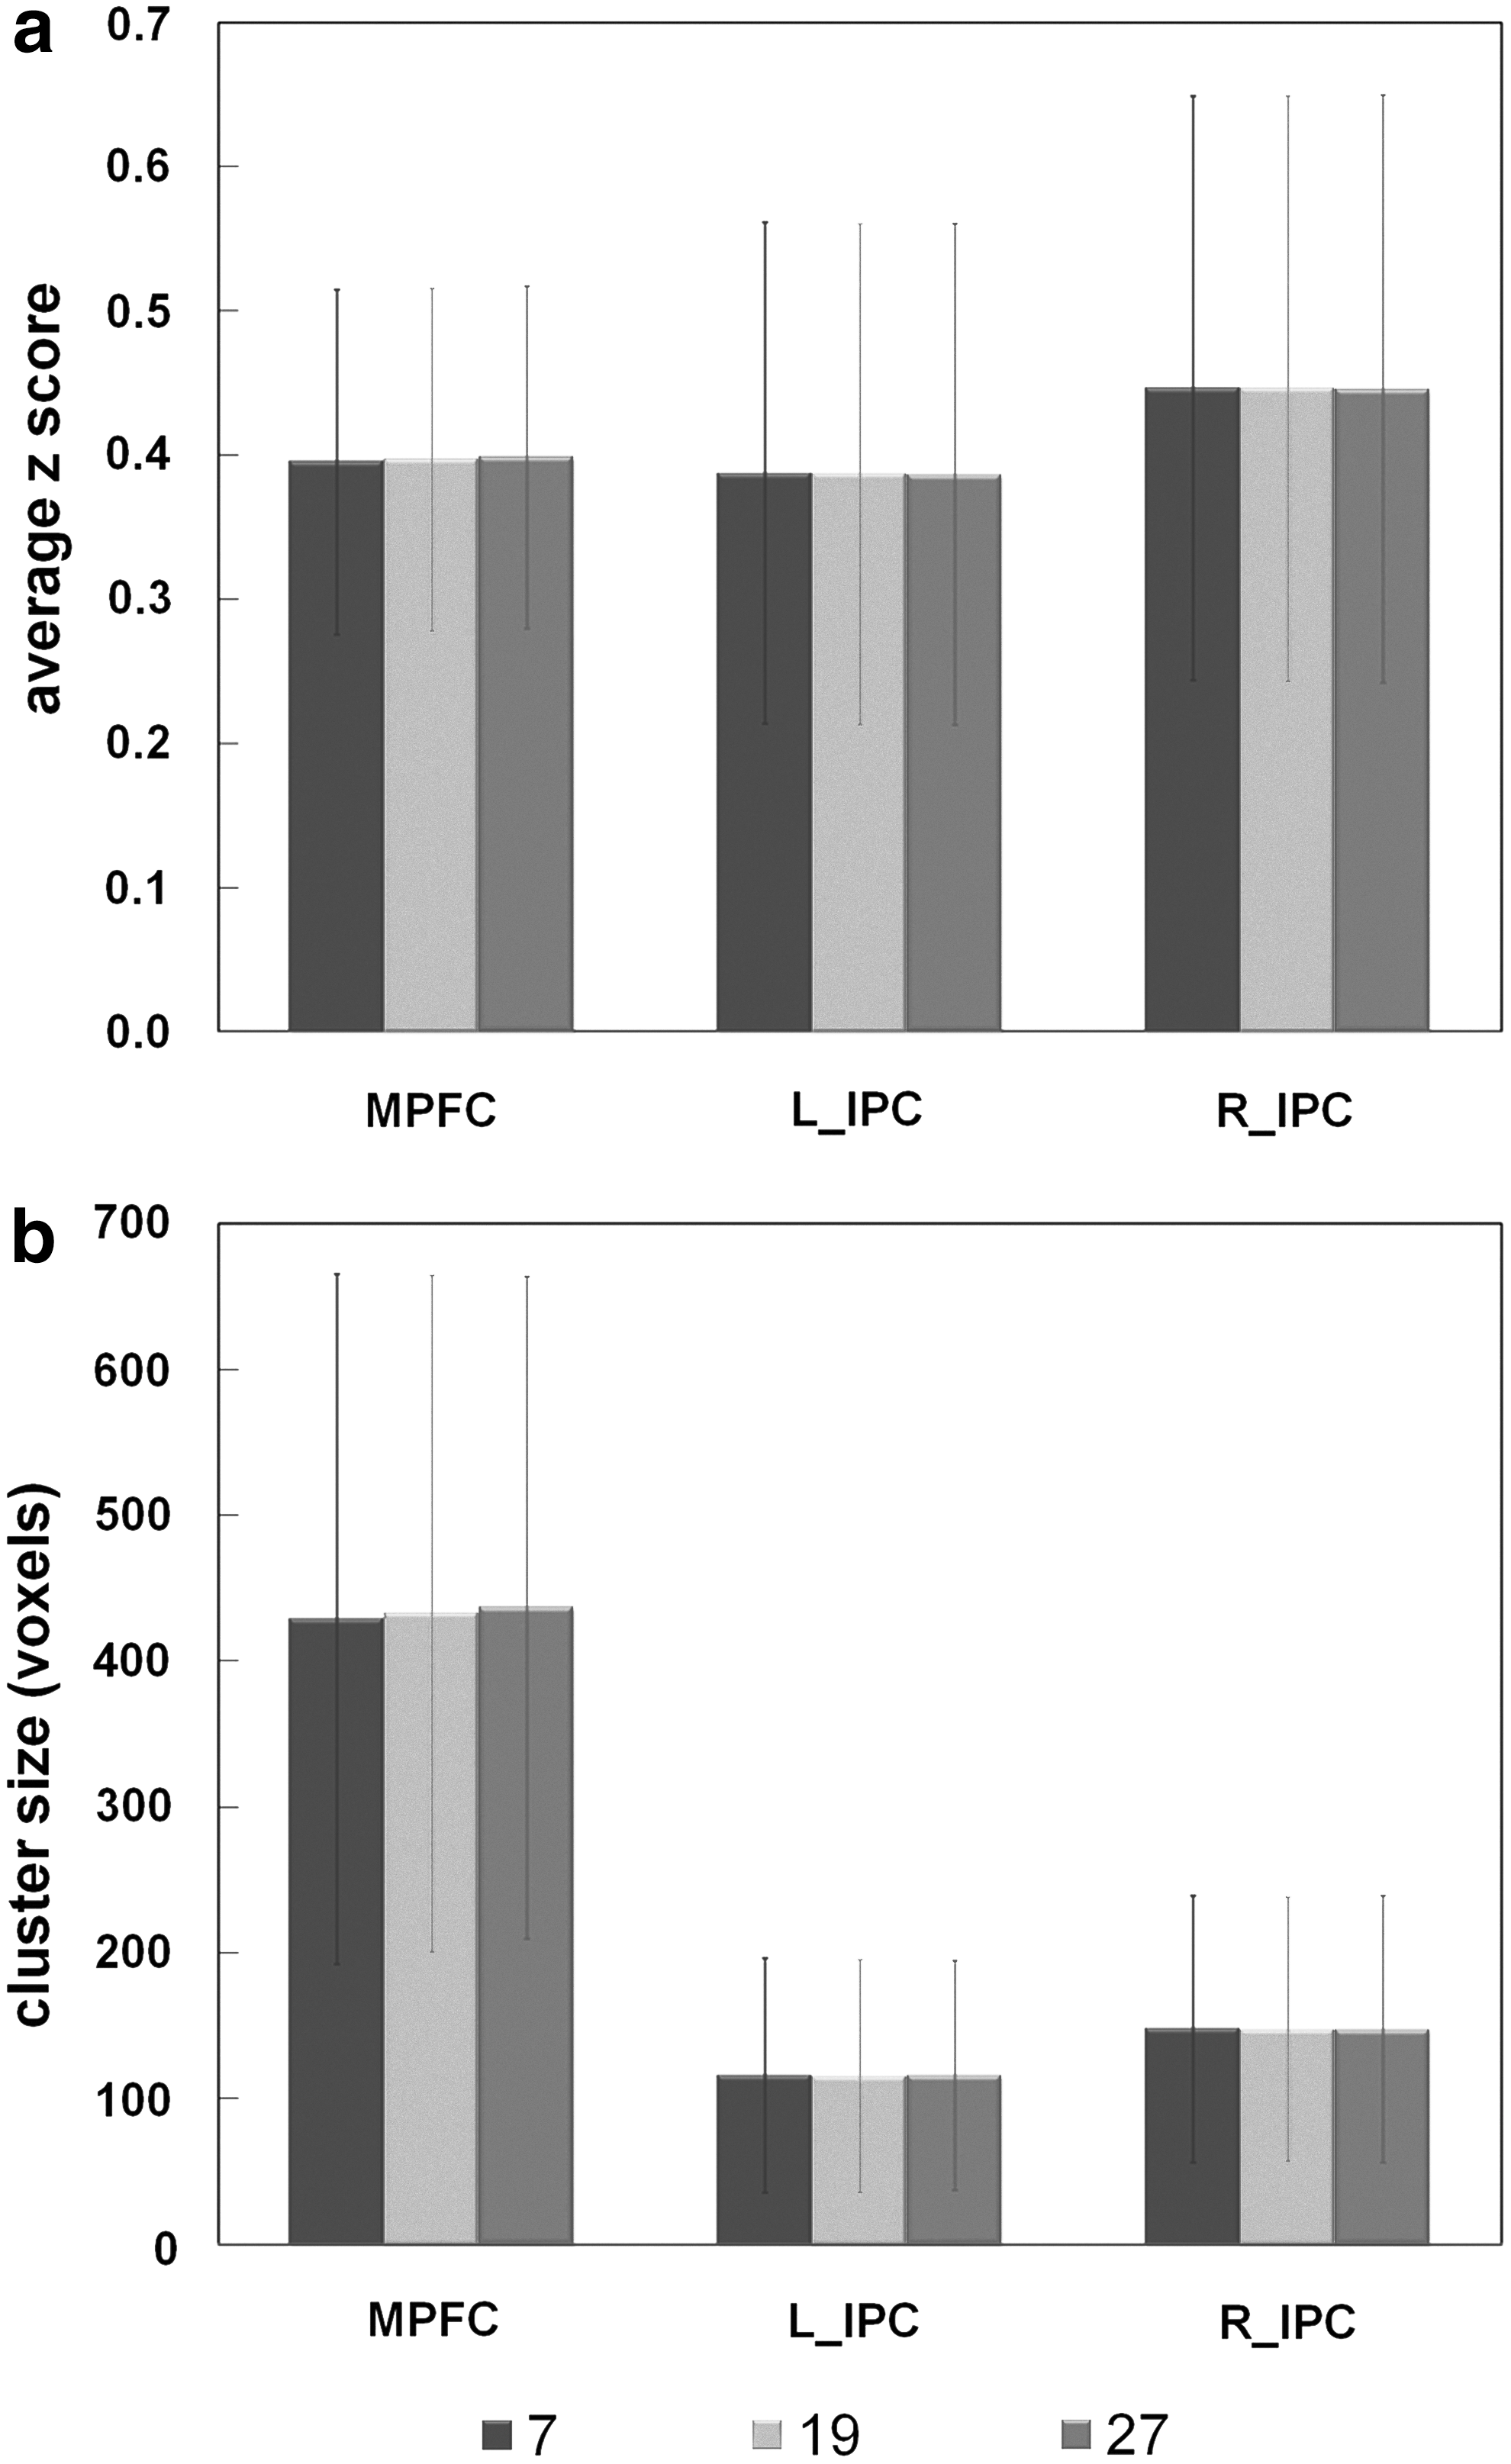
Mean and standard deviation of the average z score
Discussion
FC analysis using the SCAC method has traditionally been confounded by seed selection. This study proposes a novel seed-selection method (SCAReHo) that incorporates both the SCAC method and ReHo information (local synchronization) to reduce the uncertainty of seed selection (including sizes and locations) and improve the sensitivity of the SCAC method in three well-known functional networks: DMN, TPN, and amygdala network, which are based on RS-fMRI datasets.
Based on previous literature, the SCAC method chooses the seeds from a predefined seed region (Cole et al., 2010; Ma et al., 2007; van den Heuvel and Hulshoff Pol, 2010). However, several factors, such as intersubject variability in anatomy, variability in anatomy-function correspondence (Golestani and Goodyear, 2011; Van Essen and Dierker, 2007), or functional changes in neurodegenerative pathologies or psychiatric disorders (Golestani et al., 2011), may influence seed selection. Nevertheless, the SCAReHo method can generate appropriate individual seed according to the participants' ReHo information. Compared with the SCAC method, the SCAReHo method is relatively insensitive to the variability of seed locations. The SCAReHo method also preserves the benefits of SCAC and ReHo approaches, such as simple to obtaining information on functional connection of the particular seed (van den Heuvel and Hulshoff Pol, 2010) and reducing the false-positive rates of connectivity patterns caused by wrongly placing the seed location (He et al., 2004; Zang et al., 2004). Therefore, the proposed method is particularly useful for reducing the ambiguity of trimming the seed size and location.
In this study, the SCAC method showed that different PCC seeds notably affected the DMN connectivity, where the seeds were chosen from previous studies (Fig. 3a–c; Sadaghiani et al., 2009; Uddin et al., 2009; Woodward et al., 2011). Even with the same PCC seed (seed3), diverse connectivity results appeared among different normal controls under the same threshold (p<0.05, corrected with FDR; cluster threshold=10 voxels; Figs. 3c and 5a).
Consistent with previous literature (Long et al., 2008; Uddin et al., 2009; Zhong et al., 2009), the SCAReHo method presents connectivity maps in both the DMN (i.e., PCC, MPFC, and bilateral IPC) and the TPN (i.e., bilateral DLPFC, bilateral insula, bilateral IPL, SMA, and postcentral gyrus). Similar and consistent connectivity patterns derived from different KCC thresholds (Fig. 8b) and from different K values (results not shown) demonstrate the robustness of the SCAReHo method. The SCAReHo method also demonstrates more homogeneous connectivity in bilateral amygdala regions, and shows higher sensitivity in the contralateral amygdala region compared to the SCAC method. Although the neurophysiological meaning of bilateral amygdala connectivity remains to be investigated, examining the contralateral amygdala connectivity is an intuitive strategy to evaluate novel connectivity analysis for its high robustness (Mishra et al., 2013; Wu et al., 2008). Beyond solving the uncertainty of seed selection, the SCAReHo method improves the sensitivity of large-scale network connectivity (e.g., among DMN, TPN, and contralateral amygdala regions), and provides stronger distant connectivity. In addition, the SCAReHo method resulted in both increased and reduced local connectivity strengths in seed areas, as compared to the SCAC method (Figs. 4 and 5c). This can be attributed to the discrepancy of the seed centers, in particular, between seed3 and SCAReHo seed.
The dual-regression technique combining multisubject ICA with the GLM analysis is a recently developed method (Beckmann et al., 2009) that does not consider seed location in its connectivity analysis. Although the results of this method may be similar to SCAReHo, the two methods are conceptually different. The dual-regression technique decomposes multisubject fMRI data using ICA to identify large-scale connectivity patterns in the population (Filippini et al., 2009), and then uses the group-based connectivity map to identify the subject-specific time courses for further GLM or correlation analysis (Beckmann et al., 2009; Filippini et al., 2009). However, the SCAReHo method incorporates ReHo information in the seed definition (e.g., the PCC mask for the DMN or the participant's anatomy for the amygdala network), and then uses the reference time course retrieved from the subject-specific seed to obtain the individual connectivity map. The major differences between both methods are the definition of seed regions and the possibility of individual analysis. The SCAReHo method uses ReHo (with its physiological meaning) and individual anatomy to define seeds, whereas the dual-regression technique uses group-based component maps to obtain the ICA-based statistical method for seed selection. Hence, the SCAReHo method complies with the clinical individual diagnosis, but dual-regression technique must be built after the assumption of minimal between-subject variability in connectivity patterns. Furthermore, the processes of dimensionality reduction and model order selection (i.e., the number of independent components to choose) are controversial problems when conducting ICA (Cole et al., 2010; van den Heuvel and Hulshoff Pol, 2010). The stochastic nature of this technique, which arises from the iterative optimization method of ICA decomposition, can induce a degree of run-to-run variability and result in diverse ICA-based spatial maps between analysis runs on the same datasets (Cole et al., 2010). Another issue, called double-dipping, increases the chance of producing distorted statistical inferences. The chance of double-dipping can be increased by using the same dataset for selection (Kriegeskorte et al., 2009). Therefore, the advantage of the SCAReHo method over the dual-regression technique is its ease of implementation for individual connectivity maps without limitations of seed or component selections.
The potential limitation of the SCAReHo method, with a fixed KCC threshold of 0.5, is that the seed sizes are larger than those of the SCAC seeds. Based on previous literature (Cole et al., 2010; Zhong et al., 2009), various seed sizes may bias the connectivity maps. The FC results (Figs. 3 –5) show stronger connectivity for the SCAReHo method than those for the SCAC method, which may result from bigger SCAReHo seed sizes. In addition, the average z scores (connectivity strength) in three DMN regions were calculated by changing the SCAReHo seed sizes (from 900 to 1150 voxels). No significant correlations between seed sizes and average z scores appeared in MPFC (p=0.08) and left IPC (p=0.46) regions. However, a slightly negative correlation appeared in the right IPC (p<0.05) region. This phenomenon implies that seed sizes may affect the connectivity results, and these influences may be region specific. In this study, we also performed the comparison between SCAReHo and SCAC using matched seed sizes, and the results demonstrated that the seed size was a minor factor that contributed to the superior performance of the SCAReHo method. However, for diseased brain, there may be significant ReHo differences from healthy controls. In such cases, the benefit and the utility (e.g., KCC threshold and seed size) of the SCAReHo method may need further investigation.
Conclusion
To understand the functions and integrations of brain areas during rest, previous studies have focused on detecting intrinsic FC using RS-fMRI and SCAC. However, the seed sizes and locations are confounding factors that lead to variability in the resulting connectivity maps. To address this issue, this study proposed a novel approach (SCAReHo) that confines the seed regions within a temporally homogeneous region. By integrating SCAC and ReHo information for seed definition, the SCAReHo method avoided the ambiguity of seed selection. The results showed that the SCAReHo method provided higher tolerance to variability caused by seed selections and higher sensitivity for detecting functional connections in resting-state networks. This approach for seed definition may be particularly beneficial when a participant has a unique functional anatomy.
Footnotes
Acknowledgments
We would like to thank Dr. Michael D. Greicius for kindly providing the ICA-based DMN template. Ho-Ling Liu was supported by the National Science Council of Taiwan (NSC99-2628-B-182-028-MY2).
Author Disclosure Statement
No competing financial interests exist.