
Abstract
Functional networks, defined by synchronous spontaneous blood oxygenation level-dependent (BOLD) oscillations between spatially distinct brain regions, appear to be essential to brain function and have been implicated in disease states, cognitive capacity, and sensing and motor processes. While the topographical extent and behavioral function of these networks has been extensively investigated, the neural functions that create and maintain these synchronizations remain mysterious. In this work callosotomized rodents are examined, providing a unique platform for evaluating the influence of structural connectivity via the corpus callosum on bilateral resting state functional connectivity. Two experimental groups were assessed, a full callosotomy group, in which the corpus callosum was completely sectioned, and a sham callosotomy group, in which the gray matter was sectioned but the corpus callosum remained intact. Results indicated a significant reduction in interhemispheric connectivity in the full callosotomy group as compared with the sham group in primary somatosensory cortex and caudate-putamen regions. Similarly, electrophysiology revealed significantly reduced bilateral correlation in band limited power. Bilateral gamma Band-limited power connectivity was most strongly affected by the full callosotomy procedure. This work represents a robust finding indicating the corpus callosum's influence on maintaining integrity in bilateral functional networks; further, functional magnetic resonance imaging (fMRI) and electrophysiological connectivity share a similar decrease in connectivity as a result of the callosotomy, suggesting that fMRI-measured functional connectivity reflects underlying changes in large-scale coordinated electrical activity. Finally, spatiotemporal dynamic patterns were evaluated in both groups; the full callosotomy rodents displayed a striking loss of bilaterally synchronous propagating waves of cortical activity.
Introduction
Functional brain networks are defined by synchronous spontaneous oscillations in spatially distinct brain regions. They are thought to facilitate efficient processing between cooperating brain areas (Fox et al., 2005), particularly on complex tasks requiring bilateralization (van der Knaap and van der Ham, 2011). The importance of these brain networks cannot be understated; functional variations in the coordination of these networks have been associated with disease states (Garrity et al., 2007; Grady et al., 2001; Greicius et al., 2007; Liu et al., 2007; Lowe et al., 2002; Villalobos et al., 2005); defining gradations of cognitive ability in healthy individuals (Boly et al., 2007; Eichele et al., 2008; Hesselmann et al., 2008; Kelly et al., 2008; Sadaghiani et al., 2009; Seeley et al., 2007; Thompson et al., 2012; van den Heuvel et al., 2009; Weissman et al., 2006); and performing common daily tasks including speaking (Tomasi and Volkow, 2012), visually perceiving the environment (Fairhall et al., 2009), and recalling memories and planning (Alnajjar et al., 2013). Scientists have begun to understand functional networks as they relate to brain function and resulting cognitive and behavioral outputs, but the underlying physiology modulating these networks remains largely a mystery.
Coordinated spontaneous oscillations in functional networks have been well characterized and confirmed across modalities and models including electroencephalography (EEG) (Babiloni et al., 2005; Leopold et al., 2003), functional magnetic resonance imaging (fMRI) (Biswal et al., 1995; Chang and Glover, 2010; Fox et al., 2009; Magnuson et al., 2010; Vincent et al., 2007; Williams et al., 2010), magnetoencephalography (Brookes et al., 2011; de Pasquale et al., 2010; Liu et al., 2010), voltage sensitive dyes (Carlson and Coulter, 2008; Mohajerani et al., 2010), and multimodal approaches (Nir et al., 2007; Pan et al., 2011; Shmuel and Leopold, 2008; Srinivasan et al., 2007; Xu et al., 2010). Functional networks in monkeys and humans examined with fMRI are primarily localized to the ultra-low (<0.3 Hz) frequency range (Biswal et al., 1995; Cordes et al., 2000; Fox et al., 2009; Hampson et al., 2002; Majeed et al., 2009), while neural and MEG functional network correlates are found throughout the 0–100 Hz range (He et al., 2008). The relationship between coordinated blood oxygen level-dependent (BOLD) activity and the correlated electrical activity seems largely dependent on the network being examined (Mantini et al., 2007). Pan and associates simultaneous fMRI-electrophysiological work has recently shown a direct correlation between low frequency BOLD oscillations and DC neural activity in the same frequencies (0.01–0.25 Hz) (Pan et al., 2013).
While researchers have identified many brain networks that relate to known anatomical networks involved in sensory, motor, or cognitive functions, the relationship between structural connectivity and functional connectivity is still under investigation. Work has been done comparing structural connectivity measured using diffusion tractography to functional connectivity revealing a correlative relationship between the two measures (Honey et al., 2009); however, it has been observed that direct structural connectivity is not necessary for the existence of functional connectivity (Damoiseaux and Greicius, 2009). The corpus callosum is the primary anatomical pathway facilitating interhemispheric communication in the cortex, and it is a clear target for anatomical intervention studies to elucidate the relationship between structural and functional connectivity.
Bilateral functional connectivity has been assessed in the split brain human model using fMRI in epileptic patients. Johnston and colleagues collected resting state fMRI before and after a complete sectioning of the corpus callosum, revealing a prominent reduction in interhemispheric functional connectivity while intrahemispheric connectivity remained relatively intact during the immediate postoperative period (Johnston et al., 2008). A similar study by Pizoli and associates evaluating connectivity before and after a two-thirds corpus callosotomy that antithetically resulted in improved BOLD and EEG bilateral functional connectivity (from highly uncoordinated and sporadic to coordinated and near normal) evaluated 1 day postsurgery and 4 months postsurgery (Pizoli et al., 2011). Montplasier et al. evaluated EEG bilateral functional connectivity during stage II and REM sleep before and after partial callosotomies in two patients (Montplaisir et al., 1990). Their work indicated significant reductions in bilateral coherence across frequency bands that accurately reflected the degree of anatomical sectioning. A similar result was found in another EEG study evaluating three epileptic patients pre- and postsurgery revealing profound decreases in bilateral connectivity following the sectioning (Brazdil et al., 1997). Conversely, Corsi-Cabrera and colleagues presented EEG analysis of a single patient with a partial callosotomy before and after surgery and distinguished only minor, nonsignificant changes in bilateral connectivity (Corsi-Cabrera et al., 1995). Later work by the same group indicated a decrease in bilateral EEG coherence following callosal sectioning; however, connectivity was still present and fluctuated depending on wakefulness (Corsi-Cabrera et al., 2006). These results from human split-brain studies in epileptic patients are equally interesting and incongruent. It is likely that the incongruent findings are analogous to incongruences in the patient population, highlighting the need for controlled studies in an animal model where experimental variability is reduced and the number of subjects is increased.
In the present study we expand on the current body of work by evaluating interhemispheric functional connectivity in the somato-motor network of anesthetized rats following acute callosotomy. Functional connectivity was analyzed using consecutive fMRI and electrophysiological recordings. Results indicate that both fMRI and electrical interhemispheric connectivity are significantly reduced in the full callosotomy group as compared with the sham callosotomy group. We evaluate decrease in shared variance between the sham and full callosotomy groups and compare the fMRI results to the analogous electrophysiological results. Seed-based primary somatosensory (SI) connectivity in fMRI and broadband electrophysiology connectivity from the same location both result in a 51.7% decrease in shared variance in the full callosotomy data as compared with the sham callosotomy data. This equivalent decrease indirectly suggests bilateral fMRI and electrical connectivity are similarly mediated by perturbations in the underlying structural integrity. Finally, qualitative evaluation of spatiotemporal dynamic patterns in the fMRI data reveals a reduction in bilaterally symmetric propagating cortical waves of activity in the full callosotomy group as compared with the sham callosotomy group. The change of such waves from bilateral to unilateral suggests that intrahemispheric network properties may not be as disrupted as interhemispheric properties.
Methods
All values in methods and results are listed as mean±one standard error.
Animal preparation and physiological monitoring during callosotomy surgery
All experiments were performed following the guidelines set by the Institutional Animal Care and Use Committee (IACUC) at Emory University. Eleven male Sprague-Dawley rats (200–300 g) were initially anesthetized in an anesthetic chamber filled with a mixture of isoflurane and oxygen. Rats were divided into two groups; six rats were in the “full” callosotomy group and five rats were in the “sham” callosotomy group (the difference between groups is described below). Once the rat was anesthetized, it was moved to a stereotaxic head holder (Harvard Apparatus) and secured with a bite bar and ear bars. The rat was supplied with 2–2.5% isoflurane (the level was set as needed to maintain adequately fast breath rate with no response to toe pinch, with a greater level typically used for heavier rats) mixed with oxygen, while undergoing initial experimental setup and the following surgery. Body temperature was monitored and maintained at ∼36°C using a heating pad for the duration of the surgery to keep vasodilation to a minimum. The right femoral artery was catheterized to allow for monitoring of blood pressure.
Fur was removed from the top of the rodent's head using an electric shaver followed by the use of a liquid hair removal product to remove the remaining hair. Optical ointment was applied to each eye to prevent corneal drying throughout the duration of the experiment. An incision was made along rostral-caudal midline (bregma 5 mm rostral through 10 mm caudal) through the skin and muscle to expose the skull. Skin and muscle was carefully retracted to reveal skull areas containing the bregma and bilateral primary somatosensory areas, 4 mm lateral in each direction and 1 mm rostral from bregma. A low temperature cauterizer was used to stop any bleeding from the skull.
Cranial window
The next step was to create a cranial window for performing the callosotomy. Using a fine-tipped drill (Omni-Drill35; World Precision Instruments) a rectangular section of the skull was shaved until the dura was reached. Drilling was performed while viewing the skull through a 5× microscope. The cranial window extended in the rostral-caudal direction from 2 mm rostral to 5 mm caudal from the bregma, and laterally the window extended from 0 mm toward the right side of the skull to 2 mm from bregma. Once the dura was visible it was carefully pierced and sliced along the entire rostral-caudal cranial window using a 27 gauge needle; care was taken to avoid slicing vessels.
Callosotomy
A knife was fashioned using 316 stainless steel wire with an outer diameter of 0.33 mm. A 40 mm of wire was used for creation of the knife with 3 mm at one end bent using forceps to a 90° angle. A 5× microscope was used to view the 3 mm edge of the knife. Using a fine-grained triangular hand file steel was removed at a 45° angle on opposite sides of the knife to form a sharpened “V” on the leading edge of the knife. Similarly, material was filed away from the back edge of the knife to form a second V, leaving a diamond-shaped section of wire 3 mm in length perpendicular to a 37 mm section of undisturbed wire.
Once the wire was sharpened, the 37 mm edge of the knife was lightly covered in Duro Super Glue (Henkel Corporation) and inserted into a section of a 23 gauge needle, with the sharp needle portion removed. About 9 mm of the wire, adjacent to the 90° bend, was left protruding from the needle while the other 26 mm was encapsulated by the needle. The purpose of this was to reinforce the long section of the knife that would be attached to a micromanipulator resulting in a minimization of deflection during the cutting process described below. A photograph of the knife is shown in Figure 1a.
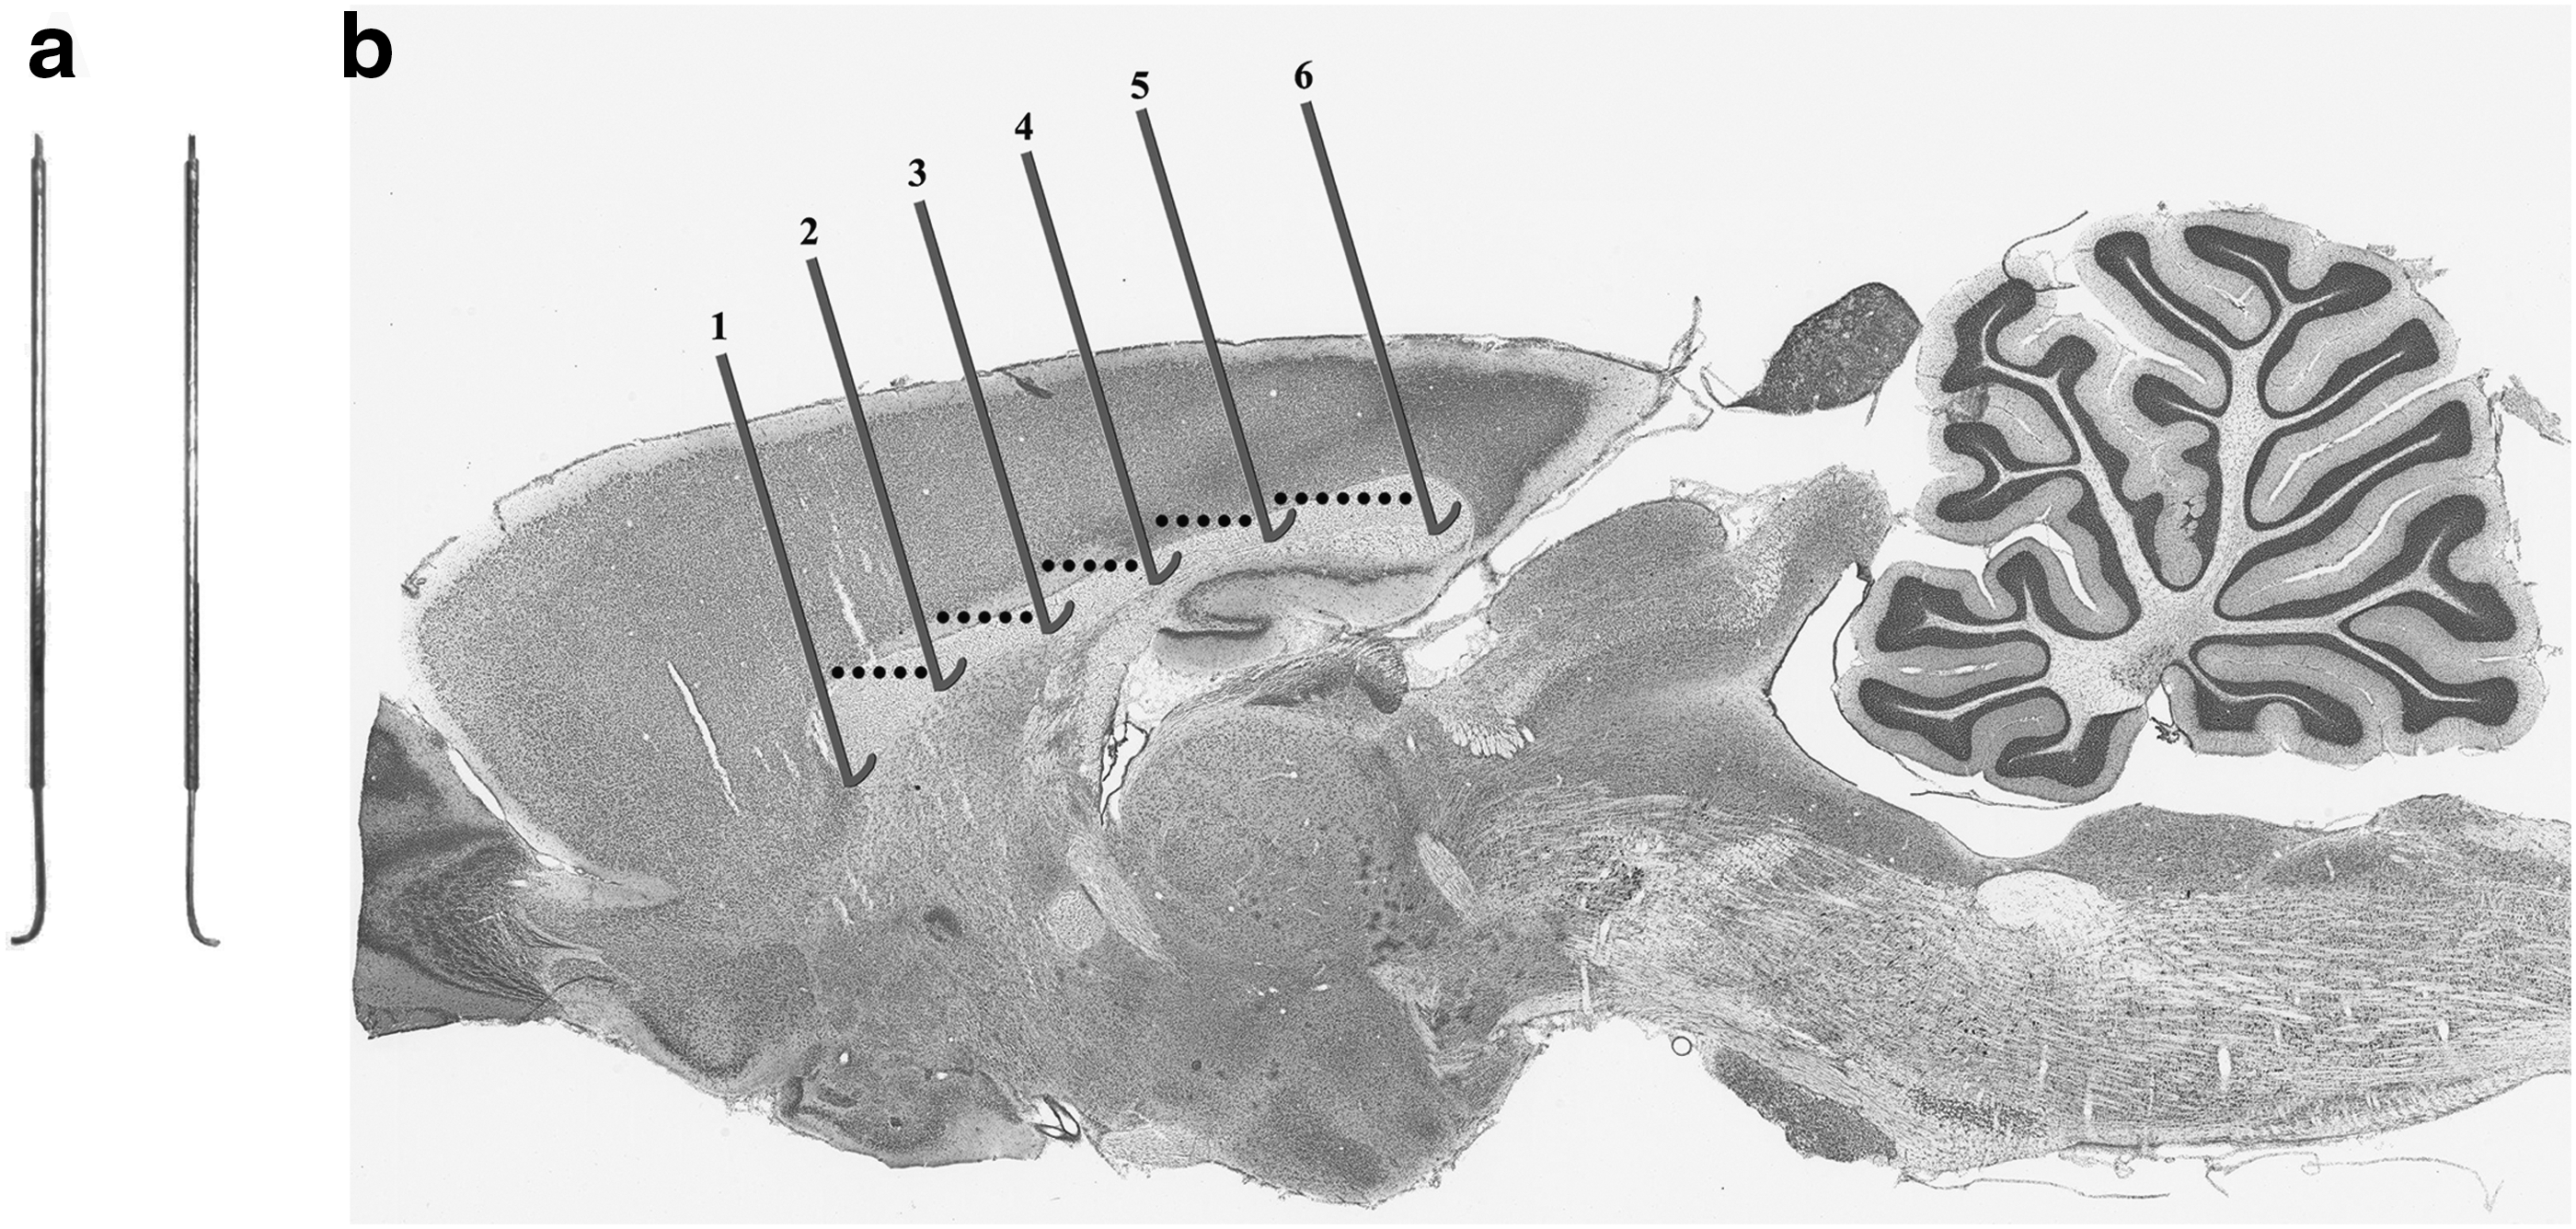
The wire knife was attached to the long arm of a micromanipulator integrated with the head holder system (Harvard Aparatus). The knife was positioned such that the end of the short side of the knife was facing the rostral-caudal plane with the free tip pointing caudally. The manipulator was tilted to an angle of 10° such that the tip of the free end of the knife was pointing slightly upward. The 10° angle was implemented such that the cutting edge of the knife was parallel to the direction of the corpus callosum. The knife was positioned rostral-caudally to 2 mm rostral from bregma and 1 mm laterally to the right of bregma (for one full callosotomy rat only, this was to the left of bregma) and lowered to the brain surface. The micromanipulator was moved in one of two manners to create either a full callosotomy or a sham callosotomy, making up the two experimental groups. A visualization of the severing procedure is depicted in Figure 1b.
Full callosotomy
The micromanipulator arm was adjusted so that the knife was positioned at the brain's surface 2 mm rostral and 1 mm lateral and right of the bregma. To begin severing the corpus callosum along the rostral-caudal plane the knife was moved in the following manner: (1a) 4.82 mm ventral (1b) 1 mm dorsal (1c) 1 mm caudal (2a) 0.5 mm dorsal (2b) 1 mm caudal (3a) 0.5 mm dorsal (3b) 1 mm caudal (4a) 0.5 mm dorsal (4b) 1 mm caudal (5a) 0.5 mm dorsal (5b) 2.41 mm caudal (6a) 0.35 mm ventral (6b) removed dorsally. Figure 1b shows an illustration of the knife's path through the corpus callosum.
Sham callosotomy
Beginning at 2 mm rostral and 1 mm lateral and right of the bregma, to create a sham callosotomy, the micromanipulator was adjusted nearly identical to the full callosotomy procedure. The only difference was at step 1a (described in the previous paragraph), the manipulator was adjusted ventrally 3.1 mm as opposed to 4.82 mm to avoid reaching the depth of the corpus callosum. About 0.5 mm of “buffer space” was built in to the sham paradigm to account for slight variability in brain size to ensure the corpus callosum was not affected. All other manipulations are identical to the full callosotomy paradigm and occur in the same order.
Following the callosotomy or sham callosotomy, light pressure was applied using gauze until all bleeding ceased. Mineral oil was used to fill the cranial window, providing a barrier against excessive drying of surface brain tissue. The rat was then removed from the head holder and placed into an anesthetic chamber lightly filled with isoflurane to allow transfer to the imaging suite.
fMRI setup
The rat was transferred from the anesthetic chamber to a plastic MRI cradle (Bruker), where his head was fixed in place using a bite bar and ear bars. Isoflurane was continued at 2% throughout the duration of the fMRI setup with slight modulations based on physiological sate. Heart rate and oxygen saturation were monitored and recorded using a pulse oximeter placed on the left rear forepaw. Body temperature was monitored and recorded using a rectal thermometer; temperature was maintained at ∼37°C using an adjustable temperature warm water circulation system. Respiratory rate was monitored using a pressure-sensitive balloon placed directly under the rat's chest. Colgate toothpaste was applied onto the skull surface to mimic the MRI contrast of the removed muscle. Major distortions are present in the EPI images from susceptibility artifacts induced due to the brain/air interface; the toothpaste alleviates these artifacts (Lewin et al., 1995; Pan et al., 2010). Following application of the toothpaste, eye ointment was reapplied and the 2 cm Bruker surface receive coil (see “Image Acquisition” below) was taped to the cradle directly above the rat's head.
Once setup was complete a subcutaneous bolus of 0.025 mg/kg of dexmedetomidine (Dexdomitor, Pfizer) was delivered to the rat's upper right leg; isoflurane was discontinued 5 min after the dexmedetomidine bolus. Dexmedetomidine is used as an alternative to isoflurane because it causes less burst suppression and a sedated effect (Nelson et al., 2003) as opposed to a highly anesthetized state (Nakao et al., 2001) and results in a more localized manifestation of functional connectivity (Williams et al., 2010). Fifteen minutes postbolus a subcutaneous infusion of 0.05 mg/kg/h dexmedetomidine was initiated; the drug was delivered through a 27 gauge butterfly needle inserted subcutaneous and attached to the rat's upper right leg. At ∼90 min following the initial bolus, dexmedetomidine was increased to 3× the original infusion dose for maintenance of anesthetic depth (Pawela et al., 2009; Weber et al., 2006).
Image acquisition
All MRI images were acquired using a 20 cm horizontal bore 9.4 T Bruker BioSpec magnet equipped with an actively shielded gradient coil with 20 G/cm gradient strength and rise time of 120 μs. The Bruker BioSpec was controlled using an AVANCE console. An actively decoupled cross-coil imaging setup was used, which included a 7 cm volume coil for RF transmission and a Bruker built 2 cm surface coil (taped to the cradle holding the rat) for signal reception (Bruker).
Initially automatic adjustment of shimming, basic frequency, transmit power, and receiver gain was performed; following these adjustments a FLASH image was acquired in three planes. Based on the FLASH image, a single 2 mm slice was positioned over the primary somatosensory cortex (SI) based on imaging markers. A high resolution RARE image (TR=5s, TE=17.5 msec, Averages=4, Resolution=100 μm in-plane) was acquired in over 20 0.5 mm slices positioned coronally, perpendicular to the length of the callosotomy. This was done to obtain an image displaying the efficacy of the surgery and possible influences to surrounding anatomy.
Following the RARE acquisition, shimming was performed on the single slice of interest to obtain maximum SNR and spatial homogeneity. Approximately 1 h (Full: 1.1±0.06 h Sham: 1.2±0.12 h) following the dexmedetomidine bolus and cessation of isoflurane use, the first resting state functional image was acquired with the following parameters: single-shot gradient echo EPI, repetitions=1000, TR=500 msec, TE=15 msec, total scan time=8 min 20 sec, number of slices=1, slice thickness=2 mm, FOV=2.56×2.56 cm, and matrix size=64×64. A resting state scan with the listed parameters was collected every 15 min for 2 h; eight total resting state images were obtained per animal. Following the final resting state scan, isoflurane was turned back on at ∼2% mixed 1:1 with oxygen and room air. The rat was removed from the scanner and the MRI cradle, returned to the mobile anesthetic chamber, and transported to the procedure room for further surgery and electrophysiological recording.
Craniotomy holes and electrophysiology
The rat was once again placed in the stereotaxic head holder. Toothpaste was removed from the skull using a cue tip and the area was thoroughly flushed with saline. Two craniotomy holes were opened, one on the left side and one on the right side of the skull 4 mm lateral and 1 mm rostral to the bregma. The holes were opened using a fine tipped drill (Omni-Drill35; World Precision Instruments) while viewing through a 5× microscope. Skull bone was shaved down slowly and carefully until the dura was revealed. Each hole measured ∼1.5 mm in diameter. Surface brain vessels were visually identified, and the tip of a 27 gauge needle was used to pierce the dura away from the vessels to allow for insertion of the microelectrodes. Prior to the experiment, microelectrodes were fabricated from borosilicate using a micropipette puller (PE-2, NARISHIGE), to form a tip ∼10 μM in diameter, allowing for local field potential recordings.
The electrodes were filled with artificial cerebrospinal fluid resulting in an impedance of 1–5 MΩ measured at 1 KHz. Two separate stereotaxic arms were used to hold the electrode over the holes; the electrodes were angled 30 degrees laterally outward and lowered to a depth of ∼1 mm directly into the primary somatosensory cortex. The recorded electrode signal was checked for noise and signal inflection direction. Robust bursting in the negative direction was taken as success that the electrode tip had been placed in middle cortical layers (Pan et al., 2013). The signal ground was inserted under the skin of the caudal portion of the surgically opened area (several ground locations were tested, and this area provided the most consistent reduction in background noise) (Pan et al., 2013).
Following electrode insertion, a bolus of 0.025 mg/kg of dexmedetomidine was once again delivered to the rat's upper right leg. Five minutes post bolus, isoflurane was discontinued. Fifteen minutes after the bolus, an infusion of 0.05 mg/kg/h dexmedetomidine was started and delivered through a subcutaneously inserted butterfly needled attached to the upper right leg.
Approximately 45 min following the switch to dexmedetomidine (Full was 0.7±0.2 h Sham was 0.7±0.2 h), eight resting state recordings of right and left primary somatosensory activity were obtained. Sampling was acquired at a rate of 12 KHz and 5 min of data were obtained for each resting state recording. Scans occurred in 10 min intervals until eight scans were collected.
Following the final resting state electrophysiology scan, electrodes were removed from the brain, dexmedetomidine was discontinued and the rat was returned to the isoflurane filled anesthesia chamber. The isoflurane was disconnected and the anesthesia chamber was moved to another room where the rats were euthanatized with CO2.
Histology
Perfusion was performed on the first three rats from each experimental group using 4% formaldehyde and phosphate buffered saline. Brains were removed and then allowed to saturate for 24 h in a mixture of formalin and 15% sucrose; brains were then moved to a solution of 30% sucrose and formalin for an additional 24 h. Following this saturation period, brains were frozen and sliced in 250 μM coronal slices using a microtome perpendicular to the length of the corpus callosum. The 4× microscope images were acquired and histological evaluation was performed to confirm experimental success (severing or nonsevering of the corpus callosum). Histological classification was then matched with the RARE MRI images for the corresponding rats. Five MRI researchers familiar with rat brain anatomy were asked to determine whether RARE MRI images corresponded to either full or sham callosotomy, without knowledge of how such images were actually classified. No one who had participated in imaging was present during these tests, blinding this experiment. This was done to determine whether accurate evaluation of experimental success was possible without the need for histology.
Data analysis
Comparisons were made between the sham callosotomy and full callosotomy experimental groups by evaluating band limited and broadband electrophysiological bilateral connectivity, fMRI seed-based bilateral connectivity, and entire-slice spatiotemporal dynamic activity in the fMRI data. All data were processed and evaluated using code written in MATLAB (MathWorks).
Functional magnetic resonance imaging
Each resting state scan was 8 min and 20 sec and was prepared with 20 dummy scans, allowing for transient signal intensity fluctuations to dissipate before acquiring data. Standard preprocessing for resting state fMRI analysis was performed (Magnuson et al., 2010; Majeed et al., 2009) and included the following steps. Whole brain signal was regressed from all data sets followed by quadratic detrending. A band-pass filter was then applied using a finite impulse response filter between frequencies of 0.01–0.3 Hz with a 100 sec filter window length (1/minimum evaluated frequency). Following filtering, data were normalized to zero mean, unit variance by subtracting the mean and dividing by one standard deviation for all image voxels, allowing for comparison to be made between rats. Data sets were masked to exclude information from tissue outside of the brain.
Seed regions of interest (ROI) were manually selected in the primary somatosensory cortex (SI) (lateral cortical regions were chosen so as to minimize any effects from the medial lesion), secondary somatosensory cortex (SII), and the caudate/putamen (CP) complex in the opposite hemisphere from the callosotomy procedure. Normalized cross correlation was calculated between functional time courses generated from the seed region and all other voxels in the brain. Pearson correlation values (r) from the 15 most correlated voxels (approximate size of SII) from contralaterally analogous region were transformed to Z-scores using the Fisher transform (to expand the range of values to [−∞,∞] for averaging) and averaged, representing bilateral functional connectivity strength. Average values for SI, SII, and CP bilateral connectivity were calculated for all rats in each experimental group. Two-tailed, unpaired t-tests were performed between the sham and full callosotomy groups for each seed time course.
To determine whether the callosotomy resulted in a decrease in functional connectivity, a method previously used to calculate this in split-brain human epilepsy patients was used. Change in shared variance was calculated between the two groups using the function [(r 2 sham–r 2 full)/r 2 sham] (Johnston et al., 2008). The calculation of shared variance, as performed in a previous split-brain study by Johnston and associates, gave a single number that quantified the magnitude of the increase or decrease in functional connectivity following the callosotomy.
Previous work in the rat cortex (Majeed et al., 2009) has shown that the rat somatomotor network contains a highly reproducible spatiotemporal dynamic pattern. This dynamic appears as a wave of high activity (relative to the mean level of activity) that propagates from ventral–lateral cortex to dorsal–medial cortex. It is believed to be homologous to a similar pattern in humans (Grigg and Grady, 2010; Liu and Duyn, 2013; Majeed et al., 2011) and thus it is of interest to callosotomy work. An algorithm has been developed by Majeed and associates (2011) that allows a template of the characteristic spatiotemporal dynamic pattern to be produced, allowing for easy comparison between different rats and different groups (full and sham callosotomy in this study).
To summarize the algorithm developed by Majeed and colleagues, it functions by selecting a chunk of consecutive images of specified length (5 sec; 10 repetitions) chosen at a random start point in the data set, sliding correlation was performed between the image chunk and the entire preprocessed image series. Time points of high correlation between the original chunk and the image series are averaged together to create a new template that represents a repeating spatial and temporal pattern of functional activity. Sliding correlation was then performed with the new template and the original data set, and time segments of high correlation are once again averaged. This process repeats until convergence of the template occurs (which may be near zero, if there is no spatiotemporal pattern present). The resulting template reveals the presence or nonpresence of coordinated, propagating spatiotemporal activity patterns. Templates are visualized on a blue to red color scale (blue-low, red-high, Matlab colorbar “jet”) representing the strength of the finalized template. A detailed explanation of this algorithm and the underlying theory can be found in Majeed and colleagues, (2009, 2011).
Final spatiotemporal dynamic templates are categorized by qualitative analysis into one of three groups: no dynamic, bilaterally symmetric dynamic, or unilateral dynamic. Dynamic patterns were considered present if high or low amplitude correlation traveled through the cortex and/or sub-cortex from one time frame to the next in a spatially continuous manner (unilateral- single hemisphere dynamic, bilateral-dynamic in both hemispheres). If there was no occurrence of frame-to-frame spatially continuous patterns of high or low activity the template would be grouped in the no dynamic category.
Electrophysiology
Band-limited power (BLP) time courses were created for six electrophysiological frequency bands: delta (1–4 Hz), theta (4–8 Hz), alpha (8–14 Hz), low-beta (14–25 Hz), high-beta (25–40 Hz), and gamma (40–100 Hz). To calculate BLP power, a specified window length (delta and theta: 2 sec; beta and gamma: 0.5 sec) was used to generate a representative spectrogram by performing an FFT of the raw time course. Mean power within every band of interest was calculated at each time point in the spectrogram. The mean power over time for a single band was referred to as the BLP signal for that band. Note that windows for the delta and theta bands overlapped by 75% but no overlap occurred for the beta or gamma bands. As mean power was calculated in each bin directly, no final rectification or filtering step was necessary. In addition to BLP, “broadband” local field potential (LFP) time courses were also created by filtering LFP signals to the broadband ranges of 0.01–100 Hz.
Following BLP calculations and broadband power filtering, Pearson correlation was calculated between data from the left and right electrodes (positioned in bilateral SI) using all six BLP time courses and the broadband LFP from each rat. Resulting correlation values were Z-transformed using the Fisher transform (to expand the range of values to [−∞,∞] for averaging) and finally two-tailed, unpaired, Student t-tests were performed between Z-scores in each band between the sham and full callosotomy groups. Change in shared variance was calculated between the two experimental groups for each band using the same method as for fMRI (see above).
Multiple comparison correction
Bonferroni correction was used to correct for possible Type I errors (false positives). Bonferroni is used as there were few p-values and it was desirable to control both chance of error within each statistical family (family-wise error rate) and chance of each individual test giving a false positive (false discovery rate) (Benjamini and Hotchberg, 1995). For a p-value to be significant after Bonferroni correction (considered a strict method of correction), the p-value tested must be smaller than 0.05/n (n=number of comparisons in the family). Two families were evaluated: BOLD comparisons and electrophysiological comparisons. There were three p-values in the BOLD family and eight p-values in the electrophysiology family. All values described as significant in the results have passed Bonferroni multiple comparison correction.
Results
In this work we evaluate BOLD and electrophysiological bilateral functional connectivity in rats with either a complete sectioning of the corpus callosum or a sham surgery in which the corpus callosum was left intact. Group averages of temperature, heart rate, respiratory rate, and oxygenation can be found in Table 1.
Physiological Measurements
Temperature, breath rate, heart rate, and oxygenation were calculated for both sham and full callosotomy groups. Mean±SEM values are presented for each group.
Experimental classification
Histological evaluation of the effectiveness of the surgical procedure was carried out for the first three rats from each group. Surgeries were successful for all six rats resulting in minor variations in cut depth (±0.2 mm) with relation to the corpus callosum in the dorsal–ventral direction.For all eleven rodents, the corpus callosum was either fully severed (full callosotomy) or remained intact (sham callosotomy). Five MRI researchers familiar with brain MRI data examined high resolution RARE images and were able to classify the images into the correct experimental group (matching histology) with 98.7% accuracy (148/150 correct). An example of the matched RARE images and the corresponding histology are shown in the top row of Figure 2. Accurate surgical procedures were confirmed based on RARE images in the final four rats where histology was not performed. Slices from the five sham rats (Fig. 2- left) and six full callosotomy rats (Fig. 2- right) reveal the success of both experimental procedures.
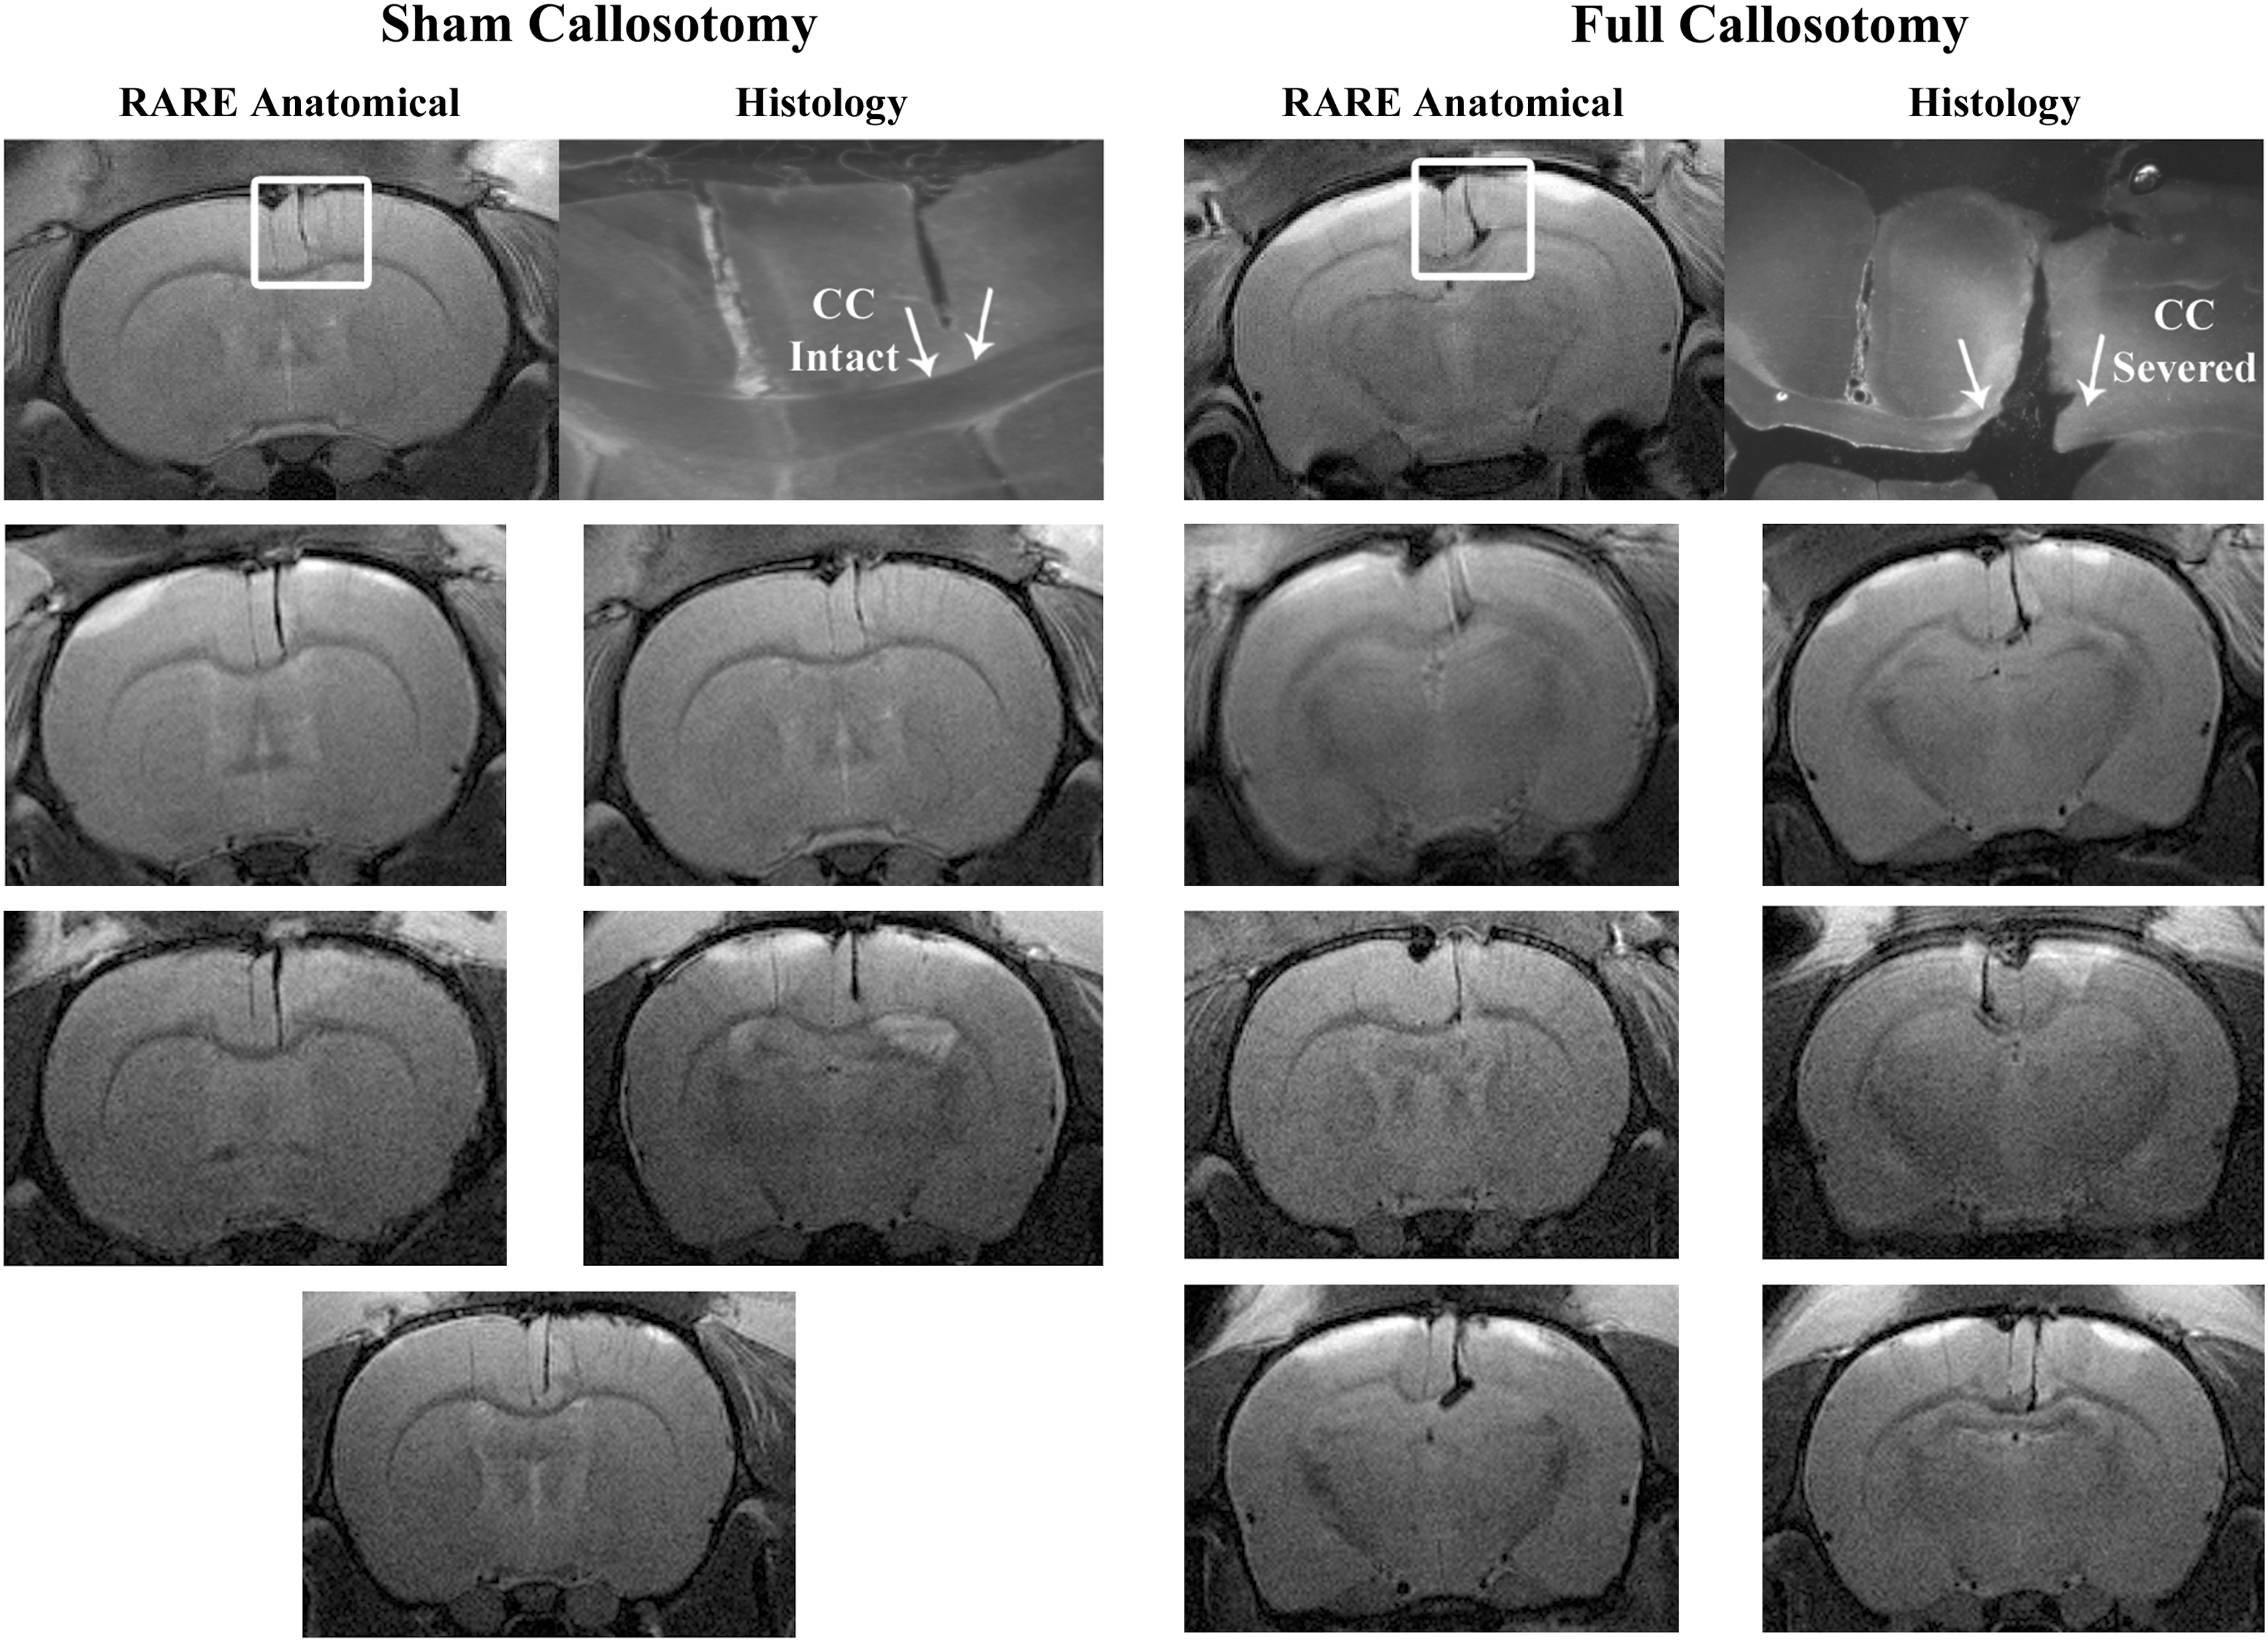
RARE anatomical MRI images and histology. Top row: A single matched RARE and histology slice. These images confirm a clear distinction and success of two experimental groups; one where a full callosotomy was performed and another where equal gray matter is severed, but the corpus callosum remains intact. White arrows indicate cortex-white matter division on upper side of corpus callosum. Bottom: Single slice RARE MRI (matching functional recording slice) data is shown for all five rats in the sham callosotomy group and all six rats in the full callosotomy group (note: only rat 4 in the full callosotomy group had the corpus callosum severed in the opposite hemisphere).
Data exclusion
All eleven rats were used for evaluation of the fMRI data; however, data from three entire rats were excluded from the electrophysiological analysis. No data were recorded from a single electrode in one rat due to amplifier signal saturation; electrophysiological data from this rat was not used. If more than 10% of a particular rat's correlation values fell more than two standard deviations from the mean of their subgroup (sham or full), data for that rat were excluded. This resulted in exclusion of an electrophysiological data set from a single rodent in both the sham and full callosotomy group. All bilateral correlation values for all bands are plotted for both experimental groups in Figure 3. The “X” marker indicates the single rat that was removed from each group. More than 10% of data points recorded for both excluded rats resulted in a value greater than two standard deviations (probability of excluded data belonging to the data set<p=0.02 for normal distribution) from the band-limited mean. A researcher (G.J. Thompson) visually inspected the LFP traces from the rats that were excluded as outliers, and observed bursting in the incorrect (positive) direction, concluding based on burst direction and shape that it was highly likely the LFP were implanted in the wrong cortical layer for these rats. Visual examination of all raw data sets resulted in the removal of two additional scans from one rat as major artifacts were present in data from both electrodes resembling a jostling of the electrode wires.
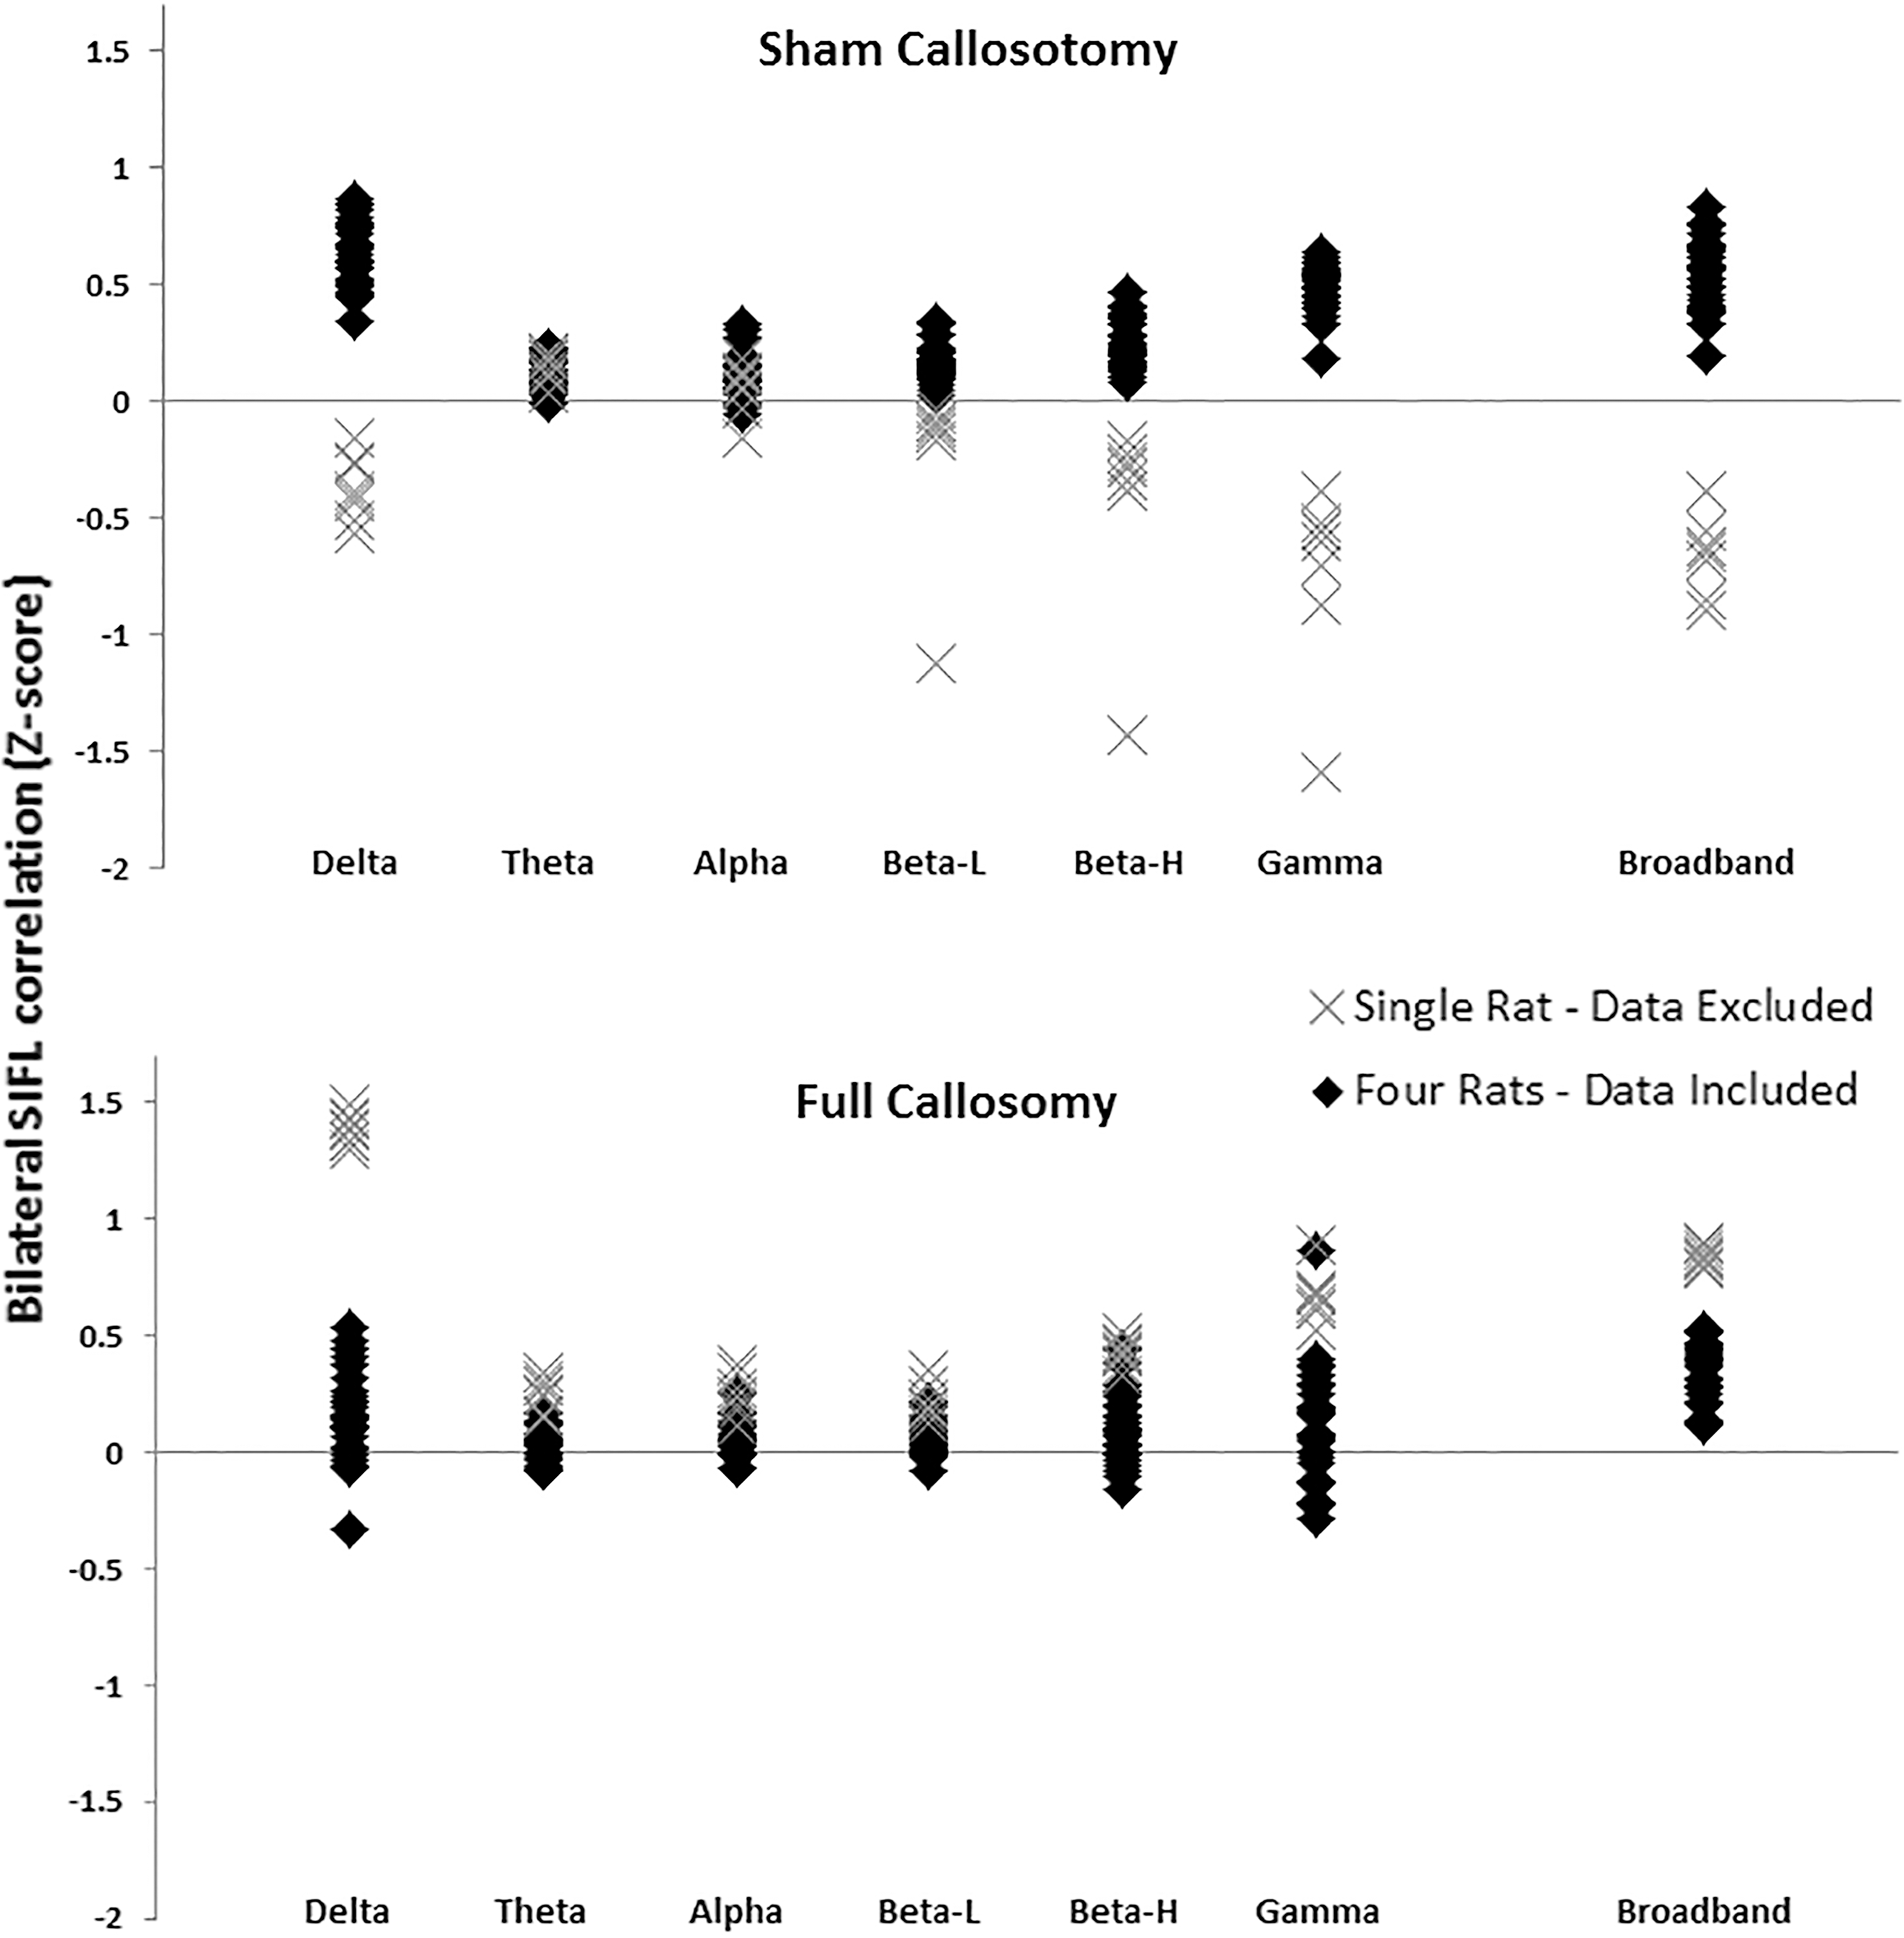
Z-scores representing bilateral electrophysiologically-measured correlation from all rats and all frequency bands (sham on top, full on bottom). Diamonds represent the four rats from each group from which electrophysiological data were included; the Xs represent the single rat in each group whose electrophysiological data were excluded. Data from an entire rat were excluded if >10% of calculated bilateral connectivity values were >2 standard deviations from the band specific mean.
Functional magnetic resonance imaging
ROI positioning and the resulting correlation maps are shown in Figure 4 for the sham and full callosotomy groups. The connectivity maps in Figure 4 are from individual rats, but are typical for their groups. Figure 5 indicates average connectivity values from the 15 most highly correlated voxels in the contralaterally analogous region for the sham and full callosotomy groups for each evaluated ROI. Error bars represent squared error of the mean (SEM).
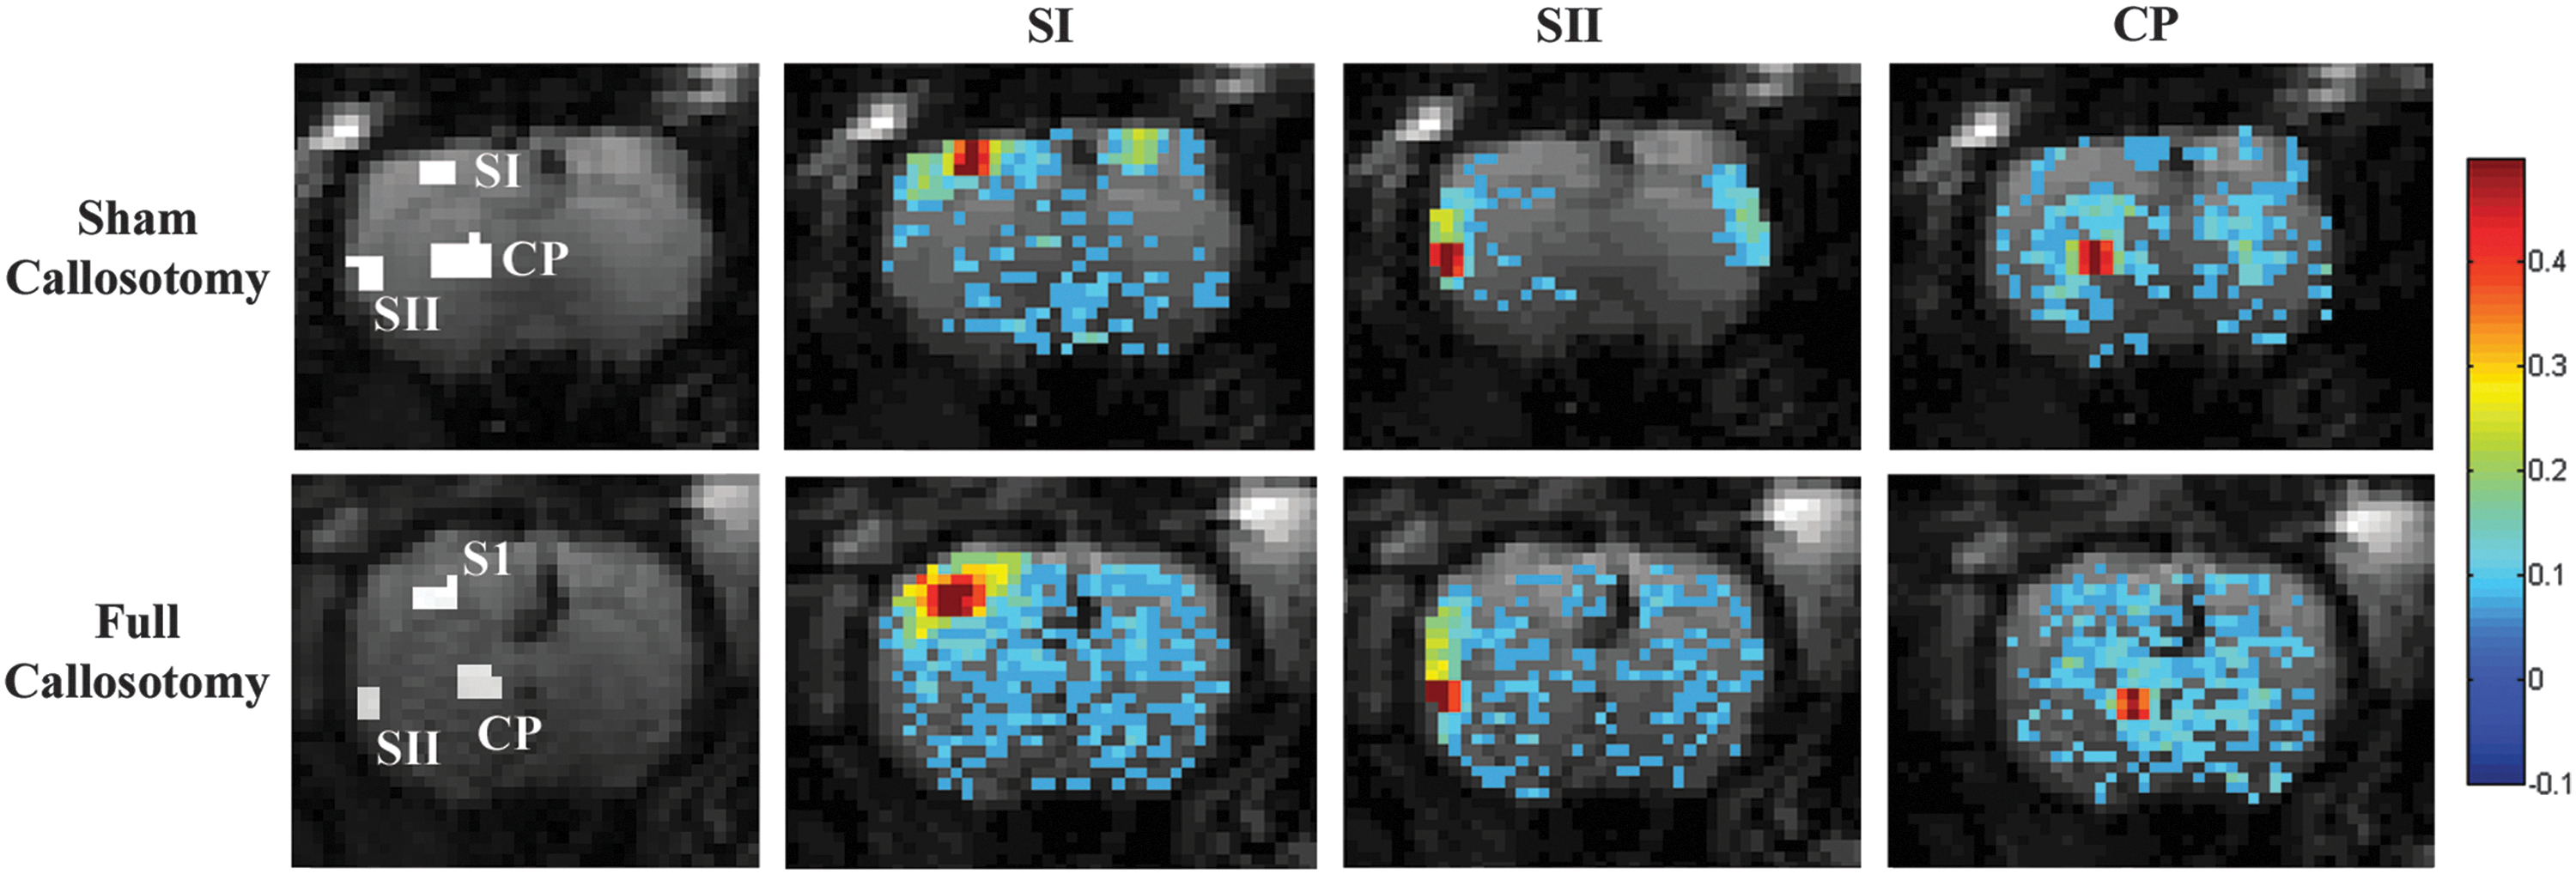
BOLD functional connectivity. Far left: Manually selected representative ROIs are shown for a single rat from the sham and full callosotomy groups. Right: Pearson correlation functional connectivity maps are overlaid on corresponding EPI images for one rat from each experimental group. Shown correlation maps closely match mean group values and were chosen for display purposes. Significantly stronger bilateral functional connectivity was observed in the sham callosotomy rodent and compared to the full callosotomy rodent.
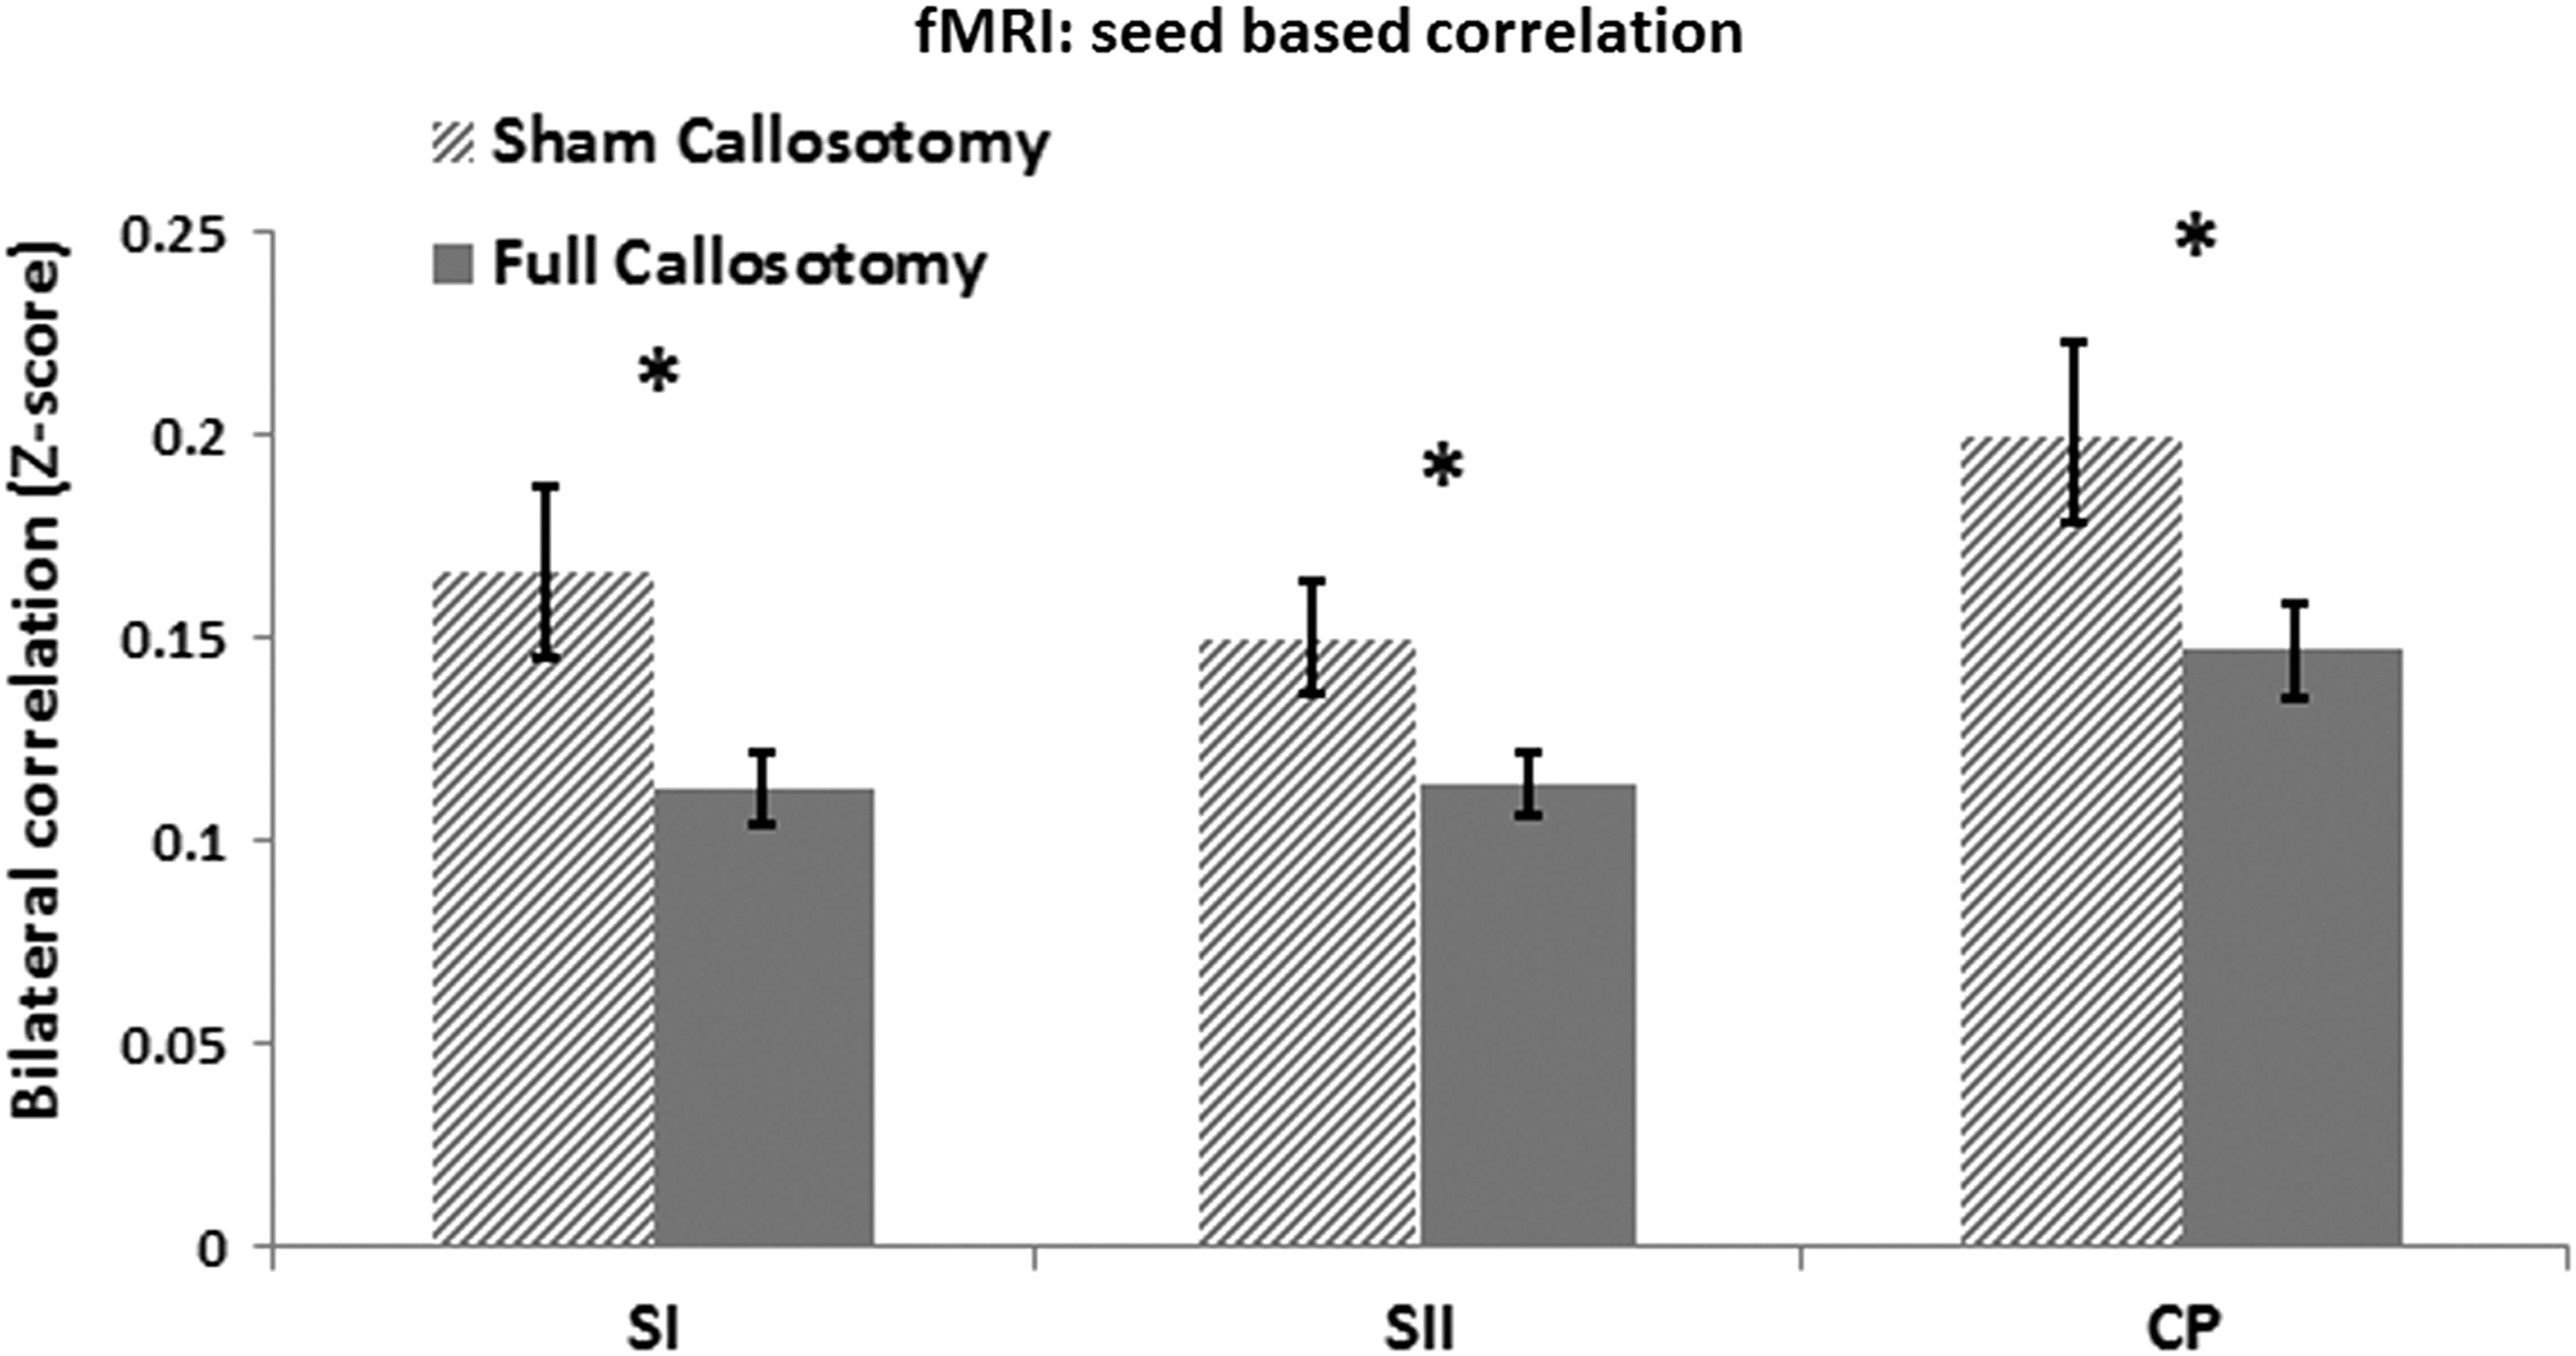
fMRI low frequency (0.01–0.3 Hz) bilateral functional connectivity in three seed regions, represented by Z scores. Significant differences in bilateral functional connectivity (indicated by *) were found between the sham (hashed bar) and full (solid bar) callosotomy groups for the primary (SI) and secondary (SII) somatosensory cortices and for the caudate/putamen complex (CP). Correlation strength is universally stronger in the sham callosotomy group. Error-bars are one standard error of the mean (SEM).
Connectivity between bilateral, low-pass filtered (0.01–0.3 Hz), BOLD data revealed significantly higher mean connectivity values in the sham group for primary and secondary somatosensory cortices and the caudate–putamen complex, as compared to the full callosotomy group. t-Tests were performed on functional connectivity values comparing the sham and full callosotomy groups for each seed region (SI, SII, and CP). Statistically significant differences in functional connectivity were found for all three seed regions evaluated. Shared variance was reduced after a full callosotomy as compared with the sham callosotomy by 51.7%, 41.7%, and 43.9% in SI, SII, and CP respectively. A summary of group means, SEMs, p-values of statistical comparisons, and decreases in shared variance can be found in Table 2.
Bilateral Connectivity and Statistics
Mean±SEM are presented for BOLD and electrophysiological bilateral functional connectivity data. p-Values and decrease in shared variance are calculated between the mean results for sham and full callosotomy groups for each seed region (BOLD) and across all BLP frequency bands (electrophysiology). Decrease in shared variance between sham and full callosotomy groups is similar for BOLD SI data and the corresponding broadband electrophysiology connectivity data.
BOLD, blood oxygen level dependent.
Characteristic templates of spatiotemporal dynamic patterns were generated for all rats using the algorithm described in Majeed and associates, (2011). Resulting spatiotemporal dynamic templates unambiguously exhibited either no dynamic, a standard, bilateral propagating wave from subcortical to lateral–ventral to dorsal–medial cortex, or a pattern similar to the standard propagating wave, but unilateral (seen in only one hemisphere). Templates were categorized by qualitative visual inspection into these three groups as presented in Figure 6: bilateral, unilateral, or no spatiotemporal dynamic. A dynamic pattern was only confirmed when the movement of a high or low correlated cluster could visually be observed “traveling” in an organized manner across the cortex from one frame to the next. Waves of activity typically traveled from lateral cortical regions (SII), through central cortical regions (SI) and finally into the motor cortex and midline before beginning again in the lateral cortex. A summary of the spatiotemporal dynamic categorization for rats in both experimental groups can be found in Table 3. The full callosotomy rodents never exhibited the presence of a bilateral spatiotemporal dynamic; however, there were high occurrences of unilaterally propagating waves that were rarely observed in previous experiments using healthy, nonsurgically altered rats. Bilateral waves of activity were present 20% of the time in the sham callosotomy group. Most commonly (in both groups), no spatiotemporal dynamic was present.
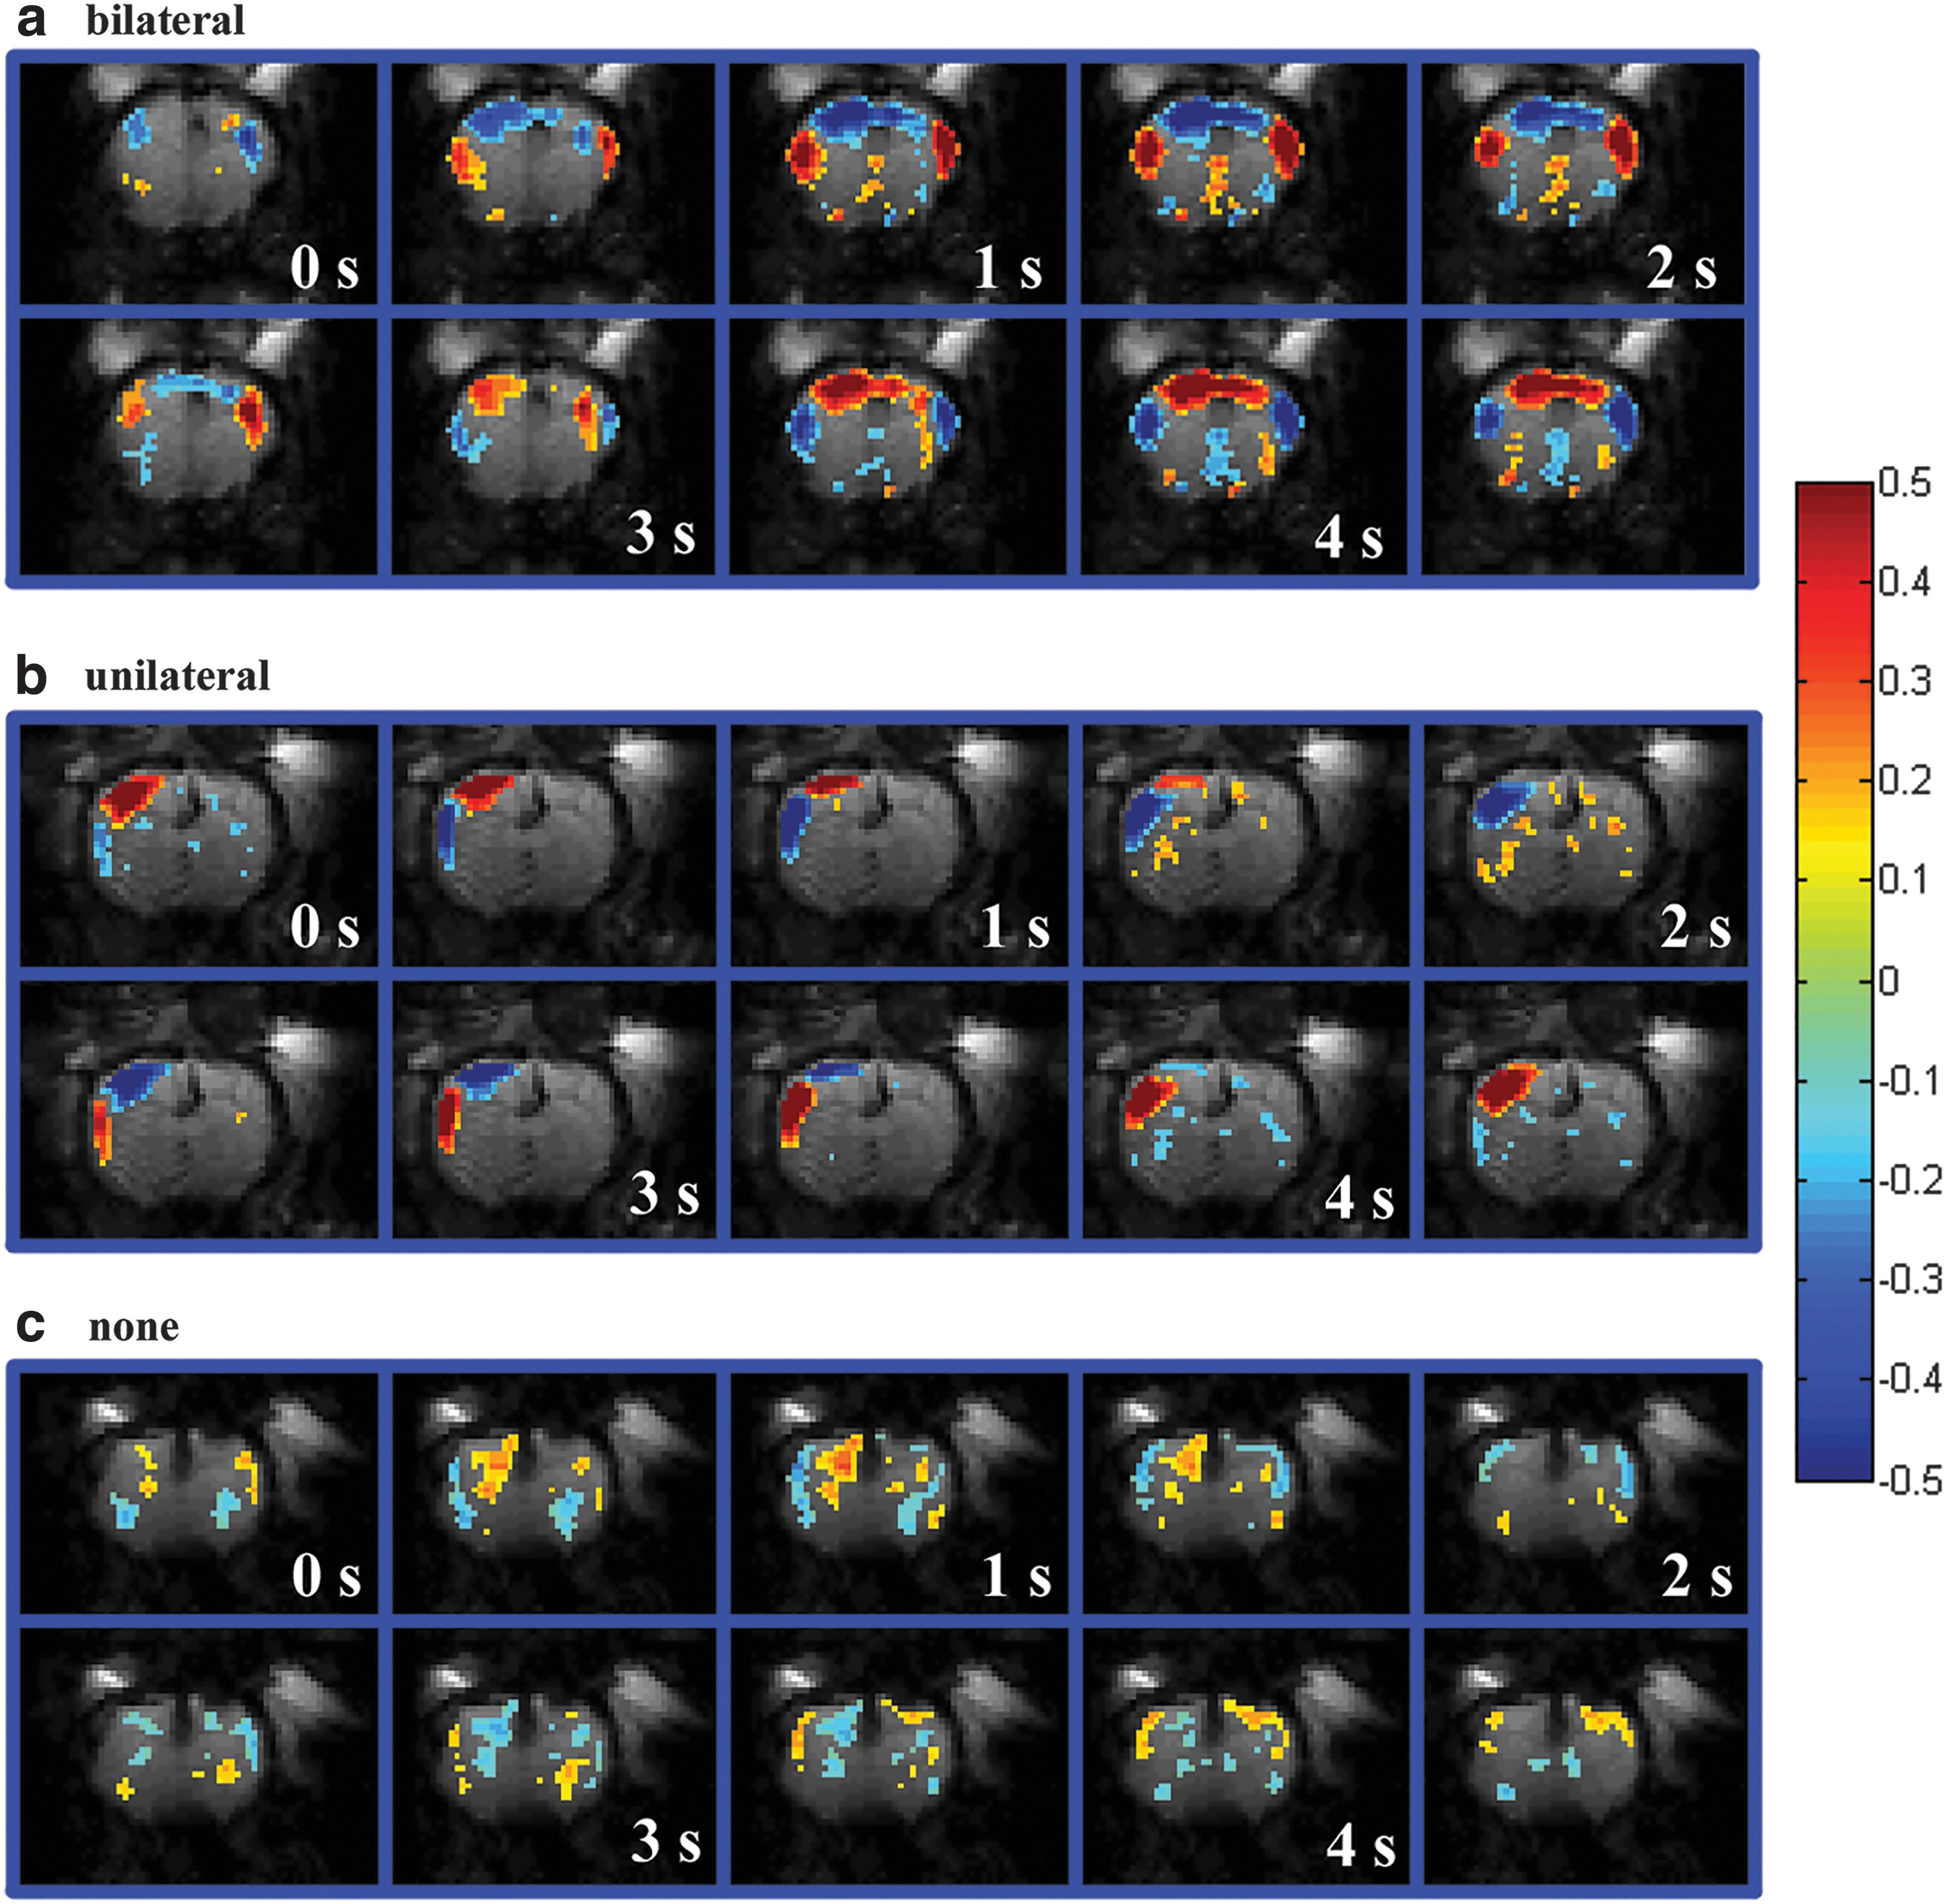
Spatiotemporal dynamic templates generated using the algorithm from Majeed and associates (2011) to define dynamic events. Images shown are frames of a dynamic pattern over several points in time (0 to 4.5 sec, 10 frames) from three different rats showing three distinct dynamic states. Dynamic activity is plotted if the amplitude of its normalized signal is greater than 0.08 (this cutoff was selected for visualization purposes, and was used for classification) versus a mean EPI image (color scale shown on right). Blue colors indicate below average functional activity in the template while red indicates above average functional activity. Spatiotemporal dynamic patterns were clearly categorized into three groups:
Spatiotemporal Dynamic Categorization
Spatiotemporal dynamic templates were generated for both experimental group; the resulting templates were categorized as exhibiting bilateral, unilateral, or no dynamic behavior (see Fig. 6). There were no bilateral dynamic pattern present in any of the full callosotomy data; however, a unilateral spatiotemporal dynamic pattern was observed in many of the spatiotemporal dynamic templates in the full callosotomy data.
A movie file has been included in supplementary data to illustrate an example of a bilateral spatiotemporal dynamic pattern. (Supplementary Movie S1; Supplementary Data are available online at
Electrophysiology
Bilateral connectivity of BLP from electrophysiological signals was assessed in delta, theta, alpha, low beta, high beta, and gamma band frequency ranges. Direct bilateral correlation of filtered broadband activity was also assessed. Figure 7 illustrates the results of analysis. The sham callosotomy data exhibited universally higher functional connectivity for all evaluated bands. Statistically significant differences between the two were calculated for delta, theta, low beta, high beta, gamma, and broadband ranges. A summary of all electrophysiological connectivity results can be found in Table 2. There was a reduction of shared variance of 51.7% in the broadband correlation data in the full callosotomy group as compared with the sham callosotomy group. This reduction in shared variance was approximately equal to the analogous result from bilateral primary somatosensory BOLD data.
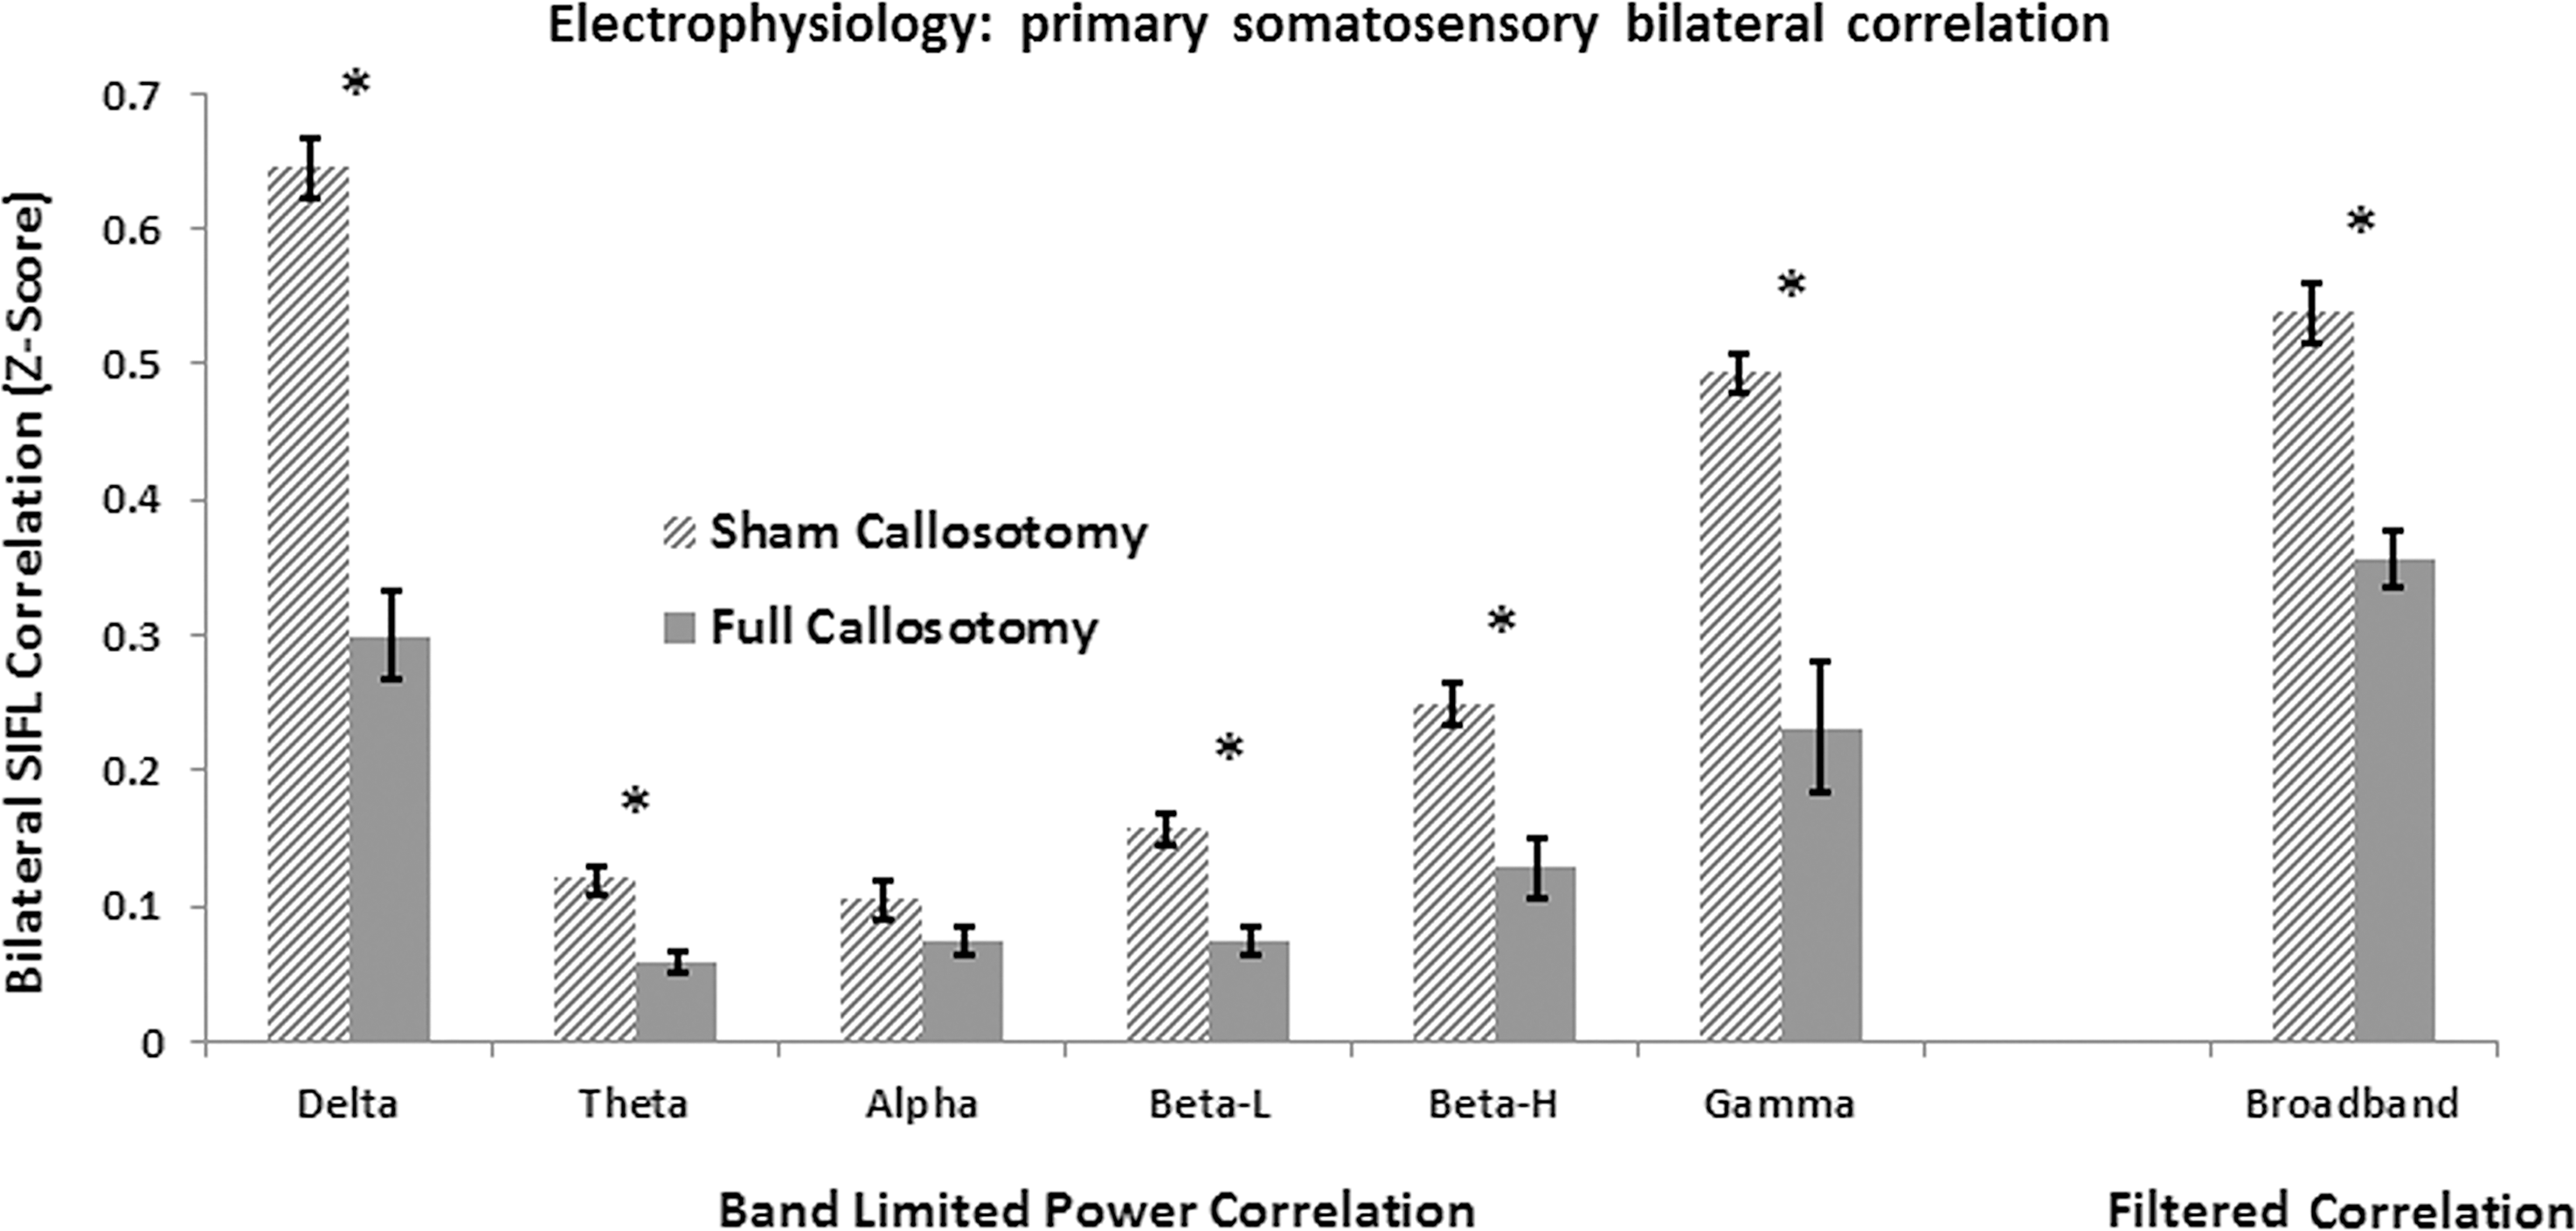
Electrophysiological band limited power functional connectivity between bilateral primary somatosensory regions, represented by Z scores. Mean connectivity is universally higher for the sham callosotomy (hashed bar) rodents as compared with the full callosotomy (solid bar), and significant differences (indicated by *) between the groups are found in delta, theta, low beta (Beta-L), high beta (Beta-H), gamma, and broadband data.
Discussion
Summary
Surgeries were performed in two groups of rodents resulting in either a complete sectioning of the corpus callosum or a sham sectioning where the normal damage occurred to gray matter but the corpus callosum was not severed. Neural electrophysiology and BOLD fMRI were used to assess bilateral functional connectivity following these surgeries. A reduction in bilateral functional connectivity was apparent in BOLD and electrophysiological data in the full callosotomy groups.
Two cortical regions (SI and SII) and a subcortical region (the CP complex) measured with the BOLD signal showed significantly decreased functional connectivity in a full callosotomy, and the SI region, closest to the sectioning, showed the greatest decrease. Band-limited power in every band tested except alpha (8–14 Hz) was also significantly decreased in the full callosotomy, and broadband amplitude (Table 2). Interestingly, the decrease in shared variance of broadband amplitude connectivity closely matched that of SI BOLD connectivity, the site where the electrodes were implanted. In addition to this static analysis, a dynamic analysis revealed an interesting change in the spatiotemporal dynamics observed following a full callosotomy. The prevalent dynamic observed (when they could be observed) shifted from bilateral to unilateral, indicating that, while a wave propagating from subcortical to lateral–ventral to medial–dorsal cortex was preserved, its bilaterality was lost in the full callosotomy. These results point to an overall decrease in interhemispheric synchronization in both cortical regions directly connected by the severed axonal tracts, and subcortical regions that are only indirectly connected. Yet, these results suggest that the spontaneous fluctuations in a single hemisphere, such as the time-lagged correlation that produces the spatiotemporal dynamic patterns, may be generally preserved. Combined, the implication is that the corpus callosum mediates inter-hemispheric functional connectivity, yet not intra-hemispheric activity.
The significance of these findings are twofold: for the first time the effects of the callosotomy model on functional network integrity has been evaluated in a previously healthy rodent population, as compared to previous work on patients whose brains were likely altered by epileptic activity. Second, the callosotomy model provides an ideal platform for evaluating the interconnectedness of BOLD and neural activity by determining the similarity of effects on each modality as a result of the interventional surgery. Gamma band BLP connectivity is thought to be most closely reflective of large-scale fMRI networks (Leopold et al., 2003; Pan et al., 2011; Scholvinck et al., 2010; Thompson et al., 2013). In the work presented here, bilateral gamma BLP connectivity was the most strongly affected by the full callosotomy further signifying the likely importance of gamma BLP in large-scale functional networks.
Structural and functional connectivity
The corpus callosum is a dense collection of myelinated and unmyelinated axons, 1.9×10⁸ (total axons) in humans (Tomasch, 1954) and 1.2×10⁷ (total axons) in rats (Gravel et al., 1990), providing homotopic and heterotopic projections linking the two hemispheres of the brain. There is contention from a physiological perspective as to the pathway by which the corpus callosum mediates functional connectivity. One school of thought suggests an inhibitory role of the corpus callosum (Banich and Belger, 1990; Cook, 1984) while the more widely accepted theory advocates an excitatory role of the corpus callosum (Dorion et al., 2000; Rattenborg et al., 2000); however, both theories allow for selective lateralization and unilateral hemispheric domination of cortical activation as a function of the calossal pathways (van der Knaap and van der Ham, 2011).
Further evidence of the corpus callosum's likely role in functional network integrity lie in the interrelationship between structural connectivity and functional connectivity (Honey et al., 2009); however, it has also been revealed that direct structural connectivity was not necessary for strong functional connectivity to exist (Damoiseaux et al., 2009; Honey et al., 2009). While the neuroanatomical framework provides the platform on which functional networks are activated, patterns of activity vary within that framework to respond to the brain's current processing needs. While structural connectivity plays a central role in functional connectivity, it is not the only source driving these networks.
Subcortical effects
Reduced bilateral functional connectivity in the caudate/putamen complex as a result of the callosotomy may be somewhat surprising considering there are very few bilateral projections between the subcortical hemispheres. There are two possible explanations for the reduction in subcortical connectivity. First, the dynamic activity patterns shown in Figure 6 often pass bilaterally through the caudate putamen before continuing on through the secondary somatosensory cortex and then the primary somatosensory cortex (this pattern can be seen in Supplementary Movie S1. The bilateral nature of these dynamic patterns likely contribute to resting state functional connectivity (Majeed et al., 2011). In the full callosotomy experimental group, bilateral dynamic patterns are disrupted, which hypothetically would result in reduced connectivity. Second, while there are no direct projections between left and right CP via the corpus callosum, there are unilateral projections from the CP to SI. From there information from the CP can be passed through the corpus callosum, through several synapses, and then to the contralateral subcortical region. It is also possible that the coordinated activity in SI contributes to the CP correlation through one of these polysynaptic circuits, possibly with a time delay that explains why SI and CP themselves are typically not correlated. Without the corpus callosum intact, it is not surprising to find a reduction in subcortical connectivity.
Traditional seed-based functional connectivity results in dynamic information from all time periods of the resting state period (minutes long) being compressed to a single correlation value; time-sensitive events (seconds long) and relationships are lost in such analysis. In studying an interhemispheric coordination model using lexical visual stimuli, Doron and colleagues encountered the transient manner in which functional networks activate and deactivate, highlighting the need for nonstatic evaluations of functional networks to obtain novel insights into sensitive spatiotemporal information that was not previously obtainable (Doron et al., 2012). We address this dynamic evaluation in our work by performing spatiotemporal dynamic template analysis that was first offered by Majeed and associates (2009). While our static evaluation revealed little to no connectivity in the full callosotomy model, the robust presence of unilateral spatiotemporal dynamic activity was indicated (Fig. 6b). This unilateral pattern is a spatiotemporal template variation that was rarely seen previously, suggesting its relationship to the present study's unique surgical paradigm. While this pattern was also observed in 2.8% (1/36) of scans from the sham callosotomy group, the unilateral pattern primarily appears within the full callosotomy group. The unilateral nature of these spatiotemporal dynamic patterns suggests further that the information necessary for bilateral coordination is not being exchanged between the hemispheres. The continuation of unilateral spatiotemporal patterns (that closely match their one-sided counterpart from the bilateral spatiotemporal dynamic) suggests the possibility that this dynamic pattern is driven by subcortical inputs, but the bilateral coordination of the dynamic are mediated by cortico–cortical interactions through the now severed corpus callosum.
This subcortical influence theory is supported by the work of Uddin and associates who found strong residual bilateral connectivity in a patient with entirely removed commissural pathways (albeit 45 years following the callosotomy allowing ample time for functional rearrangement); they conclude the cortical networks are coordinated, at least in part, by subcortical mechanisms (Uddin et al., 2008). Previous studies have shown near-zero connectivity between the somatosensory cortex and the caudate-putamen, either ipsilaterally or contralaterally, at a standard lag time of zero (Majeed et al., 2009; Williams et al., 2010). However, it is interesting to speculate that the caudate-putamen and cortex may be functionally connected ipsilaterally at lag times other than zero, and this connection may only become bilateral through cortical efferents that are synchronized through the corpus callosum. This hypothesis is consistent with the observation of unilateral dynamics in the full callosotomy model.
The corpus callosum and behavior
The results seen in this work support the long-standing observation that functional networks commonly contain contralateral homologues of the same region, which has suggested the possible role of calossal pathways in mediating functional networks. Callosotomies were performed before 1940 to treat patients with intractable epilepsy (Van Wagenen and Herren, 1940); the results indicated that the procedure seemed to reduce epileptic seizures in many cases. Behavioral implications of the split brain model have since been evaluated in models including cats (Myers, 1956; Myers and Sperry, 1958), monkeys (Gazzaniga, 1966), and humans (Brazdil et al., 1997; Johnston et al., 2008) revealing the importance of the corpus callosum for bi-hemispheric exchange of motor, sensory, and perceptual information (Paul et al., 2007). Generalizing the current body of work reveals that for simple tasks the callotomized brain is capable of performing normally; however, as the complexity of the task increases, requiring recruitment of both hemispheres, performance is severely impacted (Banich et al., 1990; Belger and Banich, 1998; Brown et al., 1999; Weissman and Banich, 2000). The corpus callosum's role in providing a route of communication between the hemispheres is apparent from these works.
Limitations of these methods
Based on the discrepancies in the results from the callosotomy in the epileptic human models, there is a clear need for a controlled, reproducible study of functional connectivity in a population of callotomized animals. While the confounding variables are highly reduced in the current work; the paradigm is not without constraints. While care was taken to avoid large vessels, vascular damage was inevitable as a result of the callosotomy procedure; however, the sham callosotomy group was subject to identical vascular influences so that any differences could be attributed to the severed corpus callosum. Similarly, there was damage done to the cortical gray matter in both experimental groups; however, the disruption was nearly identical in both groups.
Minor surgical variability was apparent in our RARE MRI images and histology in the depth of the sham callosotomies (Fig. 2). About 0.5 mm of buffer space was built into the sham callosotomy group to ensure the corpus callosum was not affected by the surgical procedure. While zero variation in surgical depth of the sham cut would have been ideal, the resulting surgical outcomes were clearly categorized into two groups: severed corpus callosum and intact corpus callosum and served our purposes in this work.
Sequential collection of LFP and fMRI data as opposed to simultaneous collection prohibited direct comparisons between BOLD and LFP data, allowing only for inferential findings regarding the inter relationships between BOLD and LFP. Further, brain conditions could potentially be significantly different in fMRI versus LFP sessions, specifically due to the effects of anesthesia. Both the isoflurane used for a long period of time prior to functional imaging and the use of dexmedetomidine while imaging influence ongoing functional activity. In an article separate from our group (currently under peer review, see also Magnuson et al. 2010), we reveal longitudinal, lingering influences of long durations of isoflurane prior to functional imaging that may take up to several hours to dissipate depending on the preceding duration of isoflurane use. Waiting for absolute dissipation of the functional effects of isoflurane was not feasible in the present study due to the length of the procedures in their current form. In lieu of waiting, we were careful to maintain equidistant spacing between the cessation of isoflurane and functional recordings in both groups (see fMRI and electrophysiology subsections of methods), thereby limiting possible biasing effects of anesthetic influences to measures such as t-tests between groups and reduction in shared variance.
The resulting fMRI connectivity in the current study, even within the sham group, was lower than normally seen (r=∼0.3–0.55 depending upon the imaging and processing techniques) in healthy noncallotomized rats (Kalthoff et al., 2013; Magnuson et al., 2010; Williams et al., 2010; Zhao et al., 2008). The reduced connectivity suggests compounding influences of vascular perturbations from the surgery and possibly lingering isoflurane effects observed in intact rats prior to full recovery from the anesthesia. The unintended acute effects of the surgical procedure are not-well defined here and are possibly complex and widespread; however, both experimental groups underwent nearly identical processes with an intact or severed callosotomy being the only variation. We may assume that differences in the findings may largely be attributed to this variation. Interestingly, near-normal BLP electrical connectivity was observed in the sham callosotomy data. These strong connectivity values are likely due to the LFP recording occurring long after the initial surgical isoflurane period (multiple hours); further, the neural activity is significantly less affected by possible vascular damage as compared with the BOLD signal. The authors are also presently unaware of any evidence that the time-dependent effects of isoflurane and dexmedetomidine on functional connectivity extend to neural electrophysiology; thus far they have only been observed in BOLD-fMRI.
Conclusion
To summarize, we present a robust finding indicating the corpus callosum's role in facilitating bilateral functional connectivity in the rodent model. BOLD and electrophysiological data indicate significantly less bilateral functional connectivity in the experimental group where the corpus callosum was fully severed as compared with the sham callosotomy group. Further, bilateral primary somatosensory connectivity was affected to a similar degree in both BOLD and electrophysiological data suggesting significant interconnectedness between the measured signals. Finally, observation of unilateral spatiotemporal patterns in the full callosotomy indicates that, while the corpus callosum may modulate contralateral aspects of functional connectivity, ipsilateral effects may be due to subcortical drivers.
Footnotes
Acknowledgments
We would like to thank Dr. Melike Schalomon for conversations and insights regarding the callosotomy procedure. We would also like to thank the NIH for two primary funding sources used to fund the research presented in this article (R21NS057718 and T32EB005969).
Author Disclosure Statement
No competing financial interests exist.
References
Supplementary Material
Please find the following supplemental material available below.
For Open Access articles published under a Creative Commons License, all supplemental material carries the same license as the article it is associated with.
For non-Open Access articles published, all supplemental material carries a non-exclusive license, and permission requests for re-use of supplemental material or any part of supplemental material shall be sent directly to the copyright owner as specified in the copyright notice associated with the article.