




Abstract
Data-driven models drawn from statistical correlations between brain activity and behavior are used to inform theory-driven models, such as those described by computational models, which provide a mechanistic account of these correlations. This article introduces a novel multivariate approach for bootstrapping neurologically-plausible computational models that accurately encodes cortical effective connectivity from resting state functional neuroimaging data (rs-fMRI). We show that a network modularity algorithm finds comparable resting state networks within connectivity matrices produced by our approach and by the benchmark method. Unlike existing methods, however, ours permits simulation of brain activation that is a direct reflection of this cortical connectivity. Cross-validation of our model suggests that neural activity in some regions may be more consistent between individuals, providing novel insight into brain function. We suggest this method to make an important contribution toward modeling macro-scale human brain activity, and it has the potential to advance our understanding of complex neurological disorders and the development of neural connectivity.
Introduction
A primary goal of cognitive neuroscience is to generate models of how cognition arises from the organized activity of a network of billions of individual neurons. It has become common practice to generate hypotheses from data-driven models of brain-behavior correlations, translate these hypotheses into computational models, and use them to predict brain activity (Friston, 2009). To create a neurologically plausible computational model, however, one inevitably faces the challenge of identifying those brain regions (or nodes) that importantly participate in a given cognitive process, and how these nodes might influence one another. Though these decisions may be guided to some extent by theory, this approach carries with it a number of limitations, of which we list just a few: Models founded on invalid theories are necessarily invalid and may be of limited use (though this approach is routinely used to help evaluate the validity of a theory). Assuming the validity of the underlying theory, faithful implementation of a cognitive theory in a computational model requires considerable domain expertise. Moreover, these theories (and thus, any associated models) may miss the contributions of nodes that have not been previously implicated in a given process, but nonetheless play an important role. Finally, the modeler will find it increasingly difficult to consider complex networks, and the nonobvious interactions that may occur in them. We present a novel data-driven method for deriving computational models that encode effective connectivity directly from statistical correlations present within functional neuroimaging data (fMRI) data. These models may be subsequently analyzed using graph-theoretic measures commonly applied to investigations of brain connectivity. Importantly, unlike the statistical descriptions of brain connectivity produced using conventional methods, these models may be used to simulate and thus predict neural activity.
Models and Connectivity
We assume cognitive processes transpire within an interconnected network of brain regions. Graph-theory, which has been increasingly applied to studies of brain networks in recent years, describes networks as sets of nodes (e.g., representing brain regions) linked by connections (Bressler and Menon, 2010; Bullmore and Sporns, 2009). Connections implicitly have weight (assuming binary or real values), indicating the potential for nodes to influence one another. Functional connectivity networks are often derived from statistically thresholded cross-correlations between time-series data (Sporns et al., 2004), and describe statistical dependencies between brain regions. Connections in models of effective connectivity–the causal effect of one node over another (Sporns et al., 2004)–such as those associated with Granger Causality Analysis (GCA) or Dynamic Causal Modeling (DCM) (Roebroeck et al., 2011) additionally have directionality. Inter-regional weights within these networks may be asymmetric, in contrast to those derived from correlations, which are necessarily symmetrical.
A Connectionist Approach to Cognitive Neuroscience
Connectionist, or artificial neural networks (ANNs), are among the most explicit brain-behavior models, and have been used to implement brain-based models of a number of phenomena, including hippocampal-based memory (Norman and O'Reilly, 2003), working memory (Frank et al., 2001), and hierarchical processing in the visual stream (Casey and Sowden, 2012). ANNs simulate cognitive processes within computational models composed of networks of neuronally-inspired processing units or nodes linked by weighted connections. These connection weights are iteratively learned through supervised learning using a training algorithm, such as the backpropagation of error algorithm (McClelland et al., 2010; Rumelhart et al., 1986). A recent and widely accepted application of this algorithm involves creating a multivoxel pattern analysis (MVPA) classifier (Johnson et al., 2009). Over many training examples, the network solves a constraint satisfaction problem, finding a set of connection weights that produce the appropriate classification output for a given activation pattern while minimizing error. MVPA can be viewed as a particular case of category learning in a connectionist network: MVPA network associates brain regions and experimental conditions, whereas ours associates the activity levels of each brain region with that of every other region.
Whether describing relationships among brain regions or artificial neurons, contemporary approaches to cortical connectivity and ANNs operate over the same mathematical structures underlying graph theory: nodes and weighted edges. To be clear, graph-theoretic analyses are not always applied to studies of fMRI connectivity. For example, principle component analyses (PCA) carried out on resting state-fMRI (rs-fMRI) data map brain regions associated with functional sub-networks, but do not directly measure connectivity within or between networks. Nonetheless, embedded networks revealed by these methods implicitly comprise collections of regions (or nodes) that are connected in some manner, and there is consequently a transparent mapping between connectionist and connectivity networks. We propose applying a commonly-used machine learning algorithm to neuroimaging data to encode neural connectivity within a computational model. Applied to investigations of brain connectivity, our method has several advantages over current approaches. One is that our network naturally detects effective connectivity between brain regions but, unlike many existing methods, does so without prior specification of any causal model (Sporns et al., 2004). Structural equation modeling (SEM) and DCM, two common methods of specifying causal models, require the experimenter to specify the hypothesized network(s) prior to testing it. Yet, many models may fit the data, and an exhaustive search of the model space may be intractable for networks of even modest size. In contrast, our approach is strictly data-driven and thus circumvents this concern. This is because supervised learning allows the network to detect conditional co-occurrence probabilities embedded within training patterns, the asymmetry of which may reflect causal relationships. GCA is a data-driven method for determining effective connectivity among neural populations that, like ours, does not rely on a priori model specification (Roebroeck et al., 2005). However, as with all current methods of identifying functional networks within neuroimaging data and measuring connectivity within them, GCA provides a static description of connectivity. It is unclear, in such models, how these patterns of connectivity arose over time, what are the consequences of disruption of this connectivity, and how connectivity is causally related to patterns of neural activity. The approach we propose may provide important insight into all these questions.
With appropriately recoded rs-fMRI time-series data covering the entire cortical surface, we use a leave-one-out cross-validation approach to train nine feedforward connectionist networks (described in more detail below) on these data. These trained models represent nine artificial brains in which individual nodes represent distinct cortical regions, and weighted connections represent effective connectivity between these regions. The primary objective was to build a neurologically plausible computational model that veridically encodes cortical connectivity. Because these models are derived from rs-fMRI data, and because this class of model has been shown to be sensitive to correlations within the training data (McRae et al. 1997), we expected that weights within our model would capture inter-regional connectivity similar to that measured by rs-fMRI time-series correlations. Moreover, we predicted that the similarity between the model's weight matrix and correlation-based connectivity matrix should lead to the emergence of similar embedded communities within both of these matrices. Moreover, we demonstrate that our approach carries several advantages over conventional approaches to investigating brain connectivity. Specifically, we demonstrate that, because our model is sensitive to correlations embedded within the training signal, it encodes directionality and valence of connections, and permits simulations of regional activations as a function of activity in other connected brain areas. We use a conventional statistical correlation-based method for determining functional connectivity within these data as a benchmark. Application of a commonly-used network modularity algorithm to the connectivity matrices calculated using our connectionist approach and the benchmark method confirmed the prediction that our method detects similar network structure. We propose several network metrics for our connectionist network, including a goodness of fit measure indicating the fidelity with which simulated activity within each network simulates actual fMRI activation data not used during training. Though our primary objective is to describe a novel methodology, the assessment of our network's performance nonetheless provides new insight into the reliability of brain activity patterns within resting state networks.
Materials and Methods
fMRI data set
The resting state paradigm is a passive condition in which brain activity is recorded while participants engage in a minimally demanding task. Though it was not our objective to make strong theoretical claims about resting state connectivity, there were two factors that suggested rs-fMRI data for this experiment. First, a large body of resting state neuroimaging literature reliably reports a network of brain regions that spontaneously activates during passive tasks (Buckner, 2012). The replicability of resting state networks within the neuroimaging literature maximized the likelihood that they would emerge from the training data and would be readily recognizable.
A second factor was the availability of large rs-fMRI data sets on which to train our model. Our data were drawn from the Cambridge_Buckner data set from the 1000 Functional Connectomes Project (
MRI data were acquired on a Siemens 3T Tim Trio scanner (Siemens, Germany). A single functional run, approximately 6 min in duration (119 volumes), was acquired using the following parameters: repetition time (TR)=3 sec, 3 mm isotropic voxels, and field of view (FOV): 216 mm. Participants were instructed to remain still with eyes open and remain awake during the functional run.
Structural MRI preprocessing
Cortical reconstruction and volumetric segmentation was performed with the 64-bit FreeSurfer 5.0 image analysis suite (
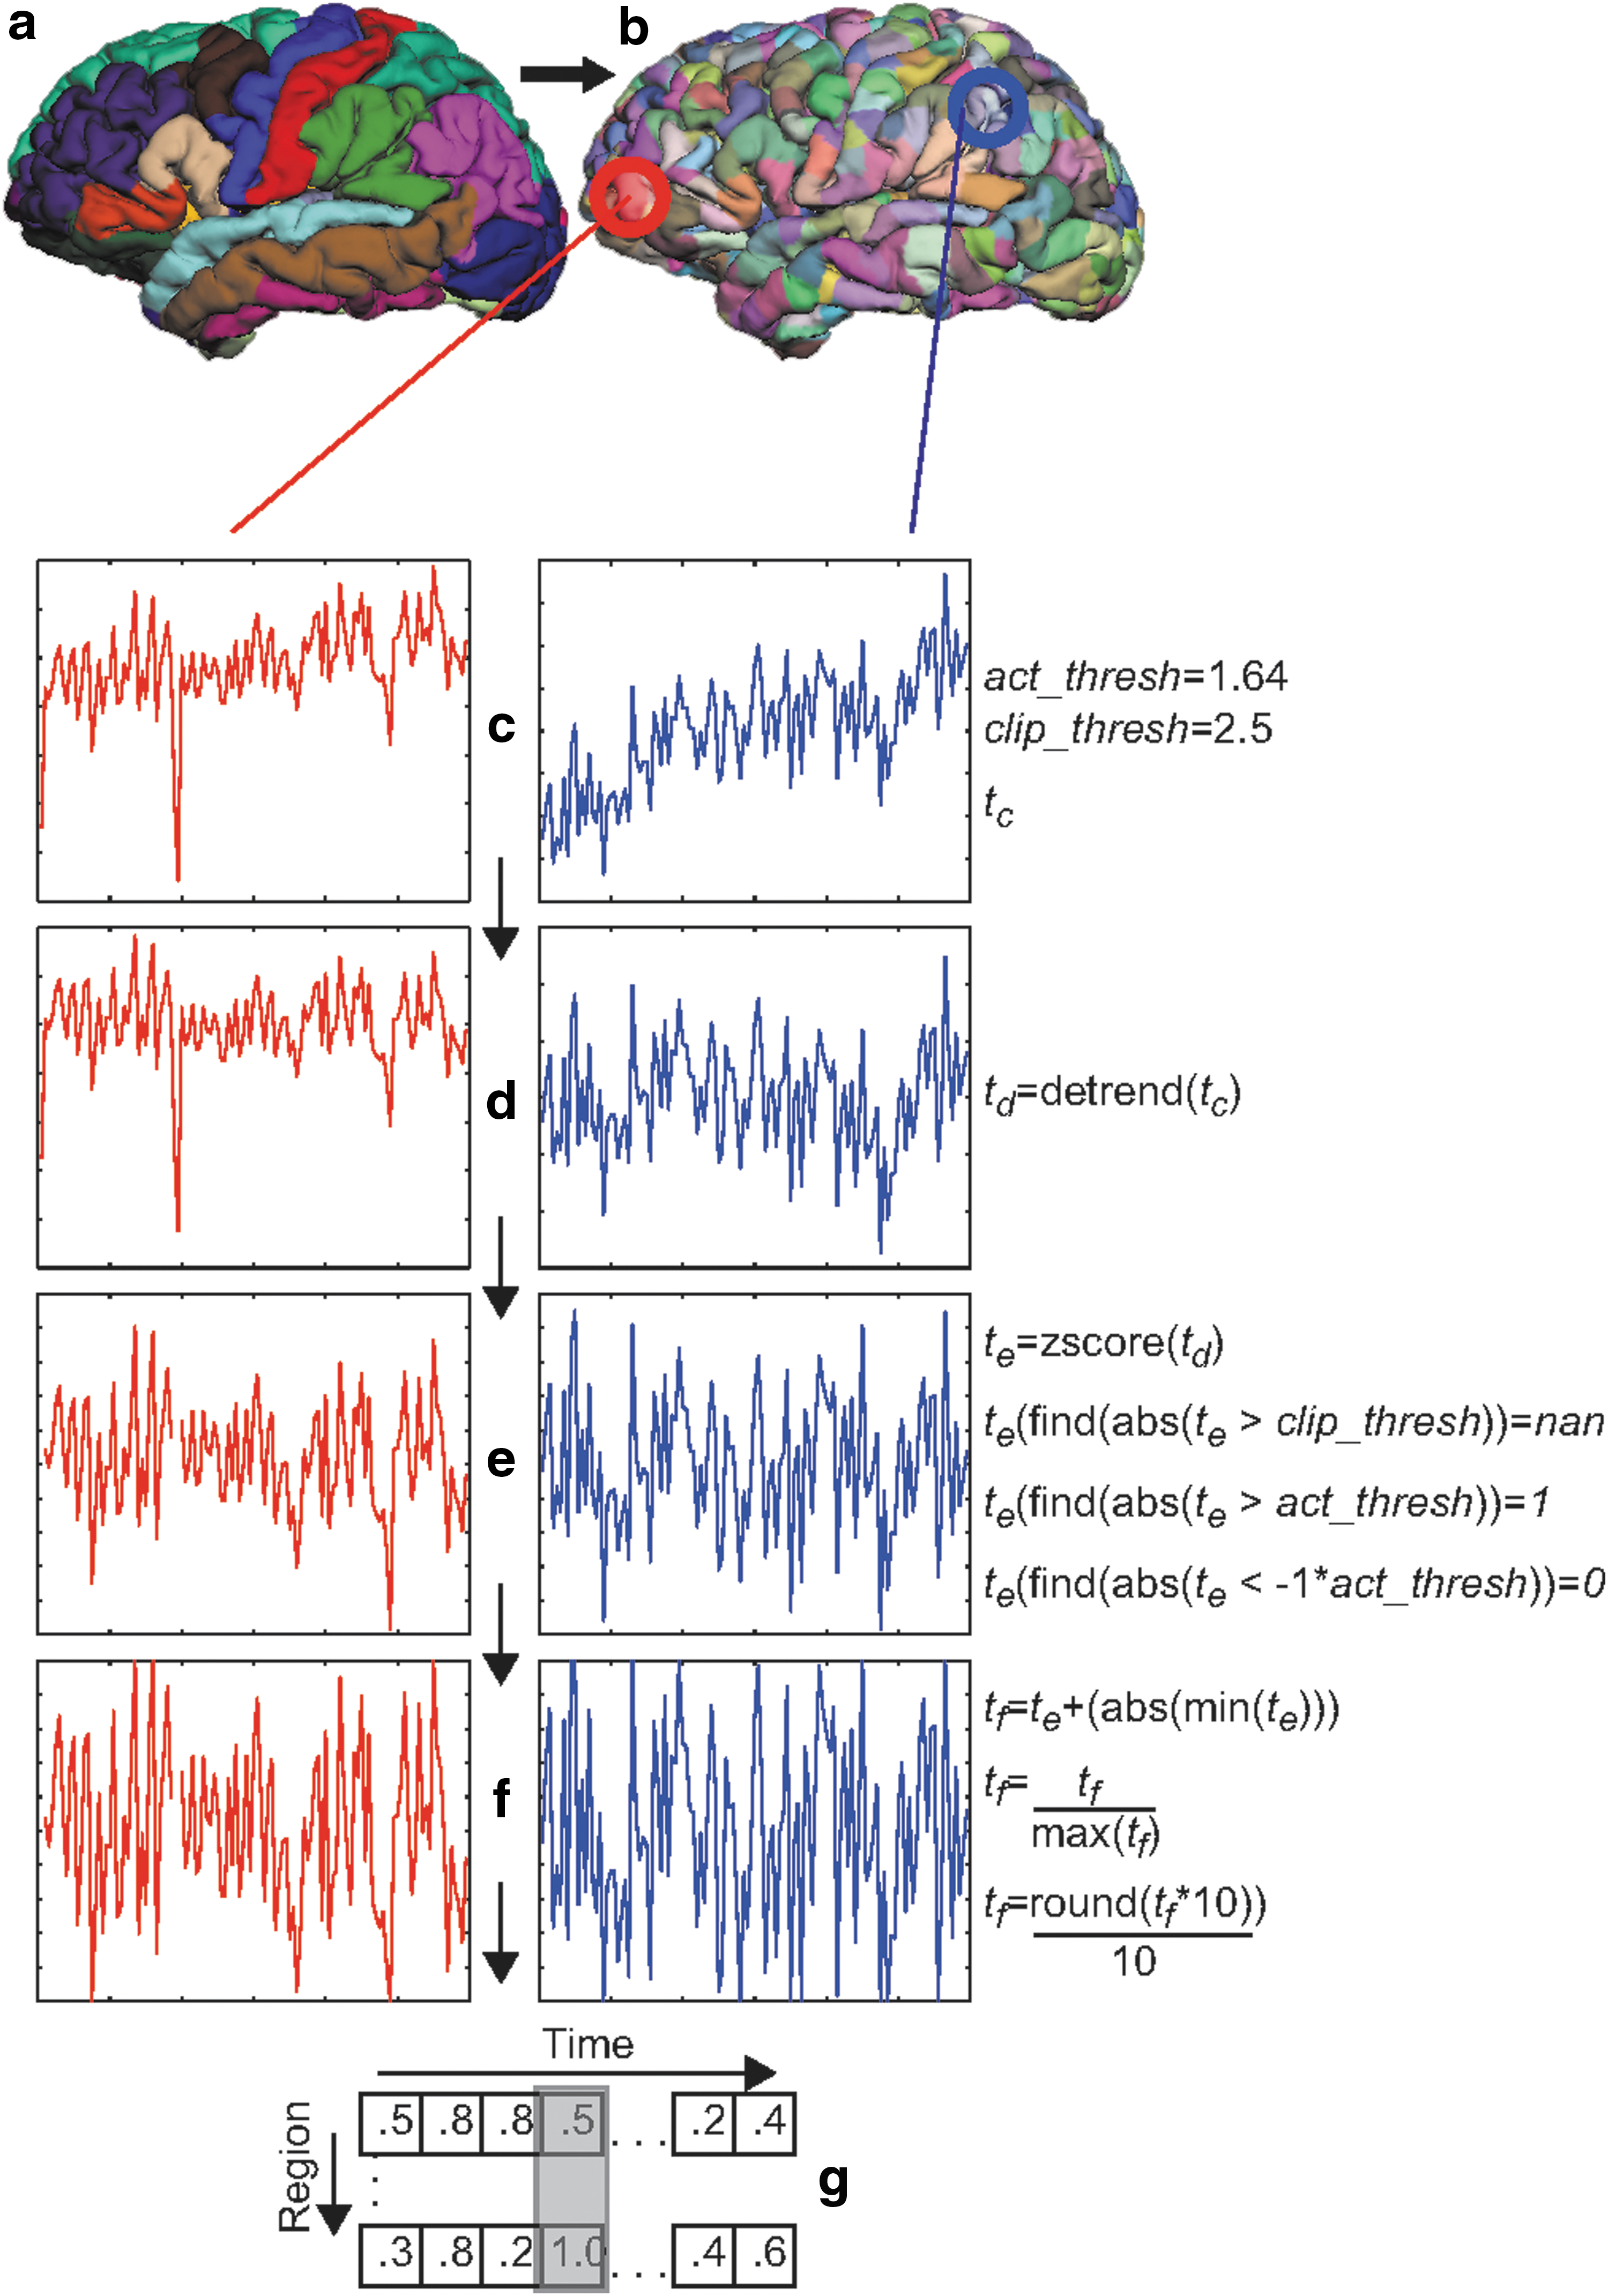
Structural and functional fMRI data processing workflow. Anatomical parcellations
Functional MRI preprocessing
Functional data were preprocessed using FSL 4.1 software (Jenkinson et al., 2012). Each participant's functional run was masked and co-registered to their cortical surface map. Functional data were slice-time corrected and motion corrected. Spatial smoothing was not applied. Each run was then detrended, to remove signal drift (Friman et al., 2004).
The mean time series for each of the 1000 ROIs were then extracted within each participant's native surface space and imported into MATLAB and passed through the SPM8 (
Connectionist network
We implemented a connectionist network using in-house software compiled on a 64-bit Linux operating system using MikeNet (
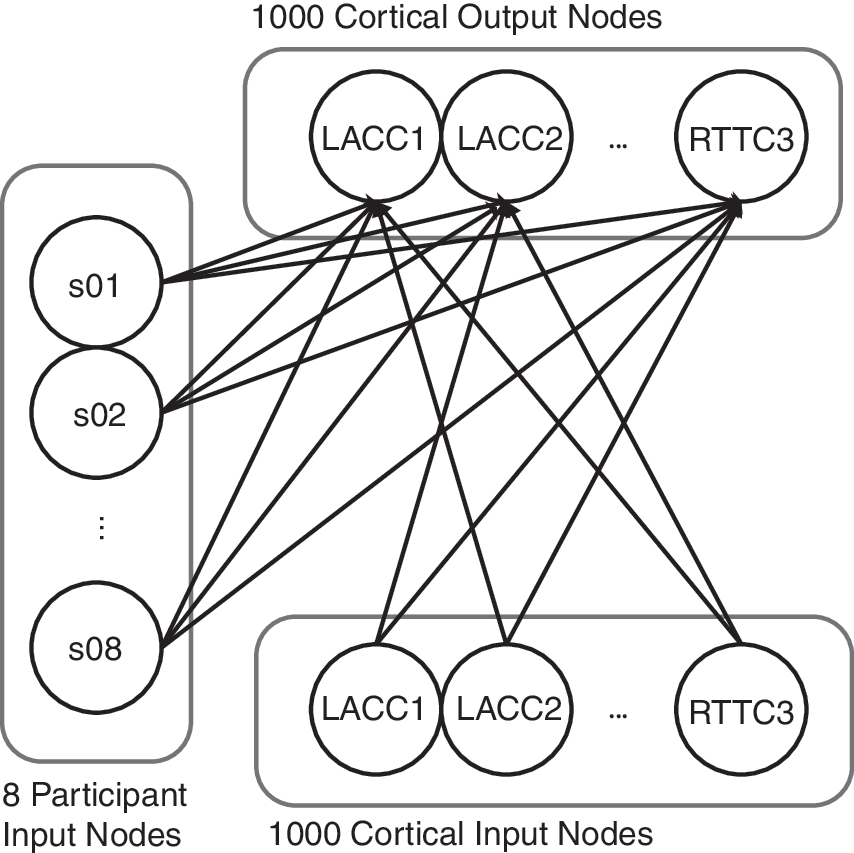
Connectionist network architecture. Each cortical input node has a forward connection to all but the corresponding cortical output node, forcing the model to estimate a node's output activity from patterns of activity within the rest of the network. Participant input nodes provide information about idiosyncratic activation trends for each node.
Training data
We created a set of training patterns from each participant's scaled time-series data as follows: To minimize any influences attributable to field inhomogeneity that commonly arises at the onset of an fMRI run, the first four time points, corresponding to the first 12 sec of each functional run, were omitted from the time series and thus neither used for training or testing the computational models. For each of the remaining 115 time points, we extracted a vector of scaled activation value, rounded to the nearest 0.1, for each of the 1000 ROIs. This level of precision was selected because it was the minimum precision required to discriminate among minimum (0.0), maximum (1.0), and average (0.5) activation, and there was no apparent advantage to using more precise values to represent values in between. These 115 vectors represented the pool of potential cortical input vectors for the model. The fractional values in the input vectors provide the network information about the activation state of each region at each time point, across a range of activation levels. Though any non-negative real number can be assigned to a network input value, the backpropagation through time training algorithm (Pearlmutter, 1995) assumes binary target activations (i.e., 1 or 0). Thus, though input vectors contained fractional values, output target vectors were restricted to binary values. We copied each cortical input vector to a cortical output target vector, setting all fractions to a special value (“NaN”, or “not a number”, also used to censor outlier values), that directed the simulator to ignore that output node for that trial only. For example, three input units with values {0.0, 0.5, 1.0} would have output targets of {0.0, NaN, 1.0} for that trial. Because the training algorithm does not adjust the weights connected to ignored nodes, we restricted the training set to time points where a relatively large proportion (at least 150 of 1000) cortical output nodes had target values to improve training efficiency. Between 24 and 37 vector pairs met this criterion for each participant. Because target values were not presented for nodes with nonbinary activations, and training examples had only time points for which at least 150 nodes had target values, nodes differed with respect to the number of times they had target activations in each training set, though each was trained between 30 and 93 times, with an average of about 63 training events for each node. A complete training pattern for a single time point comprised a cortical input vector, the corresponding cortical output pattern vector, and the subject input vector with one of eight nodes set to 1 and the remainder set to 0. We created nine training sets by concatenating the training patterns for each of the nine possible subsets of eight participants, each including between 243 and 258 patterns.
Network training paradigm
We ran nine simulations, following Cree and associates, (2006), which used this connectionist platform to investigate network connectivity within a large-scale (>2500 output unit) fully interconnected neural network. Because the present network was of a similar scale with respect to the number of nodes, connections, and layers, we thus followed the training parameters from that model. Each network was initialized with connection weights set to random values falling between±0.05, and trained each model on a different training set. Because each training set omitted the data from one participant, we were able to subsequently assess the network's ability to generalize to novel input. We trained the network using batch learning (Hinton, 1989), an initial learning rate of 0.01, which decreased as overall network error decreased, and a momentum of 0.9 (Pearlmutter, 1995). On each trial, we clamped input activation for two arbitrary time units (“ticks”), computed error at the cortical output layer on the third time tick. In batch learning, the error gradients, on which connection weight adjustments are based, are summed across the set of training examples presented in a single training epoch (i.e., one complete pass through the entire training set). These gradients are back propagated to update the connection weights once, after all input–output pairs have been presented. Each network was trained for 10,000 epochs, at which point the average (across all training patterns) summed error across output nodes was under 0.1 in all networks and the reduction in network error had effectively asymptoted. This corresponded to an average deviation of less than .007 from the target outputs.
Results
Connectivity analysis
We extracted a 1000×1000 matrix of weights from each cortical input unit to each cortical output unit from each of the nine trained networks, and averaged the matrices to create a composite connectivity network. For benchmarking purposes, we additionally calculated a matrix of cross-correlations between time courses, collapsed across all participants, which is a commonly used connectivity index in functional connectivity studies of rs-fMRI (Sporns et al., 2004). The sensitivity of connectionist networks to correlations is reflected by the significant correlation between network weights and time-series cross-correlations, r(998)=0.54, p<10−8.
Though there are multiple approaches for finding embedded network communities within neuroimaging data (e.g., PCA), a network modularity algorithm was most appropriate, given the nature of our connectivity data. Moreover, we note that similar approaches are commonly used to investigate how functional networks arise from patterns of brain connectivity (Fair et al., 2009; He et al., 2009; Meunier et al., 2009a, 2010). We applied the Louvain clustering algorithm (Blondel et al., 2008) to both connectionist weight and time course correlation matrices to uncover the embedded network communities. Though statistical thresholds are commonly applied to data-driven connectivity estimates (e.g., eliminating weights corresponding to nonsignificant correlations), as we explain in the Discussion section, it is not clear what should constitute a “significant weight” in our model. We thus retained all weights in both matrices to preserve parallelism between approaches. The matrices clustered similarly into four sub-networks (hereafter: communities, to differentiate these sub-networks from the overall cortical networks), though the three largest communities in each matrix collectively accounted for most of the cortical surface. Figure 3a and b show the connectivity matrices associated with the connectionist weight-based clustering and correlation-based clustering, respectively, and the spatial extents of the three largest communities. A closer examination of these cluster assignments found the connectionist-based and correlation-based approaches yielded identical cluster assignments for 852 of the 1000 regions. Because no connections were removed, the matrices retained a large degree of connectivity between regions characteristic of the default mode network (DMN) and the frontoparietal control network. This connectivity was sufficient for these regions to be clustered into the largest community in both the weight-based and correlation-based matrices. We also note that the communities detected using both approaches bear some similarity to the vascularization pathways of the middle cerebral artery (red) and anterior cerebral artery (green), which might suggest that these communities capture cerebrovascular correlations in the blood oxygen level-dependent (BOLD) data. Though the connectivity matrices produced by either method are likely influenced by factors other than those strictly associated with neural connectivity, it is unlikely that these communities are reducible to trivial spatial correlations for several reasons: First, the high-pass filter to which the data were subjected is commonly used in fMRI analyses to eliminate blood-flow artifacts. Second, ROIs were sharply delineated and sampled over a relatively large number of voxels that were not subjected to spatial smoothing. Thus, any spatial correlations existing between voxels along the perimeter of each ROI would have little impact on the correlations between the mean signals for adjacent regions. Third, at least for the connectionist approach, the activity of the node representing each ROI was determined by activity across the entire cortical surface. The weights from nearby nodes thus account for a small fraction of the input to each node in the connectionist network. Because the benchmark and our connectionist approaches are data-driven, spurious correlations contributing toward the topography of the detected communities are properties of the training data. Thus, our method may take advantage of measures taken to remove spurious correlations within the data.
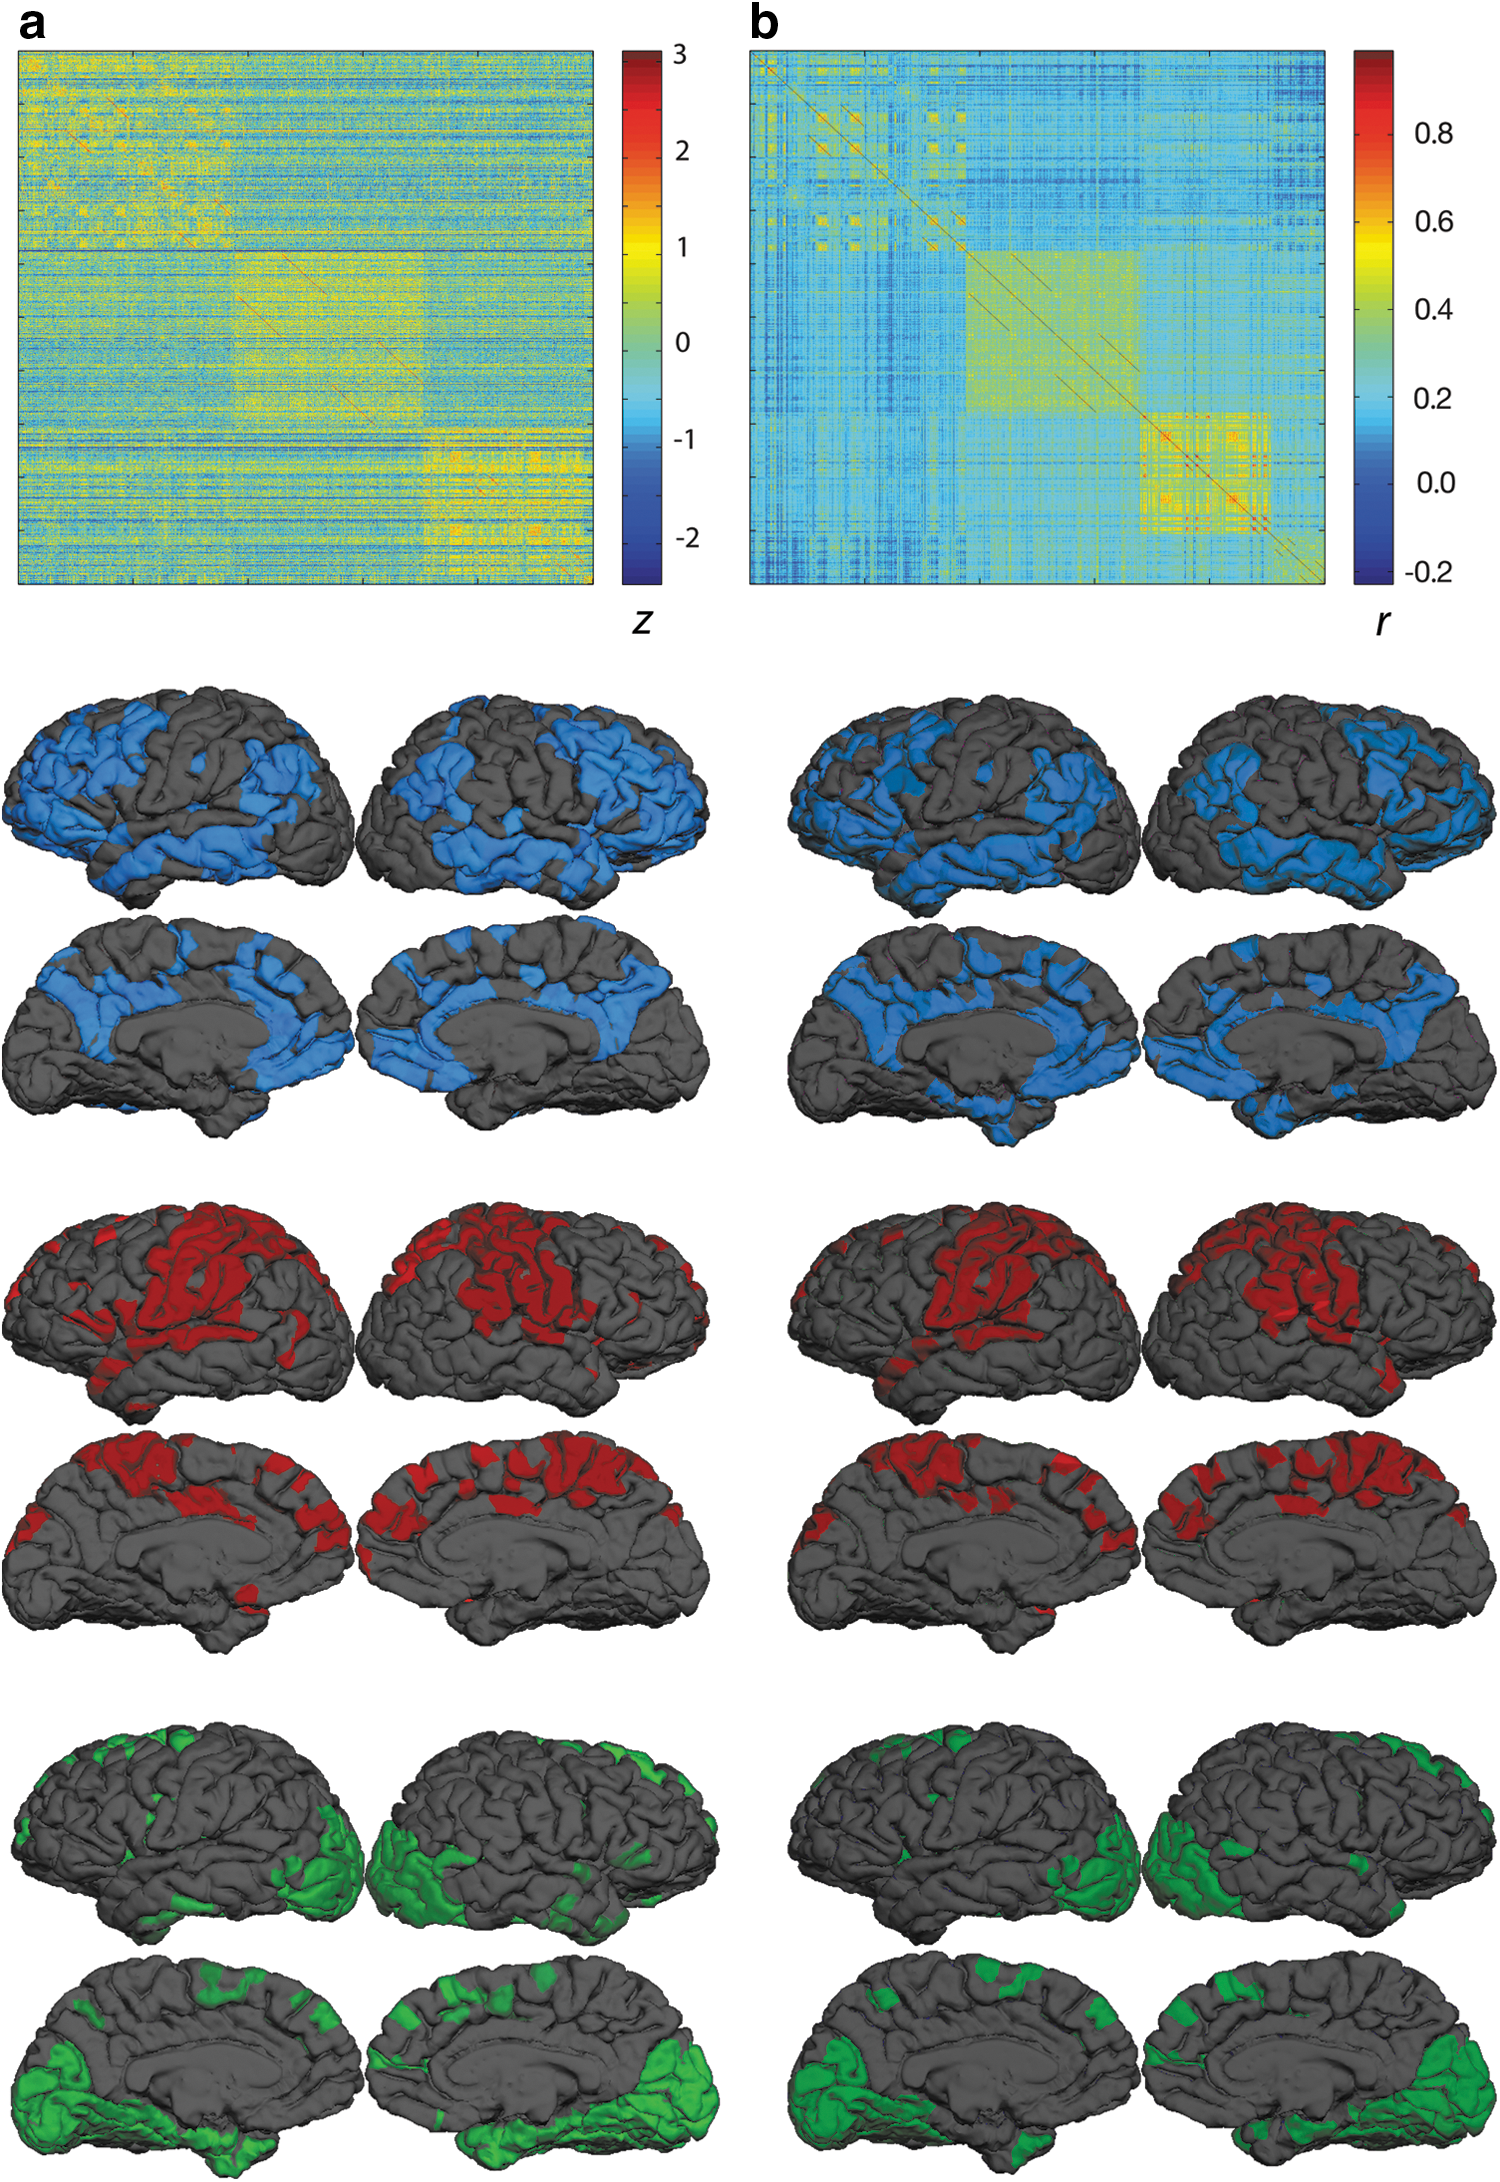
Connectionist weight-based and correlation-based connectivity analysis. The connectionist weight matrix
Many graph-theoretic metrics have been applied to brain connectivity networks (Sporns, 2002; Sporns et al., 2004) though these measures generally assume pruning of sub-threshold weights. Because all weights were retained, connectivity metrics such as degree (the number of nodes to which a node is connected) and path length (the number of connections required to travel between two nodes) were not meaningful; nodes were generally connected to every other node with a path length of 1 (though many of those connections may have had weights close to zero). Consequently, we propose connectivity in our model may be measured in terms of sums of weights for different types of connections that can accommodate asymmetric weights. Though our network was a feedforward network, and thus weights went only from the input to the output layer, one can think of corresponding input and output node pairs (i.e., the nodes in the input and output layers that encode the same anatomical location) as a single region. Thus, we can refer to a node's efferent connections (i.e., all outgoing weights connected to the node encoding regionr in the input layer) and its afferent connections (i.e., all incoming weights connected the node encoding regionr in the output layer). Potential network metrics might include efferent connectivity (sum of the absolute values of the outgoing connections to a region), afferent connectivity (sum of the absolute values of the incoming connections to a region), excitatory connectivity (sum of the positive outgoing connections from a region), and inhibitory connectivity (sum of negative outgoing connections from a region). These measures capture many of the properties of graph-theoretic metrics used in previous studies of causal networks. For example, out-degree, or the number of causal afferent connections from a node (Sridharan et al., 2008) is a special case of our afferent connectivity metric, wherein weights are thresholded and binarized before summation.
Finally, we assess the utility of the participant input nodes by examining the weights from these nodes to the cortical output nodes. Each participant has a corresponding input node in eight of the nine networks. We assumed that the network would take advantage of input from these units to minimize error during training. By representing the participant associated with a particular training trial, the network should learn to adjust the predicted output to account for between-subject differences in activation patterns. Figure 4A plots the weights between the participant input node associated with each participant and the cortical output nodes, averaged across the eight networks in which he or she appeared. Positive weights bias the output activations toward 1, and negative weights bias the output activations toward 0. A weight of zero indicates that the subject node had no influence on an output unit. Thus, if the subject input units were ineffectual, we would expect these weights to have mean values close to zero, and have little or no variance. Overall, the subject units had an inhibitory influence (M=−0.19, SD=0.24), and a considerable degree of variance between the subjects is readily apparent across different output nodes. For example, positive spikes in Figure 4A indicate cortical regions where a participant would tend to have higher than expected activations. For these regions, providing the network input about the subject's identity caused the network to increase the estimated activity for that region for that subject. In doing so, the network arrived at more accurate activation estimates for that subject in that region. Moreover, Figure 4A clearly shows that activations for one participant (Participant 9) were best estimated by inhibiting outputs across nearly all regions, suggesting that this participant had lower overall activation than the cohort. A hierarchical cluster analysis of the participant weight distributions was used to assess between-participant similarity in high-dimensional weight space. Using Ward's method, three clusters emerged (Fig. 4B), indicating that the subject weights accommodated three distinct activation profiles in the training data. Unfortunately, because the data set contained only basic demographic information about each participant (i.e., sex, age, and handedness), we could not further further explore factors that may have been related to these activation trends. Nonetheless, this analysis suggests a means by which individual or group differences might be investigated within our framework.
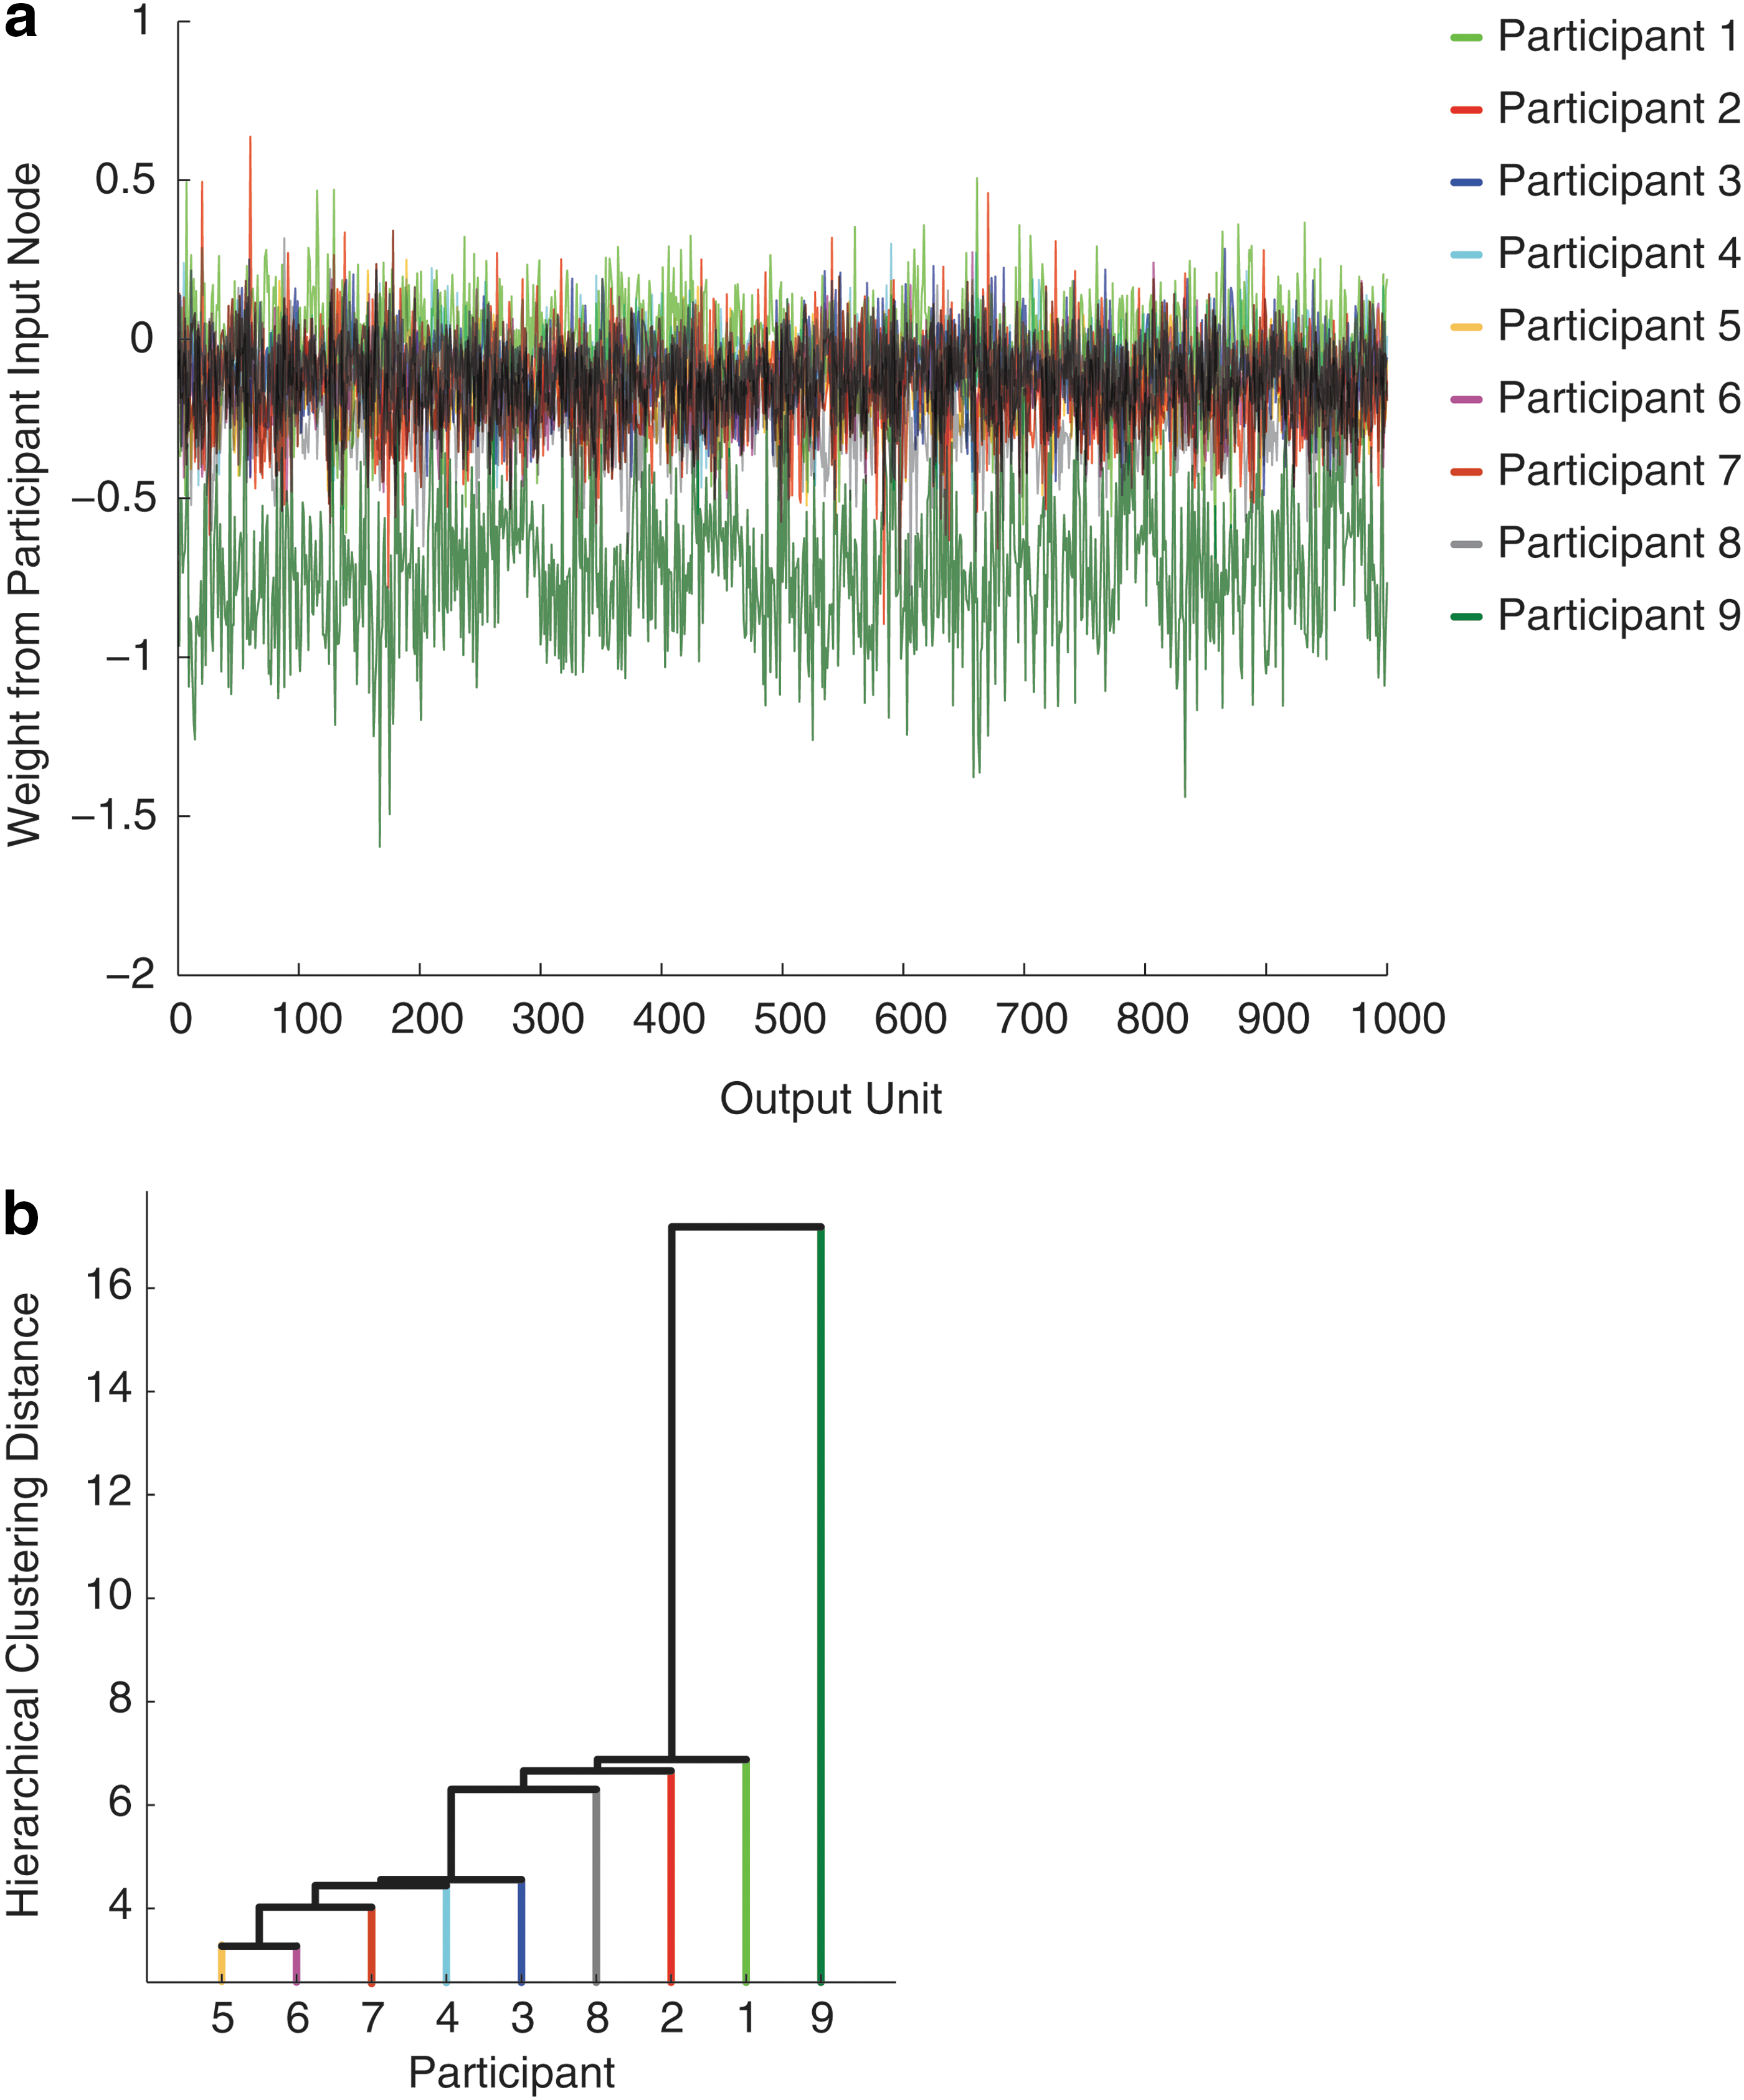
Participant input weight analyses.
fMRI simulation–model generalization
It is important that connectionist networks are able to generalize to novel data (McClelland et al., 2010), as this cross-validates the model and demonstrates that it has not merely memorized the training data. We carried out simulations within the nine trained models by presenting to each the cortical input vectors for all but the first four time points of the time series to which the network had not been exposed during training. We presented test input patterns for three time ticks, setting each participant input node activation to .125 (one-eighth) to represent an “average participant” for three time ticks. We compared the activation of each output node on the third time tick to that of the corresponding input, and calculated network error as the mean squared error across the 115 time points for every node in each network.
We averaged network error for each node across the nine networks (Fig. 5a). Note that the logistic activation function is biased toward generating values asymptotically close to 1 or 0, whereas each time series was normally distributed about 0.5, with relatively few values reaching 1 or 0, and the error calculation was thus conservatively biased toward generating larger error values. However, because node activations followed the same distribution, this bias was evenly applied across all nodes, permitting comparisons between regions. Despite the rather stringent error metric used, mean squared error ranged from 0.09 to 0.24 (M=0.14, SD=0.02) indicating that the networks were, on average, able to predict whether activity of each node would be above or below the mean signal in the worst case, and they were successful in estimating node activity, even for intermediate values (e.g., predicting an activation of 1.0 for a target activation of 0.7).
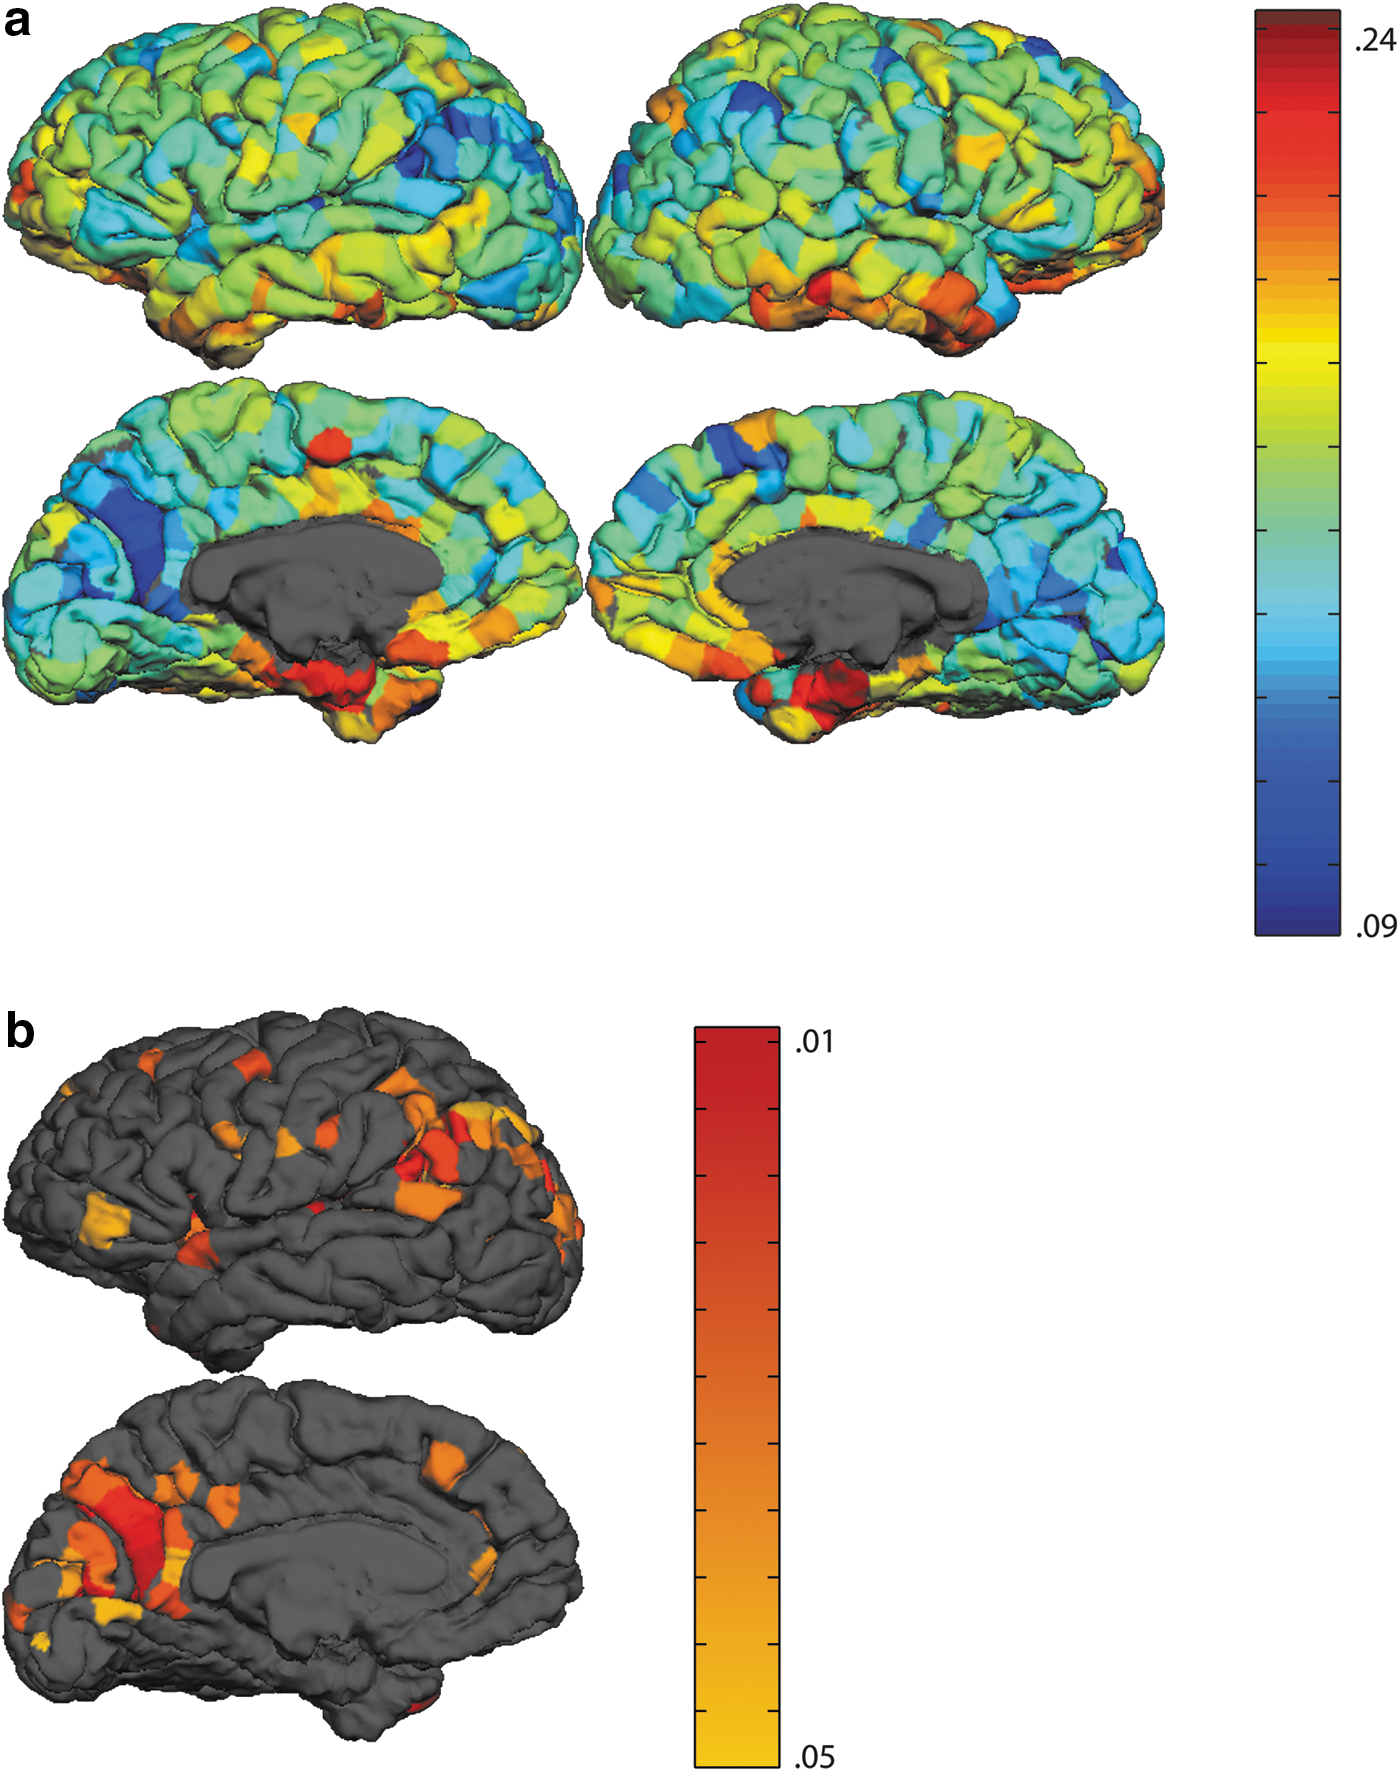
Simulated fMRI goodness of fit. Mean square error collapsed across all simulations between simulated and actual activation values for each node
Though the above analyses provide some indication of the accuracy with which our trained model can predict activity within a node, any evaluation of network performance is subjective without some measure of significance. We nonparametrically assessed network simulation performance through a set of Monte Carlo simulations as follows: we performed 1000 simulations for each network as described above, but randomly reassigned for each simulation the weights within the network to arrive at a random network with an identical weight distribution. Essentially, this analysis answers the question of whether the predicted activations for a given node are better following training than for a random network with an identical distribution of weights. Mean squared error for each node was calculated as above. We tallied the number of times that the error for a node within the intact network was lower than that within a randomized network, and summed these values across the nine networks. 81 left hemisphere nodes performed better than chance 95 times out of 100 (Fig. 5b), collapsed across all simulations. These nodes were predominantly concentrated in two clusters (left angular gyrus and left posterior cingulate cortex) associated with the frontoparietal control and the DMNs, respectively. We wish to emphasize that these simulations used novel data, and that we did not restrict our simulator accuracy calculations to any single cluster or subset of nodes. Thus, simulator accuracy in these regions was not an artifact of the clustering algorithm (the cluster to which each node was assigned was not a factor in the simulations), nor of properties of any particular training or testing set. Rather, these results show regions for which resting state activity was most predictable from the activity within the rest of the network.
We carried out a stepwise regression to determine which, if any, network metrics were significant predictors of simulator accuracy across the whole network. Mean signal to noise ratio (SNR) for each node was included as an additional predictor variable. As expected, SNR was a significant predictor of simulator accuracy (partial r=−0.42, p<10−8), indicating prediction accuracy was reduced for brain areas prone to scanner artifacts or low signal. Additionally, the sum of the weights from a node to nodes outside of its cluster (partial r=0.12, p<0.0003) and the sum of the absolute values of the outgoing connections from a node to other nodes within its cluster (afferent connectivity) (partial r=0.07, p<0.04), were significant predictors F(3,996)=77.41, p<10−8, and all three variables accounted for .187 of the simulation fit variance.
Discussion
The results demonstrate that a neurologically plausible computational model can be directly bootstrapped from neuroimaging data. Models derived in this way encode activation co-occurrence probabilities within these data, and thus can be used to investigate cortical connectivity and to simulate brain activity, directly bridging existing neuroimaging and connectionist approaches. Our method discovered embedded functional sub-networks within the cortical model and performed comparably to a conventional approach to identifying functional networks within rs-fMRI, but with several advantages over existing methods. First, asymmetric co-activation probabilities are captured by asymmetric weights, allowing the modeling of effective connectivity without necessitating any prior assumptions about the nodes or connectivity. Cross-correlations, in contrast, are always symmetric, and thus fail to capture asymmetric co-activations in the data. Though theory-driven methods, such as GCM, exist that model effective connectivity and therefore capture these asymmetries, they require a priori model selection. As indicated earlier, the pool of candidate models grows exponentially with model complexity (there are 2n potential models involving n nodes), making model selection an intractable problem for networks that are orders of magnitude smaller than ours.
Second, our approach operates on fMRI data passed through conventional processing pipelines, requiring no particular assumptions about the nature of the data. Innovations in acquiring and processing neuroimaging data for studying neural connectivity should be generally applicable to our approach. For example, Power and colleagues (2011) argued that subject motion may have a distance-dependent influence on correlations between measured activity between two regions. This could be addressed in a straightforward way by censoring (“scrubbing”) time points for which movement exceeded a certain threshold. Murphy and colleagues (2013) discuss many such confounds and the techniques that have been used to mitigate them, and we note that none are precluded by our approach. Relatedly, we point out that, though our training data was derived from continuous fMRI time series, the models were not trained on time-series data, in the strictest sense. Because the training set excluded time points for which fewer than 15% of the nodes had extreme values, and presented in randomized order those that were retained, it would be more accurate to say that the model was trained on individual time points. However, the similarity between the connectionist weight matrix and the cross-correlation matrix (which was derived from the intact time series) suggests not only that this detail is not relevant to training, but that our method is robust and can handle cases where only a fraction of the data is usable.
Third, our network architecture is modular in two senses: First, it supports arbitrary inputs (e.g., movement parameters or participants) and outputs (e.g., classifier nodes for conditions or participants). Input nodes encoding scan-to-scan movement might be used to account for spurious movement-related activations that might impact network connectivity (Power et al., 2012). MVPA identifies patterns of activity among neural units that distinguish between experimental conditions (Norman et al., 2006). The Princeton MVPA Toolbox (
Most importantly and uniquely, this approach permits the simulation of the BOLD response, given an input activation state as a function of connectivity within a data-driven model. This raises the prospect of modeling the consequences of disordered brain function, such as those arising developmentally or as a consequence of neurodegenerative disease or brain injury. As an illustrative example, cross-validation of our model provided novel insight into resting state networks, showing that activity within two large posterior clusters and a number of medial frontal regions was reliably predictable across subjects. Because they are not task-related, we assume that these activations are not driven by external conditions. Rather, because the predicted activations in these regions are inferred from activity in other brain regions, one interpretation of the cross-validation results is that these regions are primarily driven by endogenous brain activity. Resting state imaging places minimal cognitive demands on participants, and is consequently widely used in clinical settings, where it can serve as a biomarker for disease (Greicius, 2008). Thus, resting state activity in regions shown to have predictable states within a control group may be diagnostically useful in detecting disease-related neurological changes.
We also note that although the simulations presented here were applied to rs-fMRI data, nothing precludes its application to any fMRI experiment employing a blocked design. In an application of this approach to task-related fMRI, one important consideration might be the contributions of nontask-related regions. We independently normalize each time series because inter-regional differences in mean signal strength are attributable to uninteresting factors such as cerebral vascularization (Gati et al., 1997) or acquisition parameters. Indeed, for this reason, fMRI analyses are regularly presented in terms of percent signal change, effectively normalizing the data for each voxel independently. Because nontask-related regions are never truly “off,” normalizing activity from these regions may exaggerate noise within the network. This may be desirable, as these noise activations may represent sporadic activations of other networks (e.g., alternating between the task network and the DMN). However, if these activations are truly noise signals, they should be uncorrelated with activity elsewhere. Noisy regions should thus be unconnected from other communities. Consequently, the main disadvantage associated with retaining all regions is that noisy signals increase network error, which may thus lengthen training time required to reach a particular error threshold. Alternatively, a conventional ANOVA of the BOLD response might be used, retaining time series only for regions showing significant task-related variance, simultaneously reducing noise and simplifying the network.
We used a simple two-layer feedforward network, providing information only about activations from the current time point, which spanned a 3 sec acquisition period. It could thus be argued that not all connections describe effective (i.e., causal) relationships, though it is certain that our model contains information lost when asymmetrical co-occurrence probabilities are summarized by a symmetrical correlation. The back-propagation through time training algorithm we used supports networks of arbitrary depth, however, and permits prediction from both current and previous network states. This would allow the network to learn time-dependencies (Elman, 1990) and provide stronger evidence for causal relationships. Such an analysis should be possible within our framework, though not without modification, as the increased complexity of such a model would certainly introduce a number of challenges. For example, consecutive extreme activations should be less frequent, posing a problem for setting targets across time. Relatedly, because activations within the model unfold over discrete units of time, it raises the possibility that it may be used as part of a multimodal approach in which timing information from event-related potentials or magnetoencephalography constrains node activations.
Unsurprisingly, the model was sensitive to noise within the fMRI data. Although this is true of all neuroimaging techniques, we also note that our procedure can be made more robust to noisy inputs by more conservatively censoring the input data. We defined outlier activations as those more than 2.5 SDs from the mean, and these did not contribute to training. In addition to changing the outlier threshold, activations from regions below a certain SNR threshold could be similarly censored, allowing a data set to contribute to the model if it exhibits low SNR in some regions but otherwise passes other data quality checks. Because we were primarily interested in preserving parallelism between our approach and the benchmark correlation-based method, we used a stringent binarization threshold. This ensured that only fairly extreme values (i.e., >.95 and <.05) were mapped to 1 or 0, thus allowing the training data to accurately encode correlations within the training data, but at the expense of censoring a fairly large proportion of data. Though only this small fraction of data was required for training, a more liberal binarization would allow the network to train on a larger training set (but see our discussion of alternative methods of assessing simulation performance below).
One notable obstacle was the lack of a clear weight-elimination threshold because all weights contributed toward network performance. It was inappropriate to eliminate all weights below an arbitrary threshold, as the resulting network would have different performance characteristics. Indeed, eliminating connections in this manner is one way in which a neurodegenerative disease might be simulated in the trained model. Thus, reduction of network complexity must be done during training to allow the developing network to accommodate the pruning of connections. Possible approaches might include eliminating or decaying weights outside of an anatomical connectivity matrix (e.g., from diffusion tensor imaging) or involving topographically distant regions. Though these weight thresholding techniques are less straightforward than eliminating nonsignificant correlations, they do highlight another advantage of this approach. Because connectivity gradually emerges within the network, and can be experimentally constrained in different ways over the training period, this may provide important insight into how connectivity develops in the human brain.
A second obstacle concerned the best way to evaluate the network's simulation performance. The novelty of our approach precluded the application of any prior weight or error distribution, and thus required a nonparametric analysis. However, given the nature of the activation function and the nonbinary targets in the testing set, we used perhaps the most stringent of many alternative means of calculating network error. For example, machine learning problems such as those addressed using MVPA, make use of a winner-take-all classification rule (Heinzle et al., 2012), essentially producing binary outputs and targets. Our network could have been similarly evaluated by transforming target outputs in the testing set such that all targets above or below 0.5 were mapped to 1 or 0, respectively. Alternatively, we could have counted activations as correct if they were greater than 0.7 for targets above the mean and less than 0.3 for targets below the mean, as in Cree and associates (2006). We expect each of these alternatives would have produced somewhat different (and certainly less conservative) measures of simulator performance. However, because each of these approaches discards information, they are likely to be less sensitive measures, and thus less likely to highlight inter-regional differences. Because our networks correctly predicted above versus below mean activations on average for all nodes, many more regions would have performed better than chance using less stringent error metrics. Our particular choice of error metric was thus motivated by a desire for precision, at the expense of understating our model's predictive power. Thus, evaluating a computational model is not a straightforward matter, and the selection of appropriate performance metrics and statistical tests should take into account the particular goals of the application.
Limitations of the model
The lack of an unambiguous criterion for what constitutes a “significant weight” in the trained model is a challenge for brain researchers primarily interested in using this approach to derive connectivity matrices. For the reasons outlined above, we chose to retain all connections, and our model contained nearly one million weights, a large proportion of which likely permitted only minimal influence between any given pair of nodes. Moreover, as our networks were derived from rs-fMRI data, those derived from task-related activations may have different weight distributions. This suggests that there is no universal solution to the problem, which will thus require further investigation.
Also problematic for those primarily interested in the application of this approach to investigations of cortical connectivity is the stochastic nature of this method. That is, repeated application of conventional statistical methods (e.g., cross-correlations, multiple regression, etc.) to the same data will produce identical connectivity matrices. The initial weight space and the training sequence in our models, however, were determined pseudorandomly. Thus, two models trained on the same data are unlikely to be identical, even when trained to the same accuracy criterion. It may be helpful to think of these models, not as statistical descriptions of a particular data set (as in a correlation matrix calculated over these data), but rather as descriptions of composite individuals. That is, each connectivity matrix represents a hypothetical individual that is an amalgamation of multiple datasets. Thus, a more stable estimate of connectivity within a data set requires training several models and averaging over these connectivity matrices as we have done.
With these limitations in mind, our method might be inappropriate for investigations solely focused on obtaining a static description of functional or effective brain connectivity: Though our method is at least as effective at uncovering patterns of brain connectivity as existing methods, those methods will do so with much less computational effort. As we have demonstrated, an examination of the weight matrix within a trained neural network can yield valuable insight into brain connectivity. It is important to bear in mind, however, these networks are not primarily intended to provide a statistical measure of connectivity, but do so as a consequence of their sensitivity to correlations within training data. Rather, they provide a platform for modeling and testing complex systems. Within a computational model, one can directly test interdependencies and outcomes of connectivity within the system; for example, how removing one connection might strengthen another. Were one to remove a connection from a DCM graph or correlation matrix, one would gain no additional insight into how the remaining network might handle the loss. Analyses such as these are simply not possible using conventional methods of exploring brain connectivity. Thus, the strength of our connectionist approach is that it greatly facilitates the creation of neurologically plausible models of brain functionality, and within these models makes possible investigations of the causal role that connectivity plays in various cognitive processes.
Conclusion
In this article we presented a novel data-driven approach for constructing neurologically plausible computational models from conventionally-acquired and processed fMRI data. We demonstrated that, by learning activation co-occurrence probabilities within fMRI time series from a network of brain regions, our method discovers embedded network communities nearly identical to those discovered using current methods of assessing functional connectivity but additionally encodes information about effective connectivity. Unlike any current method, however, our approach produces models that gradually emerge with experience and permit simulations of neural activity within neurologically plausible computational models, the dynamics of which may be altered through virtual lesions. This approach thus has many important applications for brain research and may generate important insight into brain development and disordered functioning following damage or disease.
Footnotes
Acknowledgments
The authors wish to thank Jason Zevin, David Meunier, and Jérôme Prado for helpful feedback during the preparation of this article.
Author Disclosure Statement
No competing financial interests exist.