




Abstract
Social anxiety disorder–related alterations in basal ganglia regions, such as striatum and globus pallidus, though evident from metabolic imaging, remain to be explored using seed-based resting-state functional connectivity magnetic resonance imaging. Capitalizing on the enhanced sensitivity of a multichannel array coil, we collected high-resolution (2-mm isotropic) data from medication-naive patients and healthy control participants. Subcortical resting-state networks from structures including the striatum (caudate and putamen), globus pallidus, thalamus, amygdala, and periaqueductal gray were compared between the two groups. When compared with controls, the caudate seed revealed significantly higher functional connectivity (hyper-connectivity) in the patient group in medial frontal, prefrontal (anterior and dorsolateral), orbito-frontal, and anterior cingulate cortices, which are regions that are typically associated with emotional processing. In addition, with the putamen seed, the patient data exhibited increased connectivity in the fronto-parietal regions (executive control network) and subgenual cingulate (affective network). The globus pallidus seed showed significant increases in connectivity in the patient group, primarily in the precuneus, which is part of the default mode network. Significant hyper-connectivity in the precuneus, interior temporal, and parahippocampal cortices was also observed with the thalamus seed in the patient population, when compared with controls. With amygdala as seed region, between-group differences were primarily in supplementary motor area, inferior temporal gyrus, secondary visual cortex, angular gyrus, and cingulate gyrus. Seed from periaqueductal gray resulted in hyper-connectivity in the patient group, when compared with controls, in dorsolateral prefrontal cortex, precuneus, middle temporal gyrus, and inferior parietal lobule. In all the subcortical regions examined in this study, the control group did not have any significant enhancements in functional connectivity when compared with the patient group.
Introduction
Social anxiety disorder (SAD), also known as social phobia, is characterized by a fear of negative evaluation and scrutiny by others (American Psychiatric Association, 2000) and is one of the most common psychiatric disorders with a lifetime prevalence rate of 6.8% (Kessler et al., 2005). However, despite its high occurrence rate and associated social and economic burden, the neurobiology of the disorder remains poorly understood. In recent years, there has been increased interest in elucidating the pathophysiology and neuronal mechanisms underlying SAD, particularly through the use of resting-state functional connectivity magnetic resonance imaging (fcMRI) (Biswal et al., 1995). Of the existing fcMRI studies that involve SAD populations, a few studies (Ding et al., 2011; Liao et al., 2010a, 2010b, 2011; Qiu et al., 2011) used identical acquisition parameters including low-resolution (3.75×3.75×5 mm3) voxels. Of the remaining studies, one had very limited coil sensitivity to detect blood oxygenation level–dependent (BOLD) signal from subcortical regions (Pannekoek et al., 2012), and two had limited head coverage and/or low resolution (Hahn et al., 2011; Prater et al., 2013). Since physiological noise, a major confound in fcMRI, dominates at low resolution (Triantafyllou et al., 2005), high-resolution imaging is desirable in this context. BOLD contrast-to-noise ratio (CNR) benefits directly from time-series signal-to-noise ratio (tSNR) gains, and our previous work has demonstrated that the higher sensitivity offered by multichannel arrays, such as 32-Channel (32Ch) coil, would translate to improved detection of resting-state networks in healthy adults (Anteraper et al., 2013).
None of the seed-based fcMRI studies published to-date in SAD populations have examined resting-state networks with seeds in basal ganglia regions, such as the striatum and globus pallidus. It may be important to use fcMRI to probe BOLD signal that originates from these regions, especially considering that a recent functional MRI (fMRI) meta-analysis confirmed the link between the basal ganglia and emotion (Arsalidou et al., 2013) in healthy controls (HCs) and highlighted the involvement of the striatum and globus pallidus in processing emotion. More recently, task-based fMRI studies have associated atypical striatal activation to anxiety (Perez-Edgar et al., 2013). Additionally, the globus pallidus has been linked to anxiety disorders based on lesion studies (Lauterbach et al., 1994) and emotional processing (Lorberbaum et al., 2004) based on reports from positron emission tomography (PET). Further, PET studies have reported cerebral blood flow (CBF) changes, specific to the striatum, during anticipatory anxiety to electrical shock (Hasler et al., 2007).
Most of the published resting-state fcMRI studies on SAD have investigated alterations in the default mode network (DMN). However, specific regions of thalamus although considered to be part of the DMN (Zhang and Raichle, 2010) are yet to be fully evaluated in the context of seed-based fcMRI evaluations. Of these subcortical regions, anterior nucleus of thalamus is considered to be one of the principal contributors to a well-accepted collection of pathways associated with emotion processing, the disruption of which could manifest as alterations in the DMN (Jones et al., 2011). Another focus of seed selection for earlier studies has been the amygdala, an area that has previously shown disorder-specific hyperactivity in SAD populations (Phan et al., 2006). The amygdala has distinct subdivisions (laterobasal amygdala, centromedial amygdale, and superficial amygdala) and therefore representative connectivity patterns are revealed by fMRI (Roy et al., 2009). Nonetheless, this region is typically treated as functionally homogenous when it comes to seed-based selection. Previous studies in generalized anxiety disorder have flagged centromedial amygdala with increased gray matter volumes (Etkin et al., 2009). Further, of the amygdalar subdivisions, only centromedial amygdala receives input specifically from mid-brain regions, such as periaqueductal gray [as reviewed in (Davis, 1997)]. The latter region with its reciprocal connections with centromedial amygdala facilitates emotion processing (Wager et al., 2009) and is yet another region that remains to be investigated with seed-based fcMRI in SAD.
Based on the above, our hypothesis was that resting-state functional connectivity abnormalities are possible in the basal ganglia, thalamus, amygdala, and periaqueductal gray in SAD populations. Detecting such alterations may be potentiated by technological improvements offered by parallel array coils (e.g., 32Ch head coil) that boost the tSNR in fMRI, especially in the high-resolution domain (Triantafyllou et al., 2011). To this end, we explored resting-state networks in a medication-naive SAD population when compared with HCs in subcortical brain regions associated with emotional processing.
Materials and Methods
Subjects
Seventeen medication-naive SAD patients (24.7±6.3 years, eight men, all right-handed) and 17 age, gender, and handedness-matched HCs (25±7.5 years) participated in the study. The mean Liebowitz Social Anxiety Scale (LSAS) (Liebowitz, 1987) score for the SAD group was 77.9±14.1. Four patients had co-morbid depression and four had a co-morbid anxiety disorder. Written informed consent was obtained from all participants for an experimental protocol approved by the MIT institutional review board.
SAD patients were recruited from a local anxiety treatment center and through advertisements in the community. To be eligible, SAD patients needed to have a DSM-IV diagnosis of SAD, generalized subtype, and a total LSAS score of ≥60. Additionally, patients were excluded for the following reasons: current suicidal or homicidal ideation, history of (or current) psychosis, or current diagnosis of alcohol or substance dependence (excluding nicotine). None of the patients were receiving pharmacotherapy or psychotherapy at the time of the study. HCs were recruited from the general community by advertisement and were screened for current and lifetime psychopathology using the Structured Clinical Interview for DSM-IV Axis I Disorders (SCID) (First et al., 1995). To be eligible, they must have had no current or lifetime diagnosis of a psychiatric illness.
Data acquisition
Data acquisition was performed on a Siemens 3T scanner, MAGNETOM Trio, a Tim System (Siemens AG, Healthcare Sector, Erlangen, Germany), using a commercially available radio frequency (RF) receive-only 32Ch brain array head coil (Siemens AG, Healthcare Sector). The body coil was used for RF transmission. Extra padding with foam cushions was used for head immobilization. During the task, all subjects were asked to relax in the scanner with their eyes open and fixate on a cross hair, displayed centrally on the screen.
Single-shot gradient echo planar imaging (EPI) was used to acquire whole-head data, prescribed along anterior commissure–posterior commissure (AC-PC) plane with A>P phase encode direction. The scan duration was 6 min and 24 sec (62 time points, two “dummy” scans). The scan parameters used for TR/TE/flip angle/voxel size were 6000 ms/30 ms/90°/2×2×2 mm3. The TR was chosen to be 6 sec in this study in order to do whole-brain coverage at high resolution of 2-mm isotropic voxel size with 67 slices. Image reconstruction was carried out using the vendor-provided Sum-of-Squares algorithm. In addition, high-resolution structural scan was acquired using 3D MP-RAGE (magnetization-prepared rapid-acquisition gradient-echo) sequence. The scan parameters used for TR/TE/TI/flip angle/voxel size were 2530 ms/3.39 ms/1100 ms/7°/1.3×1×1.3 mm3.
Data analysis
SPM8 (Friston, 2007) was employed for preprocessing the resting-state fMRI time-series and structural scans. The steps on EPI data included motion correction and slice-time correction, normalization with respect to the EPI template (sampling size was matched to the native [two-isotropic] resolution) provided by SPM, and 3-mm Gaussian smoothing. Structural scan was normalized with respect to SPM's T1 template. Finally, image segmentation (Ashburner and Friston, 2005) was carried out on the T1-weighted images to yield gray matter, white matter (WM), and CSF masks in normalized space.
First-level connectivity analyses
Functional connectivity analysis was performed using MATLAB-based (MathWorks, Natick, MA) custom software package CONN (Whitfield-Gabrieli and Nieto Castanon, 2012). Sources for seed-based analysis were defined as multiple seeds corresponding to the predefined seed regions for (1) striatum (caudate, and L and R putamen), (2) globus pallidus (medial and lateral for internal and external segments, respectively), (3) thalamus, (4) centromedial amygdala, and (5) periaqueductal gray. All seeds were independent of our data and were generated using WFU_PickAtlas (Maldjian et al., 2003, 2004). Seed for thalamus (0, −12, 9) was chosen to be 10-mm spheres centered on previously published foci (Zhang and Raichle, 2010). Centromedial amygdala was chosen from SPM Anatomy toolbox (Eickhoff et al., 2005). Seed for periaqueductal gray was chosen to be 5-mm sphere centered on (1, −29, −11), based upon previous review (Linnman et al., 2012). Mid-brain sources (seeds) are depicted in Figure 1. The signals (time-series) from all the different sources were included as regions of interest in one regression analysis.
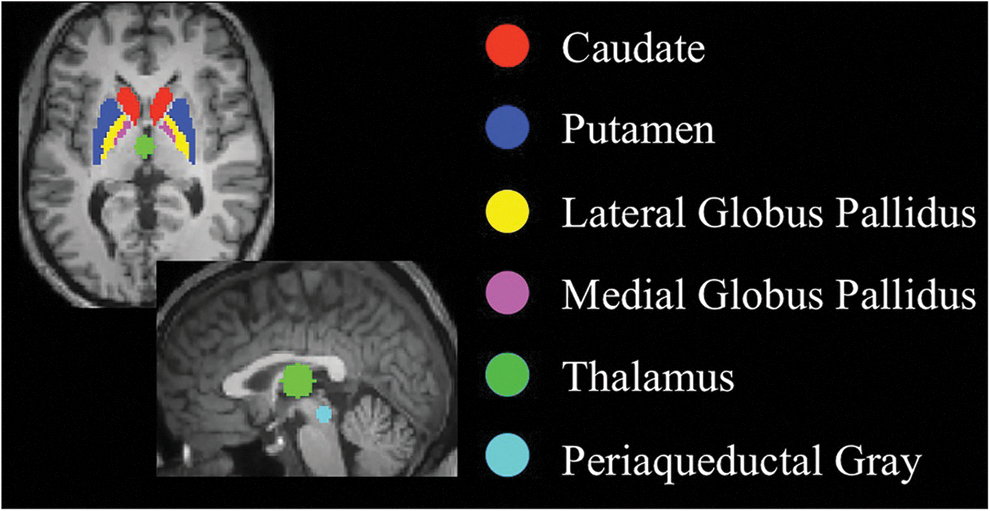
Mid-brain regions of interest that were chosen as sources to detect subcortical resting-state networks.
Seed time-series were band-pass filtered (0.008<f<0.09 Hz) and non-neuronal contributions from WM and CSF were considered as noise, the principal components of which were estimated and removed using anatomical-component-based noise correction method (aCompCor) (Behzadi et al., 2007). The optimal configuration of the aCompCor approach as applied in the CONN toolbox was followed (Chai et al., 2012). In-house custom software (
Correlation maps were produced by extracting the residual BOLD time-course from the sources, followed by generating Pearson's correlation coefficients between the source time-course and the time-courses of all other voxels in the brain. Correlation coefficients were converted to normally distributed scores using Fisher's r-to-z transform in order to carry out second-level General Linear Model analyses. Images from the first-level results (correlation maps and z-maps) provided the seed-to-voxel connectivity maps for each selected source for each subject and for each rest condition (one per subject/rest condition/source combination).
Second-level connectivity analyses
Within- and between-group analysis of data sets from the SAD and HC groups was performed as second-level analyses. For within-group comparisons, whole-brain false discovery rate (FDR)–corrected threshold of p<0.05 (pFDR-corr <0.05) was used to identify areas of significant functional connectivity. For between-group comparisons, statistical analysis was performed using a cluster-defining voxel-wise height threshold of p<0.05 (uncorrected), and only the clusters with an extent threshold of whole-brain family-wise error (FWE)–corrected p<0.05 (pFWE-corr <0.05) were reported as statistically significant.
Finally, as an exploratory analysis, we investigated the relationship between LSAS score and the connectivity measures from all the seeds that were explored in this study.
Results
Within-group results for the SAD and HC groups, with the caudate as the seed region, are shown in Figure 2A. Positive correlations in the medial frontal gyrus (MFG), the dorsal anterior cingulate cortex (ACC) extending to the subgenual cortex, and the orbito-frontal cortex (OFC) were enhanced in the SAD group. Between-group comparisons revealed significant hyper-connectivity (Fig. 2B), specifically in the MFG, including the superior frontal gyrus (BA 8), the dorsolateral prefrontal cortex (DLPFC) (BA 9), the middle frontal gyrus (BA 10), the orbital gyrus (BA 11), the subcallosal gyrus (BA 25), the ACC (BA 32), and the left temporal cortex [specifically, middle temporal gyrus (MTG) (BA 21) and inferior temporal gyrus (ITG) (BA 20)].
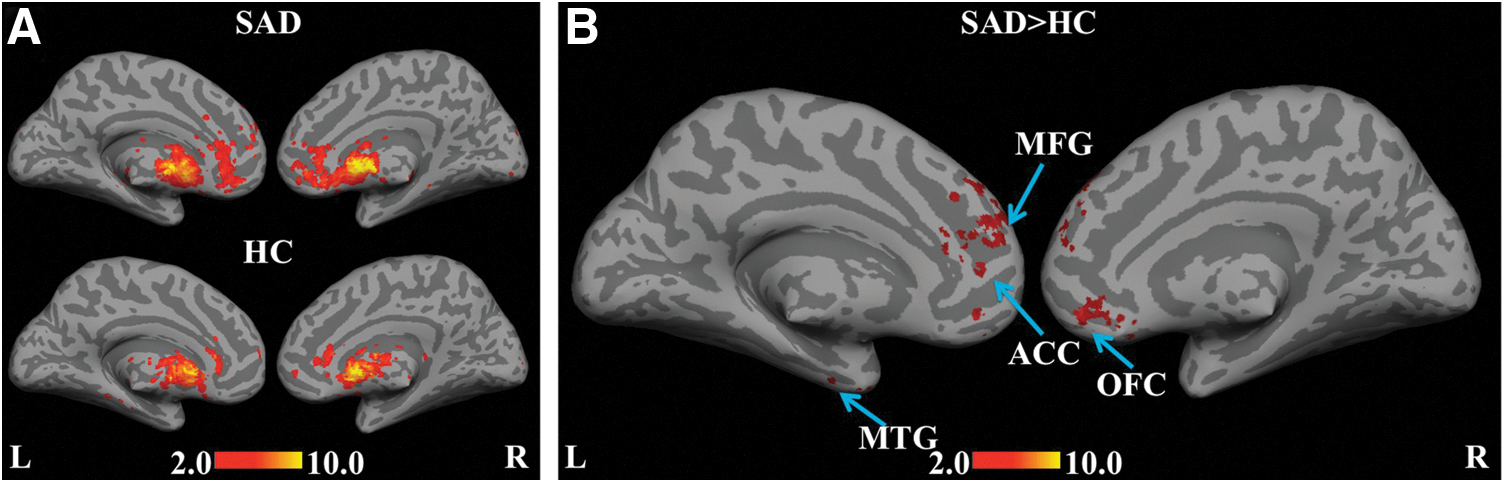
Statistical functional connectivity maps for the caudate seed (second-level analysis, n=17 per group). Within-group height threshold is whole-brain pFDR-corr
<0.05
Similarly, for the L and R putamen seeds (Fig. 3A), within-group comparisons revealed positive correlations in the fronto-parietal regions within the SAD group. In addition, connectivity with ITG and the parahippocampal gyrus (PHG) was absent within the control group (Fig. 3B). Connectivity was significantly enhanced in the SAD>HC comparison (Fig. 3C) in the bilateral supramarginal gyrus (BA 40), the rectal gyrus (BA 11), the premotor cortex (BA 6), and the ventral/subgenual ACC (BA 24/25), indicating interruptions in striatal function.
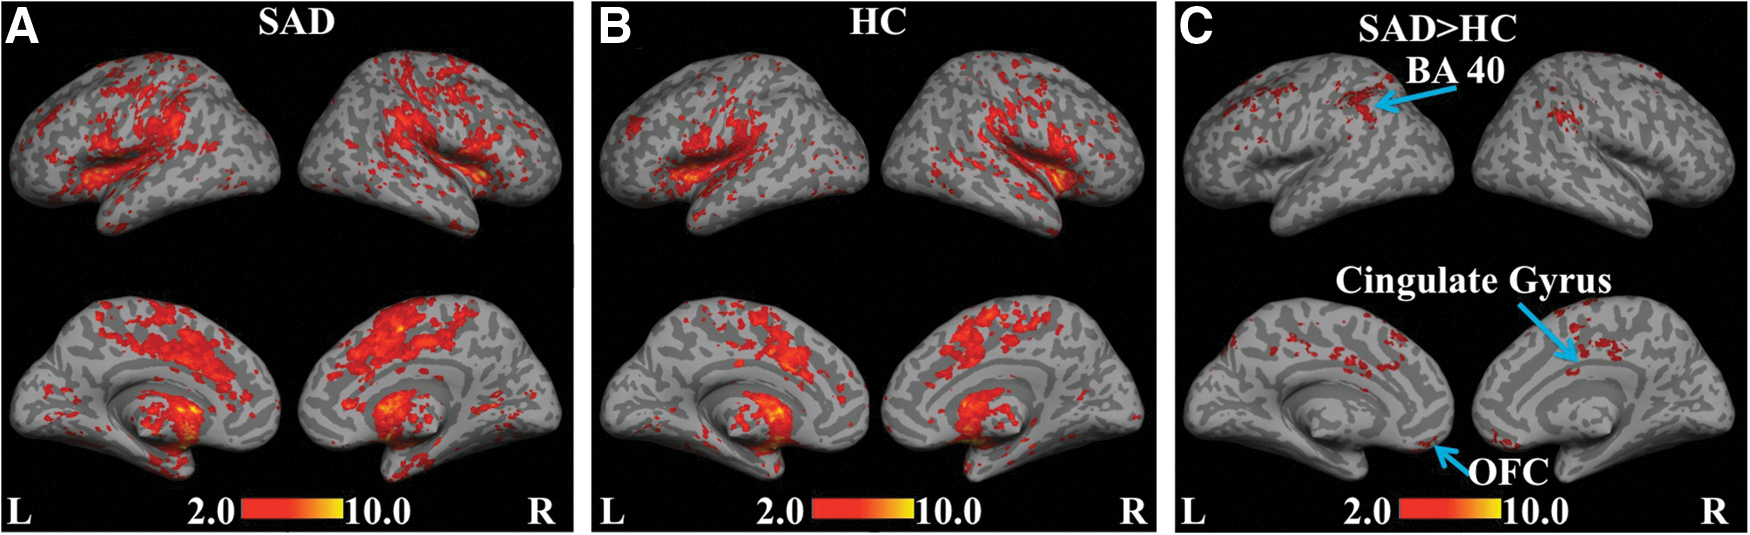
Statistical functional connectivity maps for the L and R putamen seeds (second-level analysis, n=17 per group). Within-group height threshold is whole-brain pFDR-corr
<0.05
A network of regions consisting of the MFG, DLPFC, ACC, and temporopolar area (BA 38) was revealed in the SAD group when the globus pallidus was used as a seed (Fig. 4A). For the SAD>HC contrast (Fig. 4B), statistically significant hyper-connectivity was observed in the precuneus (BA 31), signifying the possible role of mid-brain regions as contributors to the DMN.
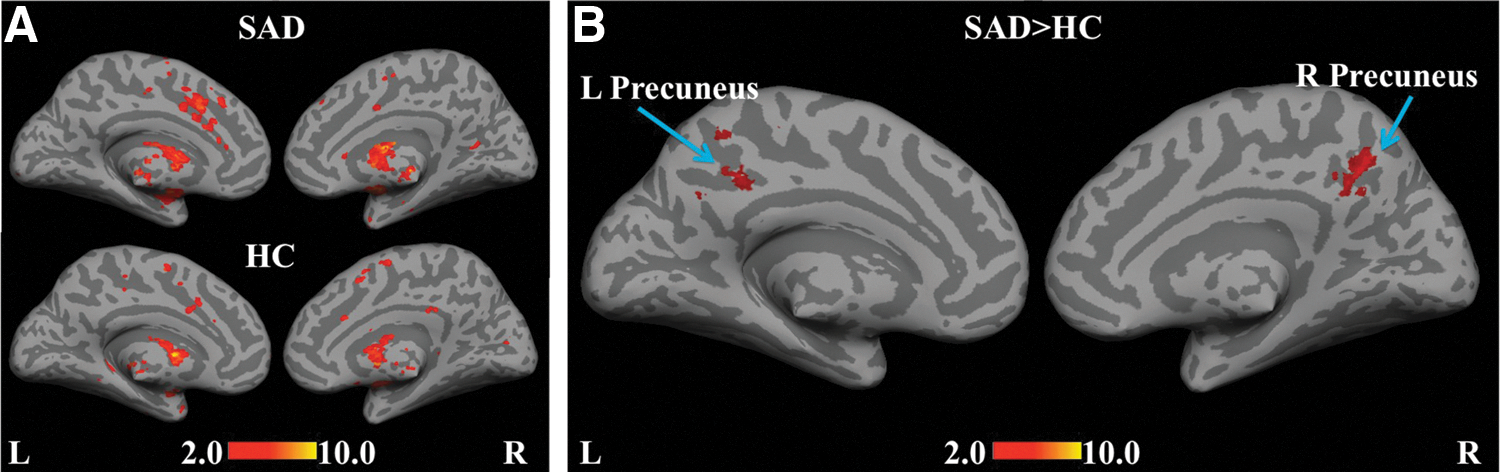
Statistical functional connectivity maps for the internal and external segments of globus pallidus (second-level analysis, n=17 per group). Within-group height threshold is whole-brain pFDR-corr
<0.05
Figure 5A shows group-level results for the thalamus seed for the SAD and HC groups. Similar to the previously mentioned seed regions, positive correlations in the posterior cingulate cortex, and BAs 6, 7, 9, 10, 13, 24, 32, and 40 were revealed in the SAD group. Connectivity with primary, secondary, and associative visual cortices (BAs 17, 18, and 19, respectively) was present only within the SAD group. Parts of the DMN, such as the precuneus, bilateral ITG extending to the left and right PHG, and parts of the fronto-parietal network involving superior parietal and anterior prefrontal regions, were significantly pronounced for the SAD>HC comparison (Fig. 5B). This finding emphasizes the role of the thalamo-cortical connectivity in SAD.
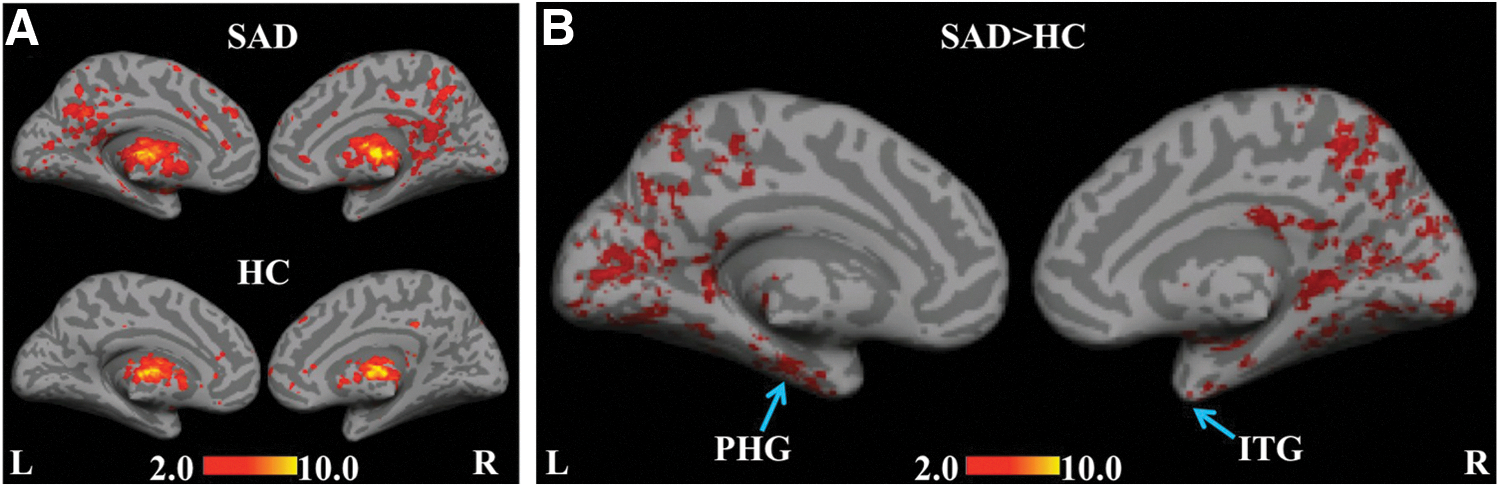
Statistical functional connectivity maps for the thalamus seed (second-level analysis, n=17 per group). Within-group height threshold is whole-brain pFDR-corr
<0.05
Figure 6 shows the functional connectivity correlations maps generated at the second level for the centromedial amygdala as seed region. Statistically significant between-group differences were reveled as hyper-connectivity in the supplementary motor area, ITG, secondary visual cortex, angular gyrus, and cingulate gyrus.
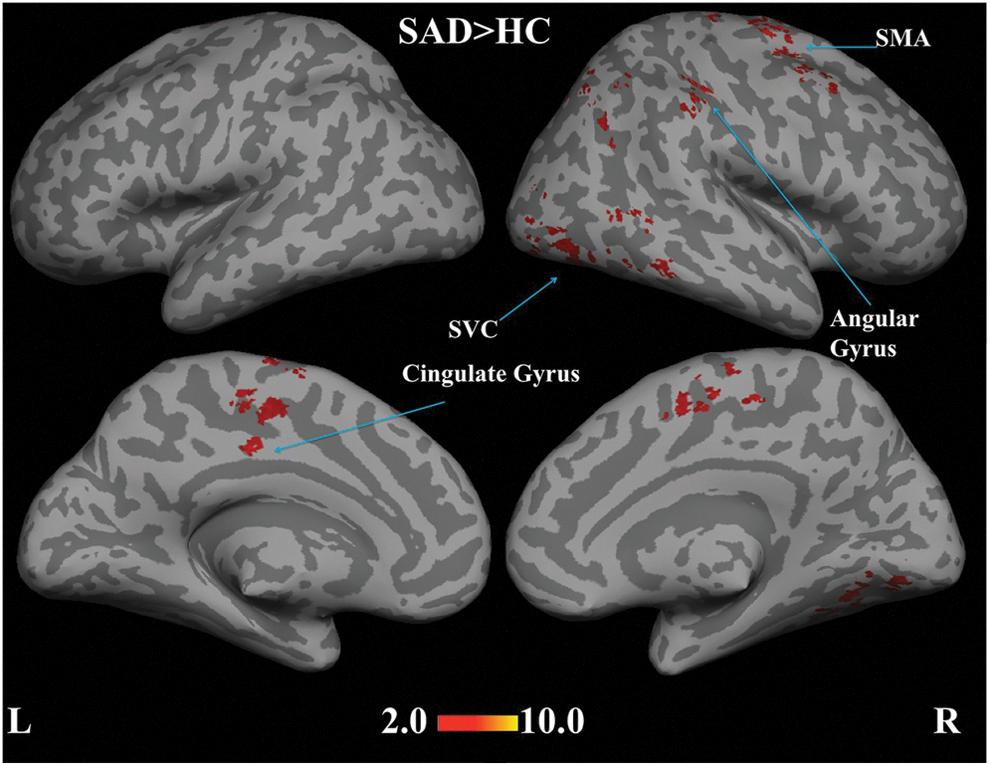
Statistical functional connectivity maps for the centromedial amygdala seed (second-level analysis, n=17 per group). SAD>HC reveals hyper-connectivity in supplementary motor area (SMA), ITG, secondary visual cortex (SVC), angular gyrus, and cingulate gyrus (blue arrows). Height threshold is p<0.05, cluster-level pFWE-cor <0.05. No brain regions were significantly different in the reverse contrast (HC>SAD).
With the periaqueductal gray as seed region, hyper-connectivity in the SAD group was revealed in dorsolateral prefrontal cortex, precuneus, MTG, and inferior parietal lobule (Fig. 7).
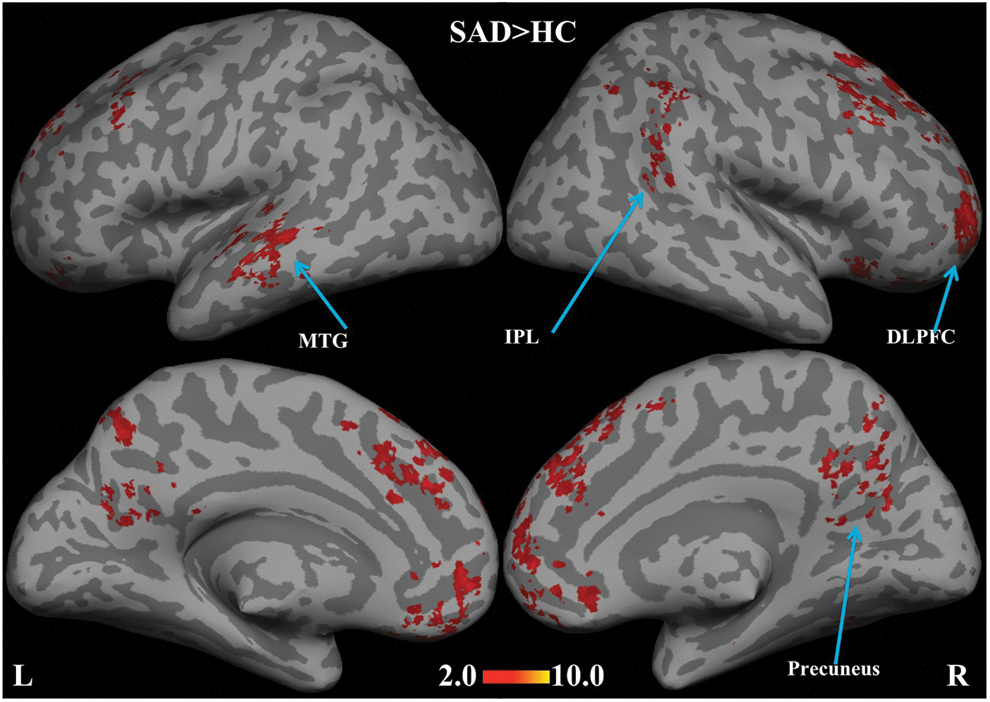
Statistical functional connectivity maps for the periaqueductal gray seed (second-level analysis, n=17 per group). SAD>HC reveals hyper-connectivity in dorsolateral prefrontal cortex (DLPFC), precuneus, cerebellum, left MTG, and inferior parietal lobule (IPL) (blue arrows). Height threshold is p<0.05, cluster-level pFWE-cor <0.05. No brain regions were significantly different in the reverse contrast (HC>SAD).
Our exploratory analysis revealed a positive correlation of LSAS score with functional connectivity of caudate head. The positively correlated regions with LSAS scores include Brodmann areas 7, 18, and 32. Figure 8 shows the linear relationship between LSAS score and the functional connectivity measures (z-value) from ACC with the caudate seed.
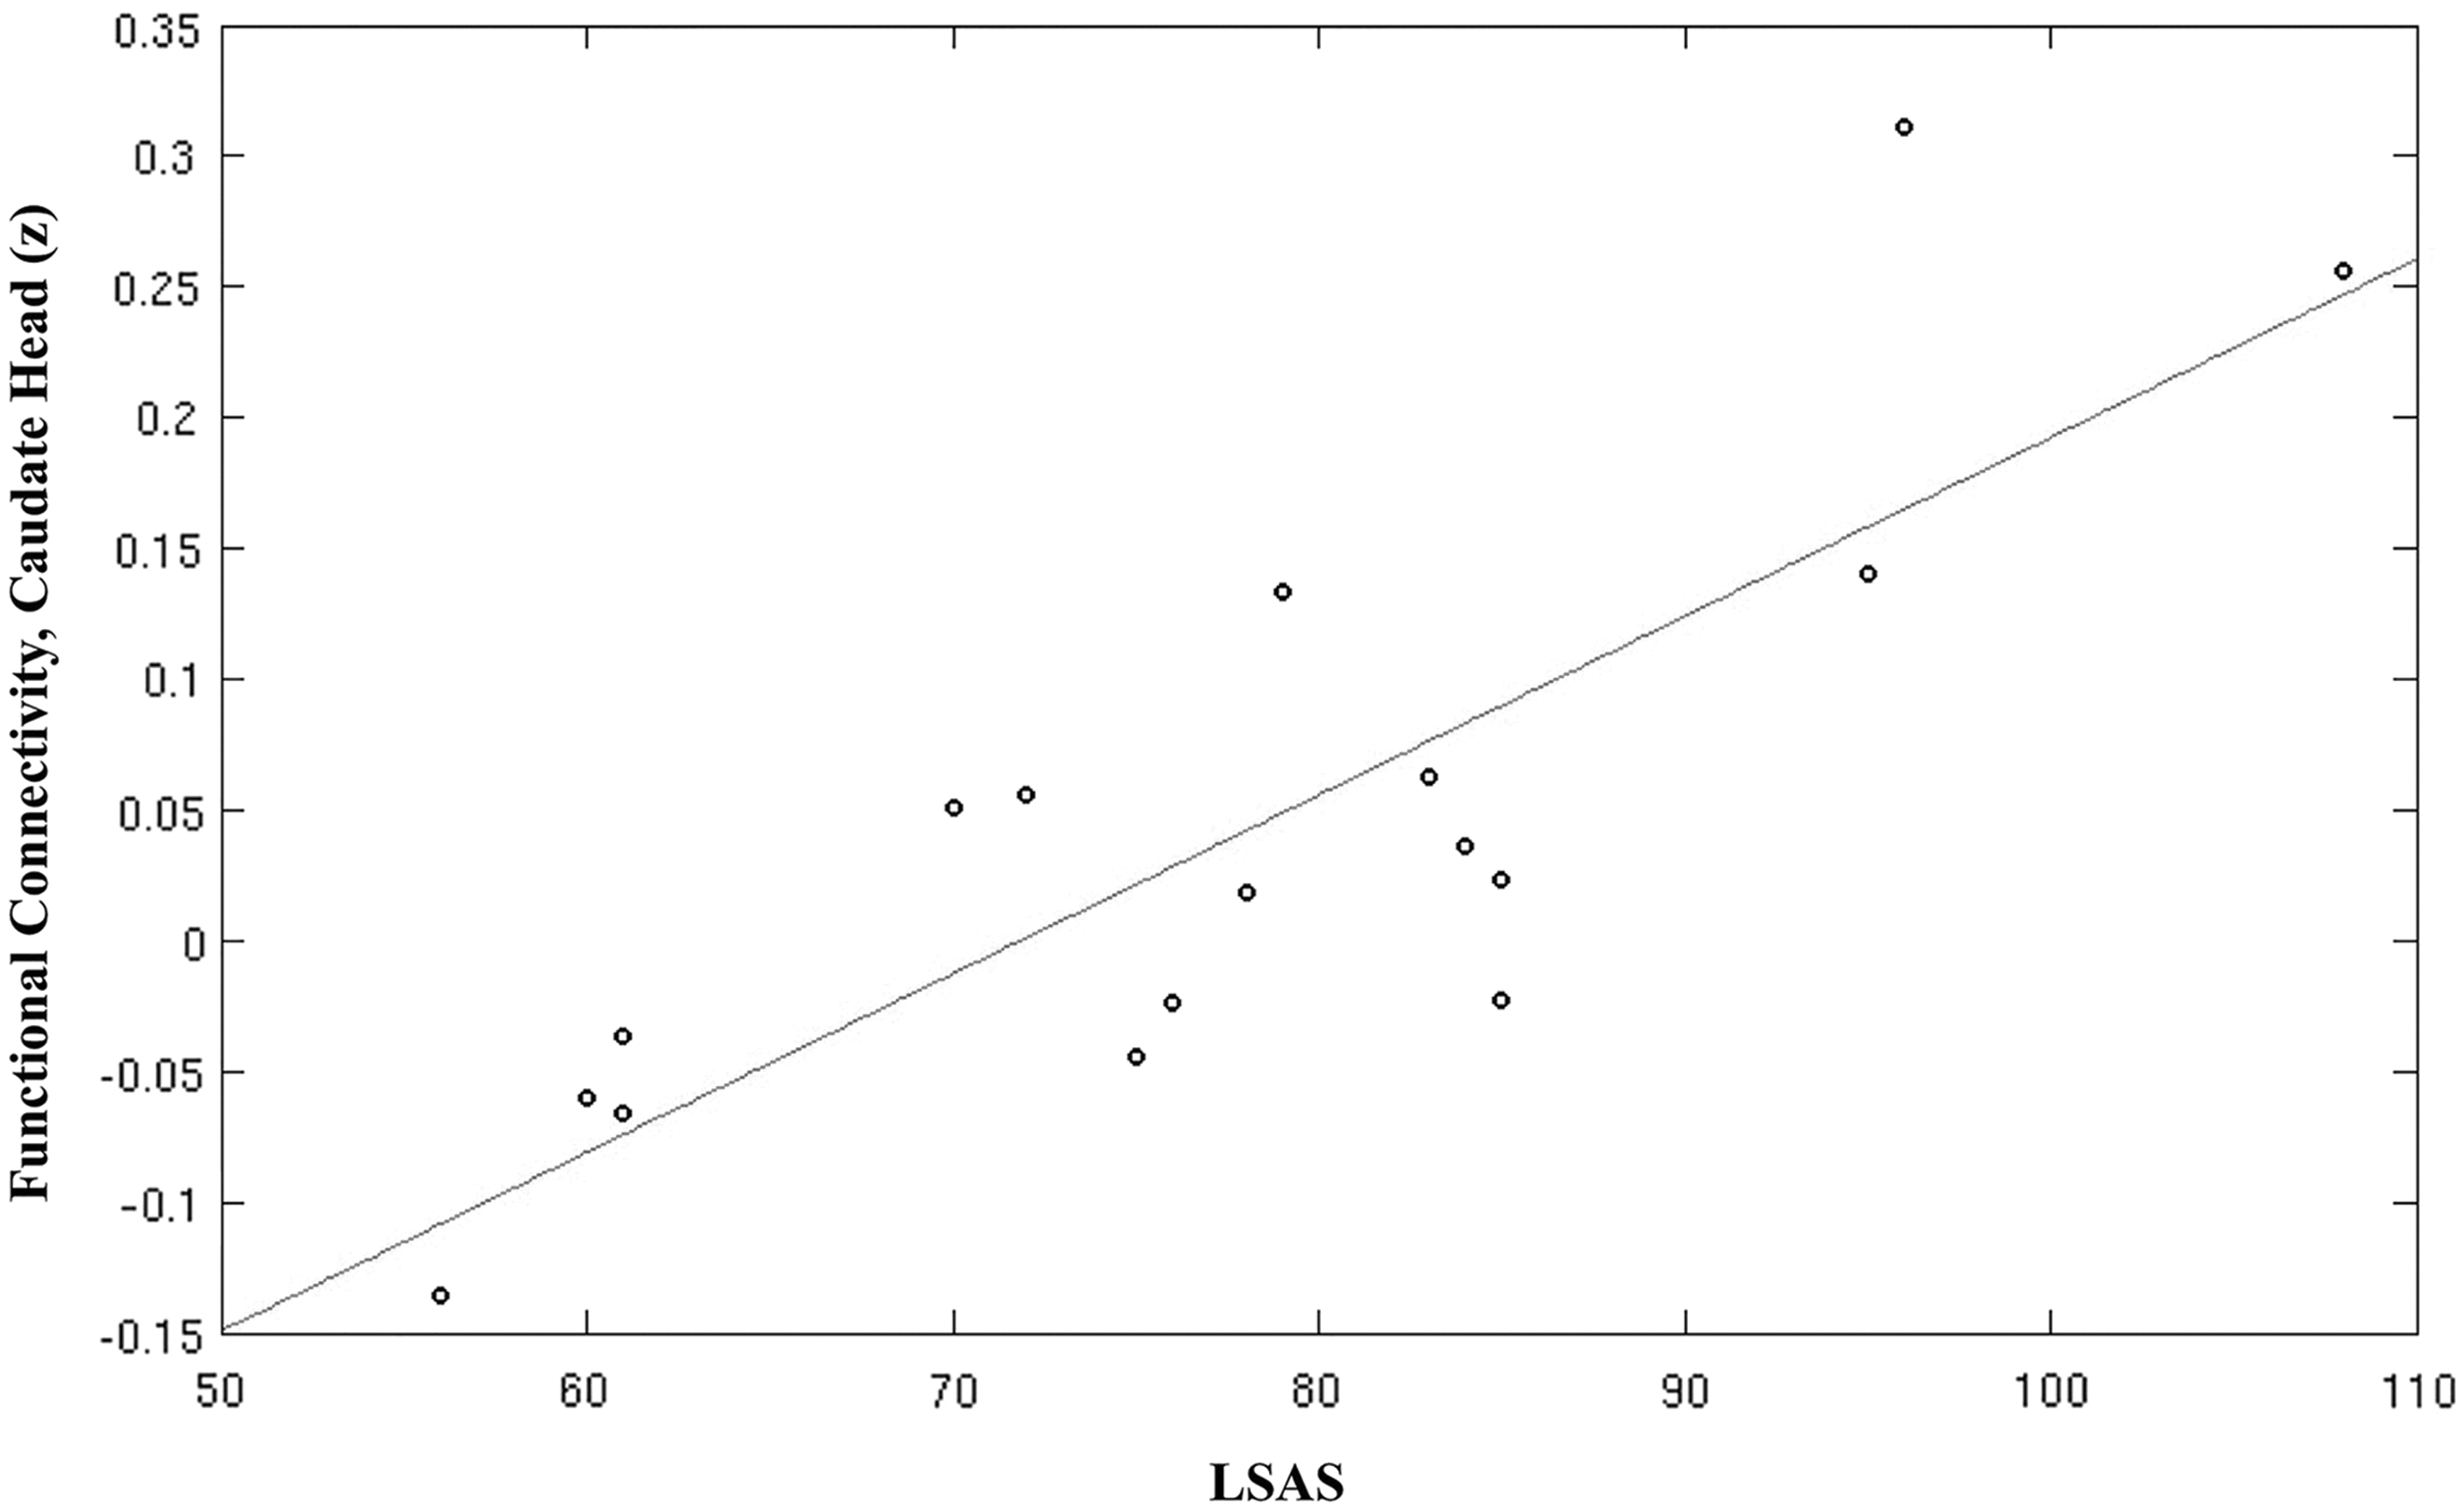
Linear relationship between LSAS and positive functional connectivity measures from the ACC with the caudate seed. LSAS, Liebowitz Social Anxiety Scale.
For all the regions/seeds explored in this study, the HC>SAD contrast was not significant. In addition, we verified that the hyper-connectivity revealed in the SAD>HC contrast was not driven by anticorrelations in controls. Between-group results are summarized in Table 1.
Positively Correlated Brain Regions for Social Anxiety Disorder>Healthy Control Contrast (Second-Level Group Analysis, n=17 per Group, Cluster-Level p FWE-cor <0.05) for the Subcortical Regions Explored in This Study Are Given Below
Opposite contrast was not significant.
ACC, anterior cingulate cortex; FWE, family-wise error; IPL, inferior parietal lobule; ITG, inferior temporal gyrus; MTG, middle temporal gyrus; PHG, parahippocampal gyrus; STG, superior temporal gyrus.
Discussion
In this study, we explored subcortical resting-state fcMRI in an SAD population. By probing the striatum (caudate and putamen), globus pallidus, thalamus, amygdala, and periaqueductal gray, our study provides an important contribution to the literature and may prove useful for developing and improving treatment strategies. Unlike most of the published fcMRI studies on SAD, we employed a drug-naive sample in the current study because of the known influence of pharmacotherapy (Warwick et al., 2012).
Although there is little debate on the role of subcortical regions in the pathophysiology of SAD, functional connectivity alterations with these regions as seeds have remained either unexplored or inconclusive in previously published resting-state fcMRI studies. Analyses of the caudate seed in the current study revealed significantly higher functional connectivity between temporal and frontal regions, such as the orbital, medial, inferior, and ACC, in the SAD>HC comparison. Of these, ACC is particularly interesting because this was one of the regions that exhibited positive correlation with LSAS score when the caudate was chosen as seed region. This could be indicative of abnormalities in frontal-subcortical circuits associated with SAD, as previously shown when using a frontal medial seed in exploring task-based functional connectivity (Gimenez et al., 2012). Moreover, task-based hyperactivity in frontolimbic regions has been previously reported in the context of SAD (Veit et al., 2002), which could be indicative of the abnormalities associated with the underlying pathology. Alterations in the fronto-parietal regions were also observed with L and R putamen seeds in the current study. These findings could help explain some of the deficits in the Executive Control Network in the resting state (Seeley et al., 2007) in SAD populations as previously observed (Liao et al., 2010a). Our study also revealed hyper-connectivity in the ventral/subcallosal ACC with the putamen seeds. Hyperactivity in this region has been attributed to social anxiety from task-based fMRI studies (Ball et al., 2012). The subcallosal ACC has also been classified as part of the “Affective Network” in previous studies (Sheline et al., 2010). Taken together, the hyper-connectivity of cingulate gyrus with the caudate and putamen seeds, as demonstrated in this work, could be indicative of disturbances in striatal function specific to SAD. This is consistent with previous reports from nuclear imaging (van der Wee et al., 2008). Enhanced connectivity in premotor regions suggests that SAD patients are in a state of “motor readiness,” either due to abnormal input to the striatum (from amygdala or mid-brain dopaminergic neurons) as proposed as a testable model for anxiety disorders by Marchand (2010). Enhanced functional connectivity with striatum and regions of the OFC with SAD is equally interesting because of recent reports from task-based fMRI, highlighting the role of OFC in neural habituation in SAD (Sladky et al., 2012).
Smaller structures such as the globus pallidus are typically excluded from fcMRI evaluations of mid-brain regions because of inadequate coil sensitivity and low-resolution acquisition (Di Martino et al., 2008). Our decision to include the globus pallidus in this study stems from our previous fcMRI study that demonstrates the benefits of using multichannel arrays in the high-resolution regime for investigating mid-brain regions (Anteraper et al., 2013). The globus pallidus has been classified in a recent meta-analysis (Hattingh et al., 2012) as one of the regions (along with amygdala, entorhinal cortex, ITG, ACC, and postcentral gyrus) that is significant in the SAD>HC comparison for task-based fMRI involving emotional stimuli. We found hyper-connectivity of the globus pallidus and the precuneus for the first time in the SAD domain with seed-based resting-state fcMRI. Interestingly, previous studies have reported connectivity between these two regions with effective connectivity measures (Marchand et al., 2007). PET studies that involve deep brain stimulation of the globus pallidus in Huntington disease have reported decreased regional CBF in the precuneus (Ligot et al., 2011). Precuneus is considered to be part of the self-referential network, the alterations of which have been previously explored in the realm of task-based fMRI in SAD, particularly for the evaluation of mindfulness-based intervention programs in unmedicated patients (Goldin et al., 2012).
Increased activity of the thalamus is one of the most consistent findings in neuroimaging studies of SAD populations (Freitas-Ferrari et al., 2010). Gimenez and colleagues (2012) have reported enhanced functional connectivity between thalamus and ACC in the SAD group, but had tSNR limitations (1.5 T and 8Ch coil) and did not use a formal resting-state paradigm (“rest” blocks were combined from fMRI block design). In addition to ACC, our study revealed stronger positive correlations with the thalamus seed and premotor, frontal, dorsolateral prefrontal, insular, and parietal cortices within SAD group. Significant enhancements in functional connectivity in the SAD>HC contrast were also noted for several thalamo-cortical regions, including the precuneus, ITG, and PHG, which are part of the DMN. Increased cortical thickness in the ITG has been associated with SAD in recent reports based on structural MRI studies [e.g., (Frick et al., 2013)]. Additionally, significantly enhanced thalamo-cortical connections, specifically in the anterior prefrontal and superior parietal cortices, support the existence of a fronto-parietal network that compensates for the deficits associated with anxiety disorders, as previously illustrated by Etkin et al. (2009). Finally, hyper-connectivity of the bilateral PHG in SAD is particularly noteworthy because PHG has been reported as a major hub in the medial temporal lobe, in association with the DMN (Ward et al., 2013).
Functional imaging of the amygdala is challenging because of the vulnerability to susceptibility-based geometric distortion in EPI, which worsens with thicker slices because of through-plane dephasing. Smaller voxels are recommended to enhance the BOLD CNR while imaging the amygdala (Robinson et al., 2008), but majority of previous studies have employed low-resolution EPI. Also, the amygdala is not a homogenous structure as typically depicted in seed-based functional connectivity studies. We investigated centromedial amygdala as a seed region because the intrinsic activity in this region has been reported to be a predictor of that in striatum (Roy et al., 2009). Similar to the results from striatum seeds (specifically, the putamen), enhanced connectivity in supplementary motor regions in the SAD>HC contrast with the centromedial amygdala seed re-iterates the “motor readiness” in SAD. Previous fcMRI studies (Ding et al., 2011; Hahn et al., 2011; Liao et al., 2010a, 2010b; Prater et al., 2013) have not provided adequate consideration to the functional heterogeneity of amygdala and have reported reduced functional connectivity in SAD. Low-resolution (3.75×3.75×5 mm3) EPI employed in these studies could be partly attributed to the mixed findings because of the dominance of physiological noise to resting-state time-series at bigger voxel volumes. Combination of ultra-high field strength (7 T), high resolution imaging (1.5×1.5 mm2 in-plane), and multichannel arrays (32Ch head coil) would be beneficial to provide improved time-series SNR from the amygdala in future fMRI studies as recently demonstrated (Sladky et al., 2013).
Centromedial amygdala has reciprocal connections with the periaqueductal gray (Rizvi et al., 1991), which is another mid-brain region that has been overlooked in previous studies on SAD, although previous studies have highlighted its role in emotion processing (Wager et al., 2009). Panic induction followed by deep brain stimulation of the periaqueductal gray has been demonstrated in animal models (Moers-Hornikx et al., 2011), but the fcMRI literature on this region is limited because of methodological grounds such as lack of coil sensitivity. Most of the regions that were significantly enhanced in the SAD>HC contrast with the periaqueductal gray seed overlap with the DMN.
Our results highlight the synergy of utilizing multichannel array coils and high resolution in deciphering the resting-state BOLD fluctuations, particularly from subcortical regions, such as basal ganglia and the periaqueductal gray, in the context of SAD.
A limitation to this study is that 4 of our 17 SAD patients had co-morbid depression and 4 had a co-morbid anxiety disorder.
Conclusions
We provide evidence for significant hyper-connectivity in the SAD group as compared with controls in all the subcortical regions explored in this study. In addition, we provide several novel findings, including alterations in regions that are known to be involved in emotional processing, but have not been reported in the realm of resting-state fcMRI. Significantly enhanced seed-based functional connectivity of the globus pallidus and the periaqueductal gray with precuneus in the patient group is particularly interesting as it brings mid-brain regions to the forefront of understanding the neuronal mechanism of SAD. More studies that utilize a synergistic combination of multichannel array coils and high-resolution EPI are needed to validate these findings, which could provide better understanding of the pathophysiology of this disorder.
Footnotes
Acknowledgment
The authors would like to thank the Athinoula A. Martinos Imaging Center at McGovern Institute for Brain Research, Massachusetts Institute of Technology for funding.
Author Disclosure Statement
No competing financial interests exist.