
Abstract
Human decision making is dependent on not only the function of several brain regions but also their synergistic interaction. The specific function of brain areas within the ventromedial prefrontal cortex has long been studied in an effort to understand choice evaluation and decision making. These data specifically focus on whole-brain functional interconnectivity using the principles of network science. The Iowa Gambling Task (IGT) was the first neuropsychological task used to model real-life decisions in a way that factors reward, punishment, and uncertainty. Clinically, it has been used to detect decision-making impairments characteristic of patients with prefrontal cortex lesions. Here, we used performance on repeated blocks of the IGT as a behavioral measure of advantageous and disadvantageous decision making in young and mature adults. Both adult groups performed poorly by predominately making disadvantageous selections in the beginning stages of the task. In later phases of the task, young adults shifted to more advantageous selections and outperformed mature adults. Modularity analysis revealed stark underlying differences in visual, sensorimotor and medial prefrontal cortex community structure. In addition, changes in orbitofrontal cortex connectivity predicted behavioral deficits in IGT performance. Contrasts were driven by a difference in age but may also prove relevant to neuropsychiatric disorders associated with poor decision making, including the vulnerability to alcohol and/or drug addiction.
Introduction
Human decision making is a multidimensional cognitive process that is crucial for seamless daily function. Studies in cognitive neuroscience have advanced our basic behavioral and neurologic understanding of decision making, and have identified functionally important brain regions (Gläscher et al., 2012; Kable and Glimcher, 2009; Rangel and Hare, 2010). For instance, studies within the somatic marker framework have linked ventromedial prefrontal cortex brain regions to value assignment during the decision-making process (Bechara et al., 1994, 2000; Damasio, 1996). Since this research, studies have reiterated the importance of the medial prefrontal cortex (mPFC) and the orbitofrontal cortex (OFC) to value-based decision making (Gläscher et al., 2012; Kable and Glimcher, 2009; Li et al., 2010; Valentin et al., 2007).
More recently, functional neuroimaging research has adopted system-based analytical techniques that will help further the understanding of integrative behaviors. These techniques are commonly referred to as “connectivity analysis” and have grown to include network science (Bullmore and Sporns, 2009; He and Evans, 2010; Rubinov and Sporns, 2010). The study of functional connectivity has become a burgeoning field of neuroscience. Many studies have focused on the resting state condition (He and Evans, 2010; van den Heuvel and Hulshoff Pol, 2010) and research relating to voxel-wise and task-based network structure is currently limited to simple, externally driven stimuli (Eguíluz et al., 2005; Ginestet and Simmons, 2011; He et al., 2012; Moussa et al., 2011). Here, we apply the methods of network science to functional magnetic resonance imaging (fMRI) data collected from young and mature adults during performance of a complex value-based decision-making paradigm called the Iowa Gambling Task (IGT). The IGT was the first neuropsychological task used to model real-life decisions in a way that factors reward, punishment, and conflict. It also offers clinical value when used to detect decision-making impairments that are characteristic of patients with prefrontal cortex lesions (Bechara et al., 1994; Gläscher et al., 2012).
In this study, we identified age-related differences in behavioral performance and characterized functional sub-networks using modularity (Newman and Girvan, 2004). In this context, modules can be thought of as functional communities capable of mediating both local and distributive information processing. These analyses extend research that is heavily focused on frontal lobe neural activity during task (Gescheidt et al., 2013; Li et al., 2010) and work toward measuring diversity in whole-brain functional community structure.
Materials and Methods
Participants
Participants were originally part of a larger and separate study that evaluated behavioral and neural characteristics of alcohol dependency. Data presented herein are only from nondependent research volunteers that served as normal controls for the larger study; none of them were retested for the purposes of this study. Following an initial phone screen, participants were invited to the laboratory and agreed to participate in procedures that were approved by the Wake Forest University School of Medicine Institutional Review Board. Exclusion criteria included systemic diseases of the central nervous system, head trauma, neurological disorders, Axis-I psychiatric disorders, abuse of substances, or an intelligence quotient (IQ) of less than 80. Participants who met all inclusion criteria were scheduled for an MRI scan visit.
All participants were administered the Spielberger State Anxiety questionnaire (Speilberger et al., 1983) and the Beck's Depression Inventory (Beck et al., 1961). Several Cambridge Neuropsychological Test Automated Battery (CANTAB;
For this analysis, a young adult was defined as an individual between 21–35 years of age; a mature adult was defined as an individual between 36–50 years of age. Data [mean±standard error] from nine young [24.3±3.2 years old; age range: 21–30 years old] and nine mature [39.0±3.3 years old; age range: 36–45 years old] adults were used in this study. Adult groups were matched on gender [young: 4M|5F; mature: 4M|5F], handedness [young: 1L|8R; mature: 1L|8R], and IQ [young: 116.1±8.6; mature: 113.1±8.9].
Iowa Gambling Task
Participants were trained on the IGT (Bechara, 2007; Bechara et al., 1994) using a standard laptop computer and button box before they entered the scanner. This training session consisted of eight gambling events and two control events (see below for details) and served to familiarize participants with the timing and general structure of the task.
In the MRI scanner, a modified version of the IGT was presented on MR compatible goggles and responses were recorded on a button box positioned under the right hand. Three IGT blocks were administered; each consisted of 13 randomly inserted control events (4 sec each) and 45 gambling events (4 sec each). In a control event, participants were given 2 sec to select a card from a specific deck (e.g., “Select Deck B”) and were then shown a screen for 2 sec that read: “You Neither Win Nor Lose.” In the context of connectivity analysis, control events were not included. They were, however, used as a proxy for attention and correct selections helped ensure that participants followed instructions throughout the task.
Like a control event, a gambling event also included time for card selection (2 sec) and feedback (2 sec). Participants were presented with four decks (A, B, C, and D) during card selection and given monetary win, loss, and overall value information during feedback. Decks A and B produced an immediate win of $100 and losses ranged from $250 to $1200. Decks A and B were referred to as disadvantageous and resulted in poor task performance if picked from repeatedly. Decks C and D produced an immediate win of $50 and losses ranged from $50 to $250. Decks C and D were referred to as advantageous and resulted in successful task performance if picked from repeatedly (Fig. 1). Participants were asked to treat play money as real money and that any decision on what they do with it should be made as if they were using their own money. All participants were remunerated for their participation in the study and told that the best performer would receive a $50 bonus. Participants were not debriefed or questioned about their decision-making strategies after the completion of the task.
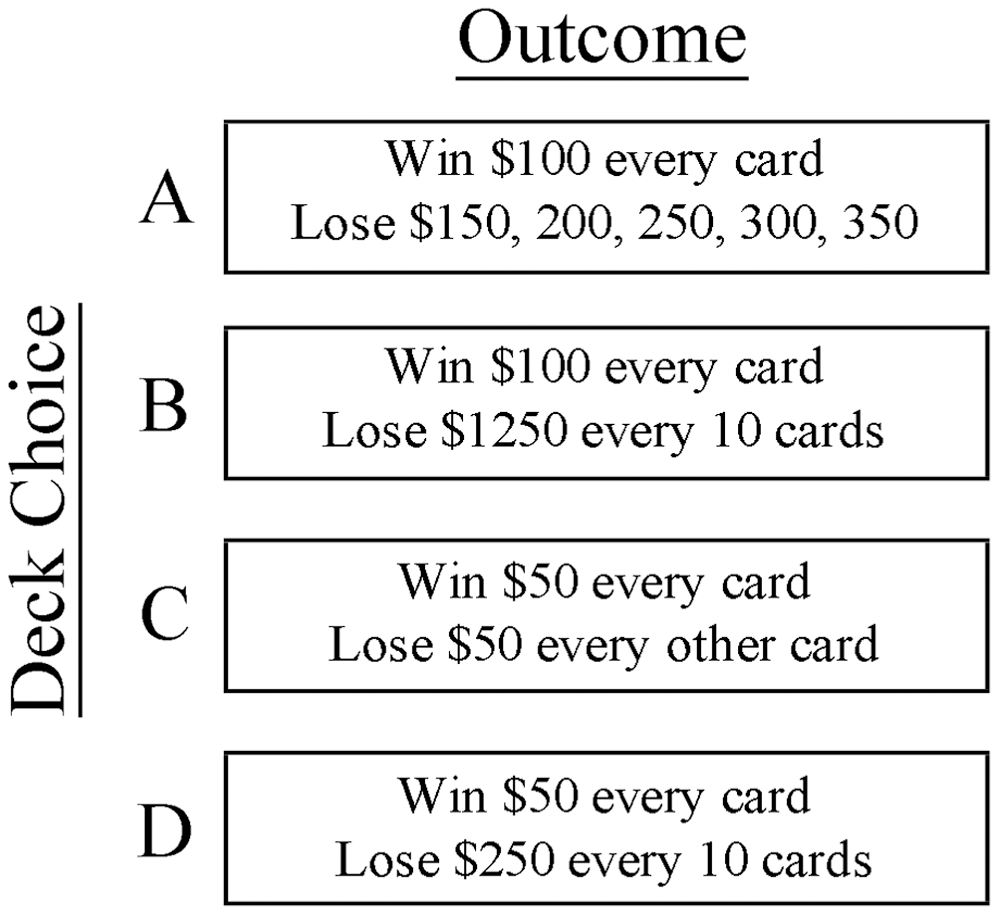
Iowa Gambling Task (IGT). Participants were presented with 4 decks (A, B, C, and D) during card selection, and given monetary win and loss information during feedback. Disadvantageous decks A and B resulted in immediate gains of $100 with losses over time ranging from $250 to $1200. Advantageous decks C and D produced immediate gains of $50 with losses over time ranging from $50 to $250.
Data from Block 1 and Block 3 were used to represent the exploration (strategy development) and exploitation (strategy execution) phases of the task. Net Score for each block was calculated as follows: advantageous selections (C+D)—disadvantageous selections (A+B). Net Score Difference was equal to Block 3 Net Score—Block 1 Net Score and was used as a measure of learning a successful task strategy.
fMRI data acquisition
Images were acquired on a 1.5T General Electric scanner with a birdcage-type standard quadrature head coil and an advanced nuclear magnetic resonance echo planar system. Foam padding was used to limit head motion. High-resolution T1-weighted anatomical images (3D SPGR, TR=10 msec, TE=3 msec, voxel dimensions 1.0×1.0×1.5 mm, 256×256 voxels, 124 slices) were acquired for co-registration and normalization of functional images. A total of 162 coplanar functional images were acquired using a gradient echo planar sequence (TR=2100 msec, TE=40 msec, voxel dimensions 3.75×3.75×5.0 mm, 64×64 voxels, 28 slices). The scanning planes were oriented parallel to the anterior–posterior commissure line and extended from the superior extent of motor cortex to the base of the cerebellum.
Image processing
For each subject, functional data from Blocks 1 and 3 were realigned to the first acquired volume, respectively. They were then co-registered to the accompanying T1-weighted structural image, and then spatially normalized to the Montréal Neurological Institute (MNI) template using FSL software (FMRIB, Oxford, United Kingdom). The normalized fMRI data were masked so that only the gray matter voxels corresponding to areas specified by the automated anatomical labeling (AAL) atlas (Tzourio-Mazoyer et al., 2002) were included. A band-pass filter (0.009–0.08 Hz) was applied to the masked time series data to filter out any physiological noise and low-frequency drift. Confounding signals were regressed out from the filtered data, including 6 rigid-body transformation parameters generated during the realignment process and 3 global mean time courses (whole-brain, white matter, and ventricles). See Supplemental Data (Supplementary Data are available online at
Generating whole-brain networks
To generate subject-specific and voxel-based functional networks the time series data from each possible pair of voxels in a data set were correlated. In this report, our focus is not on any one particular stimulus (e.g., the components of a gambling event) but rather the entire behavior (e.g., decision making under risk) and in particular the strategy exploration (Block 1) and strategy exploitation (Block 3) phases of the task. Consequently, we performed a simple correlation between each pair of voxel time courses. This is in contrast to context-dependent connectivity analysis using standard (Fornito et al., 2012; Minati et al., 2012) or generalized (Cole et al., 2013) psychophysiological interaction methods.
Edge density across subjects was matched using the formula N=Ks, which has been shown to relate network size to density in random small-world networks (Watts and Strogatz, 1998). This threshold ensures that comparisons are being made between networks of comparable density relative to the number of network nodes. For the networks used here, all subjects had approximately the same number of nodes across all runs so network size was not a limiting factor. For this report, a threshold S=2.5 was used. Networks with an S=2.5 exhibit comparable size: density ratios observed in other naturally occurring networks (Laurienti et al., 2011). Prior work has shown that networks tend to fragment when S is above 3 (Hayasaka and Laurienti, 2010), and that the reproducibility of brain networks is highest at thresholds with S between 2 and 3 (Telesford et al., 2013) Correlations above the threshold were given a value of 1, and those below the threshold were given a value of 0. See Supplemental Data for mean age×block correlation values used for thresholding (Supplementary Table S3) and other measures of network structure across thresholds (Supplementary Fig. S1).
Functional communities and their consistency across individuals
Complex cognitive processes rely on both localized and distributive information processing. Modularity is a useful metric for evaluating the intra- and inter-community connections within a network that may mediate these distinct processes. Moreover, when applied to behavioral neuroimaging, it can be particularly useful for visualizing functional substructures that emerge during task performance.
In a network, the modular organization of nodes can be identified by finding densely connected groups of nodes that are only sparsely connected to other groups of nodes. In network analyses, these are called modules. Here, they will be referred to as functional communities. Modularity, Q, is defined by:
Here, eii is a measure of intra-community connections in a functional community i, ai is the total number of connections in this community, and M is equal to the total number of connections in the entire brain network. QCut (Ruan and Zhang, 2008) was used to find community partitions and their associated Q values. It is an optimization algorithm and as such can provide an alternative partition solution when repeated. Q values range from 0 to 1 and values closer to 1 represent the partition solution maximizing the number of connections within modules and minimizing the number of connections among modules. Here, QCut was run 10 times for each individual's network and the partition solution with the highest Q was chosen for further analysis (Steen et al., 2011). See Supplemental Data for mean age×block Q values (Supplementary Table S4); number of modules (Supplementary Table S5) and examples of modular partitions (Supplementary Fig. S2).
Quantifying community consistency
Scaled inclusivity (SI) was developed as a metric to evaluate group-wise modular structure without subjective bias (Supplementary Fig. S3) (Steen et al., 2011). SI is calculated by measuring the overlap of modules across multiple networks and it penalizes for disjunction. Consider a node V that is part of module A in subject i and module B in subject j. The SI for node V, denoted as SIV, was calculated as follows:
Here, SA and SB denote nodes in modules A and B, respectively. For this study, SI images (e.g., Figs. 5 –7) represent the similarity in location and size and the prevalence of a functional community across a group of individuals.
This study uses predefined region of interest (ROI) to evaluate qualitative differences in community structure. Using the AAL atlas (Tzourio-Mazoyer et al., 2002), the visual community was defined by the calcarine and lingual gyri and the sensorimotor community was defined by the pre- and post- central gyri. Based on age×group findings in mPFC community structure, we chose to create spherical ROIs based on independent components analysis research identifying the default mode sub-network (Shirer et al., 2012). The mPFC ROI coordinates were defined as follows: mPFC (0 45 20; 20 mm), the posterior cingulate and precuneus (0 −50 35; 16 mm); left (51 −56 25) and right (−51 −56 25) parietal lobes (16 mm). SI values were averaged across all the voxels within an ROI and ages×group comparisons were performed. Differences in SI values for a particular ROI point to quantitative differences in the consistency of the corresponding community.
Change in the number of functional connections
Different behavioral states are associated with variability in underlying functional brain connectivity. For instance, node A may exhibit 10 connections during condition X. In condition Y, however, node A gains 10 new connections but also loses 5 connections. The total change (new-lost) in connectivity in this example is five connections, and represents an overall increase from condition X to condition Y. For the analysis shown in Figure 8, the change in functional connectivity between Blocks 1 and 3 was calculated for a 10 mm sphere centered on MNI coordinates 4, 41, and −24 in the OFC.
Results
Neuropsychological battery performance
Adult groups did not differ in anxiety or depression levels as measured by the Spielberger State Anxiety questionnaire and the Beck's Depression Inventory, respectively. Also, no significant differences in the following neuropsychological tasks were found: Mean Motor Latency [young adults mean latency in milliseconds±SE: 870.17±70.24 and mature adults mean latency in milliseconds±SE: 864.61±35.28], Pattern Recognition Memory [young adults mean percent correct±SE: 96.30±1.76 and mature adults mean percent correct±SE: 92.60±2.48], and Intra-Extra Dimensional Set Shift [young adults mean total errors±SE: 17.00±4.18 and mature adults mean total errors±SE: 18.67±4.58]. Young and mature adults performed similarly on the simultaneous condition of the Delayed Match to Sample task [young adults mean percent correct±SE: 100.00±0.00 and mature adults mean percent correct±SE: 100.00±0.00]. However, young adults outperformed mature adults on the 4-sec delay [young adults mean percent correct±SE: 95.56±2.94 and mature adults mean percent correct±SE: 88.89±3.32; two-tailed t-test, t (16)=2.23, p=0.04] and the 12-sec delay [young adults mean percent correct±SE: 97.78±2.22 and mature adults percent correct±SE: 75.56±8.68; two-tailed t-test, t (16)=2.48, p=0.03] conditions. Young adults also outperformed mature adults on the Stockings of Cambridge task [young adults mean problems solved in minimum moves±SE: 10.44±0.41 and mature adults problems solved in minimum moves±SE: 7.89±0.48; two-tailed t-test, t (16)=4.02, p<0.01].
IGT block performance
Both young and mature adults predominately picked from disadvantageous decks in Block 1 and as a result performed poorly [young adults mean Net Score Block 1±SE: −5.89±3.85 and mature adults mean Net Score Block 1±SE: −12.89±3.85; Figure 2]. In Block 3, however, young adults did significantly better than mature adults [young adults mean Net Score Block 3±SE: 10.67±5.86 and mature adults mean Net Score Block 3±SE: −16.56±5.86]. There was a main effect of age [general linear model (GLM), F (1, 16)=9.3, p=0.01] but no main effect of block. A significant age×block interaction [GLM, F (1, 16)=5.8, p=0.03] was also found. The Net Score Difference was significantly different between young and mature adults [young adults mean Net Score Difference±SE: 16.6±5.7 and mature adults mean Net Score Difference±SE: −3.7±5.6; two-tailed t-test, t (16)=2.41, p=0.03].
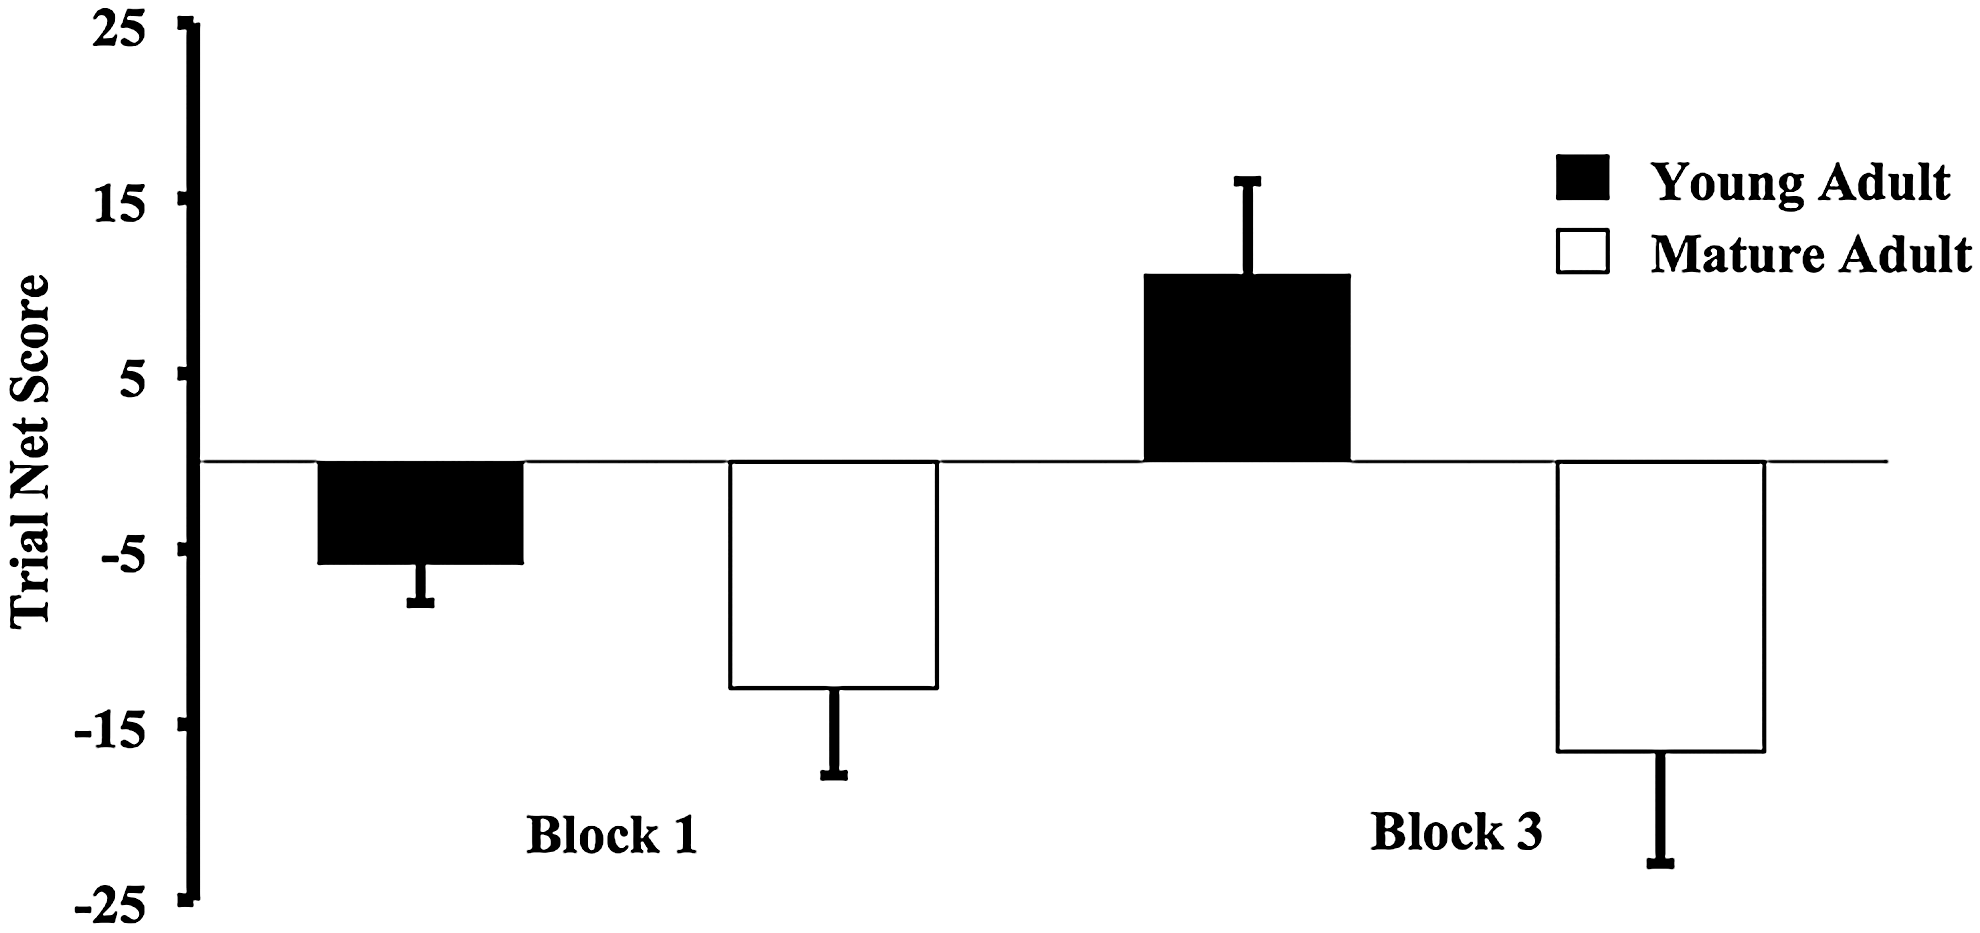
IGT performance across trial. Both adult groups performed poorly in Block 1 of the IGT. In Block 3, however, young adults did significantly better than mature adults. There was a main effect of adult group [GLM, F (1, 16)=9.3, p=0.01], no main effect of block and a significant block × adult group interaction [GLM, F (1, 16)=5.8, p=0.03]. Block Net Score was calculated as advantageous (C+D)—disadvantageous (A+B) deck selections. GLM, general linear model.
Spearman Rank correlation coefficients (ρ) were determined using one lag autocorrelations; decks A, B, C, and D represented the abscissa and the overall value (i.e., wins − losses) of the previous card represented the ordinates. Individual subject ρ values were calculated and averaged across young and mature adults for Blocks 1 and 3 (Fig. 3). A negative ρ indicated that disadvantageous selections were made after cards with high overall value. A positive ρ indicated that advantageous selections were made after cards with high overall value. In Block 1, young and mature adults picked from more disadvantageous decks immediately after card selections with high overall value [young adults mean ρ Block 1±SE: −0.33±0.06 and mature adults mean ρ Block 1±SE: −0.17±0.06]. In Block 3, the value of the preceding card no longer related to subsequent selection of either advantageous or disadvantageous card types in young adults. Mature adults, on the other hand, continued to pick more disadvantageous decks immediately after card selections with high overall value [young adults mean ρ Block 3±SE: 0.02±0.09 and mature adults mean ρ Block 3±SE: −0.30±0.09]. The difference in ρ across blocks was used to measure this change in behavior, and was significantly different between young and mature adults [young adults mean ρ difference±SE: 0.35±0.11 and mature adults mean ρ difference±SE: −0.12±0.10; two-tailed t-test, t (16)=3.27, p=0.01].
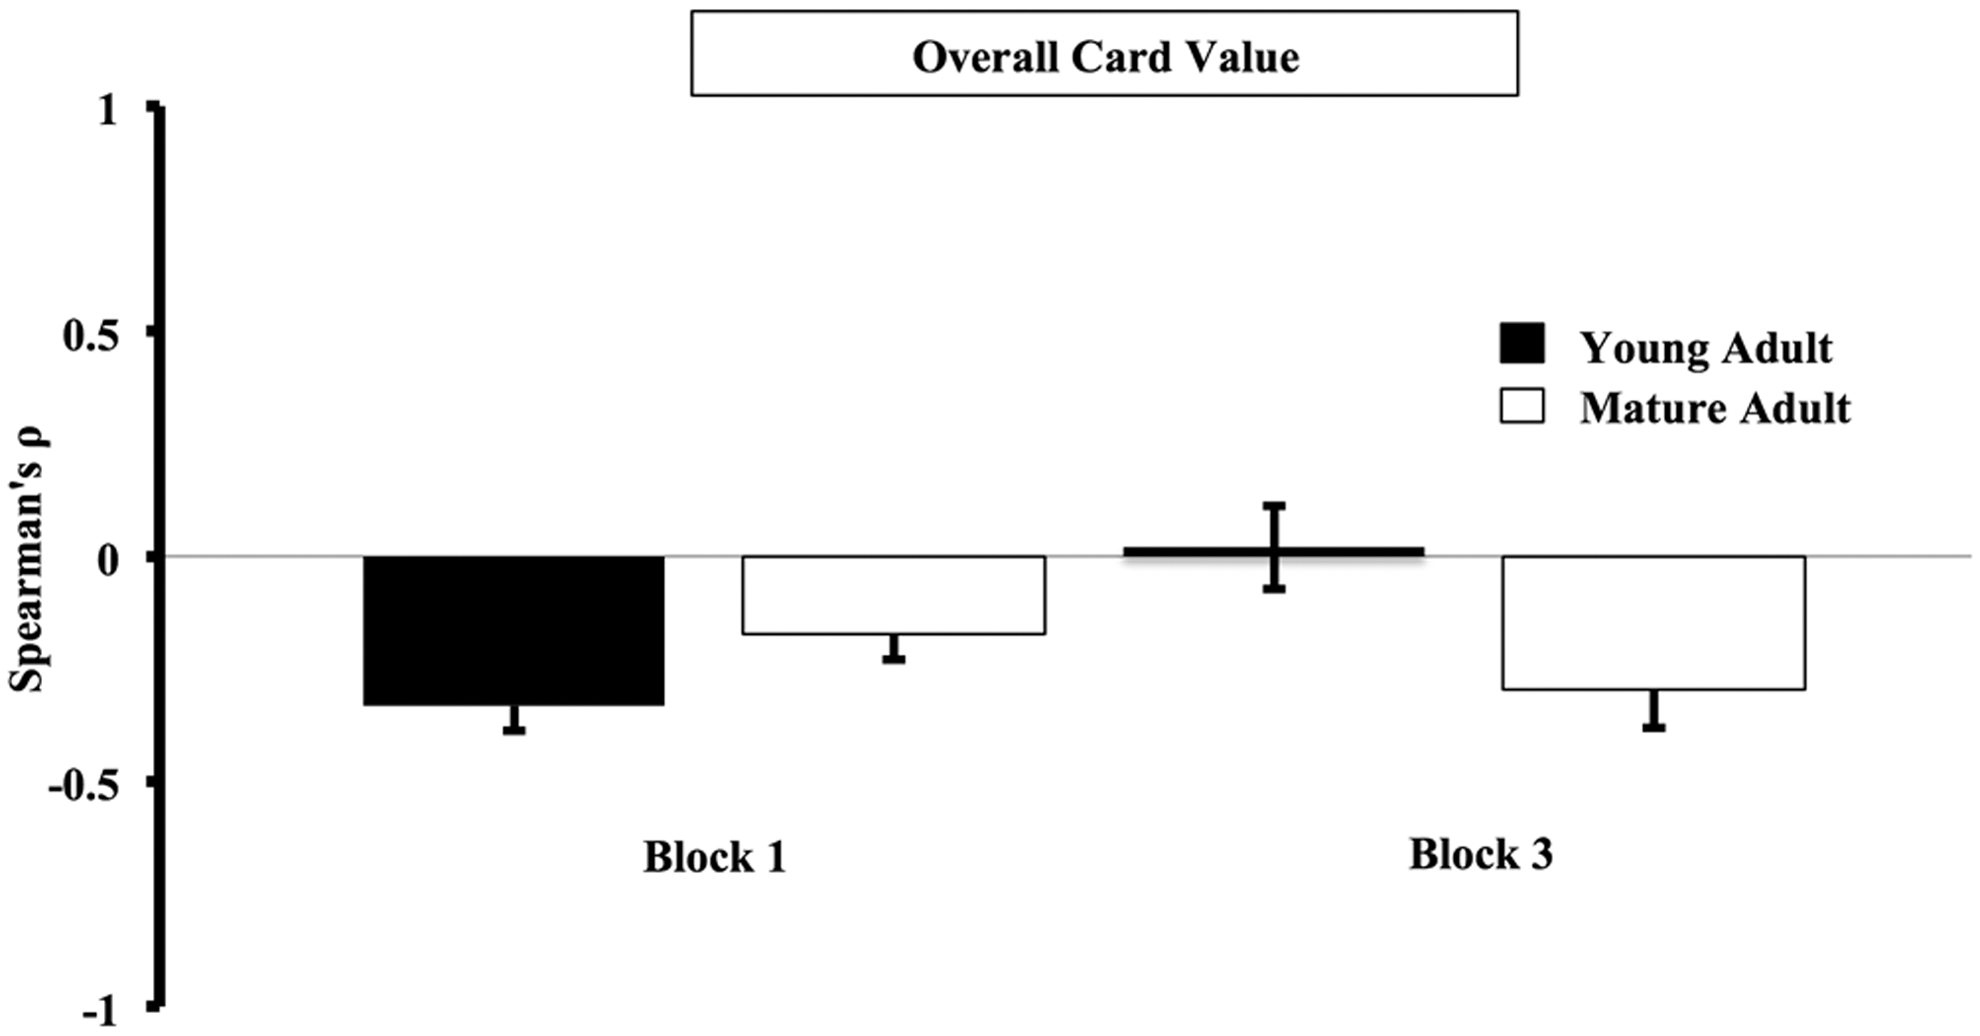
Differences in card selection that are based on overall card value. Spearman Rank correlation coefficients (ρ) were determined using one lag autocorrelations; decks A, B, C, and D represented the abscissa and the overall value (i.e., wins − losses) of the previous card represented the ordinates. Individual subject ρ values were calculated and averaged across young and mature adults for Blocks 1 and 3. A negative ρ indicated that disadvantageous selections were made after cards selections with high overall value. A positive ρ indicated that advantageous selections were made after cards selections with high overall value. In Block 1, young and mature adults picked from more disadvantageous decks immediately after card selections with high overall value. In Block 3, the value of the preceding card no longer related to subsequent selection of either advantageous or disadvantageous card types in young adults. Mature adults, on the other hand, continued to pick more disadvantageous decks immediately after card selections with high overall value. The difference in ρ across blocks was used to measure this change in behavior, and was significantly different between young and mature adults [two-tailed t-test, t (16)=3.27, p=0.01].
Typical card selections in Blocks 1 and 3 are shown for both groups in Figure 4. Deck selections (black circle), card win value (green triangle), and card loss value (red square) are shown for each gambling event for one young and one mature adult. In Block 1, both adult groups sampled decks. In Block 3, however, young adults picked advantageous cards (C and D) more often, and seldom selected a disadvantageous card (A and B). In contrast, mature adults selected disadvantageous cards almost exclusively, and in particular preferred Deck B. Mature adults typically selected an advantageous deck immediately after card selections associated with high loss value (highlighted red squares). Thereafter, however, they reverted to disadvantageous deck selections.
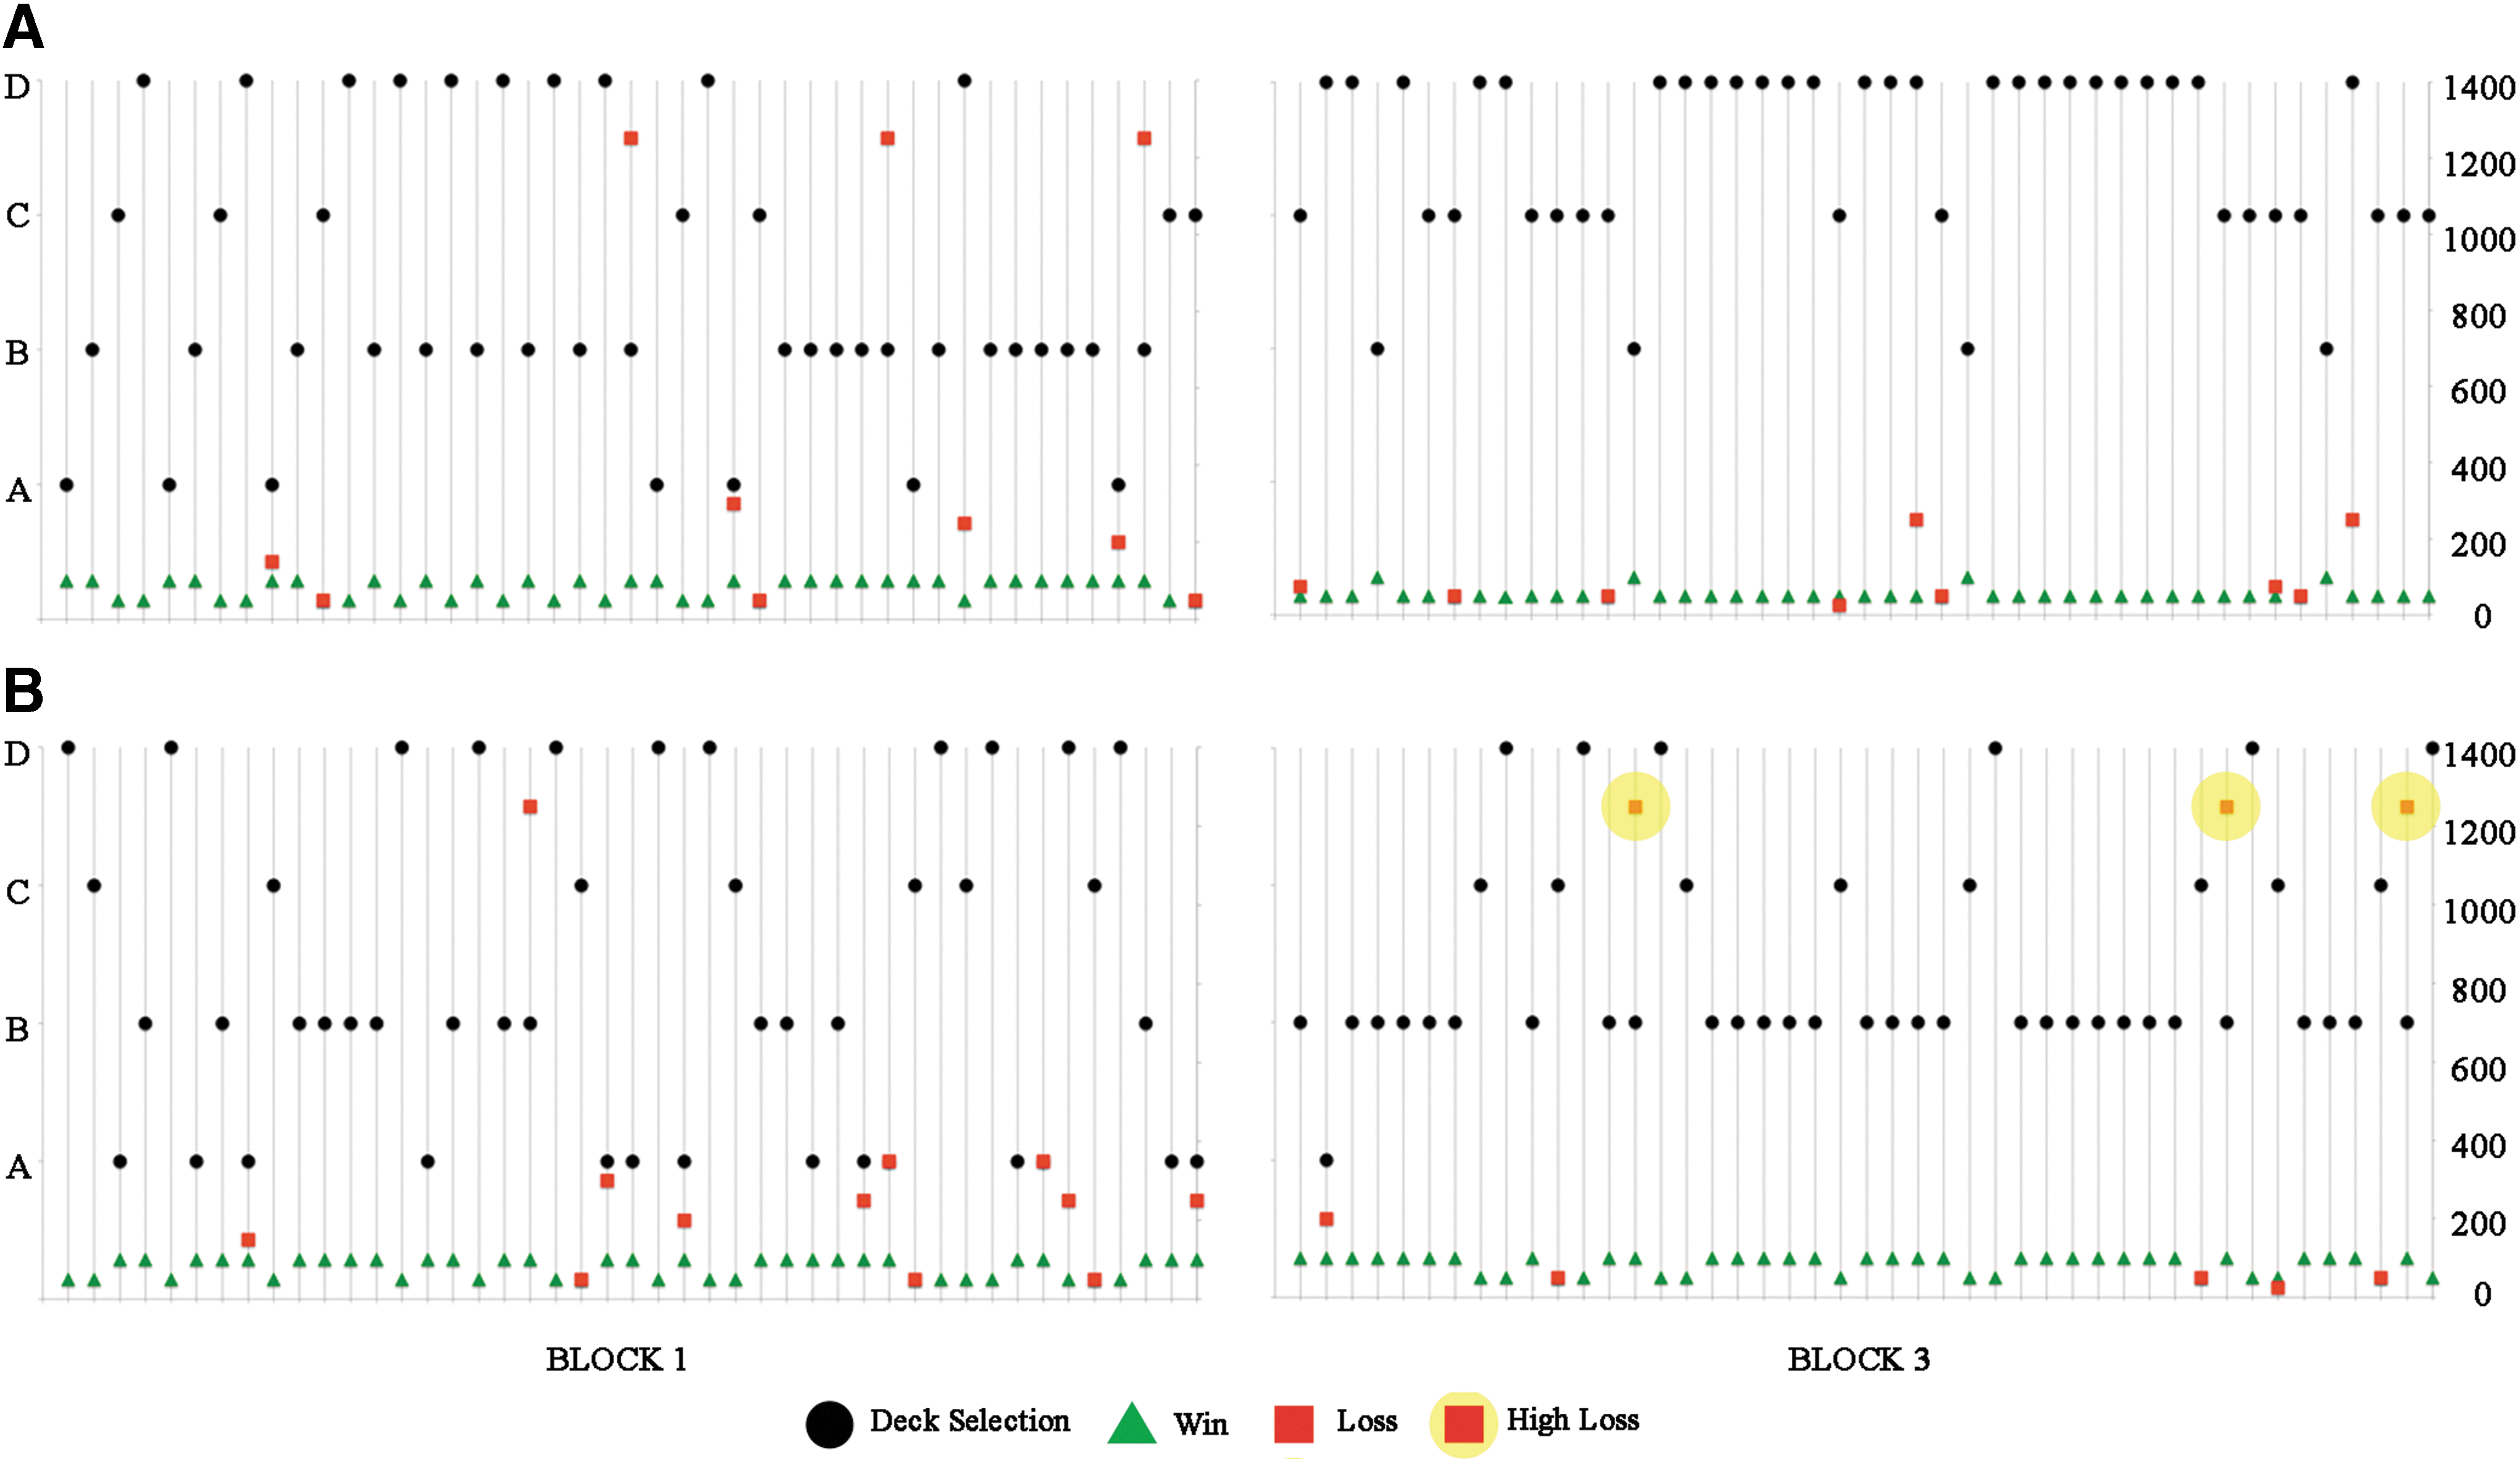
Representative young and mature adult selections. Representative deck selections (black circle), card wins (green triangle), and card losses (red square) are shown for each event in a block for
Functional communities
Functional communities can be organized in a number ways. In the context of the human brain, functional communities can be confined (i.e., to a particular cortex) or distributed (i.e., including multiple cortices). Brain regions showing consistent modular organization were first identified and then served as regions of interest when determining the following region-specific community structure (Supplementary Fig. S3).
Visual and sensorimotor functional community structure
A visual community was confined to both primary and secondary visual cortices and was highly consistent in both blocks for young adults (Fig. 5). On the other hand, visual community consistency in mature adults was higher in the last block relative to the first. There was a main effect of age [GLM, F (1, 14)=7.83, p=0.01] but no main effects of block [GLM, F (1, 14)=2.06, p=0.17] or an age×block interaction [GLM, F (1, 14)=1.7, p=0.22] on visual ROI SI values. A sensorimotor community was confined to the primary motor, premotor, and supplementary motor cortices in addition to the primary somatosensory cortex. The consistency of the sensorimotor community in both young and mature adults was higher in the last block relative to the first. There was no main effect of age [GLM, F (1, 14)=1.44, p=0.25] but a main effect of block [GLM, F (1, 14)=15.79, p=0.001] on sensorimotor ROI SI values. No age×block interaction [GLM, F (1, 14)=0.787, p<0.39] was found.
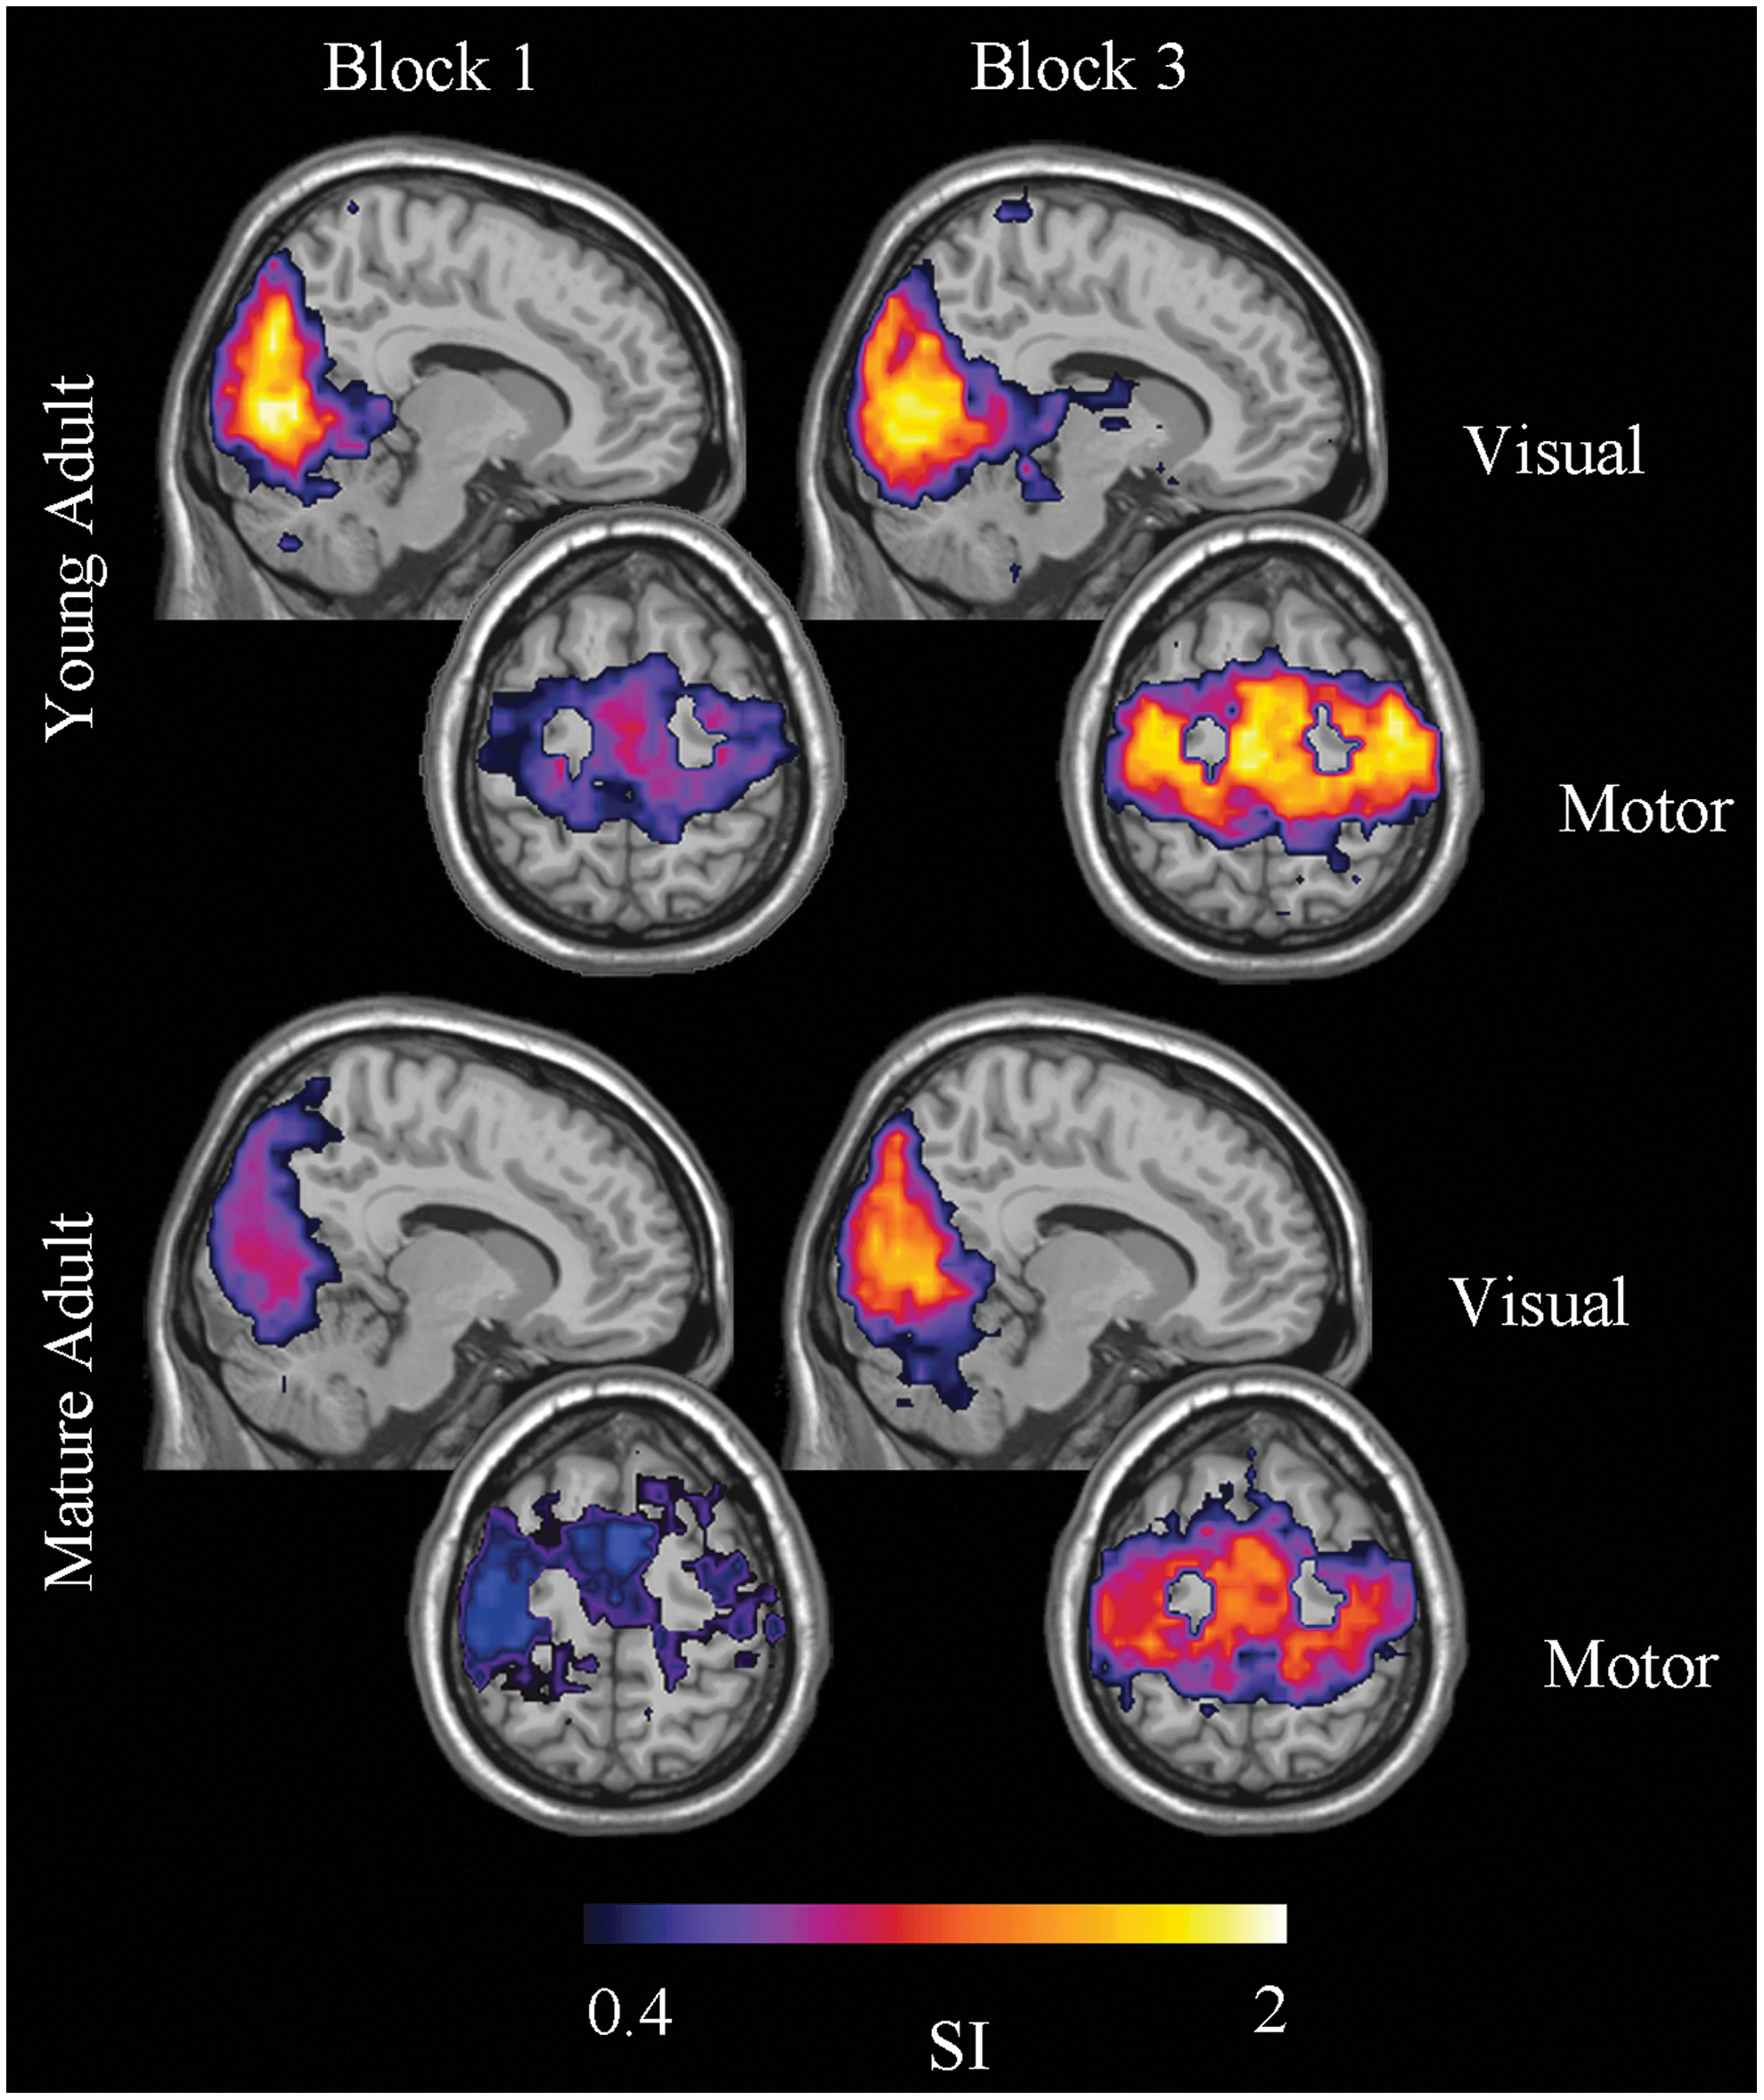
Visual and sensorimotor functional community structure. Visual community consistency was high in both blocks for young adults. In mature adults, visual community consistency was higher in the last block relative to the first. Sensorimotor community consistency in both young and mature adults was higher in the last block relative to the first. SI, scaled inclusivity. Color images available online at
mPFC functional community structure
Young and mature adults had different mPFC community structure in Block 1despite similar task performance (Fig. 6). In young adults, the mPFC community was confined compared to a distributed mPFC community in mature adults, which included the precuneus and posterior cingulate cortex. In Block 3, the mPFC community in young adults was no longer confined and like their mature adult counterparts the mPFC community included the precuneus, posterior cingulated, and parietal cortices. Main effects of age [GLM, F (1, 14)=7.21, p=0.02], block [GLM, F (1, 14)=6.04, p=0.03], and an age×block interaction [GLM, F (1, 14)=4.37, p<0.05] on mPFC ROI SI values were found.
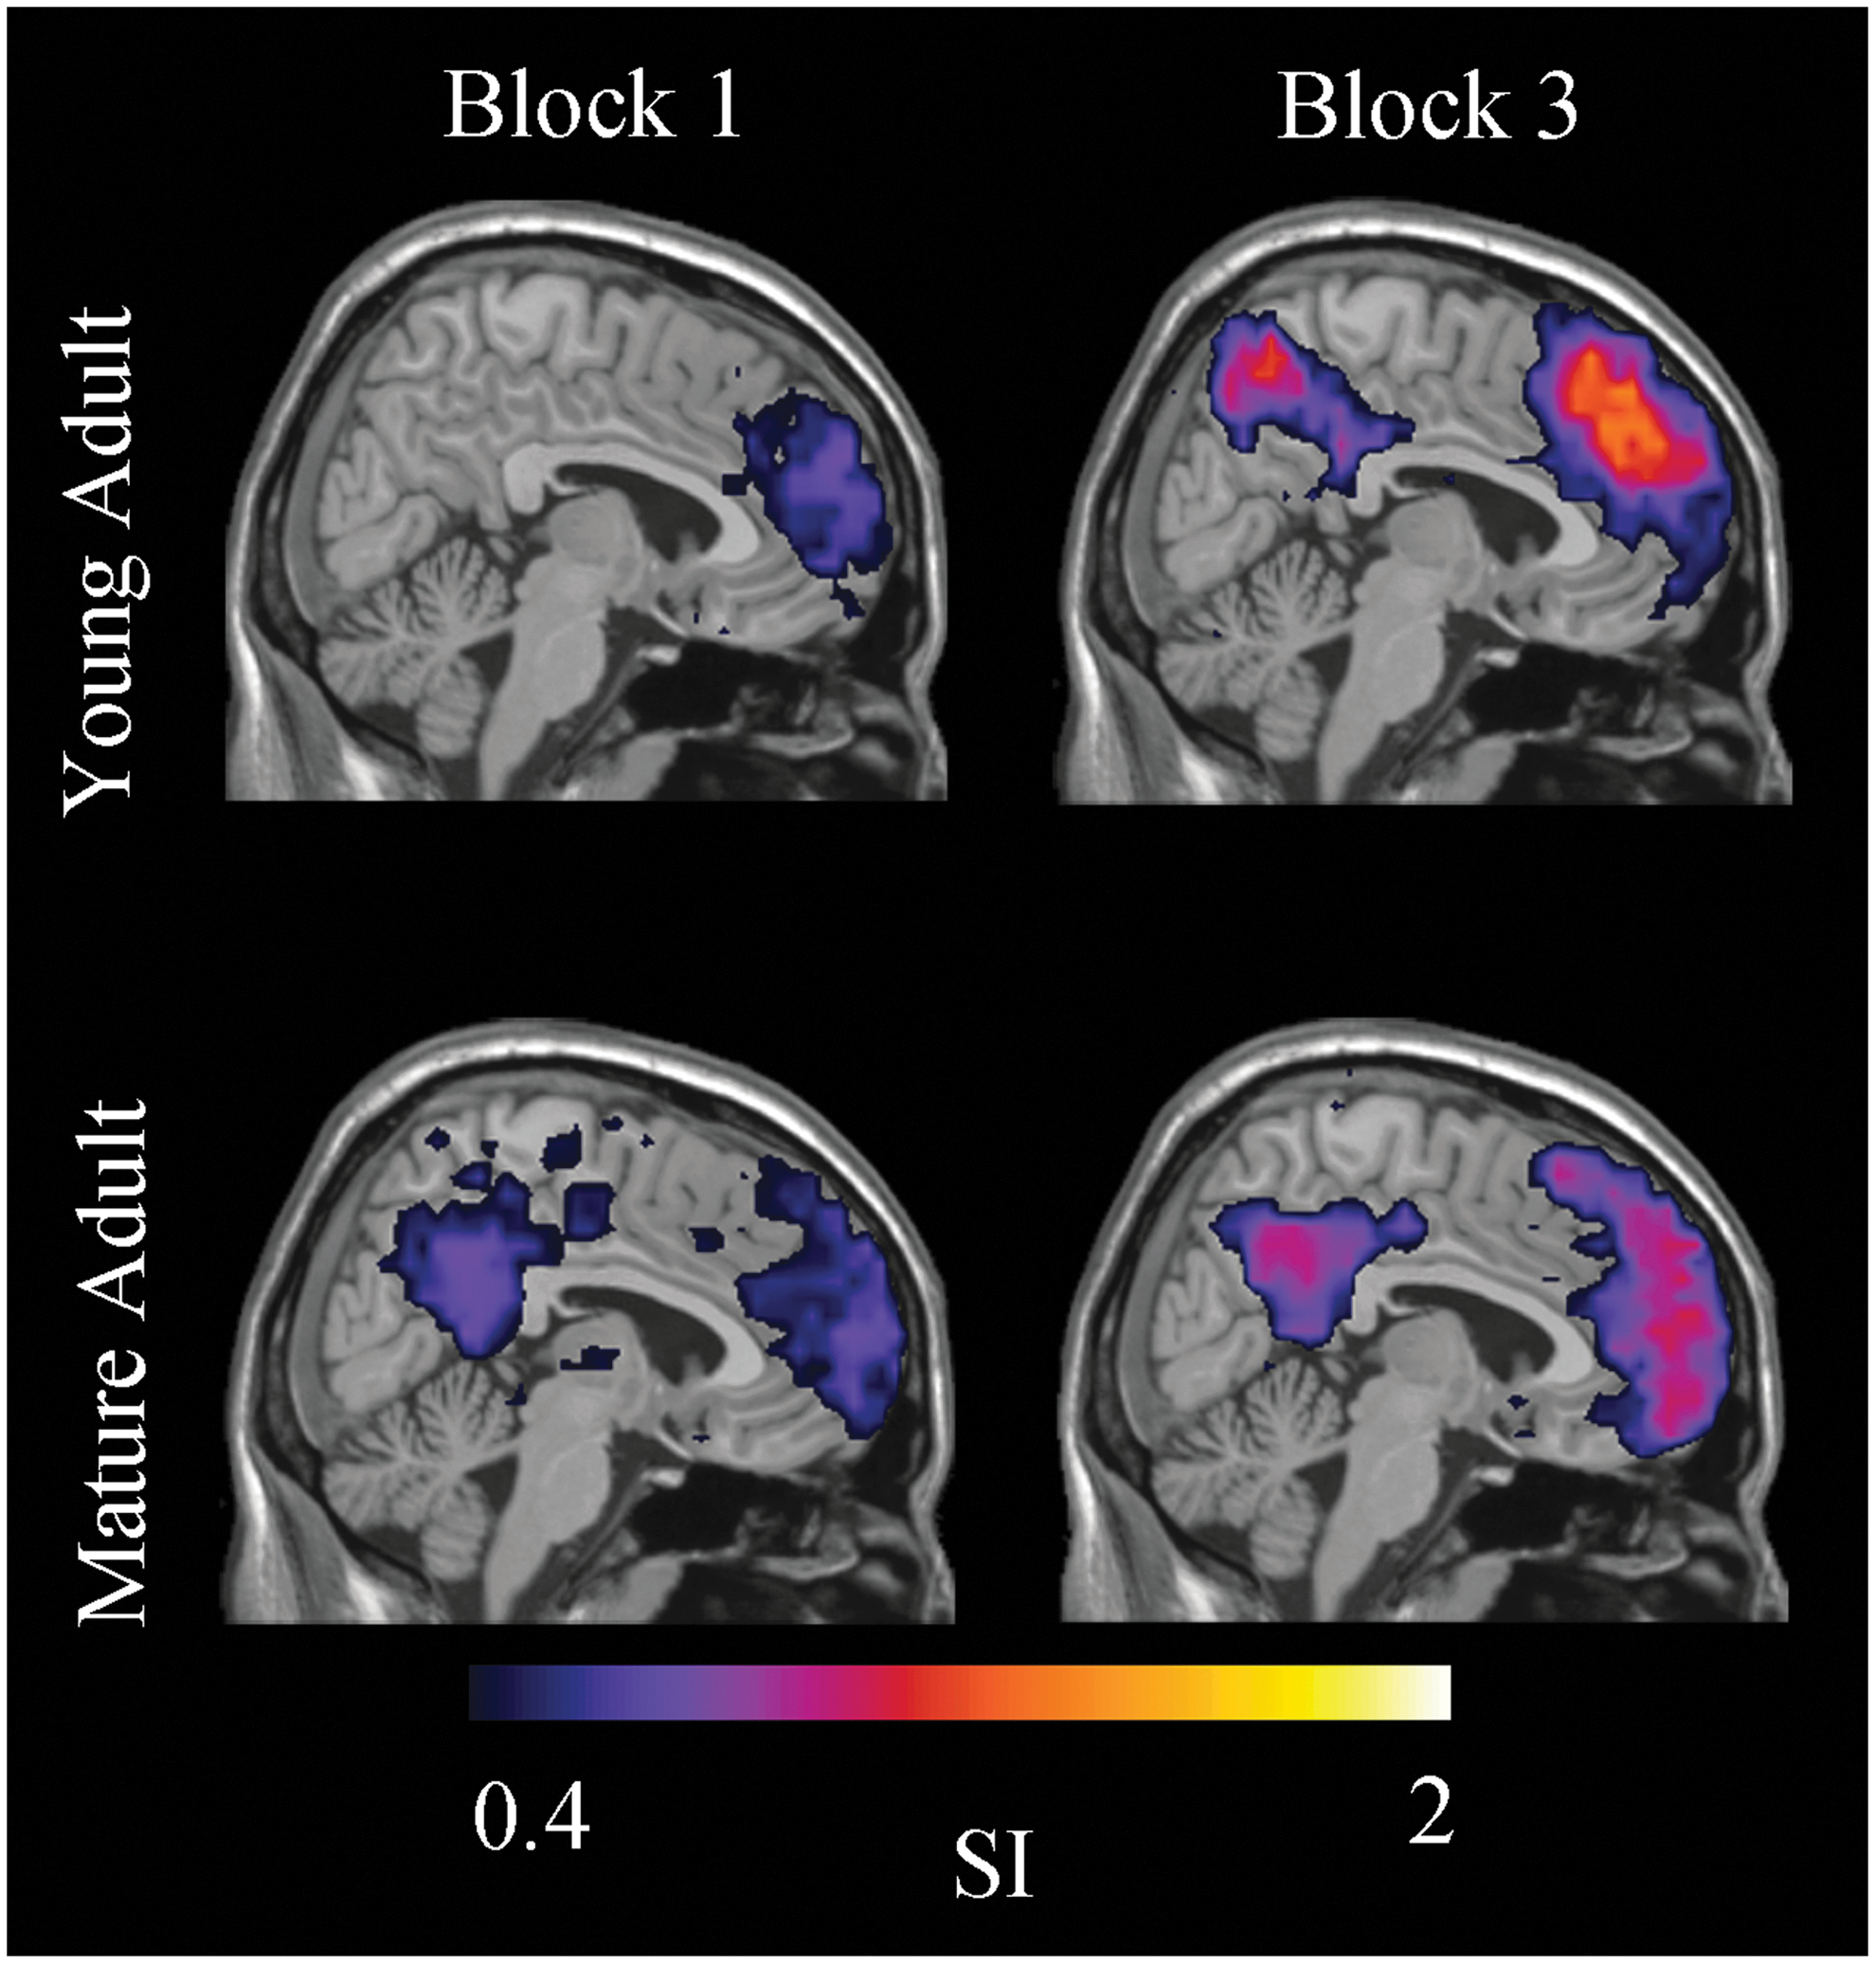
Medial prefrontal cortex (mPFC) functional community structure. In Block 1, the young adult mPFC community was confined. In mature adults, it was distributed and included the precuneus and posterior cingulate cortices. In Block 3, the mPFC community in young adults was no longer confined and like mature adults included the precuneus, posterior cingulate, and parietal cortices. Color images available online at
OFC functional community structure
OFC community consistency was negligible in young adults in Block 1 and mature adults in Blocks 1 and 3. OFC community consistency was, however, detected in young adults during successful IGT performance in Block 3 (Fig. 7). Previously published research on OFC neural activity has demonstrated the importance of the OFC to successful IGT performance (Bechara et al., 1994; Li et al., 2010). Together, these findings helped motivate further study of functional connectivity in the OFC. Given their successful performance, we hypothesized that young adults would drive a significant group difference in the change of functional connections within the OFC across Blocks 1 and 3. A positive average net change in functional connections within the OFC was observed in young adults. In mature adults, a negative average net loss of functional connectivity was observed [young adults mean new-lost OFC links±SE: 5342±18630 and mature adults mean new-lost OFC links: −23639±13021; one-tailed t-test, t (16)=1.8, p=0.11; Fig. 8]. This difference in new and lost OFC links showed a positive correlation with Net Score Difference [Pearson's R=0.41, one-tailed, p=0.04]. When examined separately, this relationship was not significant in either group [young adults Pearson's R=0.52, one-tailed, p=.07; mature adults Pearson's R=0.01, one-tailed, p=0.5]. Finally, the direct correlation between age and the change in links within the OFC was not found to be significant [Pearson's R=−0.29, two-tailed, p=0.25].
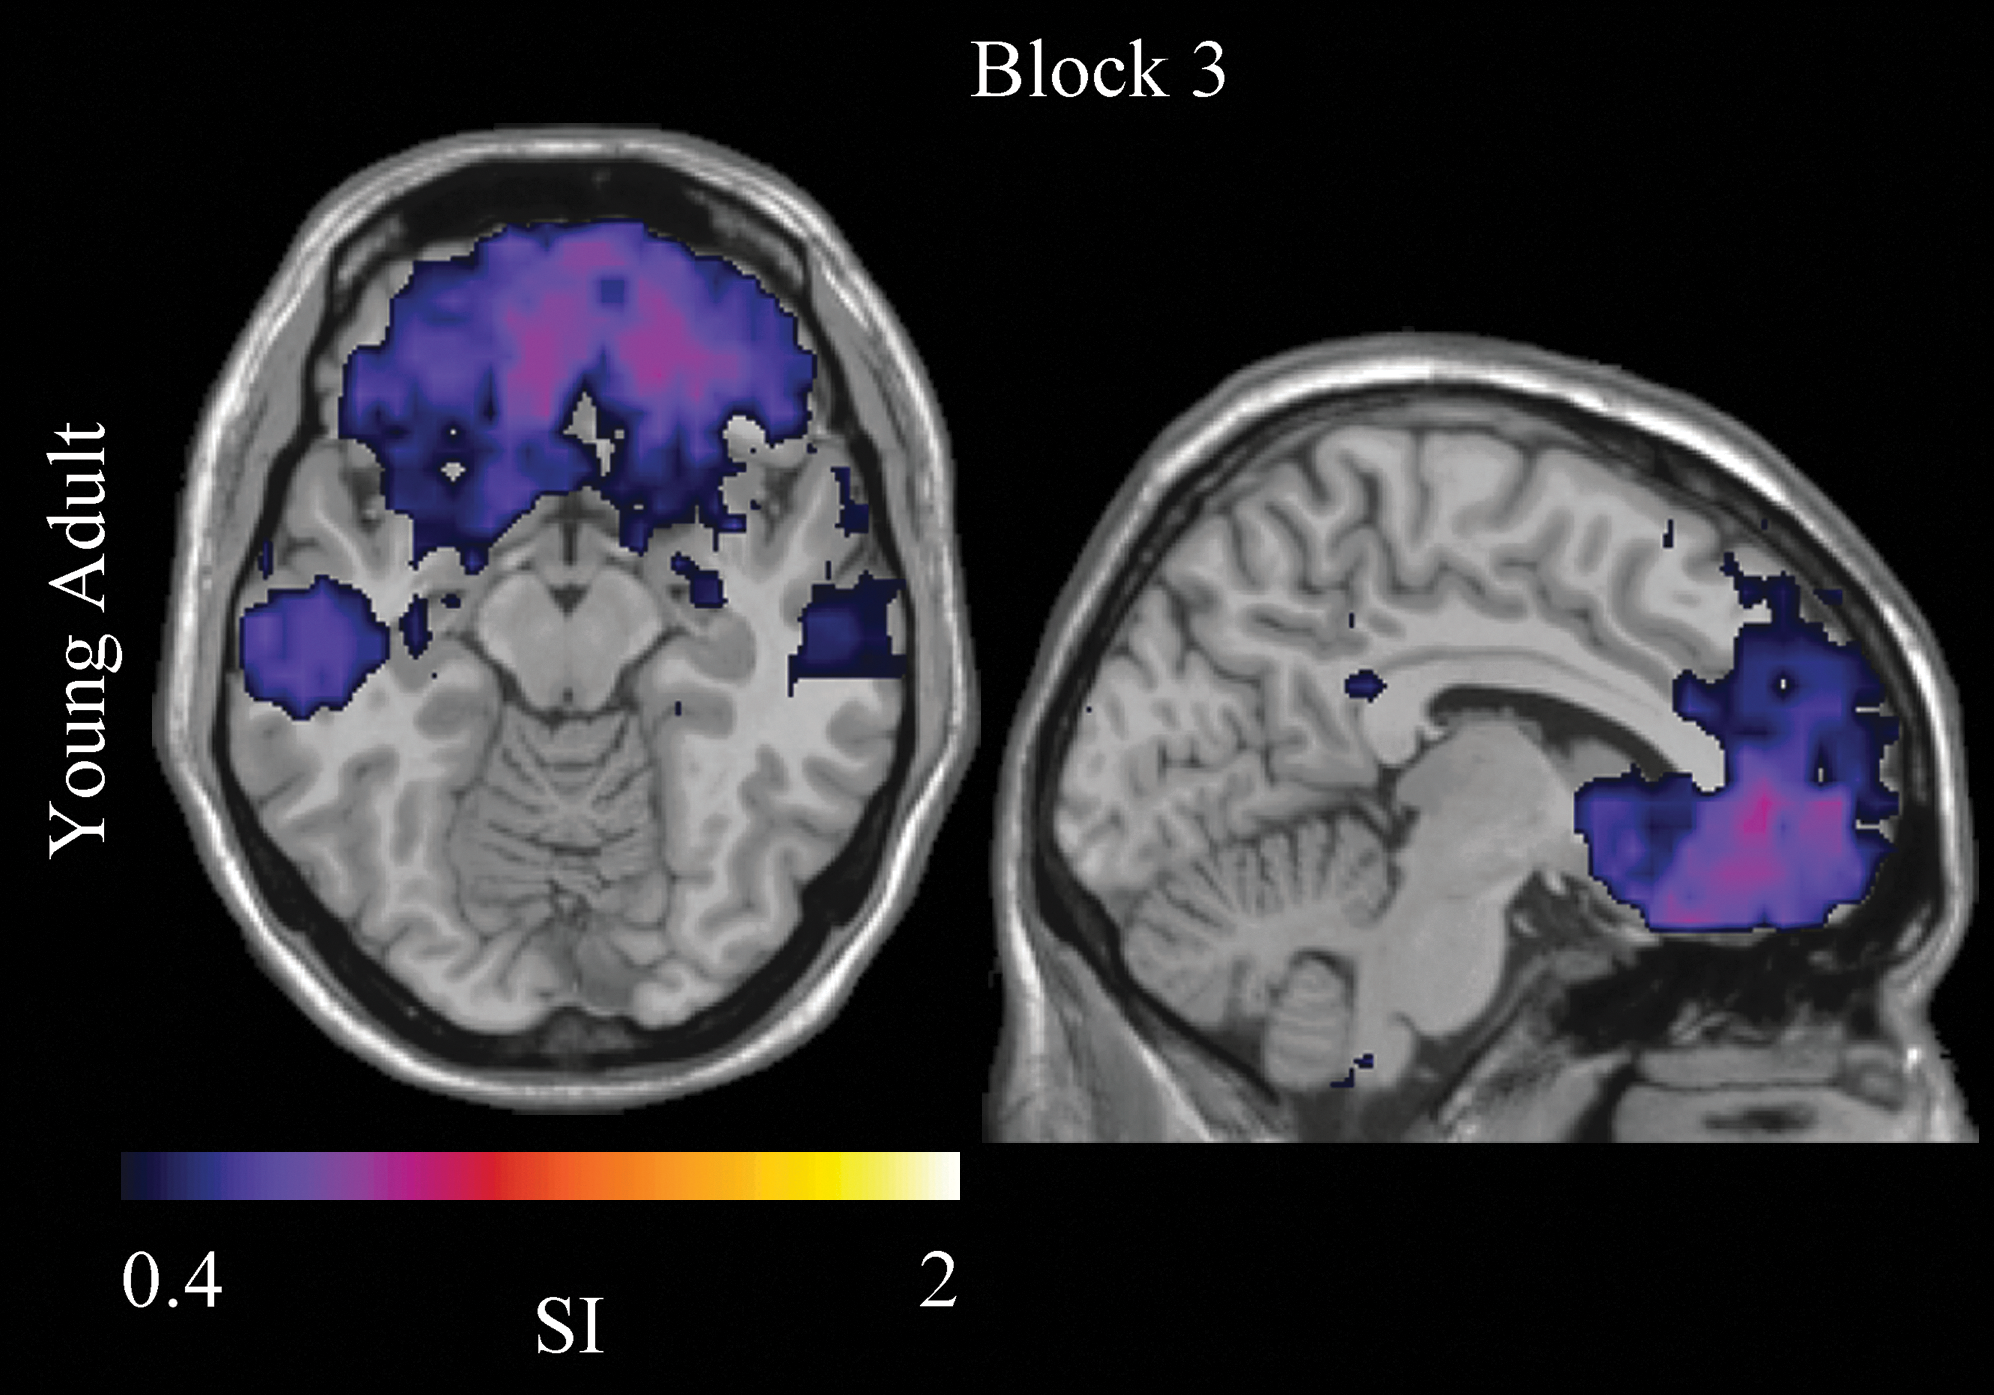
Orbitofrontal cortex (OFC) functional community structure. OFC community consistency was only detected in young adults during successful IGT performance in Block 3. Color images available online at
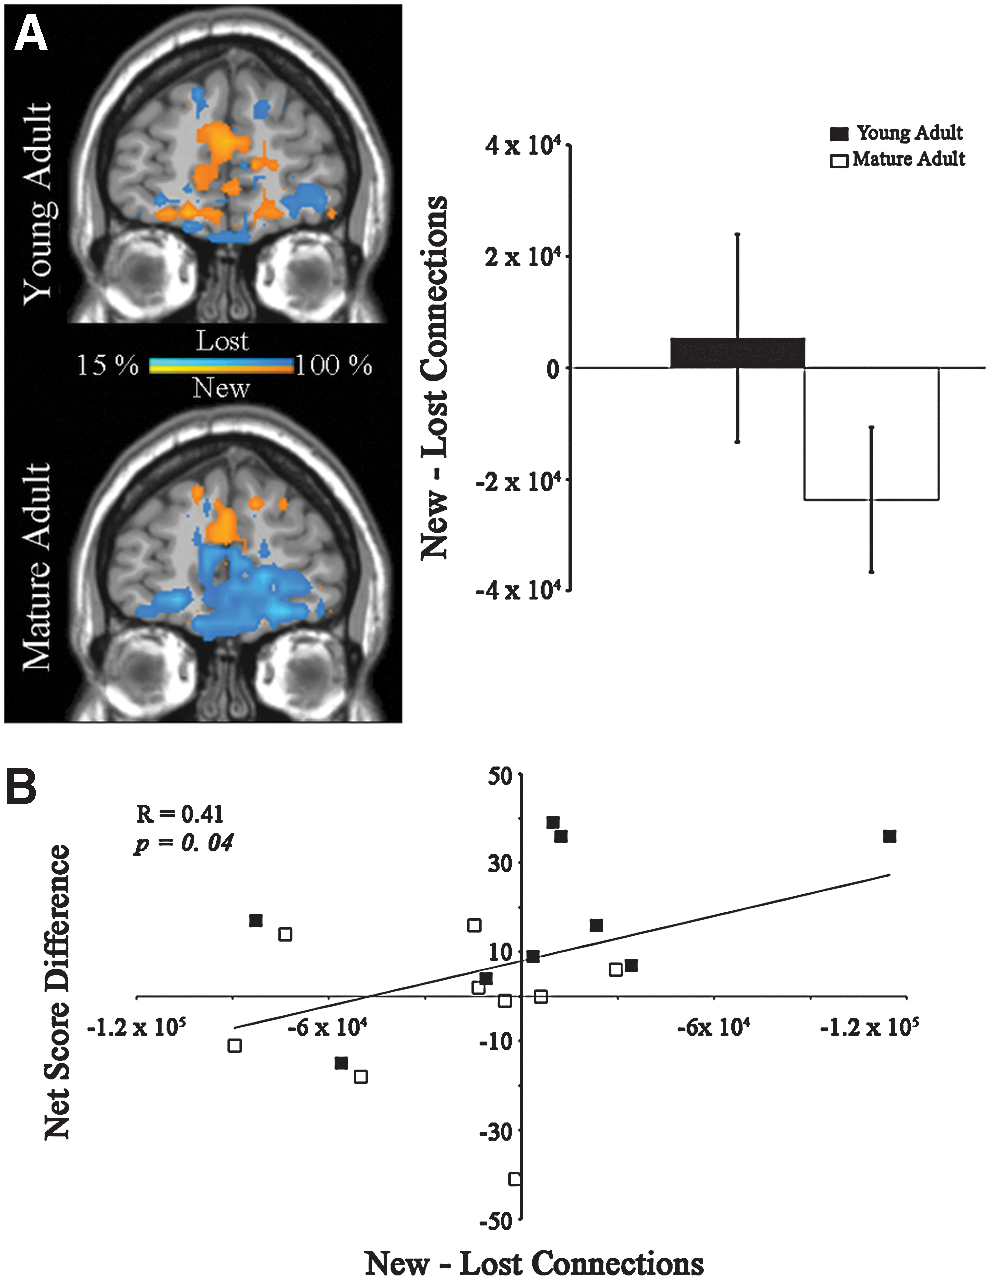
Change in connectivity in the OFC and relation to performance.
Discussion
In this study, we characterize age-related differences in decision-making behavior and underlying modular structure. To do this, fMRI data collected from young and mature adults throughout performance of the IGT was collected. Brain regions that commonly assembled into a module in either Blocks 1 or 3 were identified and the consistency of the associated functional community across individuals was measured.
IGT block performance
Despite similar performance in Block 1, young adults did significantly better than mature adults in Block 3. This finding is at odds with previous research based on participants of similar age to the mature adults in this study (Bechara et al., 1994; Li et al., 2010). However, literature on the effect of age on decision making, as it is measured by the IGT, is far from consistent (Mather, 2006). For example, studies have found the performance of older adults (≥65 years old) on the IGT to be no different than that of young adults (Lamar and Resnick 2004; Kovalchik et al., 2005; Wood et al., 2005) while others have shown age-related deficits in IGT performance relative to young (Fein et al., 2007; Isella et al., 2008; Rogalsky et al., 2012) and middle-aged adults (MacPherson et al., 2009).
Young and mature adults may have differed on IGT performance as a result of using alternative heuristics, or simple decision-making rules. For example, previous behavioral research on decision making has shown that younger individuals focus on the ultimate pay off when dealing with complex decisions (Besedeš et al., 2012). Relying on this rule can help promote optimal selections when the options are based on the probability of success. This same research has shown that middle and older aged adults tend to more heavily rely on tallying, which discards probability information, effectively treats all options as equal, and relies on the total number of positives that are attributed to a choice. It is important, however, to consider these and other issues, like gradual molecular (Brown and Ridderinkhof, 2009) and structural brain changes (Lamar and Resnick, 2004), when measuring age-related differences in decision making.
Brain network functional community structure
The IGT captures many critical features of making a decision in everyday life (e.g., risk under ambiguous and uncertain circumstances) and has offered a clinically relevant means of identifying poor decision making. Given the task's complexity, successful performance relies on both localized and distributive information processing. Modularity can be used to help identify intra- and inter-community connections that may mediate both of these distinct processes. Moreover, when applied to behavioral neuroimaging, it can be particularly useful for visualizing the functional substructures that emerge during task performance. By quantifying the consistency of a particular functional community across a group of individuals, we begin to identify sub-networks that may be universally pertinent to successful task performance and that are vulnerable to aging.
A main effect of age on visual ROI SI values was found. This shows that the visual community was less consistent in mature adults, particularly in Block 1 (i.e., exploratory phase). Participants in Block 1 were sampling and processing information about card contingencies for the first time and research has shown that increases in age result in increases in overall processing time (Salthouse, 1996). If while trying to establish a strategy mature adults focused on different stimuli for longer, varied patterns of interconnectivity would help explain an age-related decrease in visual community consistency. In support of this are performance findings in the Delayed Match to Sample task, which is commonly used as a measure of visual attention. Age-related differences in the 2 and 4-sec conditions suggest that differences in attention exist and that they could potentially affect visual community organization. A main effect of block on sensorimotor ROI SI values was also found and showed that consistency in Block 3 was greater than Block 1for both adult groups. Participants in Block 3 had been repeatedly exposed to card contingencies and were presumably exploiting a strategy. Brain regions that functionally disassociated from the sensorimotor cortex after a strategy had been firmly established may account for this block-related increase in consistency.
Main effects of age, block, and an age×block interaction on SI values within the mPFC ROI were found. In addition to this, Figure 6 shows an age-related difference in mPFC community organization. In Block 1, a confined mPFC community was present in young adults. In mature adults, however, the mPFC community was interconnected with the precuneus and portions of the parietal lobes. These regions are commonly ascribed to the default mode sub-network (Raichle et al., 2001; Shirer et al., 2012), and emerged as a functional community with higher consistency across individuals in both adult groups in Block 3. These findings help point to functional arrangements that are important to successful task performance and that change as a function of age. For instance, learning to avoid decks with exceedingly large but infrequent loss is critical to successful IGT performance. A self-connected mPFC community in young adults in Block 1 may represent regional specialization and enable successful integration of loss magnitude into a strategy. To support this, research has shown that mPFC neural activity in response to loss information is positively related to successful IGT performance (Wesley et al., 2011).
Previous research has demonstrated that activity within the OFC is associated with successful performance on the IGT task (Bechara et al., 1994; Li et al., 2010). In these data, OFC community consistency was negligible in young adults in Block 1 and mature adults in Blocks 1 and 3. OFC community consistency was, however, detected in young adults during successful IGT performance in Block 3. Although inconsistently organized for much of the task, we showed that changes in OFC connectivity (new—lost links) were in fact related to successful IGT performance.
These findings address age-related differences in decision making and functional community structure at the whole-brain level. They extend previous work focused on the function of the frontal lobe and show that advantageous decision making is associated with distinct changes in functional community structure. Many clinical populations are afflicted with poor decision-making skills, including the aging demographic and those with neuropsychiatric disorders like the vulnerability to alcohol and/or drug addiction. Identifying profiles of whole-brain functional connectivity that are associated with advantageous decision making may help direct behavioral therapy research and potentially identify brain regions that can serve as novel pharmacological targets.
Footnotes
Acknowledgments
The Wake Forest Older Americans Independence Center (P30 21332), Sticht Center on Aging, National Institute on Alcohol Abuse and Alcoholism (AA007565; AA021639), Drug Abuse (DA020074) and Neurological Disorders, and Stroke (NS070917) supported this work.
Author Disclosure Statement
No competing financial interests exist.
References
Supplementary Material
Please find the following supplemental material available below.
For Open Access articles published under a Creative Commons License, all supplemental material carries the same license as the article it is associated with.
For non-Open Access articles published, all supplemental material carries a non-exclusive license, and permission requests for re-use of supplemental material or any part of supplemental material shall be sent directly to the copyright owner as specified in the copyright notice associated with the article.