
Abstract
A cortico-limbic network consisting of the amygdala, medial prefrontal cortex (mPFC), and ventral striatum (vSTR) has been associated with altered function in emotional disorders. Here we used rapidly sampled functional magnetic resonance imaging and Granger causality analyses to assess the directional connectivity between these brain structures in a sample of healthy and age-matched participants endorsing moderate to severe depressive symptomatology as they viewed a series of natural scene stimuli varying systematically in pleasantness and arousal. Specifically during pleasant scene perception, dysphoric participants showed reduced activity in mPFC and vSTR, relative to healthy participants. In contrast, amygdala activity was enhanced to pleasant as well as unpleasant arousing scenes in both participant groups. Granger causality estimates of influence between mPFC and vSTR were significantly reduced in dysphoric relative to control participants during all picture contents. These findings provide direct evidence that during visual perception of evocative emotional stimuli, reduced reward-related activity in dysphoria is associated with dysfunctional causal connectivity between mPFC, amygdala, and vSTR.
Introduction
Investigations of depression etiology implicate deficits in the processing of rewarding stimuli (Disner et al., 2011; Forbes and Dahl, 2011; Murray et al., 2010; Pizzagalli et al., 2009; Robinson et al., 2012), with a focus on interactions between ventral striatum (vSTR), medial prefrontal cortex (mPFC), and amygdala. Research findings suggest that aberrations of response of mesolimbic structures and amygdala are highly variable across experimental paradigms, with studies reporting relative increases, decreases, and null differences in activation in depressive participants relative to control groups (Anand et al., 2005; Dannlowski et al., 2009; Fales et al., 2008; Fleck et al., 2010; Fu et al., 2004; Rich et al., 2006; Siegle et al., 2007; Townsend et al., 2010).
The inconsistency of reported differences in emotion-related activation between symptomatic and control participants may reflect the nature of the network mechanisms involved in depressive symptoms. Specifically, while the structural and functional linkages between these structures are well established in the animal model (Barbas, 2002; Cardinal et al., 2002; Price, 2007; Tekin and Cummings, 2002), the degree of influence exerted by human mPFC on subcortical vSTR and amygdala is difficult to capture using standard functional imaging protocols and analyses. Increased temporal resolution and the application of causal time series analyses may help to clarify the interrelationships among these brain structures in the human. In the framework of Granger causality (GC), one measured process is said to be causal to a second if the predictability of the second process at a given time point is improved by including measures from the history of the first process. Granger-based algorithms in time and frequency domains have been used widely to study neural connectivity (Bressler and Seth, 2011; Brovelli et al., 2004; Goebel et al., 2003; Keil et al., 2009).
The variability of reported effects may also be partially attributable to experimental paradigms that involve either pleasant or unpleasant emotional processing tasks, but rarely both. In the current design, the inclusion of pleasant and unpleasant stimuli will enable potential reward system reactivity effects driven by pleasant stimuli to be attributable to pleasantness, without a confound of emotional intensity. Moreover, the use of experimental stimuli that are varied as a function of emotional arousal within pleasant and unpleasant valences may allow a more specific characterization of the nature of affective anomalies in dysphoria. Finally, despite our focus on reward-related reactivity, the use of pleasant and unpleasant stimuli, balanced as well as varied as a function of emotional intensity, may allow us to identify potential reactivity differences during unpleasant picture perception, should they exist.
Aiming to systematically examine the roles of stimulus valence and intensity in emotional processing in dysphoria, we present a range of pleasant and unpleasant picture stimuli, divided into moderately and highly arousing categories, as well as neutral pictures during rapid functional magnetic resonance imaging (fMRI) scanning of midline structures implicated in the appetitive circuit, including amygdala, vSTR, and mPFC. Male participants were recruited to bolster the rewarding impact of highly arousing images of erotica (Bradley et al., 2001; Sabatinelli et al., 2004). Half of the sample was selected based on the endorsement of elevated and clinically significant symptoms of depression.
If depressive symptomology is associated with deficits in the processing of rewarding stimuli, we expect to identify decreased blood oxygen level-dependent (BOLD) signal in reward-related vSTR and mPFC (Costa et al., 2010; Sabatinelli et al., 2007) in these participants. If symptomatic participants are instead (or in addition) hypersensitive to aversive stimuli, we would expect to identify exaggerated BOLD signal in amygdala (Sabatinelli et al., 2005, 2009; Vuilleumier, 2005). Using GC analyses (Dhamala et al., 2008; Goebel et al., 2003; Keil et al., 2009) we will explore group differences in causal influence between these three structures. If depression is associated with reduced medial prefrontal input to subcortical structures (Mayberg, 2009; Price and Drevets, 2010), we expect to reveal weaker causal coefficients in this direction specific to the symptomatic group.
Materials and Methods
Participants and procedure
Twenty male undergraduate students at the University of Florida participated in the experiment for course credit or $20 compensation. All volunteers consented to participate after reading a description of the study, approved by the local human subjects review board. Participants first provided ratings of pleasantness/unpleasantness and arousal of the experimental picture stimuli. Before entering the bore of the Philips 3T Achieva MR scanner, participants were fitted with earplugs and given a patient-alarm squeezeball. A vacuum pillow, padding, and explicit verbal instruction were used to limit head motion. Two participants' data were unusable because of excessive head motion; thus, 18 participants remained in the final sample. Nine of these participants (average age 19.8 years, standard deviation [SD] 1.4) were selected based on the endorsement of moderate to severe depression on the Beck Depression Inventory (BDI-II) (Beck et al., 1996) (minimum score 18, average 26.33, SD 10.06), given in a screening of all introductory psychology students. The remaining 9 participants (average age 21.7 years, SD 3.9) reported depressive symptoms in the normative range (average 0.55, SD 0.76). The groups did not reliably differ in age, and no participants were taking any medication or in the process of treatment.
Stimuli
Participants were asked to maintain fixation on a dot at the center of a 10-inch video monitor mounted directly behind the head (25° visual angle), visible via a coil-mounted mirror (IFIS Hardware). After 3 acclimation trials in which checkerboard stimuli were presented, a series of 50 picture stimuli were presented in an event-related design. The grayscale picture stimuli (see Table 1) depicted 10 exemplars each across 5 content categories, including (1) highly arousing pleasant (erotic couples and clothed romantic couples), (2) moderately arousing pleasant (adventure scenes, happy families), (3) neutral (people in routine activities, land, and cityscapes), (4) moderately arousing unpleasant (disgust scenes, predator animals), and (5) highly arousing unpleasant (interpersonal threat, mutilations). Picture categories were matched for luminance and 90% quality JPEG file size (as a rough gauge of perceptual complexity) using Adobe Photoshop. Each picture was presented for 3 sec with fixation, followed by a 12 sec fixation-only period. Picture order was pseudo-randomized, allowing no more than 2 successive presentations of a content category.
Normative (Lang et al., 2008) and Sample Group Valence and Arousal Ratings (Standard Deviation in Parentheses) of Each Picture Stimulus Category
HA, High Arousing; IAPS, International Affective Picture System; MA, Moderate Arousing.
Scanning parameters
Once participants were comfortable inside the bore, an 8 min T1-weighted structural volume collected 160 sagittal slices, with 1 mm isotropic voxels in a 256 mm field of view. After structural acquisition, a midline functional prescription included 8 sagittal slices (7 mm thick, 1 mm gap), extending laterally±27.5 mm to cover the amygdalae. Gradient-echo, echo planar images were collected twice a second for 12.5 min, resulting in 1500 volumes across the picture series (500 msec repeat time, 30 msec echo time, 70° flip angle, 180 mm field of view, 64×64 matrix). This focused prescription enables relatively high temporal resolution while sampling the structures of interest, including mPFC, vSTR, and amygdala.
Preprocessing and region of interest identification
Each participant's functional image data were 3D motion-corrected, linearly detrended, highpass-filtered at 0.02 Hz (50 sec), and smoothed with a 2-voxel spatial filter using BrainVoyager QX. Trials (<3%) containing unacceptable head motion were excluded from further analyses. All participants' image data were transformed into Talairach coordinate space (Talairach and Tornoux, 1988).
To identify structures of interest known to vary with stimulus valence (mPFC, vSTR) (Sabatinelli et al., 2007) and stimulus arousal (amygdala) (Sabatinelli et al., 2005), a random-effects ANOVA was tested with two orthogonal contrasts. The first contrast identified clusters of voxels with a BOLD signal that varied as a function of rated stimulus pleasantness (Pleasant High Arousing [HA]>Pleasant Moderate Arousing [MA]>Neutral>Unpleasant MA>Unpleasant HA). A second contrast identified clusters with a BOLD signal that varied as a function of rated stimulus arousal (Pleasant HA, Unpleasant HA>Pleasant MA, Unpleasant MA>Neutral). The resulting maps were thresholded with a minimum cluster size of 162 μL (equivalent to 3 contiguous voxels at acquired volume) and a minimum false discovery rate (FDR) alpha level of p<0.05 (Genovese et al., 2002).
Regions of interest (ROIs) identified in the group volume were applied to each participant, and included all individually significant (FDR<0.05) voxels from a 250 μL cluster in each structure of interest, including bilateral Amyg, vSTR, and mPFC. The pattern of activity in each ROI across picture category was compared between groups in a mixed-model ANOVA, focusing on interactions between subject group and valence-driven activity in mPFC and vSTR, and arousal-driven activity in amygdala.
Granger causality analyses
The 1500-point time series of all ROIs from all participants were segmented into epochs (trials) based on the onset times of the stimuli. After removing the stimulus-triggered ensemble average from each trial waveform, the resulting trials from all participants were entered into GC spectral analysis (Ding et al., 2006; Geweke, 1982) to identify the overall frequency, degree, and direction of causal influences between the ROIs. GC spectra can be estimated by parametric and nonparametric methods (Dhamala et al., 2008). Here, we applied the parametric method to these fMRI trials after we assessed the optimal model order for autoregressive modeling. We determined the optimal model order for the parametric method by comparing the power spectra from the nonparametric and parametric approaches at different model orders and choosing the model order yielding the lowest power difference. The spectral GC from ROI l to ROI m is defined as follows (Dhamala et al., 2008; Ding et al., 2006):
where S is power spectra, H is transfer function, and Σ is noise covariance.
The significant peaks in the GC spectra were defined by setting a GC threshold above the random-noise baseline at significance p<0.001. To find this threshold, we computed GC from 250 surrogate data sets that were constructed by randomly shuffling trials across ROIs and participants, and evaluated the distribution of maximum GC values (Dhamala et al., 2008). The threshold was thus based on the null hypothesis that there was no statistical interdependence between nodes when trials were randomized. After identifying significant peaks in the causality spectra, the causality spectra within the frequency band of interest were integrated over the frequency band to compute the overall band-specific GC:
where f 2 − f 1 is the frequency interval (band) of interest.
Results
Functional activity: emotional arousal contrast
Clusters of activity associated with increasing stimulus arousal (Table 2) included bilateral occipitotemporal and posterior parietal visual cortex, the medial dorsal nucleus of the thalamus, the superior colliculi/lateral geniculate, bilateral amygdala, and inferior frontal gyrus. The amygdala clusters and BOLD signal time course across all participants by content category are shown in Figure 1. Amygdala BOLD signal change between 4 and 8 sec postpicture onset in each participant (Fig. 1) was entered into a mixed Group X picture Category ANOVA. Both groups showed an equivalent pattern of enhanced amygdala activity during arousing picture perception [Group interaction F<1; Control F(4, 32)=4.07, p<0.05; Quadratic F(1, 8)=9.00, p<0.05; Dysphoric F(4, 32)=2.72, p<0.05; Quadratic F(1, 8)=11.77, p<0.01].
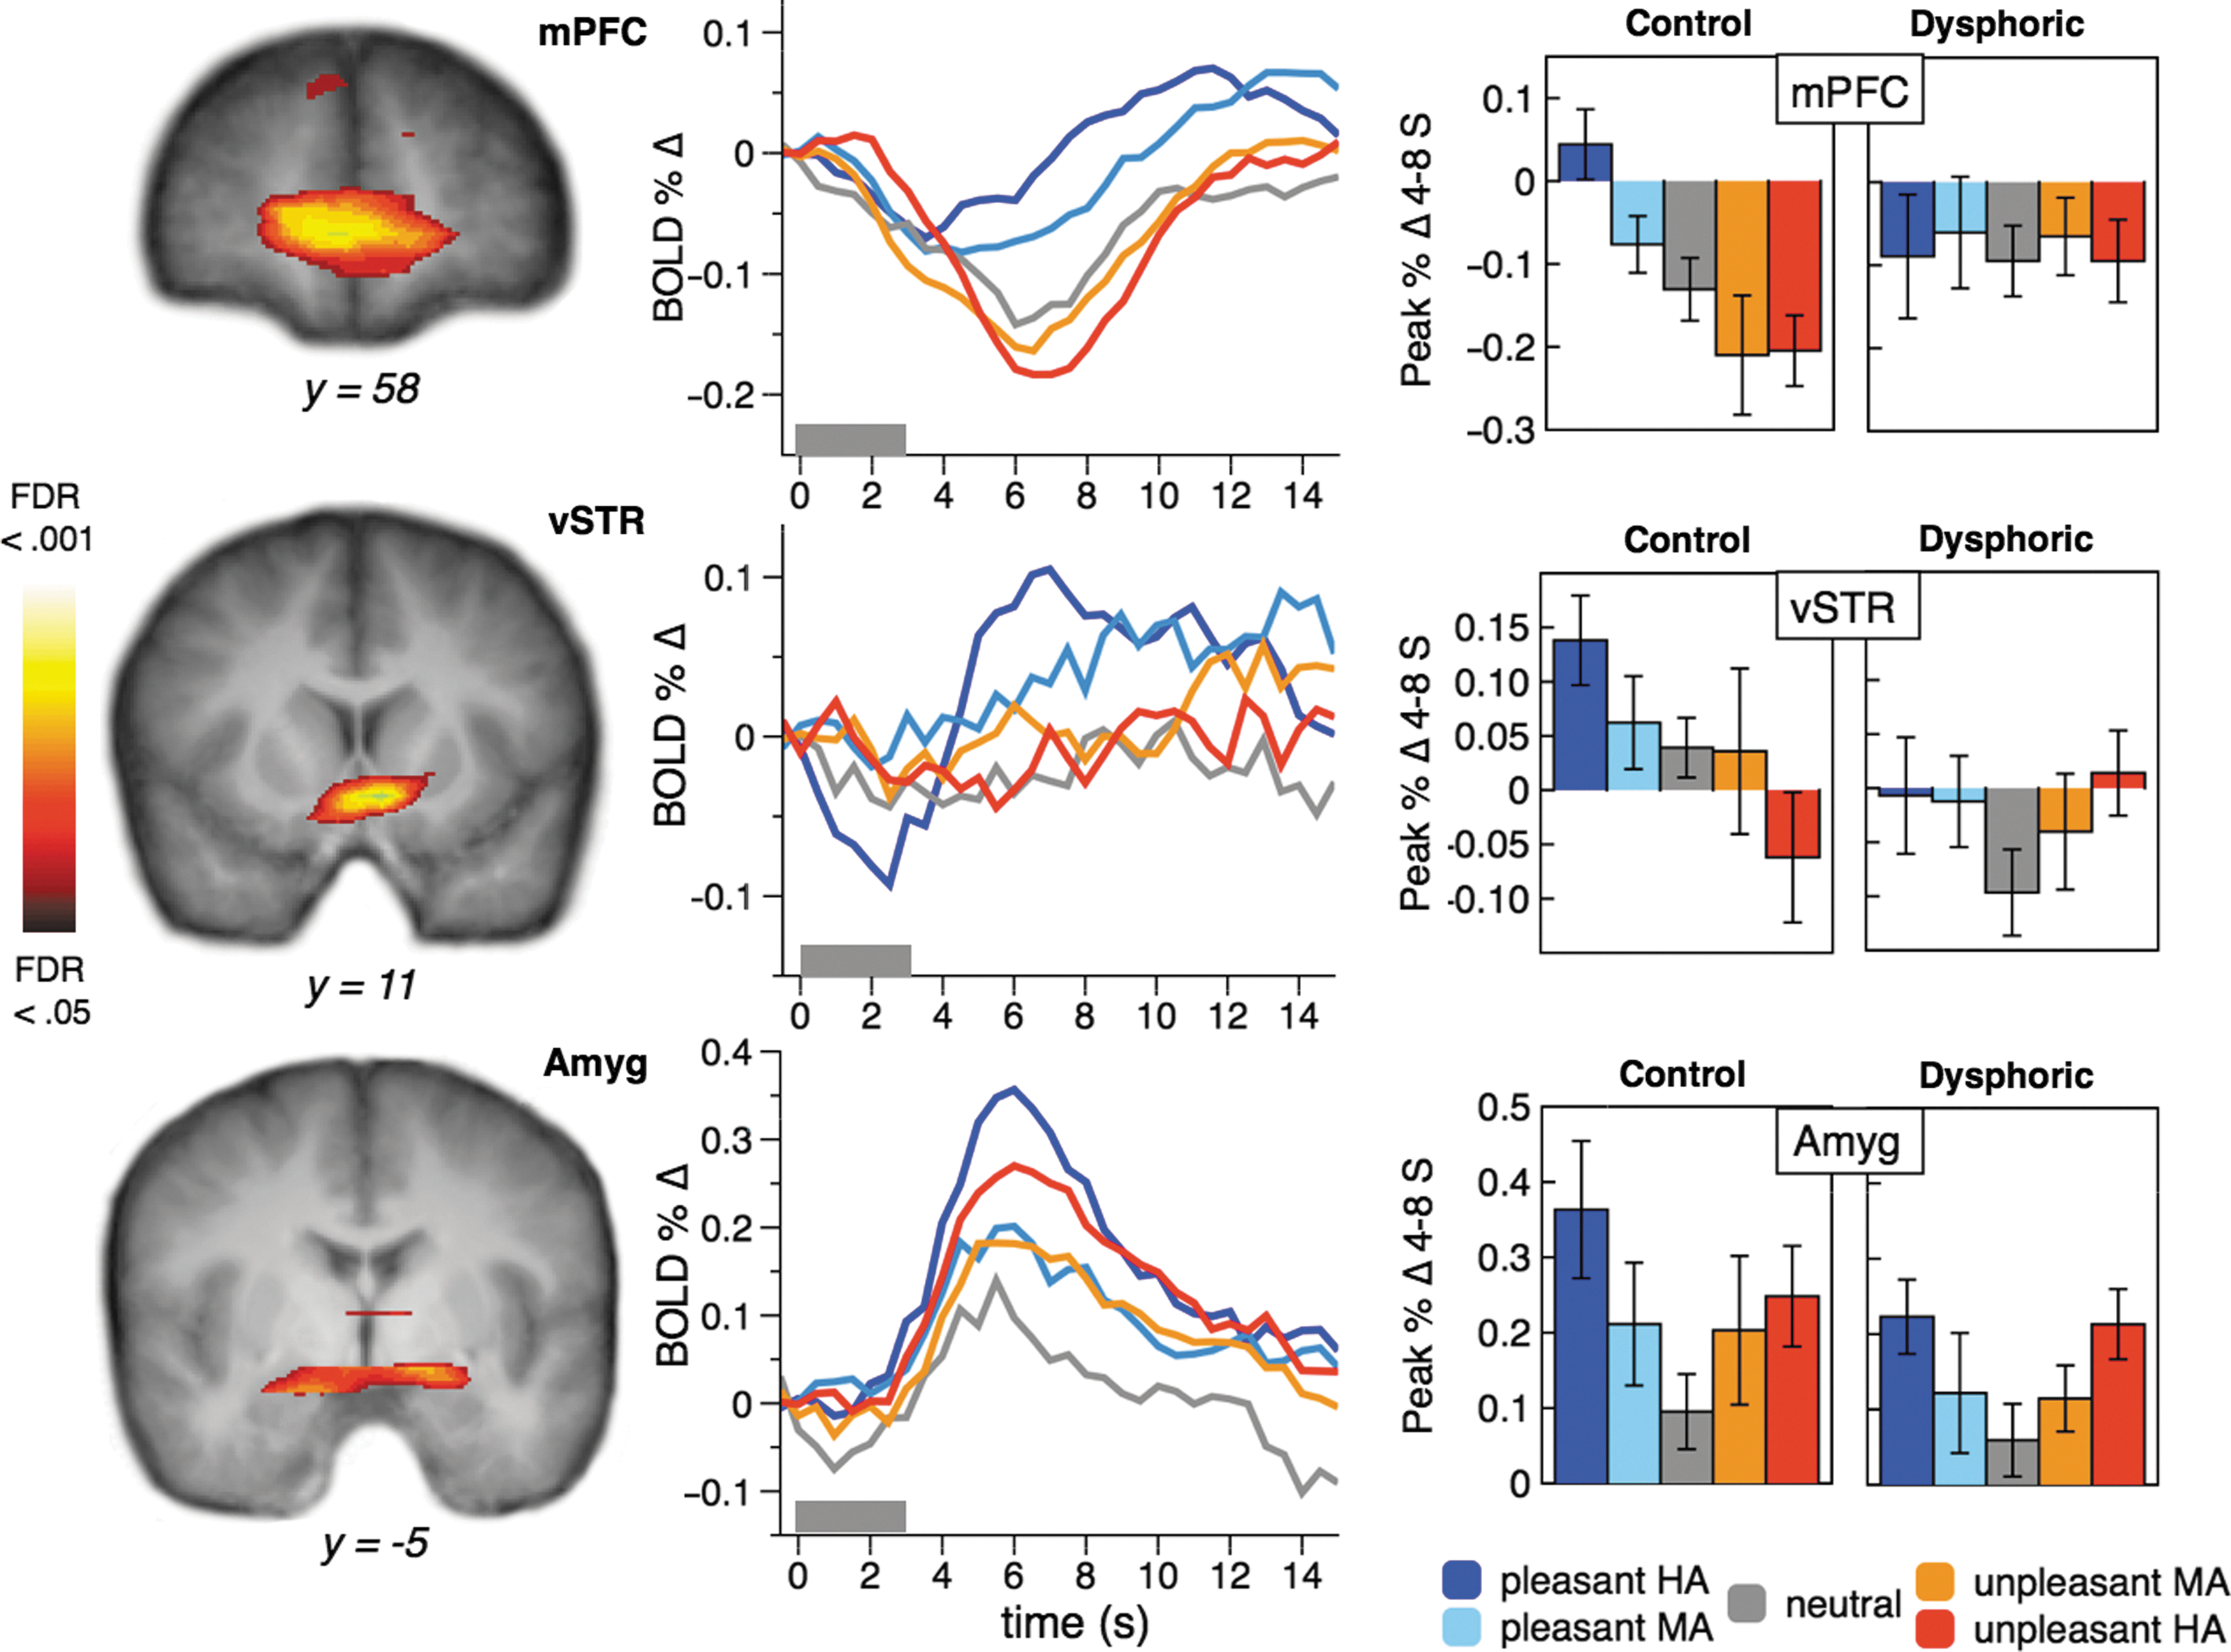
Significant mPFC and vSTR clusters associated with increasing stimulus pleasantness, and significant amygdala activity associated with increasing stimulus arousal, with the time course of activity in percent signal change from baseline. Pleasant stimuli are shown in blue (highly arousing) and light blue (moderately arousing). Neutral stimuli are shown in gray, and unpleasant stimuli are shown in red (highly arousing) and orange (moderately arousing). Gray bars at the x-axis represent the picture stimulus period. Bar graphs represent average BOLD signal change from 4 to 8 sec after picture onset, deviated from pre-picture baseline, for each participant group and stimulus category. Error bars represent standard errors of the mean. BOLD, blood oxygen level-dependent; mPFC, medial prefrontal cortex; vSTR, ventral striatum.
Significant Clusters of Activation Associated with Increasing Stimulus Arousal Across the Total Sample Are Listed, with Talairach and Tournoux (1988) Coordinates and Volume
MDN, mediodorsal nucleus.
Functional activity: pleasantness contrast
Clusters associated with increasing stimulus pleasantness (Table 3) included the precuneus/posterior cingulate, ventro-mPFC (vmPFC), mPFC, vSTR, anterior cingulate, and left amygdala. The mPFC and vSTR clusters and their BOLD signal time courses by content category are shown in Figure 1. A significant interaction was identified between Group and Category mPFC BOLD signal change between 4 and 8 sec post-picture onset [F(4, 64)=2.95, p<0.05; Group X Category linear F(1, 16)=6.96, p<0.05] with Control participants showing a reliable effect of picture content [F(4, 64)=7.88, p<0.01; linear F(1, 8)=26.00, p<0.01], while dysphoric participants showed no modulation of mPFC activity by Category or linear trend (Fs<1). The vSTR cluster (Fig. 1) Group by Category interaction was marginal [F(4, 64)=2.08, p<0.10; Group X Content linear F(1, 16)=3.53, p<0.10], with Control participants showing a reliable effect of picture content [F(4, 32)=2.62, p<0.05; Linear F(1, 8)=5.78, p<0.05], while the Dysphoric participants' vSTR activity did not differ as a function of stimulus Category or show a reliable trend (Fs<1).
Significant Clusters of Activation Associated with Increasing Stimulus Pleasantness Across the Total Sample Are Listed, with Talairach and Tournoux (1988) Coordinates and Volume
PFC, prefrontal cortex.
Time series analyses
GC analyses were used to estimate the strength of 6 causal relationships between mPFC, vSTR, and amygdala for each participant, across the 1500 time point stimulus series. The spectrum of GC reflected a bimodal distribution with peaks at lower (0.067–0.45 Hz) and higher (0.55–0.95 Hz) frequency ranges. While the pattern of results was essentially consistent across bands, we chose to report the lower range of available frequencies in an attempt to maximize the reliability of the GC analyses, as we felt most confident interpreting the slower range for which we had greater number of sample points per oscillation, and thus less chance of aliasing. Each of the 3 regions showed significant bidirectional influence on each other (a p<0.001 threshold was identified at GC coefficients >0.103). The GC coefficients were entered into a mixed 2×6 ANOVA including Groups (Control, Dysphoric) and Region/Influence Target (mPFC>amygdala, mPFC>vSTR, vSTR>amygdala, vSTR>mPFC, amygdala>mPFC, and amygdala>vSTR). A between-Group effect [F(1, 16)=14.70, p=0.001] reflected weaker GC coefficients across all 6 Regions/Influence Targets in the dysphoric group (Fig. 2). Inspection of the GC means suggests that the overall group effect is most evident in connectivity between mPFC and vSTR. Indeed, individual 2×2 ANOVAs of mPFC and vSTR yielded clear Group differences in influence strength [F(1, 16)=11.66, p=0.004, (F(1, 16)=8.76, p=0.009], while an ANOVA including Group and the 2 amygdala GC estimates indicated no significant difference [F(1, 16)=3.01, p=0.102]. No interaction effects of Group and Influence Target approached significance. Thus, relative to the controls, dysphoric participants showed evidence of weaker modulatory influence of mPFC and vSTR on each other and on amygdala.
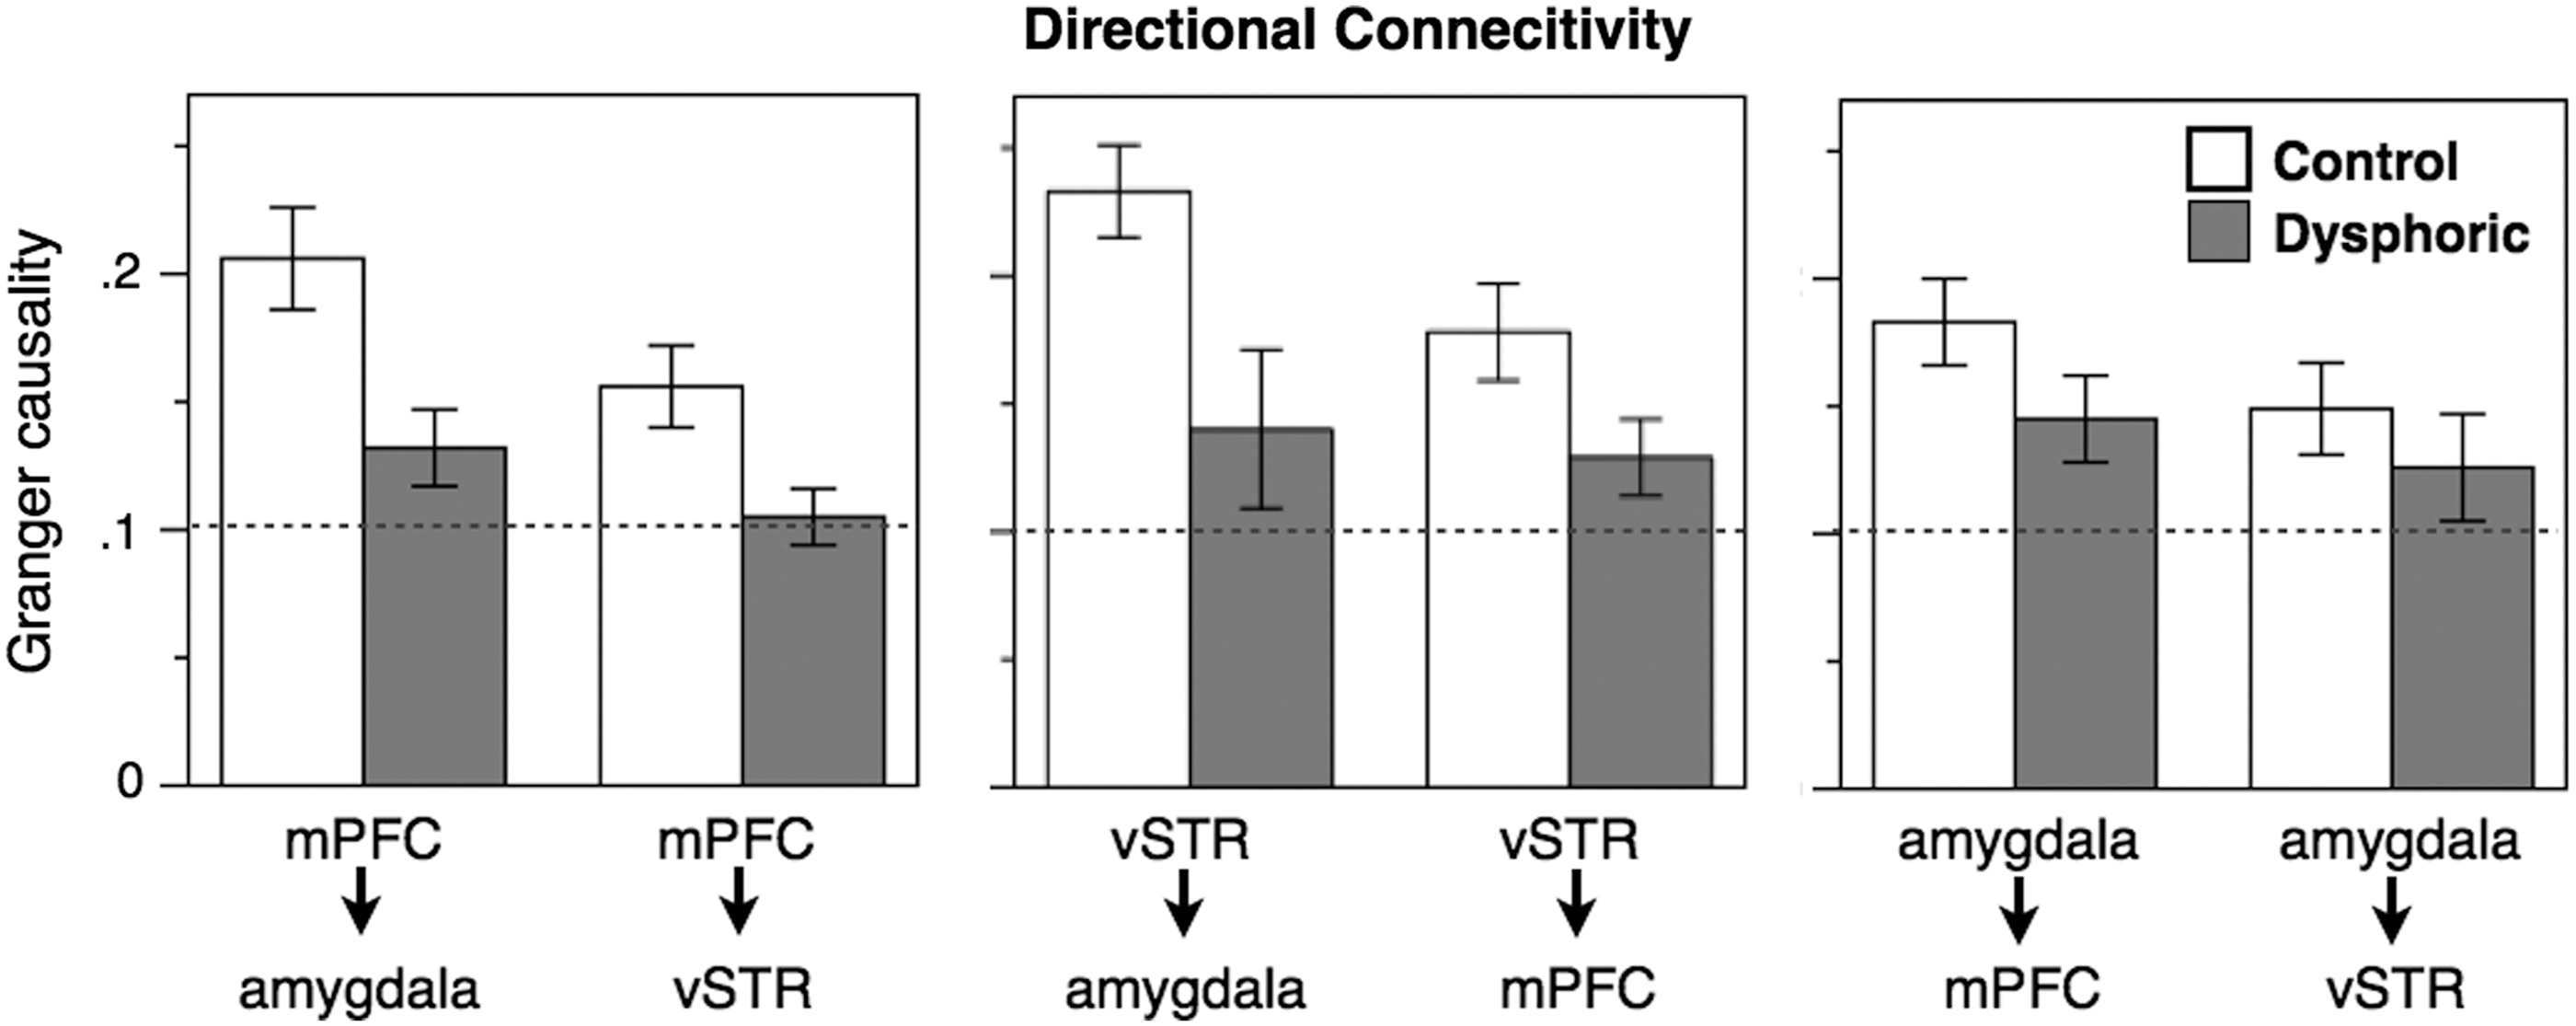
Granger causality estimates representing functional influence to and from each of the three regions of interest, for control (white bars) and dysphoric (gray) participants. The dotted line represents the p<0.001 threshold of significant influence (all estimates meet significance). Error bars represent the standard error of the mean.
Stimulus ratings
Self-reported arousal and pleasantness ratings for control and dysphoric participants are listed in Table 1. Three control participants' ratings data were lost because of computer malfunction. Included in Table 1 are normative ratings of each picture content category (Lang et al., 2008) for comparison. Analyses of variance identified a borderline interaction of Group (nonsymptomatic, symptomatic) with rated valence [F(4, 52)=2.46, p=0.057], with dysphoric participants reporting a more limited range of response across contents. Consistent with the similarity in enhanced amygdala activation to emotional relative to neutral contents, arousal ratings were commensurate across groups.
Discussion
Considering the sample as a whole, the functional imaging of midline structures revealed that viewing pictures of increasing subjective emotional arousal (irrespective of hedonic valence) prompted corresponding BOLD signal enhancement suggestive of cortico-brainstem-thalamo-limbic-cortical interactions (Haber and Calzavara, 2009; Russchen et al., 1987). Active structures include bilateral occipitotemporal and posterior parietal visual cortex, the medial dorsal nucleus of the thalamus, the superior colliculi/lateral geniculate, bilateral amygdala, and inferior frontal gyrus. These data are consistent with preceding studies (Britton et al., 2006; Northoff et al., 2004; Sabatinelli et al., 2005, 2007, 2009), in which the perception of arousing pleasant and unpleasant pictures prompts activation in a network of structures subserving visual sensory intake and relay, sensory integration, motivational tagging, and semantic analysis.
In contrast to broad arousal sensitivity, regions showing a linear increase in BOLD activation with increased picture pleasantness included the precuneus/posterior cingulate, mOFC, anterior cingulate, mPFC, vSTR, and left amygdala. These findings replicate previous work (Costa et al., 2010; Sabatinelli et al., 2007) and underscore the specific influence of appetitive features as opposed to emotional intensity or salience in modulating this network of structures during natural scene perception.
As a notable extension of prior work, here we identified in dysphoria reduced directional connectivity between nodes of a mesolimbic appetitive circuit (i.e., mPFC, vSTR, amygdala), most pronounced for modulation by mPFC to vSTR and to amygdala, as well as vSTR to mPFC. Specifically, directional connectivity was operationalized as the magnitude of frequency-band-specific GC estimates describing the relationship between the time series of BOLD percent signal change in ROIs demonstrated to be active during our picture perception paradigm. These causal connectivity estimates extend and bolster findings of disrupted activity in these reward-related structures (Disner et al., 2011; Forbes and Dahl, 2011; Robinson et al., 2012). Our GC data are also consistent with a recent combined intracranial–surface EEG study in which local field potential recordings taken directly from the nucleus accumbens were compared with a sparse array of 12 scalp electrodes during a monetary incentive task (Cohen et al., 2011). In that study, GC analyses suggested a stronger influence of medial frontal cortical areas on nucleus accumbens than the reverse, a conclusion that was limited by the coarse spatial resolution of surface EEG. The decreased modulatory influence of mPFC on vSTR found in the current fMRI dataset in dysphoric participants, in conjunction with restricted hedonic ratings, corresponds well with a perspective of these structures' role in appetitive valuation.
This experiment differs from prior examinations of emotional processing in dysphoria, in that both pleasant and unpleasant stimuli were presented, and the emotional intensity of stimuli was modulated to enable comparisons across moderately and highly evocative stimuli. This experimental design feature enabled a comparison of emotional reactivity patterns across a range of stimuli (Fig. 1), in which structures (mPFC and amygdala) showed graded responses as a functional of stimulus arousal, corresponding with either valence (mPFC) or with arousal (amygdala). Interestingly, the dysphoric participants did not show any apparent differentiation between highly arousing pleasant and unpleasant stimuli in mPFC and vSTR.
Given the dense interconnections of mPFC and vSTR (Ferry et al., 2000; Ongür and Price, 2000) and the fact that each receives ample projections from the amygdala (Friedman et al., 2002), the dissociation of intact amygdala sensitivity with impaired vSTR and mPFC mobilization tentatively implicates these latter structures in anhedonic response profiles. The mPFC and vSTR are prominent nodes in a medial/extended medial prefrontal network of structures, dysfunction within which has long been posited to underlie mood disorders (Price and Drevets, 2010, 2012). Among depressed samples, reductions in gray-matter volume (Arnone et al., 2012; Baumann and Bogerts, 1999; Ongür et al., 1998) coupled with glucose metabolic perturbations (Baxter Jr. et al., 1989; Biver et al., 1994; Brooks III et al., 2009; Drevets et al., 2002) have been observed in prefrontal cortex and striatum. Furthermore, similar to the current study, attenuated hemodynamic responses to appetitive cues in these regions have characterized depressed participants across a range of elicitation procedures. Foremost in vSTR, although also in prefrontal cortex, depressed participants have demonstrated hyporeactivity to visual cues signaling reward receipt (Elliott et al., 1998; Kumar et al., 2008; Moses-Kolko et al., 2011; Pizzagalli et al., 2009; Robinson et al., 2012; Steele et al., 2007; Stoy et al., 2012; Wacker et al., 2009) as well as anticipation (Stoy et al., 2012)—hedonic deficits that persist even into disorder remission (McCabe et al., 2009).
While reward consumption has received the most thorough examination to date in depression, findings of similar mesocortical hyporesponsivity are accumulating for happy facial expressions (de Almeida et al., 2011), pleasant words (Epstein et al., 2006; Silverman et al., 2007), and pleasant scenes (Heller et al., 2009; Schaefer et al., 2006; Tremblay et al., 2005). Further underscoring the likely contribution to the affective pathology of depression, this mesocortical blunting is improved phasically subsequent to a single administration of a dopaminergic agonist (Tremblay et al., 2005) and more lasting among responders to cognitive-behavioral (Dichter et al., 2009) or psychotropic intervention (Schaefer et al., 2006; Stoy et al., 2012; Victor et al., 2010).
The intact or normative amygdala reactivity to unpleasant scenes in the dysphoric group differs somewhat from the extant literature. Consistent with the notion that depressed mood primes and thus facilitates reactivity to unpleasant stimuli, depressed participants have demonstrated elevated hemodynamic amygdala responses to a range of mild to moderately aversive visual cues, including sad words (Siegle et al., 2002, 2007) and masked and unmasked sad and fearful faces (Drevets, 2001; Fu et al., 2008; Sheline et al., 2001; Surguladze et al., 2005; Suslow et al., 2010; Victor et al., 2010). The respective group means for subjective ratings were not reported in these studies, but other investigators who used similar unpleasant stimulus materials rated concurrently with International Affective Picture System images on the Self-Assessment Manikin (Bradley and Lang, 1994) have revealed emotional arousal ratings lower than the moderately arousing pictures in the current set (Alpers et al., 2011; Britton et al., 2006). Sad and fearful emotional expressions and sad words have strong ecological validity for assessing the daily affective biases ubiquitous in clinical narratives of depression. Importantly, the current findings, elicited by pictures of disgust, attack, and mutilations, suggest that hyper-reactivity to aversive stimuli may not be prompted in this population by higher intensity threat-related pictures. Regardless of depressive features, once a defensive threshold is surpassed, adaptive limbic mobilization may predominate. Essentially, exaggerated amygdala reactivity to aversive cues in depression may be specific to lower arousing linguistic and interpersonal cues that more readily prime depressive rumination.
Study Limitations
Relative to nonclinical community samples (Beck et al., 1996), the highly symptomatic participants endorsed depressive episode severity on the BDI beyond the 99th percentile. Although this level of cognitive, affective, and somatic dysfunction is commensurate to patients in prior clinical investigations, the implications of these results for explicating disorder-level dysfunction in major depression is necessarily limited by the use of a small analogue sample. Nonetheless, the use of this sample is in some respects advantageous in demonstrating that in a high functioning, physically healthy, and comparatively younger sample than typical naturalistic clinical samples, clear patterns of mesocortical deficits are evident in response to appetitive cues. Longitudinal clinical investigation is clearly warranted by the presence of group effects in this small sample. The current findings suggest that mesocortical hedonic impairments emerge relatively early in the lifespan, before years of cumulative depressive episodes and the coincident daily life stress that affective psychopathology and its functional implications impose.
In addition to recruiting an analog sample, inclusion was limited to males. Whereas women often demonstrate a bias to rate aversive pictures as more intense than appetitive pictures, males typically rate the extreme exemplars of both dimensions as similarly arousing (Bradley et al., 2001). Furthermore, relative to women, men are more reactive in peripheral physiology (Bradley et al., 2001) as well as in extrastriate visual cortex during erotic picture perception (Sabatinelli et al., 2004)—showing responsivity commensurate to pictures of mutilations and attack. Thus, the inclusion of highly arousing pleasant stimuli (i.e., erotica) and recruitment of males enabled an equivalent comparison of appetitive and aversive picture perception in dysphoria, a contrast that is often confounded in studies in which aversive stimuli are more evocative than pleasant stimuli.
The experimental paradigm used here involves a minimum of task demands; participants are simply asked to maintain fixation and view the emotional and neutral pictures. While this simplicity is in some ways a virtue in its simplicity, it may also be considered less revealing of process-related functional specificity. Future experimental work may thus benefit from additional task demands placed on the participant, such as an instruction to downregulate emotional reactivity.
The directional connectivity analyses employed here examined the relationship of mPFC, vSTR, and amygdala across the entire series of 50 picture stimuli, and not as a function of the 5 categories of picture content. While these content-specific analyses are certainly of interest, the reliability of time series analyses such as GC depends on long trains of successive samples to assess interrelationships across ROIs. Despite this, we attempted to differentiate directional connectivity between the 3 ROIs across each of the 5 picture content categories, but found no reliable differences. Future work in which a greater number of experimental trials or a larger sample is collected may reveal condition-specific effects.
Conclusion
Using rapidly sampled fMRI and GC analyses, these data identify a deficit in directional connectivity between medial prefrontal and subcortical reward-related structures in a small group of high-functioning participants suffering from significant symptoms of depression, as they view a series of emotionally evocative and neutral natural scenes. This reduction in directional connectivity between reward-related medial prefrontal and ventral striatal structures provides rare, direction-specific evidence of an association between and network activity and symptoms of depression.
Footnotes
Acknowledgment
This work was supported by a Young Investigator Award to D.S. from the Brain & Behavior Research Foundation.
Author Disclosure Statement
The authors state that no competing financial interests exist.