
Abstract
Comprehension of narrative stories plays an important role in the development of language skills. In this study, we compared brain activity elicited by a passive-listening version and an active-response (AR) version of a narrative comprehension task by using independent component (IC) analysis on functional magnetic resonance imaging data from 21 adolescents (ages 14–18 years). Furthermore, we explored differences in functional network connectivity engaged by two versions of the task and investigated the relationship between the online response time and the strength of connectivity between each pair of ICs. Despite similar brain region involvements in auditory, temporoparietal, and frontoparietal language networks for both versions, the AR version engages some additional network elements including the left dorsolateral prefrontal, anterior cingulate, and sensorimotor networks. These additional involvements are likely associated with working memory and maintenance of attention, which can be attributed to the differences in cognitive strategic aspects of the two versions. We found significant positive correlation between the online response time and the strength of connectivity between an IC in left inferior frontal region and an IC in sensorimotor region. An explanation for this finding is that longer reaction time indicates stronger connection between the frontal and sensorimotor networks caused by increased activation in adolescents who require more effort to complete the task.
Introduction
Comprehension of narrative stories involves comprehending short spoken sentences, which elicits multiple levels of dynamic language processing including phonological, semantic, and syntactic (Gaillard, 2004; Humphries et al., 2007; Karunanayaka et al., 2007; Szaflarski et al., 2012; Vannest et al., 2009b; Xu et al., 2005). This dynamic process is supported by a complex and extensive language networks covering frontoparietal, frontotemporal, and temporoparietal regions (Berl et al., 2010; Hickok and Poeppel, 2007; Karunanayaka et al., 2007; Schmithorst et al., 2007; Szaflarski et al., 2012). Previous functional magnetic resonance imaging (fMRI) studies have shown that narrative comprehension skills play an important role in language development (Holland et al., 2007; Karunanayaka et al., 2007; Lin et al., 2011; Schmithorst et al., 2006, 2007; Szaflarski et al., 2012; Vannest et al., 2009b) and in building a foundation for reading (Horowitz-Kraus et al., 2013).
A recent 10-year longitudinal fMRI study of narrative comprehension in 30 children starting at age 5–7 revealed progressively and linearly increasing involvement of Brodmann (BA) 21/22 and adjacent banks of the superior temporal sulci during the developmental period from ages 5–16 (Szaflarski et al., 2012). Their findings of the overall activation in bilateral temporal brain regions were remarkably similar to the results previously reported in cross-sectional studies from 313 children (ages 5–18 years) (Holland et al., 2007; Karunanayaka et al., 2007; Schmithorst et al., 2006, 2007). A passive-listening (PL) version of the narrative comprehension task was used in these studies. Given the complexity of narrative comprehension, an active-response (AR) version of the task was developed to overcome the disadvantages of the PL task including loud gradient noise during the presentation of the auditory stimuli and lack of online performance measure (Vannest et al., 2009a). The AR task utilizes a sparse temporal sampling fMRI design to acquire multiple volumes near the peak of the hemodynamic response curve while it allows an auditory stimulus of short stories to be presented when the MRI scanner is silent; so, there is no background noise from the MRI gradients (Gaab et al., 2003; Schmithorst and Holland, 2004a). Moreover, comprehension question session was added to the AR task to monitor ongoing comprehension of narrative stories. Vannest et al. (2009a) found that both versions of the narrative comprehension task stimulated similar brain activation patterns in the primary auditory cortex (PAC), superior temporal gyrus (STG) bilaterally, and left inferior frontal gyrus (IFG) by using a general linear model (GLM) analysis on fMRI data from 20 children (ages 11–13 years). In addition, more extensive activation in the dorsolateral prefrontal cortex and anterior/posterior cingulate cortex (PCC) were involved during the AR task (Vannest et al., 2009b).
In the current analysis, we aim to demonstrate the similarities in the cortical networks for narrative comprehension whether performing the PL or AR versions of the paradigm. Doing so supports the validity of using the PL task in young children (Schmithorst et al., 2006, 2008), even sleeping children (Patel et al., 2007; Wilke et al., 2003), who might not be able to perform the AR task. We also explore the participation of the additional response related brain regions engaged during the AR compared with the PL version of the narrative comprehension task. As previously noted by Vannest et al. (2009b), we expect attention, working memory, and auditory language association regions to participate in narrative comprehension. Using the AR version of the narrative comprehension task we aim to quantitate the participation and connectivity of these brain regions in the narrative comprehension network by relating connectivity to a real-time measure of comprehension during the task. In addition, using independent component analysis (ICA), a multivariate data-driven approach, we aim to explore the hierarchical connectivity within language networks stimulated by the two versions of the narrative comprehension task to quantitatively examine the participation of higher order cognitive components in comprehension of spoken narrative.
Given the importance of narrative comprehension in language and neurocognitive development and the need to improve our understanding of hierarchical language networks involved in the narrative comprehension, the present study has the overarching goal to expand our understanding of language networks in the brain. Previous studies, using PL paradigms and more rudimentary fMRI data analysis strategies such as GLM (Vannest et al., 2009b), have provided a picture of the basic brain network for comprehension of narrative stories (Gaillard, 2004; Karunanayaka et al., 2007; Lin et al., 2011; Schmithorst et al., 2007; Szaflarski et al., 2012). The current analysis adds to this basic network structure by examining the connections between primary auditory, auditory association, attention, working memory, and other multimodal language regions in the brain. We also examine the role that these regions and their connections play in narrative comprehension performance. Our hypothesis is that the AR narrative comprehension task will engage a similar auditory language network to the PL version of the task but will also activate additional brain regions that are specifically related to the responses required during the task. Further, we expect that these additional brain regions will connect with high order semantic, expressive, and associative language areas of the brain in a way that correlates with comprehension of the narrative. Given this theoretical framework and motivation, the current study examines the hypothesis according to a three-step process. First, we use ICA to identify independent component (IC) spatial maps for both tasks. Then, the corresponding IC time courses (TCs) are used to investigate the functional network connectivity (FNC) between IC spatial maps. At last, we examine the correlation between the connectivity strength with the online measure of response time reflecting task performance for the AR task. This approach will test the primary hypothesis and add to our understanding the narrative comprehension networks in the human brain. Finally, the results of our three-step analysis can also validate our previous work monitoring the emergence of narrative comprehension skills in children using fMRI with either the PL version or the AR version of the narrative comprehension task.
Materials and Methods
Participants
Twenty-one healthy, native English-speaking adolescents (mean±SD=16.5±1.1 years, 11 boys and 10 girls, 2 left-handed) were drawn from a longitudinal subgroup recruited from a larger cross-sectional sample of participants previously included in our fMRI studies of language development (Holland et al., 2007). This cohort of 21 participants was scanned in the final year of the longitudinal study in year 12, using both the AR and PL versions of the narrative comprehension fMRI paradigm. Nine of the original 30 subjects were not scanned in this year due to orthodontic braces, moving out of the area, or unable to schedule the scans around school and work commitments. All participants had no history of neurological or psychiatric disorders and agreed to participate in the study after providing written informed consent by parents and participant. This study was approved by the Institutional Review Board at Cincinnati Children's Hospital Medical Center.
Paradigms
PL version
The PL version of the narrative comprehension task uses a periodic block design consisting of a 30-sec story listening and a 30-sec random tone listening as the on-off conditions (Karunanayaka et al., 2007; Vannest et al., 2009b). Each story is composed of 10 sentences with simple words and a variety of syntactic constructions. The stories were developed by a speech-language pathologist with language development expertise and were designed to contain vocabulary, syntax, and concepts that could be understood by a 5-year-old child. This design was important to the longitudinal study in which participants began their participation beginning at the age of 5. The tones used for the control condition were each of 1-sec duration at random frequencies (400–2500 Hz) and random intervals (1–3 sec). All participants were instructed to listen to the stories carefully in the scan session to answer story-related questions after the image acquisition.
AR version
The AR version of the task enables to present auditory story segments without MRI scan noise by using temporal sparse fMRI acquisition technique (Schmithorst and Holland, 2004b). There were three conditions including story listening, question answering, and pure tone listening. A coherent story (differing in content, but similar in structure and word frequency to the stories presented in the PL task) was divided into 15 segments of two sentences with a 5-sec duration. Each story segment was followed by a 6-sec data acquisition with three whole-head volumes acquired with a 2-sec repetition time (TR). After presentation of each story segment and sequential data acquisition, a relevant comprehension question was presented to the participant who was instructed to answer YES/NO regarding the context of the story segment by button push, which was followed by another 6-sec acquisition period. The third condition consisted of 5-sec random tone listening followed by a third 6-sec acquisition period. The diagram of the paradigm can be found in our previous publication (Vannest et al., 2009a).
While the content of the stories in both versions of the narrative comprehension task is nearly identical, there is one key difference that likely affects the neurocognitive response to the stimulus. The PL version presents each story as a continuous narrative stream of 10 sentences in sequential order without interruption. The AR on the other hand splits the story into two sentence segments, interleaved with the comprehension questions. This difference in the presentation format allows real-time monitoring of task performance. However, the interrupted narrative stream also produces differences in brain activity related to storage of story segments in working memory while responses are generated. This difference may affect responses to comprehension questions and the integration of the story content and overall comprehension process.
Data acquisition
All images were acquired on a Philips Achieva 3T MRI scanner (Philips Medical Systems, Best, The Netherlands). A T2*-weighted, gradient-echo, echo planar imaging sequence was used with fMRI parameters: TR/TE=3000/38 msec for the PL task design, TR/TE=2000/38 msec for the AR task design, matrix size=64×64, slice thickness=5 mm, resulting in a voxel size=4×4×5 mm3. During the PL task, the whole-head volumes were acquired at 110 time points for a total imaging time of 5.5 min. The initial 10 time points acquired from the first rest interval were discarded to allow T1 relaxation equilibrium. For the AR task, we used a customized sparse acquisition protocol called Hemodynamics Unrelated to Sounds from Hardware (HUSH) to acquire the images at the peak of the hemodynamic response by taking advantage of the slow rising hemodynamic response (about 6 sec after the onset of stimulus) (Schmithorst and Holland, 2004b). This sparse image acquisition method allows us to present auditory stimuli or collect verbal responses during completely silent gradient intervals. In each experimental condition, the scanner acquired three consecutive whole-head volumes with TR of 2 sec after each stimulus. During the AR task, the whole-head volumes were acquired at 137 time points for a total imaging time of 9 min. The initial two time points were discarded due to the effects of T1 relaxation equilibrium. In addition, a high-resolution T1-weighted three-dimensional anatomical scan was acquired using an inversion recovery prepared turbo gradient echo acquisition protocol with the following parameters: TR/TI/TE=8.1/1052/3.7 msec and spatial resolution of 1×1×1 mm. Audiovisual stimuli were presented using an MRI compatible audio-video system with binocular goggles and pneumatic headphones (Avotec, Inc.; SS3100/SV7021).
Data analysis
Pre-processing
During image reconstruction, a multiecho reference scan was initially used to correct Nyquist ghosts and geometric distortion due to B0 field inhomogeneity (Schmithorst et al., 2001). Reconstructed fMRI data were then pre-processed offline using SPM8 software (
Independent component analysis
The pre-processed image volumes were submitted to subject-wise group ICA (Calhoun et al., 2001b) implemented in the Group ICA of fMRI Toolbox (GIFT,
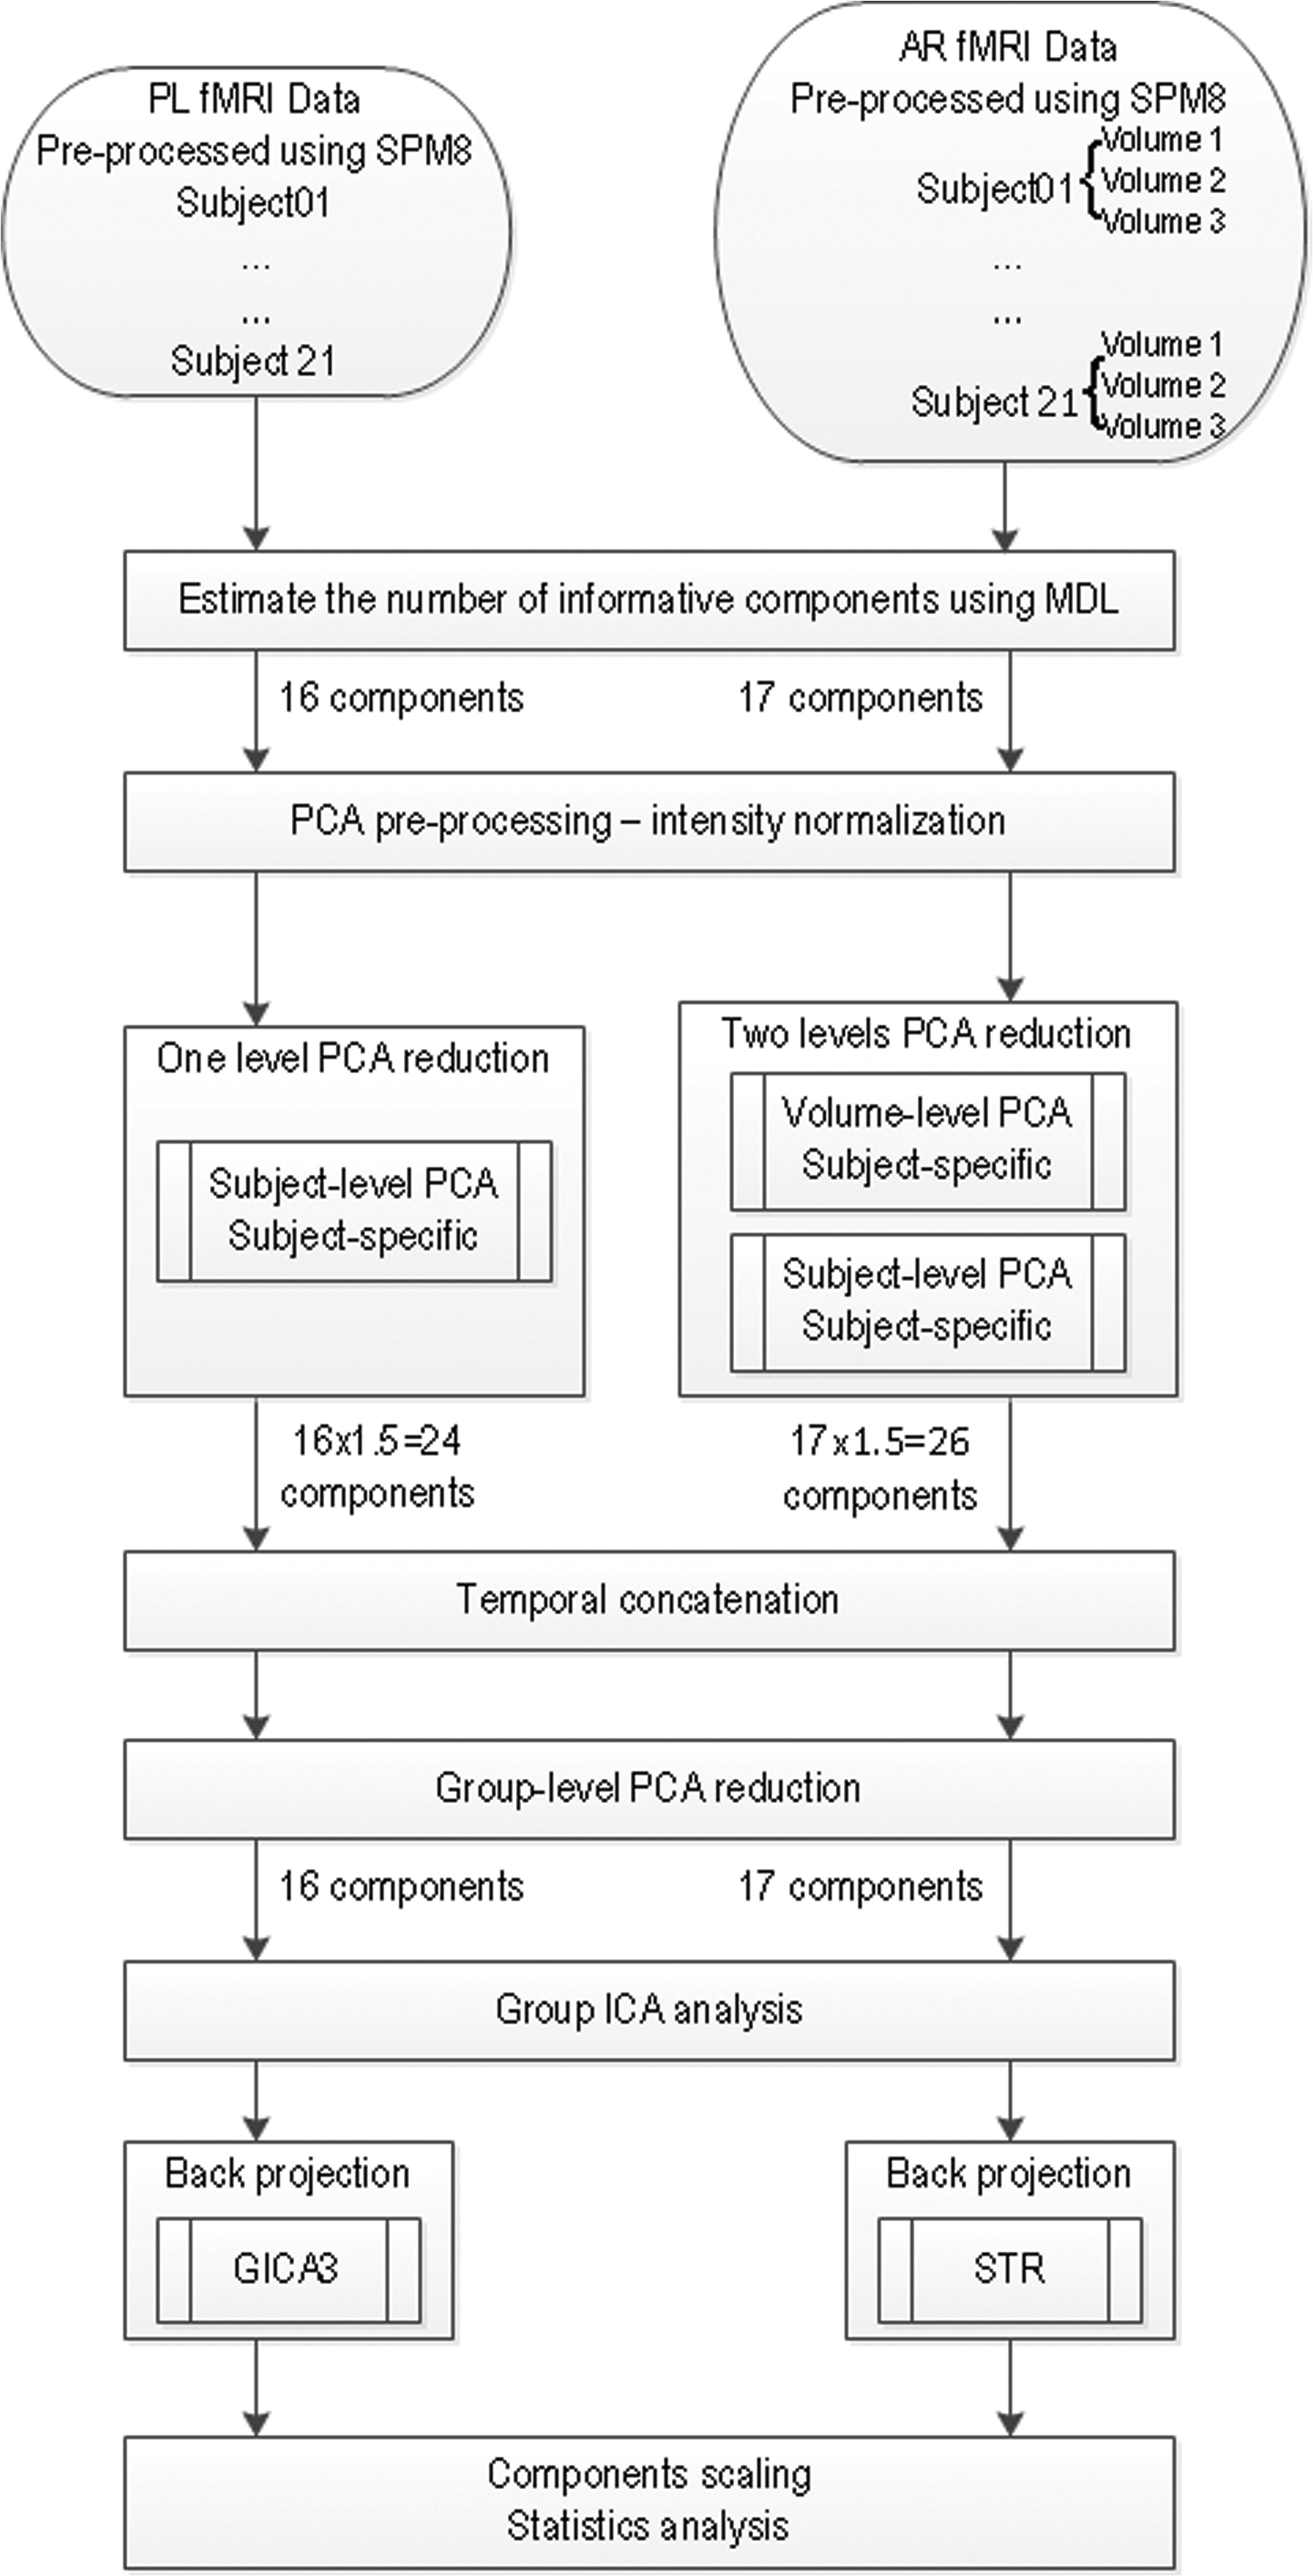
Flow chart showing the pipeline used to process the multisubject functional magnetic resonance imaging (fMRI) data from the two versions of the narrative comprehension task through the group independent component analysis (ICA) and back projection to generate the independent component (IC) maps and time courses shown in Figure 2.
After the PCA reductions, we performed group ICA using the FastICA algorithm (Hyvarinen, 1999) and ICASSO (Himberg et al., 2004) implemented in GIFT. FastICA is a stochastic and iterative algorithm, so it possibly yields different results at every run. ICASSO runs the FastICA algorithm several times to ensure that the ICA identifies global rather than local minima, which improves the robustness of estimated results (Remes et al., 2011). We performed 25 ICASSO runs with different initial values. In ICASSO, the similarity between the ICs from each run was measured by the absolute correlation and a group-average agglomeration strategy was used to identify the cluster of IC estimates. The “centrotype” of each cluster, as the most reliable IC estimate, was used to obtain the TCs for each subject. The “centrotype” of each cluster is defined as the estimate from 25 ICASSO runs that is most similar to other estimates in the cluster (Ma et al., 2011). For the PL fMRI data, the subject-specific TCs and spatial maps were estimated using a GICA3 back-reconstruction method in GIFT, which has been shown to provide accurate spatial maps and time series (Erhardt et al., 2011). For the AR task, since GICA3 is not suitable for the two levels of subject-specific PCA data reduction (volume-subject), the subject-specific TCs and spatial maps were estimated using the spatiotemporal regression (STR, or dual regression) method, which is based on least squares (Beckmann et al., 2009; Calhoun et al., 2004; Filippini et al., 2009).
ICs with the average intracluster similarity, defined by a mutual information measure (Ma et al., 2011), from 25 ICASSO repetitions above 0.8 were selected to be further inspected visually and to be sorted according to the (temporal) correlation coefficient with the pertinent PL or AR task design matrix. Two additional criteria were used to select from among ICs that met the stability requirement of ICASSO (ICS >0.8): (1) TC of the IC must significantly correlate (p<0.05, Bonferroni-corrected) with the relevant story stimulus design matrix, (2) the average Fourier component of the IC TC should correspond to the task frequency with an absolute phase difference of less than 60° from the task TC. Using these criteria four task-related ICs from the PL fMRI data and six task-related ICs from the AR fMRI data were selected for subsequent FNC analysis.
Prior to FNC analysis, a one-sample t-test was performed using SPM8 on the individual spatial IC maps on a voxel-wise basis to determine the cortical regions active across subjects (p<0.001, family-wise error [FWE]-corrected and extent threshold of 20 voxels). In addition, for the AR fMRI data, we also compared the spatial IC maps among the three volumes using paired t-tests (p<0.001, FWE-corrected and an extent threshold of 20 voxels).
Functional network connectivity
To determine functional temporal connectivity among spatial ICs, the TC of each spatial IC was analyzed in the FNC Toolbox (version 2.2, an addition toolbox for GIFT) (Demirci et al., 2009; Jafri et al., 2008; Londei et al., 2006). A constrained maximal time-lagged correlation method was used to compute Pearson's correlation between each pair of selected ICs and constraining the lag between the TC (Jafri et al., 2008). For the PL task, maximal lag for the correlation calculation was 6 sec (2*TR, TR=3 sec). For the AR task, maximal lag was 4 sec (2*TR, TR=2 sec). All results were corrected for multiple comparisons between networks using p<0.05 false discovery rate (FDR)-corrected. In addition, a Wilcoxon rank sum test was used to compare correlations between the two tasks for four similar ICs (p<0.05, Bonferroni-corrected). For each task, we also compared FNC between boys and girls (p<0.05, Bonferroni-corrected).
Correlation between connectivity and response time
The AR version of the narrative comprehension task requires the participant to answer questions related to each pair of sentences presented in story segments during the scan. The response time to each question is recorded for each subject's button-push responses. We used Spearman rank order correlation coefficient (usually referred to as Spearman rho) to compute the correlation between response time and connectivity strength (p<0.05, Bonferroni-corrected).
Results
Performance data
For the PL task, participants correctly answered questions on the postscan comprehension test (mean±standard deviation=71.7%±13.8%), which were based on the stories presented during the scan. For the AR task, performance data were collected from the comprehension test during the imaging scan. Unlike the PL version, the AR version provided us with real-time measures of both comprehension accuracy and response time. The mean accuracy from the AR task was 92.1%±10.7%, which is significantly higher than the PL task (p<0.00003). The mean response time was 800.6±219.2 msec.
Independent components
The spatial maps of the four task-related ICs for the PL task and the six task-related ICs for the AR task are superimposed over a canonical template in SPM8 (Fig. 2 and Table 1; p<0.001, FWE-corrected and an extent of 20 voxels). The corresponding average TCs extracted from the “centrotype” of clusters are plotted in Figure 2. In Figure 3, two-dimensional curvilinear component-analysis (CCA) projections of the clustered 25 ICASSO runs of ICA estimates are plotted, and the ICs that met our selection criteria above for the FNC analysis are marked with black font letters. Note the first criterion for IC selection from each task is related to the stability of the IC over 25 ICASSO runs. The stability is reflected in the compactness of the CCA projections represented in Figure 3, and the best estimate of the centrotype location is indicated as a cyan circle around the dot of IC estimate. Descriptions of the spatial location and function of each IC selected from the two tasks are provided below.
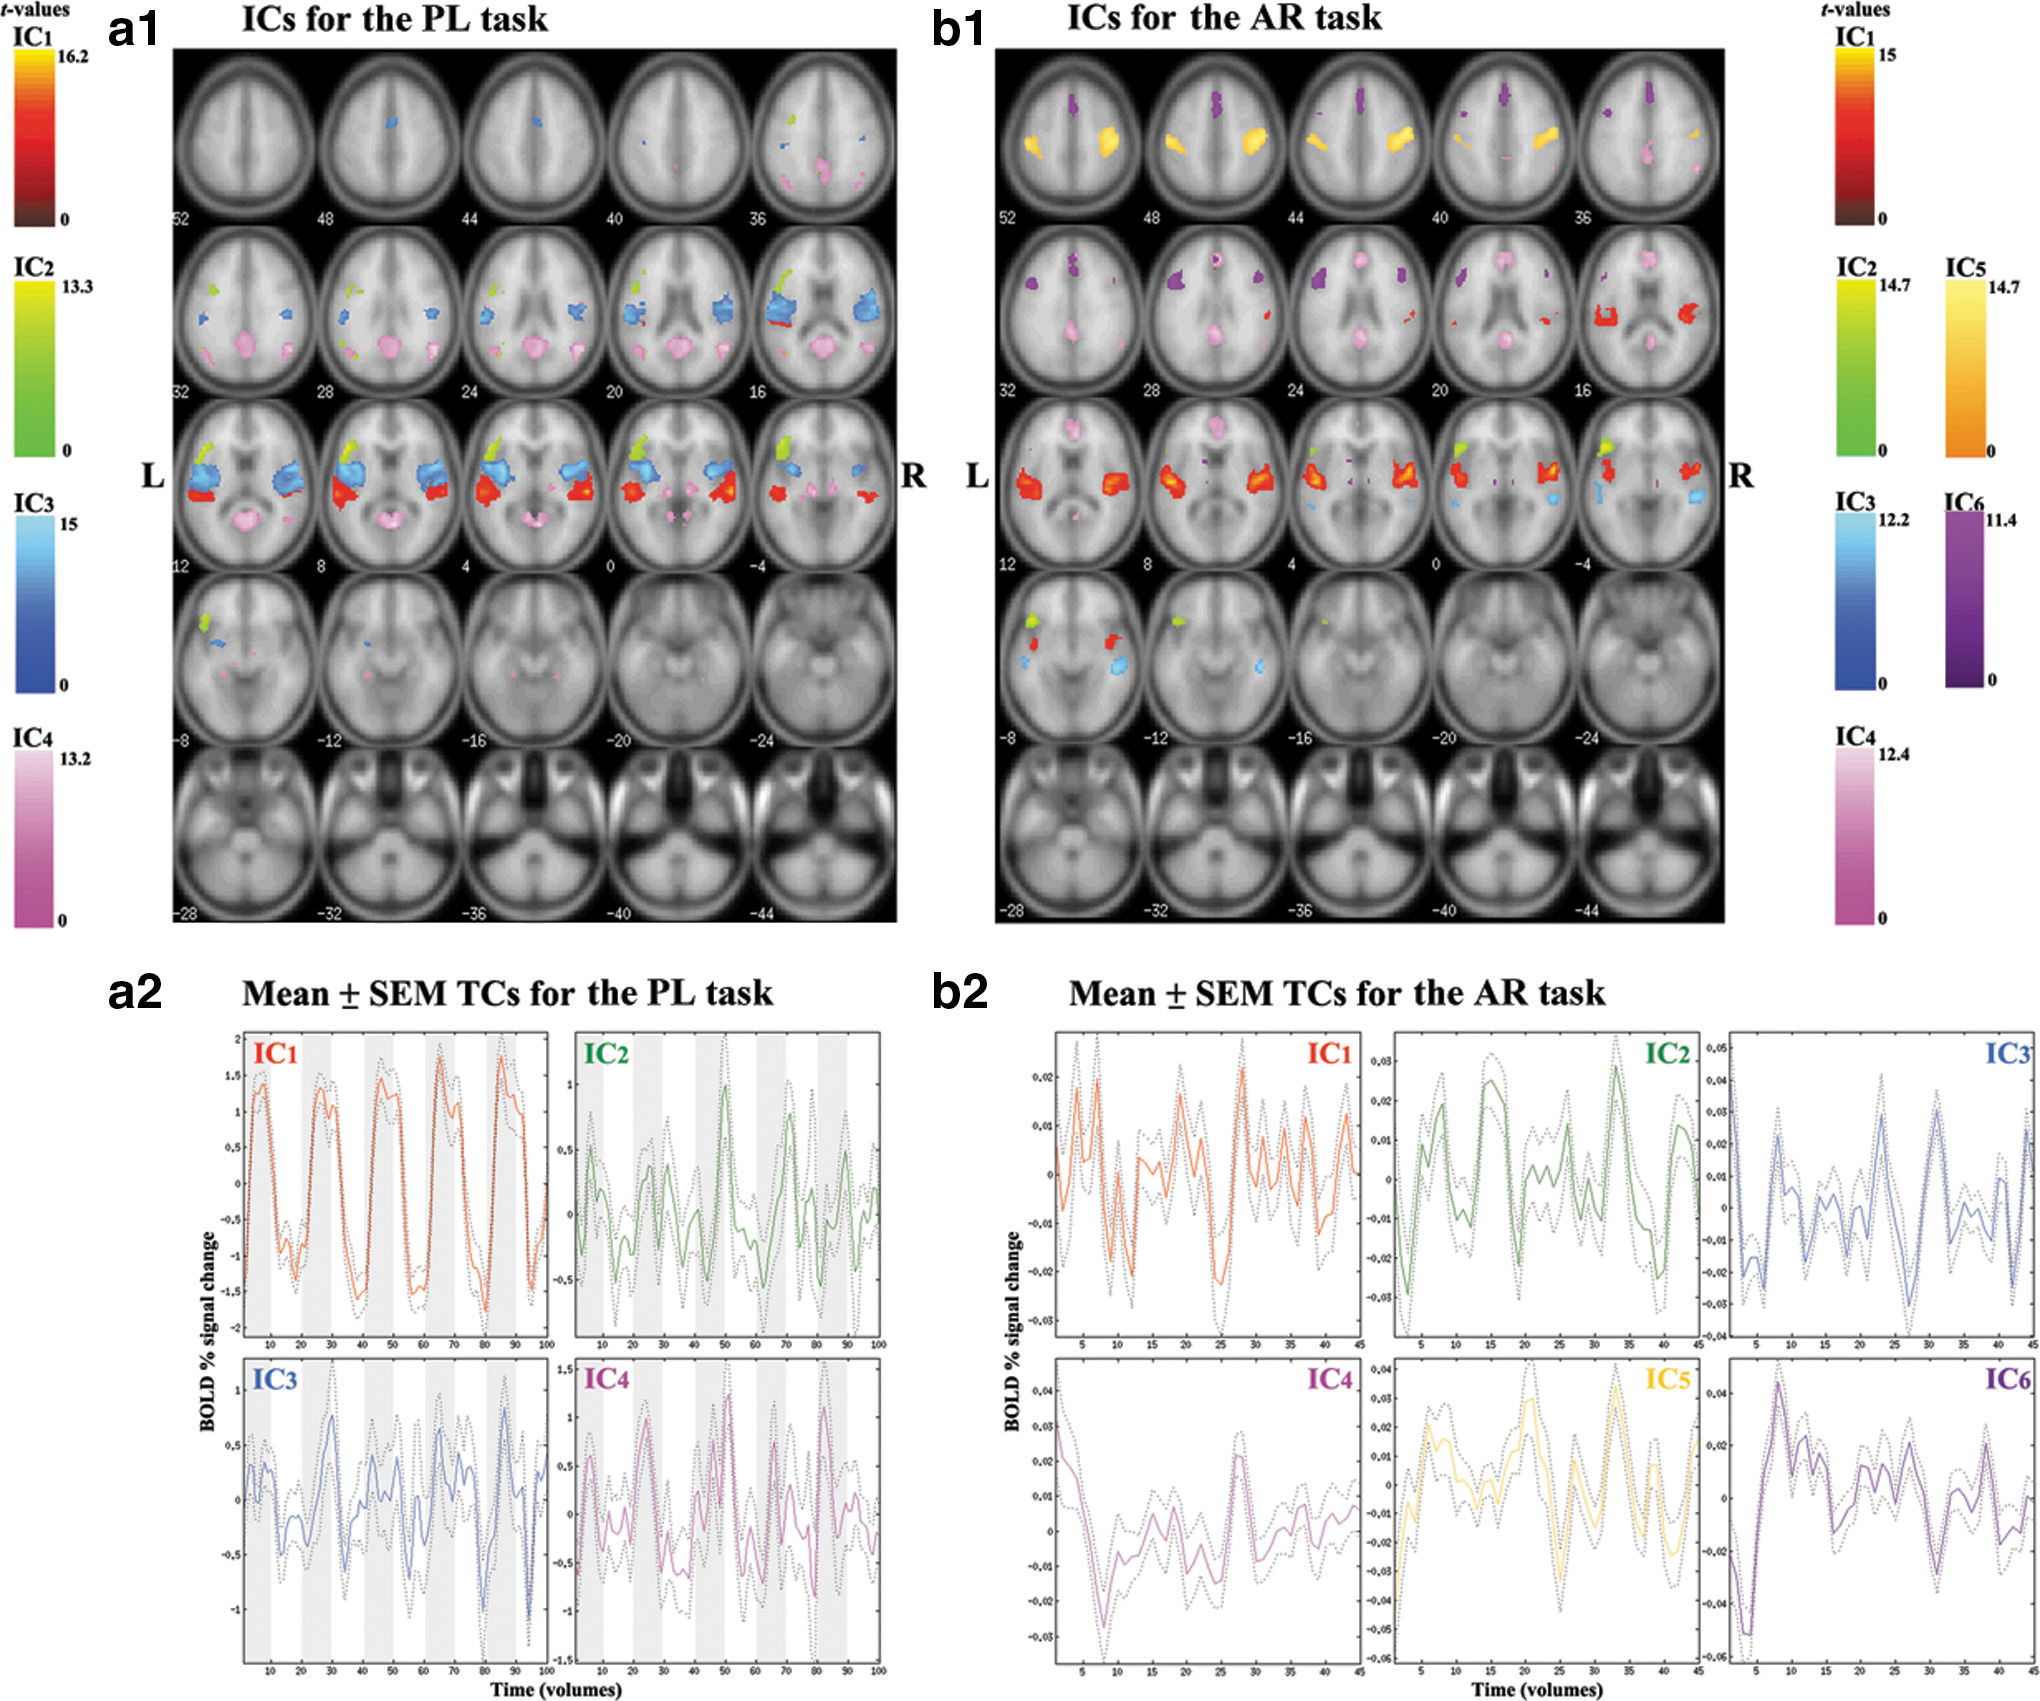
IC maps superimposed on a canonical brain image template from SPM8. Significant clusters are determined by one-sample t-test among all (n=21) subjects using p<0.001 (family-wise error [FWE] corrected and an extent threshold of 20 voxels).
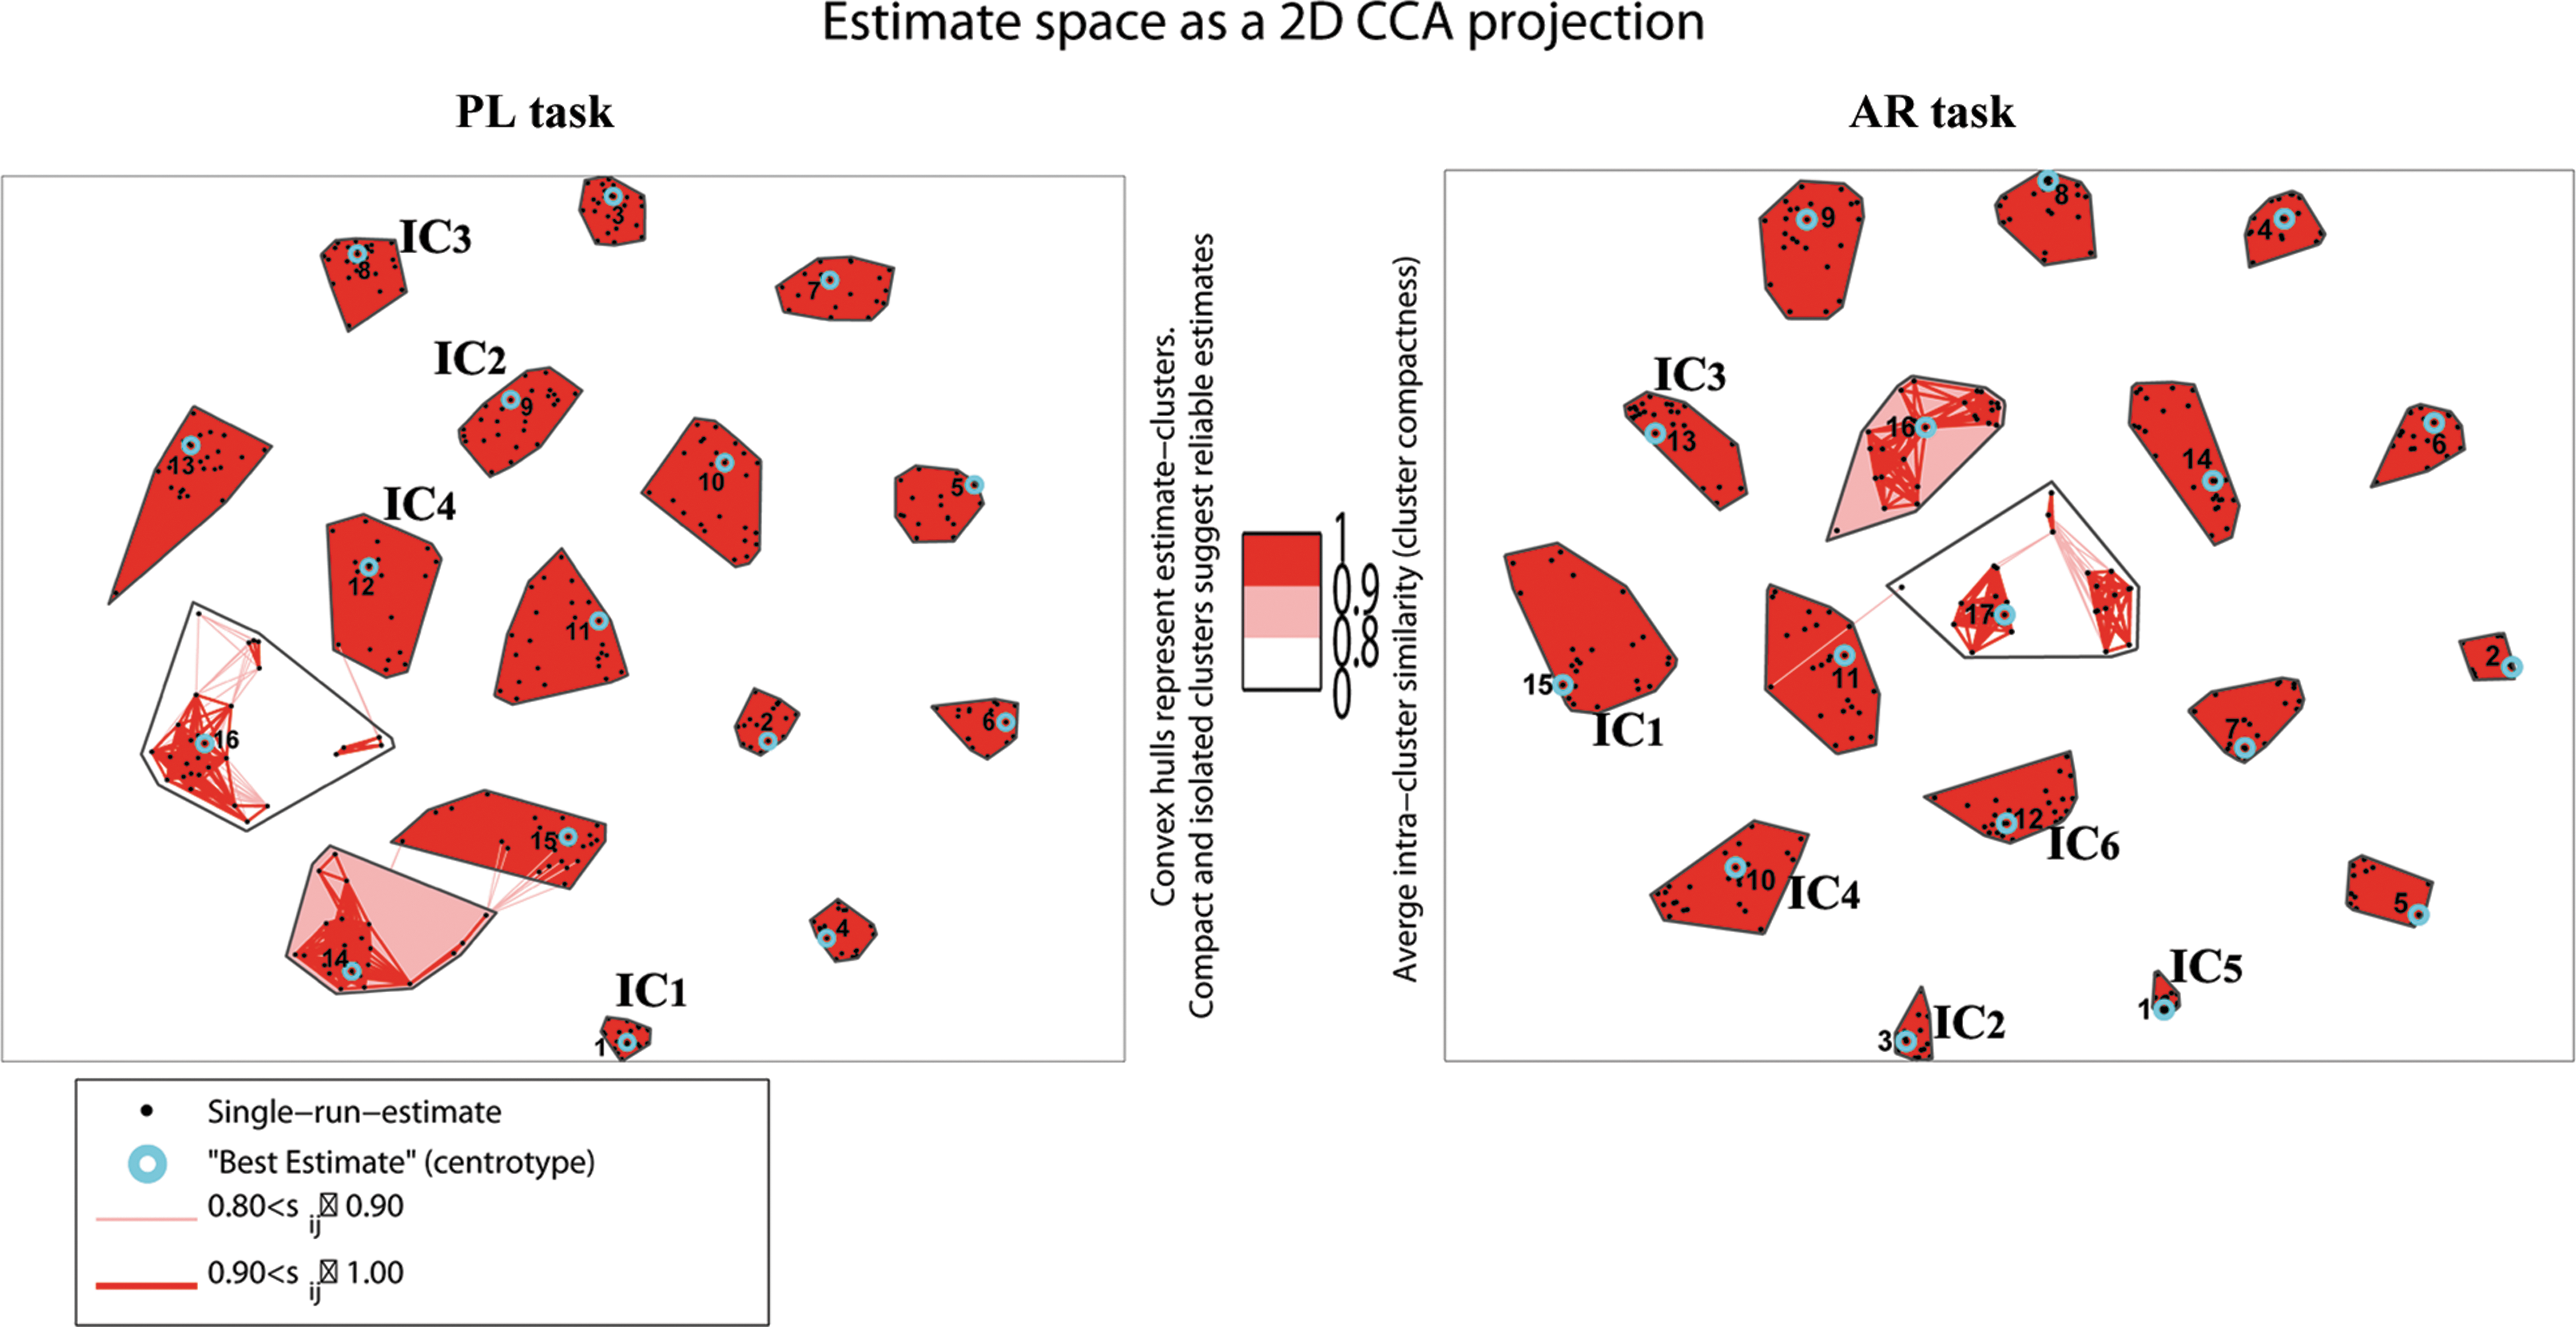
Two-dimensional curvilinear component analysis projections of the clustered IC estimates from 25 runs of ICASSO. The pair-wise similarities Sij inside each cluster are marked with red lines. Note that the pairwise similarity graph between estimates inside clusters is omitted if the average intracluster similarity is above 0.90. The best estimate (centrotype) of each cluster is circled with light blue. ICs selected for each task and used in subsequent analysis are marked respectively. Color images available online at
Talairach Coordinates for Activation Clusters in Each Independent Component
Voxels above a threshold of p<0.0001 (family-wise error corrected and an extent threshold of 20 voxels) were converted from Montreal Neurological Institute coordinates to Talairach coordinates and the anatomic labels for left (L) and right (R) hemispheres were assigned using “write Talairach table” function in GIFT. The concentration of voxels in each area is provided in cubic centimeters (cc). The clusters with distance between contiguous voxels above 4 mm are listed. Within each region, the maximum T value and its coordinates are listed in the table. AR, active-response; BA, Brodmann area; GIFT, Group ICA of fMRI Toolbox; IC, independent component; IFG, inferior frontal gyrus; IPL, parietal lobule; MTG, middle temporal gyrus; na, no significant voxels were found in the hemisphere; PL, passive-listening; STG, superior temporal gyrus.
IC1 corresponds to the auditory network (Kalcher et al., 2012; Schöpf et al., 2010) including bilateral PAC (BA 41/42), posterior part of STG (BA 22/38), and insula for both tasks. IC1 for the AR task also extends superiorly to sensorimotor areas, including bilateral precentral and postcentral gyrus (BA 3, 6, 43), and right lateral inferior parietal lobule (IPL; BA 40).
IC2 corresponds to the left-lateralized frontal language network (Karunanayaka et al., 2007) including the left lateral IFG covering the pars triangularis (BA 45), pars opercularis (BA 44), and pars orbitalis (BA 47). Both the PL and AR tasks yield similar significant clusters in IC2 with strong left lateralization (Fig. 2 and Table 1).
IC3 incorporates the temporal language network, including the left lateral Wernicke's area (BA 22) and the right lateral middle temporal gyrus (MTG; BA 21), for the AR task. For the PL task, IC3 also captures activity in STG (BA 22) and the left lateral postcentral gyrus (BA 40, 43), bilateral precentral gyrus (BA 6, 13, 43, 44), and left lateral IPL (BA 40; Fig. 2 and Table 1).
IC4 most prominently features an attention network including anterior (ACC) and PCC and precuneus bilaterally (BA 23, 29, 30, 31), in addition to the left lateral parahippocampal gyrus, for both the PL and AR tasks (Fig. 2 and Table 1). In addition, for both versions of the task, IC4 detects a temporoparietal language network covering the left lateral angular gyrus (BA 39), the right lateral supramarginal gyrus (BA 40), and the right lateral STG (BA 22/39).
Both IC5 and IC6 are only present in the AR task. IC5 corresponds to sensorimotor network covering precentral and postcentral gyrus (BA 4, 6), likely caused by the button pushes used to register subject responses to the questions about the stories.
IC6 captures the left dorsolateral prefrontal network including dorsolateral prefrontal cortex (BA 6, 9, 46), cingulate gyrus, and thalamus (Fig. 2 and Table 1). These brain regions are considered to be involved in higher order neurocognitive functions known to subserve working memory and attention and are. During the narrative comprehension task IC6 regions are most likely involved with modulation of the semantic association and retrieval and syntactic processing regions in IC2 (BA 44, 45, 47) (Sabb et al., 2007; Schmithorst et al., 2006).
Comparison of volumes
The AR fMRI data contains three image volumes that were input into the ICA as separate sessions for each subject. Through STR back-reconstruction, the spatial maps of ICs for each volume were generated and compared using paired t-tests (p<0.001, FWE-corrected and an extent threshold of 20 voxels; Fig. 4). There was no region that survived after multiple comparison correction, which indicates that the spatial map for each IC did not show significant difference among the three volumes. Consequently, including each volume instead of the average of the three volumes in the group ICA (Fig. 1 for all the steps) is a valid and effective method to extract meaningful TCs for the FNC analysis.
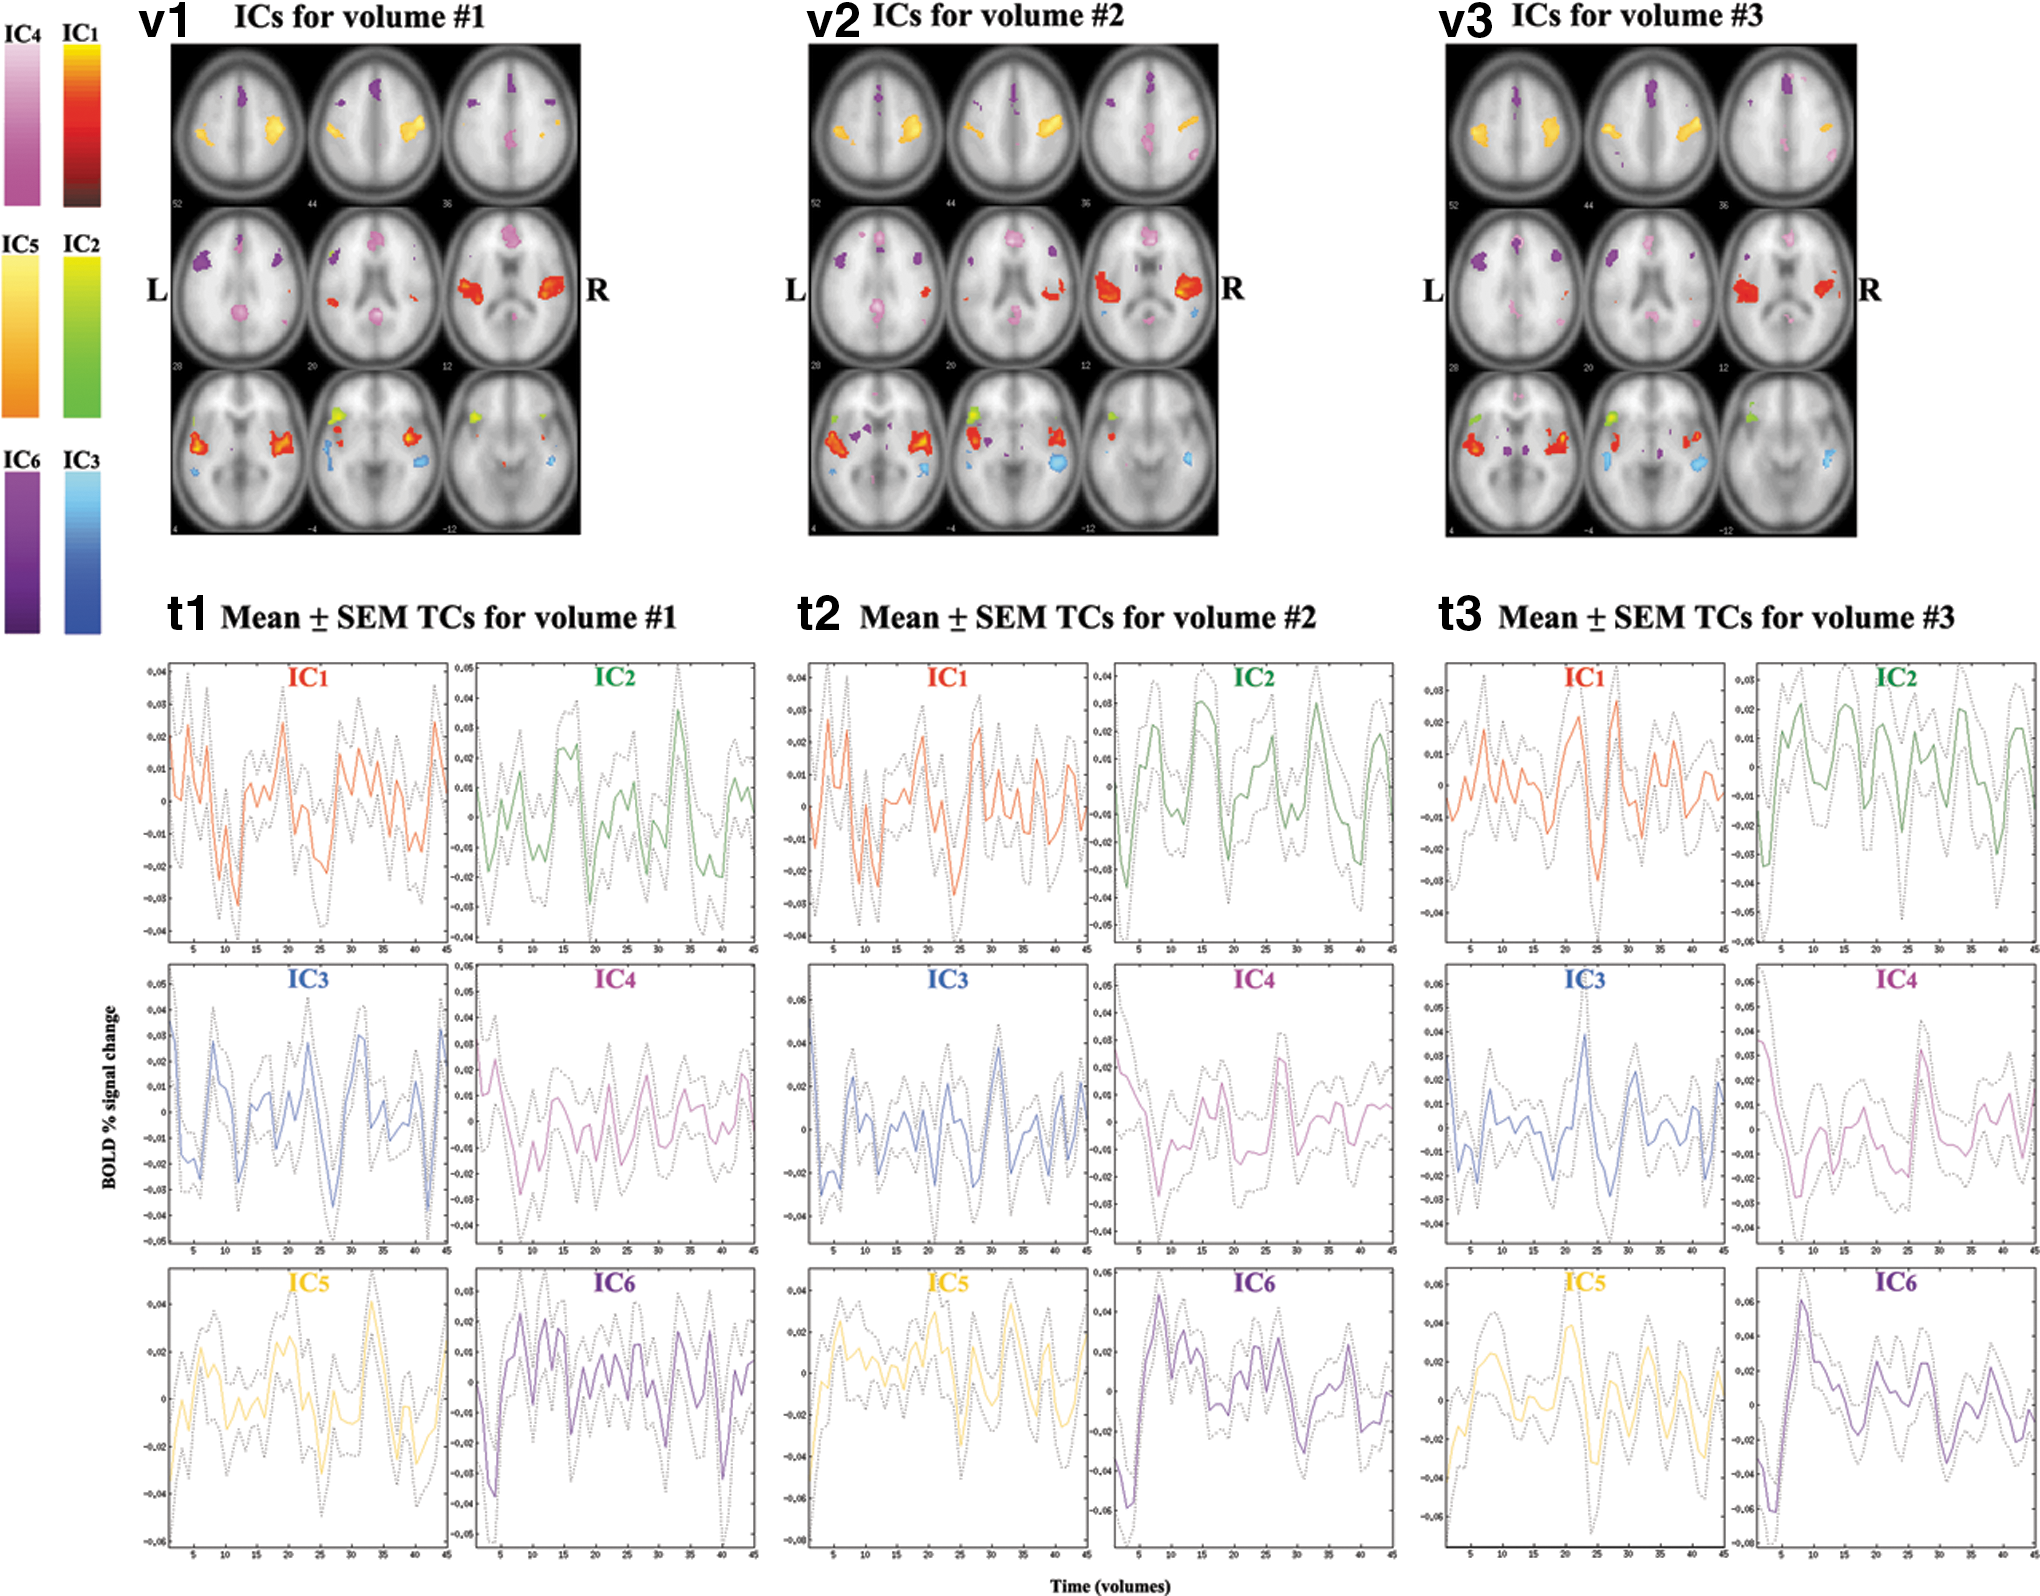
ICs from each volume of the fMRI data during the AR task are superimposed over canonical brain image template from SPM8. Significant clusters are determined by one-sample t-test among all subjects using p<0.001 (FWE corrected and an extent threshold of 20 voxels).
Functional network connectivity
The FNC correlation matrices of the time-series data between each IC for each task are shown in Figure 5 (p<0.05, FDR-corrected). We found significant correlations between all ICs for each task (Fig. 5). Among pairwise correlations between IC1, IC2, IC3, and IC4, there was no significant difference between the two tasks (p<0.05, Bonferroni-corrected). There was also no significant gender difference among all pairwise correlations for each task (p<0.05, Bonferroni-corrected). In Figure 5, additional significant connections between IC5–6 and IC1–4 for the AR data indicated that these connections are likely related to the additional sensory motor and cognitive aspects of the AR task related to holding the story segments in working memory to make appropriate judgments about the narrative to answer the questions, and holding and preparing to use the buttons to make responses to the questions during the next phase of the task.
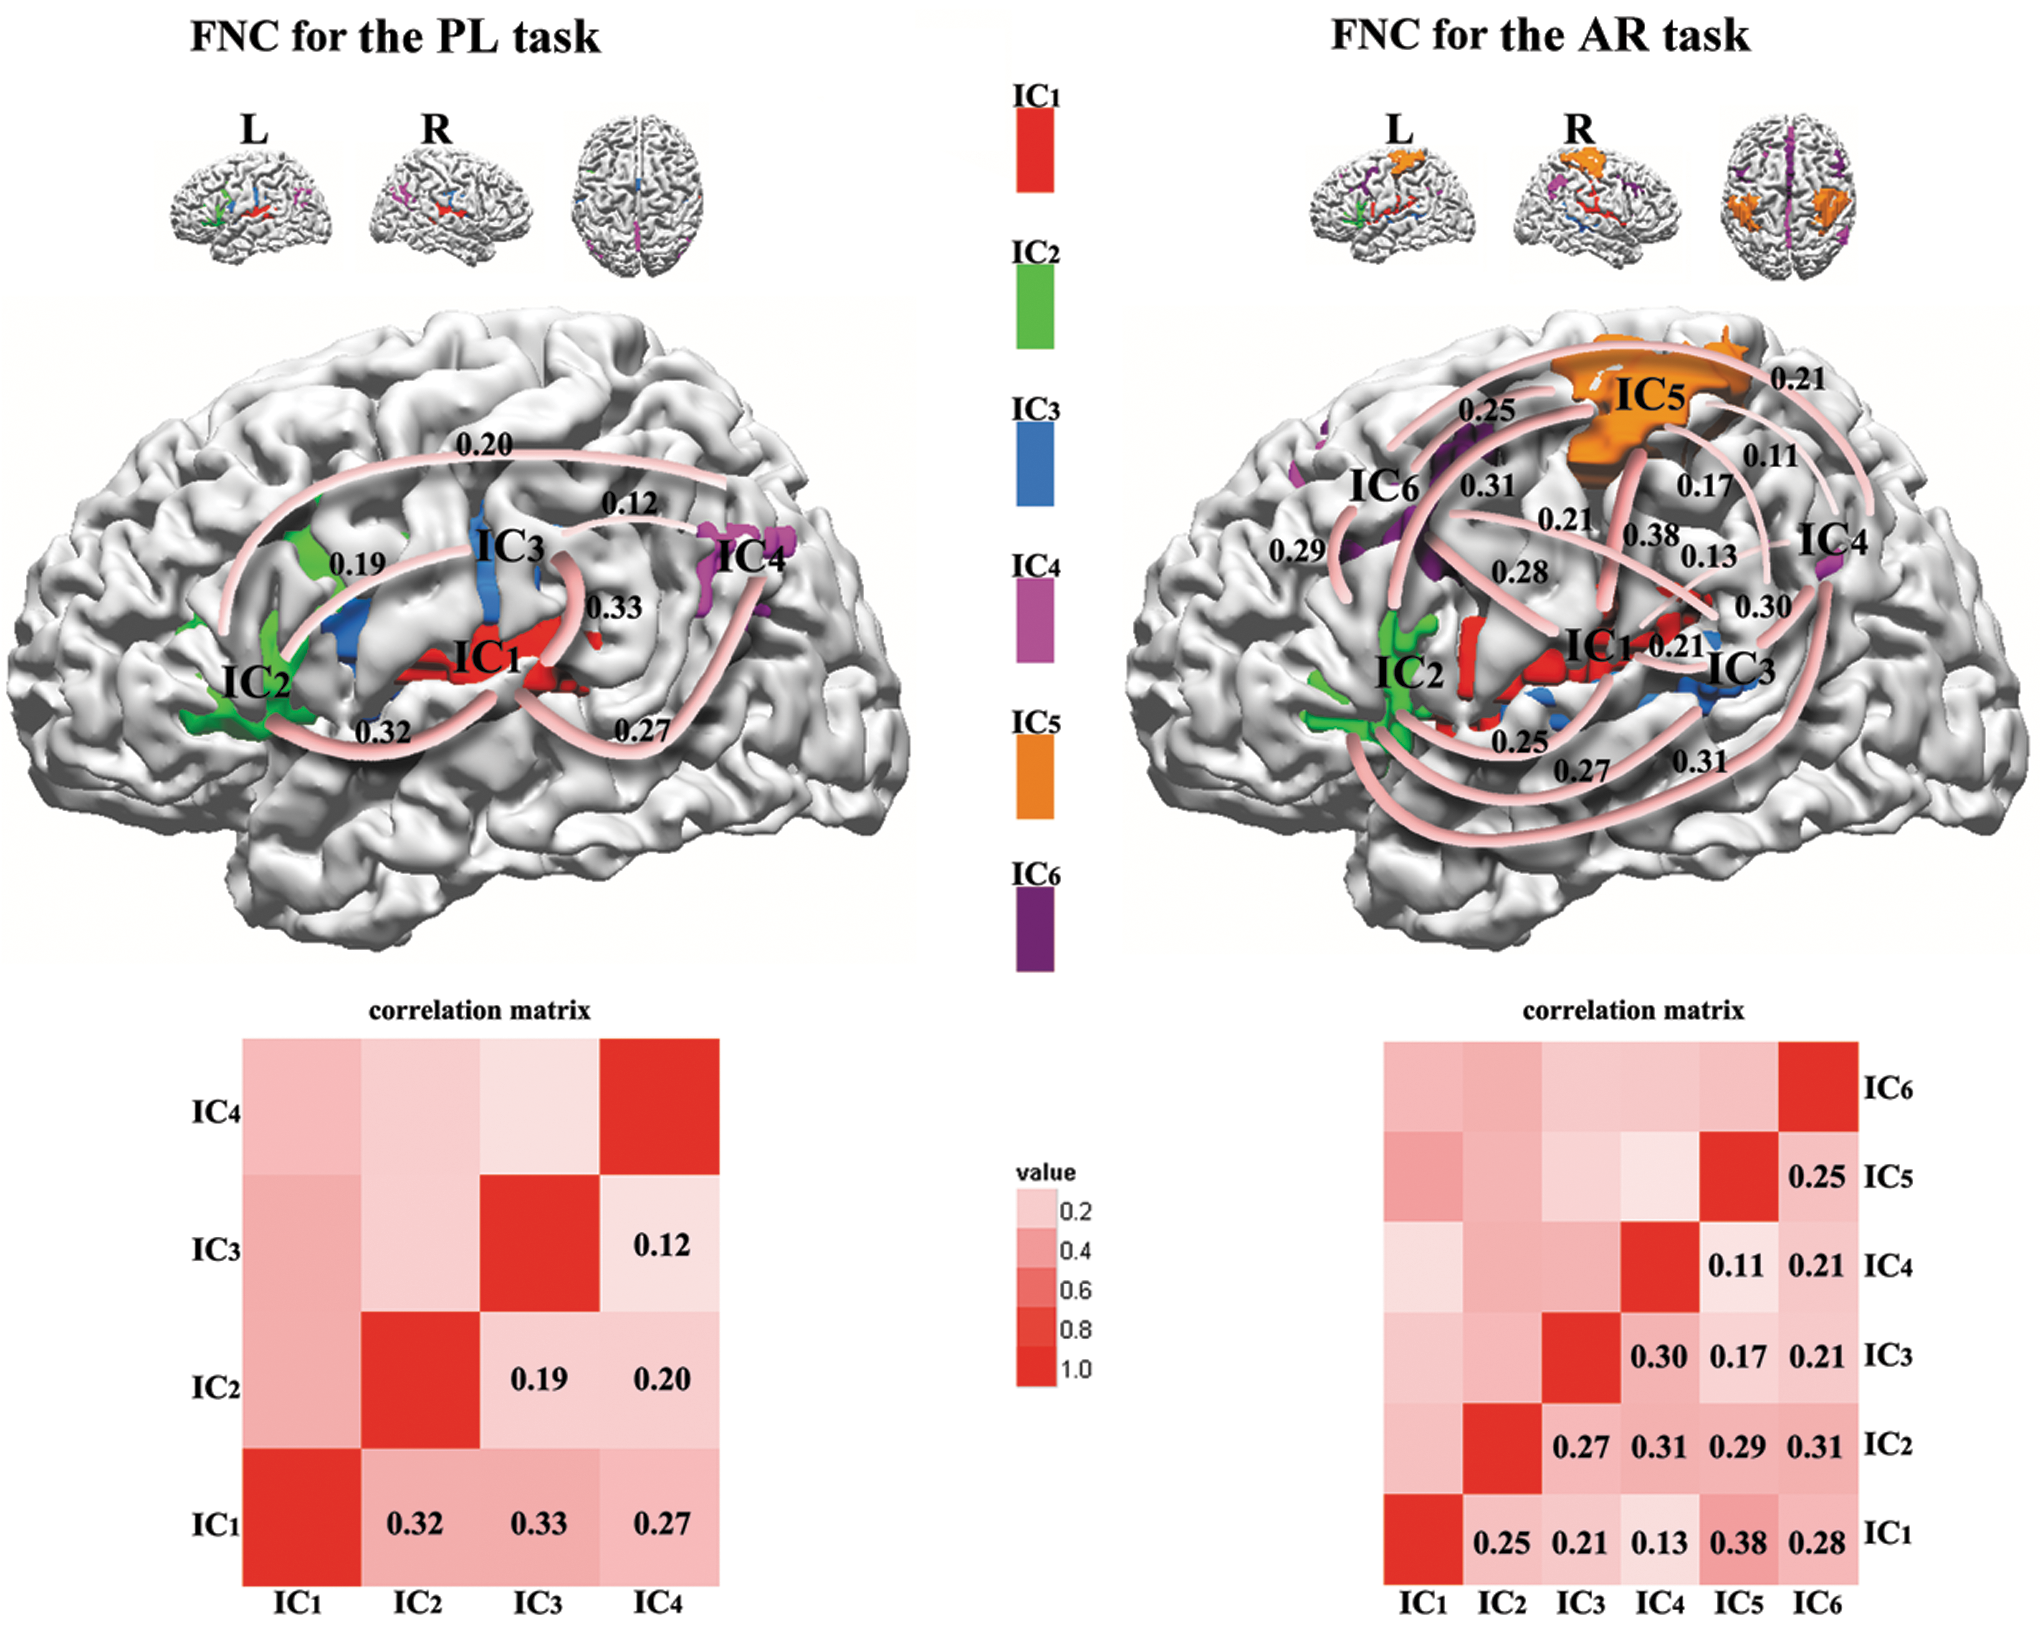
Functional network connectivity (FNC) maps are shown in three-dimensional rendered brain space (p<0.05, false discovery rate corrected). Correlation matrices are plotted using red gradient color to represent correlation strength. All the ICs are color coded. Red: IC1; green: IC2; blue: IC3; magenta: IC4; orange: IC5; purple: IC6.
FNC correlation with response time
For the AR task, we used Spearman rank order correlation coefficient to test whether there were significant correlations between response time and connectivity strength between ICs. We found significant correlation between response time and connectivity strength between IC2 and IC5 (p<0.05, Bonferroni-corrected; Fig. 6). Note that this connection is between the left lateralized IFG network and sensory motor areas in the central sulcus related to button responses.

The FNC between IC2 and IC5 (indicated by the yellow line) is positively correlated with response time for n=21 participants. The linear regression between response time and FNC for this connection is highly significant with Spearman's rho=0.71 (p=0.004).
Discussion
The main findings from our study can be summarized in five key points: (1) The AR task stimulates more extensive FNC than the PL task with higher order neurocognitive elements needed for online narrative comprehension; namely attention and working memory. (2) Only the AR task elicits the sensorimotor (IC5) and the left dorsolateral prefrontal (IC6) networks. (3) The two versions of the narrative comprehension task activate similar brain networks including auditory, temporo-parietal, and frontoparietal language networks covering PAC, Wernicke's area, and Broca's area. (4) The spatial maps of ICs from each of the three sequential volumes acquired during the AR task highlight the same cortical regions. (5) Significant correlation is found between the online response time during the AR task and the strength of connectivity between IC2 and IC5 (IFG-sensorimotor). In the following paragraphs, we discuss these findings and their relevance to the current literature in detail.
The study demonstrates that attention and working memory are key elements of the narrative comprehension network in the adolescent brain as demonstrated by the multiple connections between IC6 and other elements of the narrative comprehension network. In this respect, this higher-order neurocognitive component of the narrative comprehension network represents a hub for processing of the narrative stream for comprehension (Bullmore and Sporns, 2009; Sporns, 2012). Using ICA we have validated previous models for narrative comprehension using the PL task while extending this model using the AR task in 21 adolescents to examine the FNC between ICs for both tasks. In addition, we have investigated the correlation between the basic brain network activated during story listening and higher-order neurocognitive elements that enable narrative comprehension using the AR version of the narrative comprehension task.
The AR task activated additional bilateral sensorimotor (IC5) and left dorsolateral prefrontal (IC6) networks, which can be attributed to the different cognitive strategic aspects of the two versions as we reported in our previous study (Vannest et al., 2009a). In our previous study (Vannest et al., 2009a), we used GLM to identify the differences in brain activity between the two versions, whereas in this study we used ICA to further explore the complex narrative comprehension networks between the two versions. During the AR task, the increased activation in the dorsolateral prefrontal networks is likely associated with working memory and maintenance of attention (Paulesu et al., 1993; Smith et al., 1998; Vannest et al., 2009a). The sensorimotor network covering precentral and postcentral gyrus is associated with motor planning of the button push. An additional region of activation in the ACC on the medial surface of the frontal lobe of the IC4 is likely to be involved in the regulation of attention and contributes to performance monitoring as suggested by other studies (Carter et al., 1998; Macdonald et al., 2000).
We found a great deal of overlap in spatial maps of IC1, IC2, IC3, and IC4 between the two versions, which indicates similar functional-anatomic network involvements. For both tasks, major regions in IC1 and IC3, including the left lateral STG (BA 21/22), MTG (BA 21/22), and PAC (BA 41/42), IPL (BA 40), precentral and postcentral gyrus (BA 6, 43), are related to perception of aurally presented story stimuli and word recognition, in line with other studies (Binder et al., 2011; Maiza et al., 2011; Mar, 2004; Schmithorst et al., 2006; Scott and Wise, 2004; Szaflarski et al., 2012; Xu et al., 2005). The left lateralized network covering IFG (BA 45/47) in IC2, which is crucial to syntactic processing is present in both versions (Karunanayaka et al., 2007; Szaflarski et al., 2012; Vannest et al., 2009a). Somewhat surprisingly, conventional Broca's area (BA 44) is only present in IC2 for the PL task but not for the AR task. This activity points to the role of BA 44 in syntactic processing of the narrative stream, which weighs more heavily in the PL task than the AR task (Karunanayaka et al., 2007). The PCC present in IC4 was hypothesized to be associated with the incorporation of information into a story structure (Mar, 2004). The parahippocampal gyrus in IC4 is associated with memory encoding and retrieval, in line with previous studies (Gaillard, 2004; Karunanayaka et al., 2007; Mar, 2004; Schmithorst et al., 2006; Xu et al., 2005). Xu and coworkers (2005) observed right hemisphere activity increased dramatically at the end of story when narrative details must be combined into a coherent whole. The right lateral supramarginal gyrus (BA 40) and STG (BA 22/39) in IC4 likely contribute to the synthesis of narrative story segments into a coherent whole story (Xu et al., 2005).
In the AR version of the narrative comprehension task, we found no significant difference among the spatial maps of ICs between volumes after FWE-correction, though we found less activation in bilateral auditory network for the third volume compared with the other two volumes. This finding indicates that the third volume is least sensitive to the brain activity associated with the auditory stimulus that ended at least 4 sec prior to acquisition of the volume. In other words, the third volume is most sensitive to the brain activity involved in the late stage of whole narrative comprehension process including syntactic processing and integration.
FNC, a recent extension of functional connectivity measure, was used to characterize FNC among ICs (Havlicek et al., 2009; Jafri et al., 2008). This novel approach proposed by Jafri and colleagues (2008) has been successfully utilized to compare resting state networks (RSNs) between schizophrenia patients and healthy controls, and to investigate RSNs among patients with temporal lobe epilepsy, mixed partial epilepsy, and healthy controls (Luo et al., 2012). In this study, we used FNC method to investigate the network connectivity among ICs instead of ROI-based structural equation modeling technique. The AR task elicited two additional ICs (IC5 and IC6), which reduced the connectivity among the other four ICs (IC1, IC2, IC3, and IC4; Fig. 5). For the PL task, the macro-level connectivity among networks greatly resembled the macro-level connectivity model detected by our previous large cohort fMRI studies (Karunanayaka et al., 2007; Schmithorst et al., 2007). However, further investigation of effective connectivity using high temporal resolution data from magnetoencephalography is necessary to establish directed information flows and causal relationship within the networks.
As noted in the Methods section, the AR task differs from the PL task in terms of the continuity of the story segments presented to the listener. The AR task may place demands on additional higher order neurocognitive domains that are not required to the same extent for the PL task. In particular, the neural elements highlighted in IC6 represent attention, working memory, and other executive functions that are not activated to the same extent in the PL task. Yet, the mean accuracy of correct responses to comprehension questions for the AR task is significantly higher than for the PL task. This could be due to the proximity of the comprehension questions to the story segments in the AR task compared with the PL task, in which comprehension tests are administered after the MRI scanning session. The magnitude of the differences in response accuracy between the tasks may also be attenuated because the questions during the AR task are answered in the MRI scanner; an unnatural setting that could be a distractor for children. It is also possible that the response accuracy in the AR task condition is improved because the listener has only to answer questions that are directly related to the two sentence story segment heard immediately prior to the questions. In this case the listener does not need to retain the entire story sequence in memory to provide accurate responses. On the other hand, the listener does not have the entire narrative stream of each story available during the AR task to provide context for comprehension accuracy.
To further understand the neural substrates supporting AR narrative comprehension task, we correlated online performance data from the AR version with the connection strength for all of the network combinations. Interestingly, only one network connection between IC2 and IC5 showed significant positive correlation with the response time (Fig. 6). The major region in IC2 covers the left IFG (BA 45/47), an area crucial for controlled semantic retrieval processes (Gabrieli et al., 1998; Thompson-Schill et al., 1997). The main regions in IC5 include MFG (BA 6), precentral and postcentral gyrus (BA 4, 6), which are crucial for motor planning (Table 1). Our results suggest participants who took longer time to respond to the comprehension questions are likely to maintain stronger connection between the IFG and premotor cortex because they need more time to retrieve the story contents. This finding is consistent with our expectation that those who require less effort to answer the questions would also respond more quickly.
Conclusions
In summary, this is the first study that uses ICA paired with FNC analysis to examine how the language networks change with subtle changes in the structure of a narrative comprehension task. Both versions of the task successfully engaged language networks supporting narrative comprehension. Besides the similarity, the AR task elicited more extensive networks involving additional memory, attention, self-monitoring, and premotor planning networks due to the requirement of real-time responses to the comprehension questions. Thus, the AR task may be appropriate for older children or adults, but not for younger children, whereas the PL task can be used even when the participant is sleeping (Wilke et al., 2003) or is in sedation (Patel et al., 2007). Furthermore, the use of temporal sparse acquisition technique in the AR task allows us to acquire real-time behavior measures, leading to our findings of significant positive correlation between the online response time and the connectivity strength between the frontal language network and sensorimotor network, which connects behavioral measures with imaging data.
Footnotes
Acknowledgments
This study was supported in part by a grant from the U.S. National Institutes of Health (NIH grant R01-HD38578, P.I. S.K.H). The authors acknowledge the assistance of Ms. Kate Hibbard, Ms. Julie Franks, Ms. Sara Robertson, and Ms. Amanda Huber for helping with recruitment and data collection, and Mr. Kendall O'Brien and Ms. Amanda Woods, for performing all the MRI scans.
Author Disclosure Statement
No competing financial interests exist.