
Abstract
The human inferior parietal lobule (IPL) comprised the lateral bank of the intraparietal sulcus, angular gyrus, and supramarginal gyrus, defined on the basis of anatomical landmarks and cytoarchitectural organization of neurons. However, it is not clear as to whether the three areas represent functional subregions within the IPL. For instance, imaging studies frequently identified clusters of activities that cut across areal boundaries. Here, we used resting-state functional magnetic resonance imaging (fMRI) data to examine how individual voxels within the IPL are best clustered according to their connectivity to the whole brain. The results identified a best estimate of seven clusters that are hierarchically arranged as the anterior, middle, and posterior subregions. The anterior, middle, and posterior IPL are each significantly connected to the somatomotor areas, superior/middle/inferior frontal gyri, and regions of the default mode network. This functional segregation is supported by recent cytoarchitechtonics and tractography studies. IPL showed hemispheric differences in connectivity that accord with a predominantly left parietal role in tool use and language processing and a right parietal role in spatial attention and mathematical cognition. The functional clusters may also provide a more parsimonious and perhaps even accurate account of regional activations of the IPL during a variety of cognitive challenges, as reported in earlier fMRI studies.
Introduction
As a brain area with heterogeneous functions, the human inferior parietal lobule (IPL) comprises the lateral bank of the intraparietal sulcus (lbIPS), angular gyrus (AG), and supramarginal gyrus (SMG)—which are defined on the basis of anatomical landmarks and cytoarchitectural organization of neurons as studied by the German anatomist Korbinian Brodmann (Garey, 2006; Tzourio-Mazoyer et al., 2002). The SMG and AG each corresponds to Brodmann area 39 and 40, and adjoins lbIPS, forming the IPL, as opposed to the superior parietal lobule, which is on the medial bank of the IPS. Numerous studies showed that each of these three subdivisions plays an important role in cognitive processes. For instance, the lbIPS has been implicated in visuo-spatial attention (Corbetta and Shulman, 2002; Egner et al., 2008), motion perception (Claeys et al., 2003), visual memory (Xu and Chun, 2009), tool use (Ishibashi et al., 2011; Peeters et al., 2009), semantic processing (Chou et al., 2006a, 2006b), and mathematical cognition (Ansari, 2008; Cohen et al., 2000; Cohen Kadosh et al., 2007; Nieder and Dehaene, 2009; Piazza et al., 2007). The AG is involved in the memory of multiple sensory modalities (Cabeza et al., 2008; Hutchinson et al., 2009; Uncapher and Wagner, 2009), visual attention (Chambers et al., 2004), motion perception (Martinez-Trujillo et al., 2007), mathematical cognition (Dehaene et al., 2004; Delazer et al., 2003; Grabner et al., 2009), and language and semantic processing (Awad et al., 2007; Binder et al., 2009; Brownsett and Wise, 2010; Chou et al., 2006a, 2006b; Raposo et al., 2006; Sharp et al., 2010; Vigneau et al., 2006). Activations have been reported in the SMG in behavioral tasks that required visual attention (Chambers et al., 2004; Stevens et al., 2005), working memory (Daselaar et al., 2004; Sommer et al., 2006; Uncapher and Wagner, 2009), motion perception (Martinez-Trujillo et al., 2007), and semantic processing (Raposo et al., 2006).
Altogether, the three regions appear to overlap functionally in multiple sensorimotor and cognitive domains, raising the possibility that these different perceptual and cognitive processes may selectively involve subregions of the IPL that can be functionally aggregated beyond the anatomical boundaries which define the lbIPS, AG, and SMG. For instance, the lbIPS, AG, and SMG were involved in memory encoding and retrieval (Clark and Wagner, 2003; Daselaar et al., 2004; Davachi et al., 2001; Otten and Rugg, 2001; Wagner and Davachi, 2001). However, these memory-related activities appear to concentrate at the boundaries of the lbIPS and AG (Clark and Wagner, 2003; Otten and Rugg, 2001), the lbIPS and SMG (Clark and Wagner, 2003; Wagner and Davachi, 2001), or the SMG and AG (Clark and Wagner, 2003; Daselaar et al., 2004; Otten and Rugg, 2001; Wagner and Davachi, 2001). Both lbIPS and AG were associated with semantic processing, but the activations were located at the boundary of the lbIPS and AG (Chou et al., 2006b). These findings suggest functional clusters that do not conform to the Brodmann demarcation of the IPL.
Indeed, recent studies accounting for topographical variability and using a quantitative, observer-independent definition of cytoarchitectonic borders showed that the IPS, SMG, and AG can each be divided into three, five, and two distinct subregions (Caspers et al., 2006, 2008; Choi et al., 2006; Scheperjans et al., 2008a, 2008b). Studies of white matter tractography based on diffusion-weighted imaging (DWI) (Mars et al., 2011; Wang et al., 2012) and those of functional clustering based on resting-state connectivity (Doucet et al., 2011; Nelson et al., 2010; Power et al., 2011; Yeo et al., 2011) also defined subregions that did not follow the boundaries of the IPS, AG, and SMG. However, none of these studies have systematically examined how these subregions are related to the IPS, AG, and SMG, as widely “localized” in functional neuroimaging.
Numerous studies have suggested connectivity analysis of resting-state functional magnetic resonance imaging (fMRI) data as a useful alternative to characterize functional subdivisions of a brain region. This approach parceled brain areas on the basis that each subregion has a unique pattern of connectivities—a “functional fingerprint” (Passingham et al., 2002). Specifically, low-frequency blood oxygenation level-dependent (BOLD) signal fluctuations reflect connectivity between functionally related brain regions (Biswal et al., 1995; Fair et al., 2007; Fox and Raichle, 2007). Studies of this “spontaneous” activity have provided insights into the intrinsic functional architecture of the brain and shown that the spontaneous fluctuations are present in many neuroanatomical systems, including motor, visual, auditory, default mode, memory, language, dorsal attention, and ventral attention systems (Fox and Raichle, 2007). Based on the findings that regions with similar functionality tend to be correlated in their spontaneous BOLD activity, investigators described subareal boundaries for the thalamus (Zhang et al., 2008, 2010), basal ganglia (Barnes et al., 2010), medial superior frontal cortex (Kim et al., 2010; Zhang et al., 2012a), anterior cingulate cortex (Margulies et al., 2007), orbitofrontal cortex (Kahnt et al., 2012), cerebellum (O'Reilly et al., 2010), and precuneus (Cauda et al., 2010; Margulies et al., 2009; Zhang and Li, 2012).
Here, we examined the functional subdivisions of the IPL by employing a voxelwise approach and clustering individual voxels according to their “functional fingerprint” or pattern of connectivity to the entire brain. We have three specific aims. First, we investigated functional subdivisions of the entire IPL by characterizing both cortical and subcortical connectivities of a large resting-state fMRI data set. In particular, previous studies suggested the AG to be a part of the default mode network or DMN (Buckner et al., 2008; Fox et al., 2005; Greicius et al., 2003; Raichle et al., 2001). Since this brain region harbors heterogeneous functions, we examined which part of the AG belongs to the DMN. Second, we examined the differences in regional connectivities and highlighted the opposing pattern of connectivities between the identified IPL subdivisions. Third, a previous work on connectivity-based IPL parcellation did not examine hemispheric differences. We, thus, explored hemispheric differences in IPL connectivity given their importance in parietal functioning. We hope that the new data will facilitate future studies of IPL functions.
Materials and Methods
Resting-state data
A total of 225 healthy subjects' resting-state fMRI data were pooled from three datasets (Leiden_2180/Leiden_2200, Newark, and Beijing_Zang, n=144) downloadable from the 1000 Functional Connectomes Project (Biswal et al., 2010) and our laboratory (n=81). Data was recoded as one scan per participant under 3-T magnet with 18–53 (mean=24) years of age, 109 men, duration: 4.5–10 min and eyes closed during scans (Table 1). Individual subjects' images were viewed one by one to ensure that the whole brain was covered.
Demographic Data and Imaging Parameters for the Resting-State Functional Magnetic Resonance Imaging Datasets Selected from the Image Repository for the 1000 Functional Connectomes Project and Our Own Dataset
M, males; F, females; TR, repetition time.
Imaging data preprocessing
Brain imaging data were preprocessed using Statistical Parametric Mapping (SPM 8; Wellcome Department of Imaging Neuroscience, University College London, United Kingdom), as described in our previous work (Zhang et al., 2012a; Zhang and Li, 2012). Briefly, images of each individual subject were first realigned (motion corrected) and corrected for slice timing. Individual structural image was normalized to a Montreal Neurological Institute (MNI) echo-planar imaging template with affine registration followed by nonlinear transformation (Ashburner and Friston, 1999; Friston et al., 1995). The normalization parameters determined for the structural volume were then applied to the corresponding functional image volumes for each subject. Finally, the images were smoothed with a Gaussian kernel of 8 mm at Full Width at Half Maximum.
Additional preprocessing was applied to reduce spurious BOLD variances that were unlikely to reflect neuronal activity (Fair et al., 2007; Fox et al., 2005; Fox and Raichle, 2007; Rombouts et al., 2003). The sources of spurious variance were removed through linear regression by including the signal from the ventricular system, the white matter, and the whole brain, in addition to the six parameters obtained by rigid body head motion correction. First-order derivatives of the whole brain, ventricular, and white matter signals were also included in the regression.
Cordes and colleagues suggested that BOLD fluctuations below a frequency of 0.1 Hz contribute to regionally specific BOLD correlations (Cordes et al., 2001). The majority of resting-state studies low-pass filtered BOLD signal at a cut-off of 0.08 or 0.1 Hz (Fox and Raichle, 2007). Thus, we applied a temporal band-pass filter (0.009 Hz<f<0.08Hz) to the time course in order to obtain low-frequency fluctuations (Fair et al., 2007; Fox et al., 2005; Fox and Raichle, 2007; Lowe et al., 1998).
Linear correlations with 116 anatomical masks
We used the anatomical parcelation algorithm to delineate 116 automated anatomical labeling (AAL) masks from the MNI template (Tzourio-Mazoyer et al., 2002). Each of the BOLD time courses was averaged spatially for all 116 seed regions. We computed the correlation coefficient between the average time course of each mask and the time courses of each of the individual voxels of the IPL for individual subjects.
To assess and compare the resting-state “correlograms,” we converted these image maps, which were not normally distributed, to z score maps by Fisher's z transform (Berry and Mielke, 2000; Charles et al., 2004; Jenkins and Watts, 1968): z=0.5log e [(1+r)/(1−r)]. The z maps were used in group, random-effect analyses (Penny et al., 2004). A one-sample t-test was applied to the “z maps” across 225 subjects for each of the 116 correlograms for a further analysis.
Parcelation of the IPL based on functional connectivity
Voxels within the entire IPL, defined by combining masks of the lbIPS, AG, and SMG from an MNI template created by Tzourio-Mazoyer et al. (2002), were subject to functional connectivity-based segmentation, with each voxel represented by 116 t values. A K-means algorithm was applied to cluster the voxels within the IPL on the bases of the 116 t values.
As an unsupervised learning algorithm, K-means clustering classifies a given data set into an a-priori set of K clusters by minimizing an objective squared error function as shown in Equation (1):
where 1. Placing K points into the space represented by the objects that are being clustered. These points represent initial group centroids. 2. Assigning each object to the group that has the closest centroid. 3. When all objects have been assigned, recalculating the positions of the K centroids. 4. Repeating Steps 2 and 3 until the centroids no longer move. This produces a separation of the objects into groups from which the metric to be minimized can be calculated.
In order to determine the optimal number of clusters that best described the data set, we used the Bayesian Information Criterion (BIC) (Gentle et al., 2004; Schwarz, 1978), which is widely used for model identification in time series and linear regression:
where n is the number of observations; k is the number of the class; and RSS is the residual sum of squares from the K-means model. Given any two clustering number ks, the one with a lower BIC value was preferred. Further, since the K-means algorithm is sensitive to the initial, randomly selected cluster centers, we repeated this algorithm 1000 times to alleviate the effect of the initial conditions.
Results
The results of 1000 runs of K-means clustering suggested an optimal cluster number of seven according to the BIC (Supplementary Fig. S1a; Supplementary Data are available online at
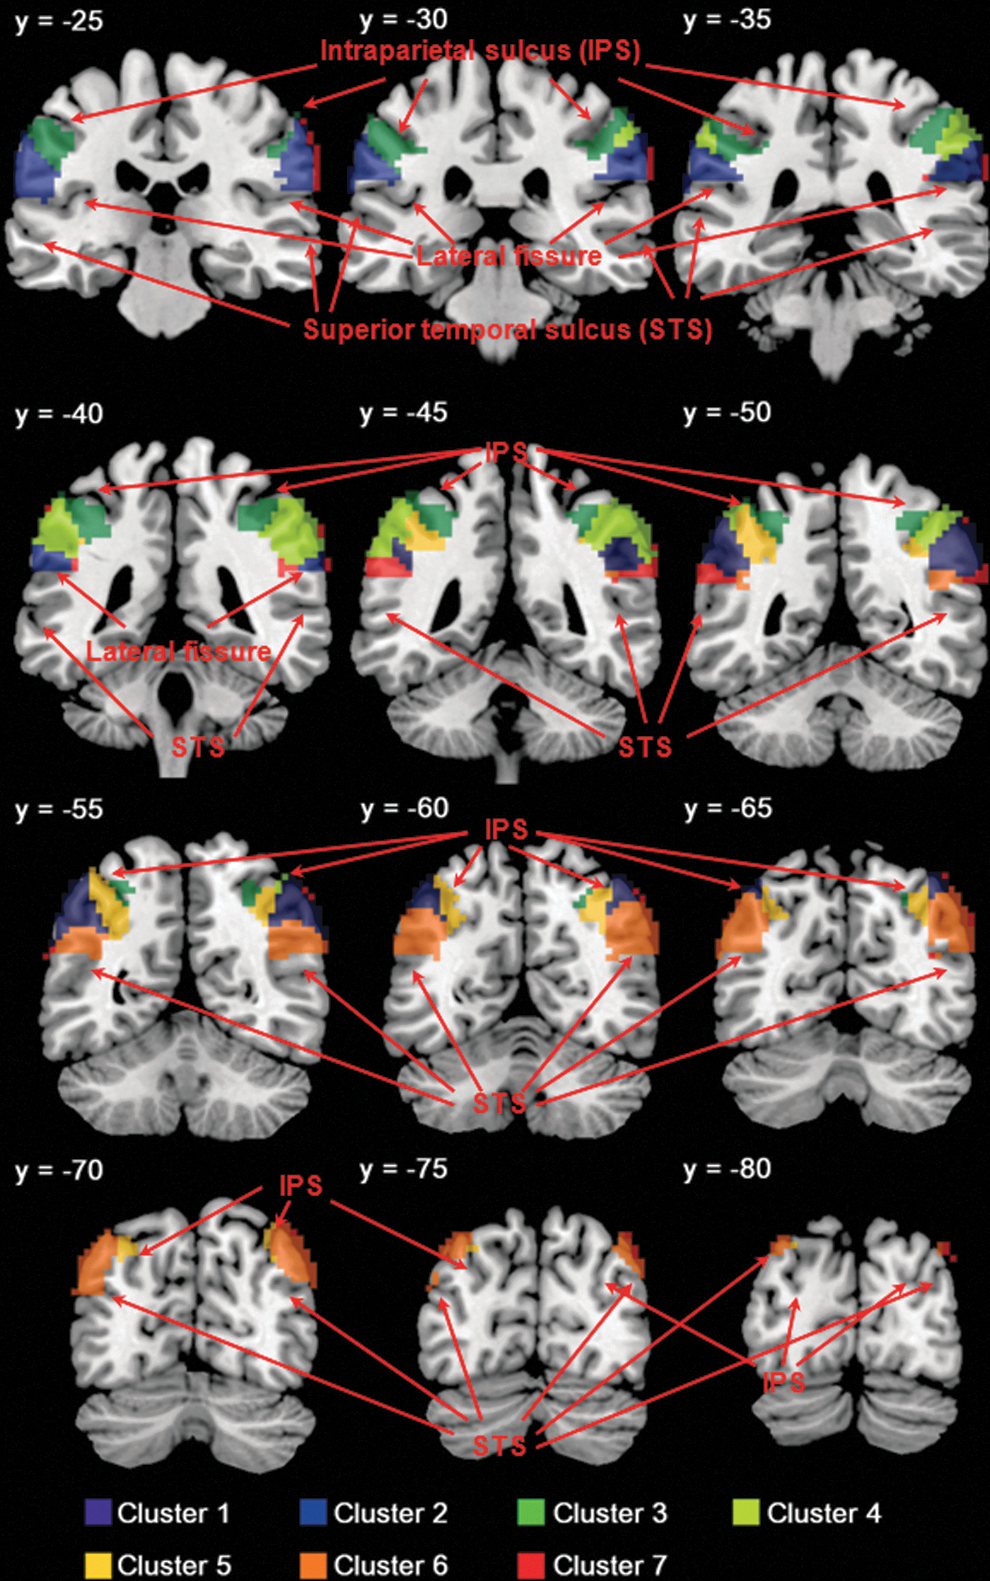
K-means clustering of functional connectivities of individual voxels segments in the inferior parietal lobule (IPL) to seven clusters. Clusters are in different colors and overlaid on a T1 structural image in coronal slices at y=−25, −30, −35, −40, −45, −50, −55, −60, −65, −70, −75, −80 mm.
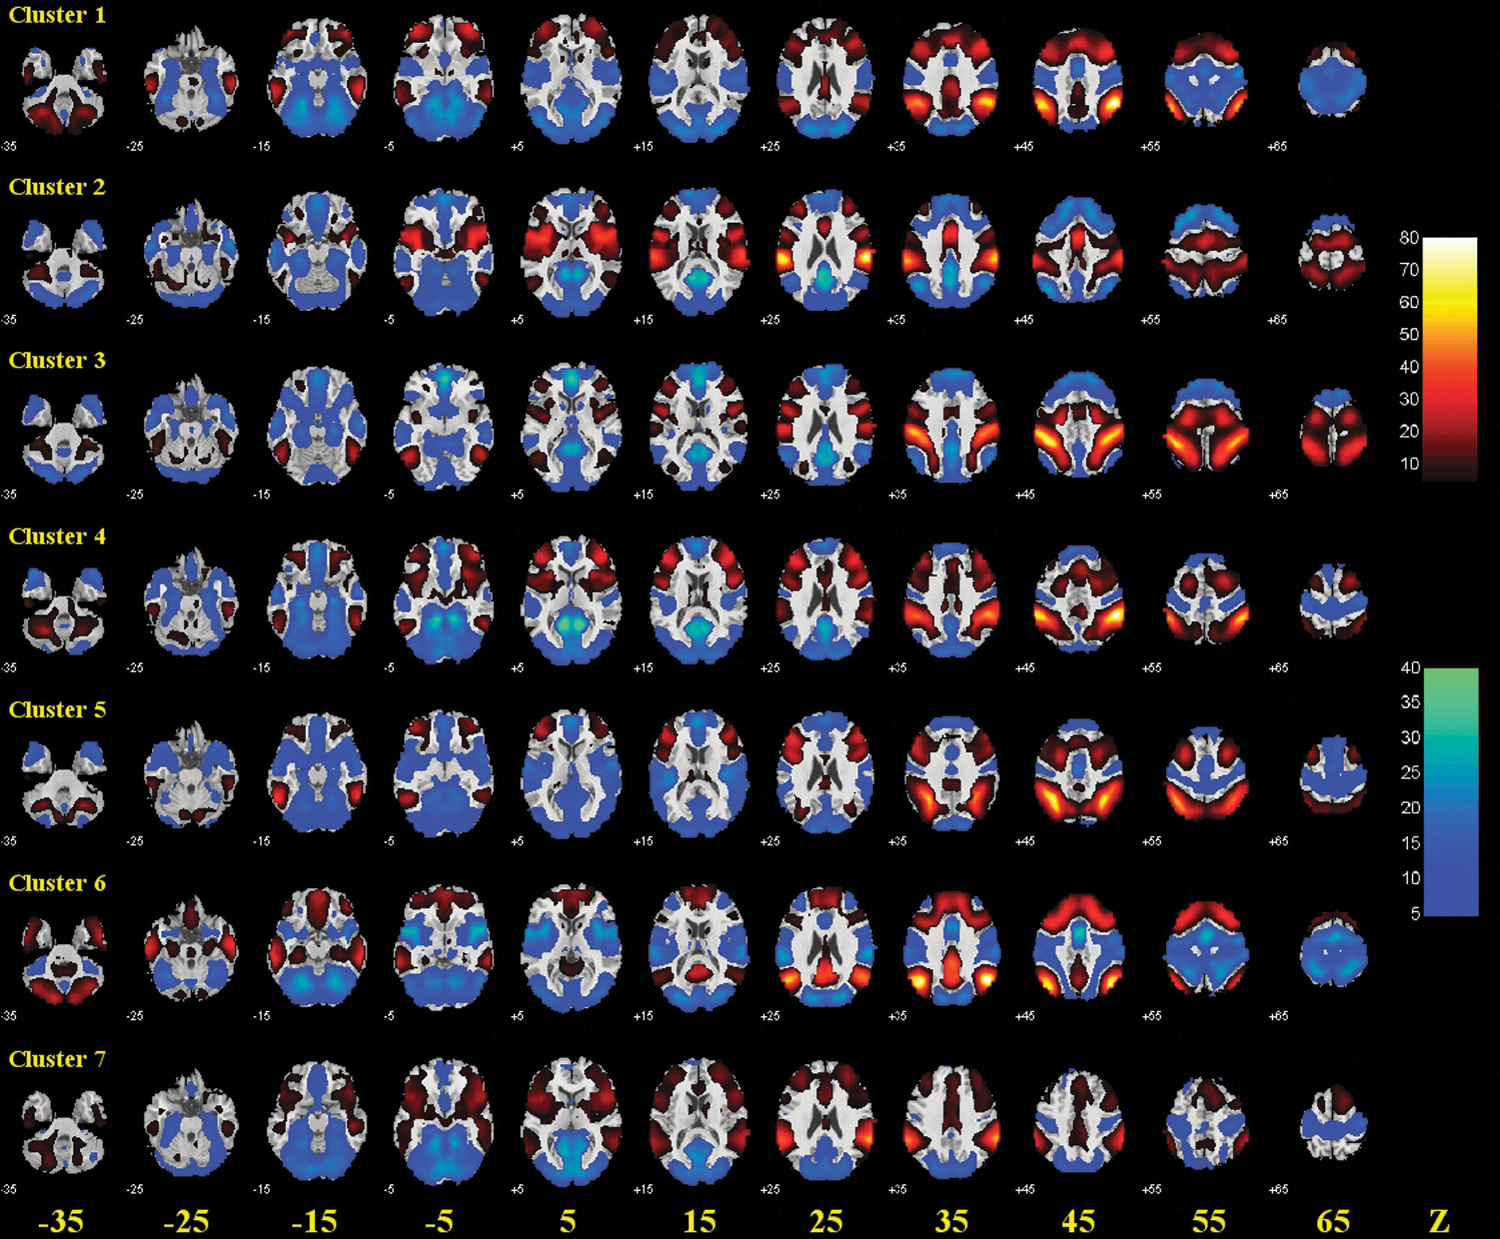
Group results of voxel-wise functional connectivity of each of the seven clusters of the IPL. Positive (warm color) and negative (cold color) correlations were superimposed on axial slices at Z=−35, −25, −15, −5, 5, 15, 25, 35, 45, 55, 65 mm of a structural image. n=225, p<0.05, corrected for family-wise error or family-wise error of multiple comparisons. Color scales reflect T values of one-sample t test.
To examine the relationship of the seven clusters identified from K-means clustering, we applied hierarchical clustering to their connectivity maps (see Supplementary Methods for details). The results showed that the seven clusters were broadly divided into the anterior (clusters 2, 3), middle (cluster 1, 4, 5, 7), and posterior (clusters 6) IPL (Supplementary Fig. S1b). We, thus, re-ran K-means clustering for a three-cluster solution. The results confirmed segmentation of the IPL into anterior, middle, and posterior subdivisions (Fig. 3). Figure 3 contrasts the areal boundaries of the three clusters as combined from seven subclusters, the three clusters identified directly from K-means clustering, and the lbIPS, SMG, and AG masks from the AAL atlas.

Comparison between
The anterior IPL (clusters 2 and 3)
The anterior IPL comprised the dorsal-anterior IPL (cluster 3, 75% voxels from the lbIPS, 23% voxels from the SMG, and 2% voxels from the AG) and the ventral-anterior IPL (cluster 2, 100% voxels from the SMG) (Fig. 1; Table 2).
Volume Percentages of Each of the Seven Inferior Parietal Lobule Clusters
A%=Vij/Vj and B%=Vij/Vi , where i=our cluster 1, 2,…, 7; j=lbIPS, SMG, and AG; Vij is the number of voxels from the intersection of our cluster i and lbIPS/SMG/AG; Vi is the number of voxels from our cluster i; and Vj is the number of voxels from lbIPS/SMG/AG.
A%, the volume percentage of the cluster relative to the lbIPS/SMG/AG; B%, the volume percentage of voxels within the lbIPS/SMG/AG relative to the whole cluster.
IPL, inferior parietal lobule; lbIPS, intraparietal sulcus; SMG, supramarginal gyrus; AG, angular gyrus.
The anterior IPL (both clusters 2 and 3) showed positive connectivity with the primary motor cortex, bilateral opercular and left triangular part of the inferior frontal gyri, rolandic operculum, supplementary motor area, insula, postcentral gyrus, superior parietal lobule, as well as left cerebellar lobules, and negative connectivity with the middle and medial parts of the orbital frontal gyri, left olfactory bulb, medial superior frontal gyrus, gyrus rectus, posterior cingulate gyrus, parahippocampus, calcarine sulcus, cuneus, fusiform gyrus, precuneus, as well as cerebellar lobules III, IV, V, and vermis lobules III, IV, V (Schmahmann et al., 1999, 2000) (Fig. 2 and Supplementary Table S1).
The anterior IPL also showed positive connectivity with the middle frontal gyrus, left inferior occipital gyrus, left paracentral gyrus, and right cerebellar lobules (dorsal-anterior IPL; cluster 3), and with the right triangular part of the inferior frontal gyrus, orbital part of the inferior frontal gyrus, middle cingulate gyrus, amygdala, right paracentral gyrus, putamen, pallidum, thalamus, Heschl's gyrus, superior temporal gyrus/pole, and right middle temporal pole (ventral-anterior IPL; cluster 2); and negative connectivity with the right olfactory bulb, anterior cingulate gyrus, amygdala, right middle temporal gyrus, and left middle temporal pole (dorsal-anterior IPL; cluster 3), and with the superior, middle, and inferior occipital gyri, and left cerebellar lobule VI (ventral-anterior IPL; cluster 2) These results are shown in Figure 2 and summarized in Supplementary Table S1.
The middle IPL (clusters 1, 4, 5, and 7)
The middle IPL comprised the dorsal anterior-middle IPL (cluster 4, 60% voxels from the lbIPS and 40% voxels from the SMG), ventral anterior-middle IPL (cluster 7, 79% voxels from the SMG, 13% voxels from the AG, and 8% voxels from the lbIPS), lateral posterior-middle IPL (cluster 1, 57% voxels from the lbIPS, 30% voxels from the AG, and 13% voxels from the SMG), and medial posterior-middle IPL (cluster 5, 67% voxels from the lbIPS, and 33% voxels from the AG) (Fig. 1; Table 2).
The middle IPL (clusters 1, 4, 5, and 7) showed positive connectivity with the middle frontal gyrus and triangular part of the inferior frontal gyrus, and negative connectivity with the olfactory bulb, parahippocampus, calcarine, cuneus, right inferior occipital gyrus, fusiform, as well as cerebellar crus I, cerebellar lobules III, IV, V, VI, and vermis lobules III, IV, V, VI, VII (Fig. 2 and Supplementary Table S1).
Other than these connectivities shared by all four clusters of the middle IPL, the anterior-middle IPL (cluster 4 and 7) also showed positive connectivity with the right superior frontal gyrus, opercular part of the inferior frontal gyrus, orbital part of the inferior frontal gyrus, insula, middle cingulate gyrus, putamen, pallidum, and right superior temporal pole, and negative connectivity with the left medial part of the orbital frontal gyrus, gyrus rectus, posterior cingulate gyrus, superior and middle occipital gyri, left inferior occipital gyrus, and cerebellar lobule X. The posterior-middle IPL (cluster 1 and 5) showed positive connectivity with the lateral part of the orbital frontal gyrus and right posterior cingulate gyrus, and negative connectivity with the rolandic operculum, supplementary motor area, amygdala, paracentral gyrus, Heschl's gyrus, superior temporal gyrus, right superior temporal pole, and middle temporal pole (Fig. 2 and Supplementary Table S1).
Positive connectivity was further observed between the dorsal anterior-middle IPL (cluster 4) and the left primary motor cortex, right middle frontal gyrus, lateral part of the orbital frontal gyrus, superior parietal lobule, and cerebellar lobules VIIb, VIII; between the ventral anterior-middle IPL (cluster 7) and the supplementary motor area, medial superior frontal gyrus, anterior cingulate gyrus, superior and middle temporal gyri, and left superior temporal pole; between the lateral posterior-middle IPL (cluster 1) and the superior frontal gyrus, right middle part of the orbital frontal gyrus, right orbital part of the inferior frontal gyrus, medial superior frontal gyrus, right anterior, middle, and left posterior cingulate gyrus, right precuneus, and right caudate; and between the medial posterior-middle IPL (cluster 5) and the left primary motor cortex, opercular part of the inferior frontal gyrus, superior parietal lobule, and right cerebellar crus II and cerebellar lobule VIIb (Fig. 2 and Supplementary Table S1).
Negative connectivity was further observed between the dorsal anterior-middle IPL (cluster 4) and the left middle part of the orbital frontal gyrus, right medial part of the orbital frontal gyrus, precuneus, and Heschl's gyrus; between the lateral posterior-middle IPL (cluster 1) and the right primary motor cortex, superior, middle, and left inferior occipital gyri, postcentral gyrus, as well as cerebellar lobule X and vermis lobules I, II; and between the medial posterior-middle IPL (cluster 5) and the medial superior frontal gyrus, medial part of the orbital frontal gyrus, gyrus rectus, insula, anterior cingulate gyrus, left superior temporal pole, and middle temporal gyrus (Fig. 2 and Supplementary Table S1).
The posterior IPL (clusters 6)
The posterior IPL comprised cluster 6 (92% voxels from the AG, 7% voxels from the lbIPS, and 1% voxels from the SMG) (Fig. 1; Table 2). The posterior IPL showed positive connectivity with the superior and middle frontal gyri, middle and medial parts of the orbital frontal gyri, medial superior frontal gyrus, gyrus rectus, posterior and left middle cingulate gyri, precuneus, inferior temporal gyrus, and right cerebellar lobule IX, and negative connectivity with the primary motor cortex, opercular and orbital parts of the inferior frontal gyri, rolandic operculum, supplementary motor area, insula, amygdala, superior, middle, and inferior occipital gyri, postcentral and paracentral gyri, superior parietal lobule, putamen, right pallidum, Heschl's gyrus, superior temporal gyrus, superior and middle temporal poles, as well as cerebellar crus I, right cerebellar crus II, cerebellar lobule VI, and vermis lobules VI, VII.
Notably, all seven IPL clusters showed negative connectivity with the lingual gyri, and none showed connectivity with the hippocampus, left caudate, right inferior temporal gyrus, left cerebellar lobule IX, and vermis lobules VIII, IX, and X (Fig. 2 and Supplementary Table S1).
Differences in functional connectivity between the IPL subdivisions
We quantified the differences in functional connectivity of the anterior, middle, and posterior IPL. To better represent the results, we separated the whole brain into 116 regions based on the AAL atlas and examined the differences in functional connectivity with each region with paired t tests across the entire cohort of subjects. Results were summarized in Supplementary Tables S2–S4. Later, we described those brain regions showing not only significant differences but also an opposite pattern of connectivity between the three IPL subdivisions (Fig. 4d–f; Table 3).
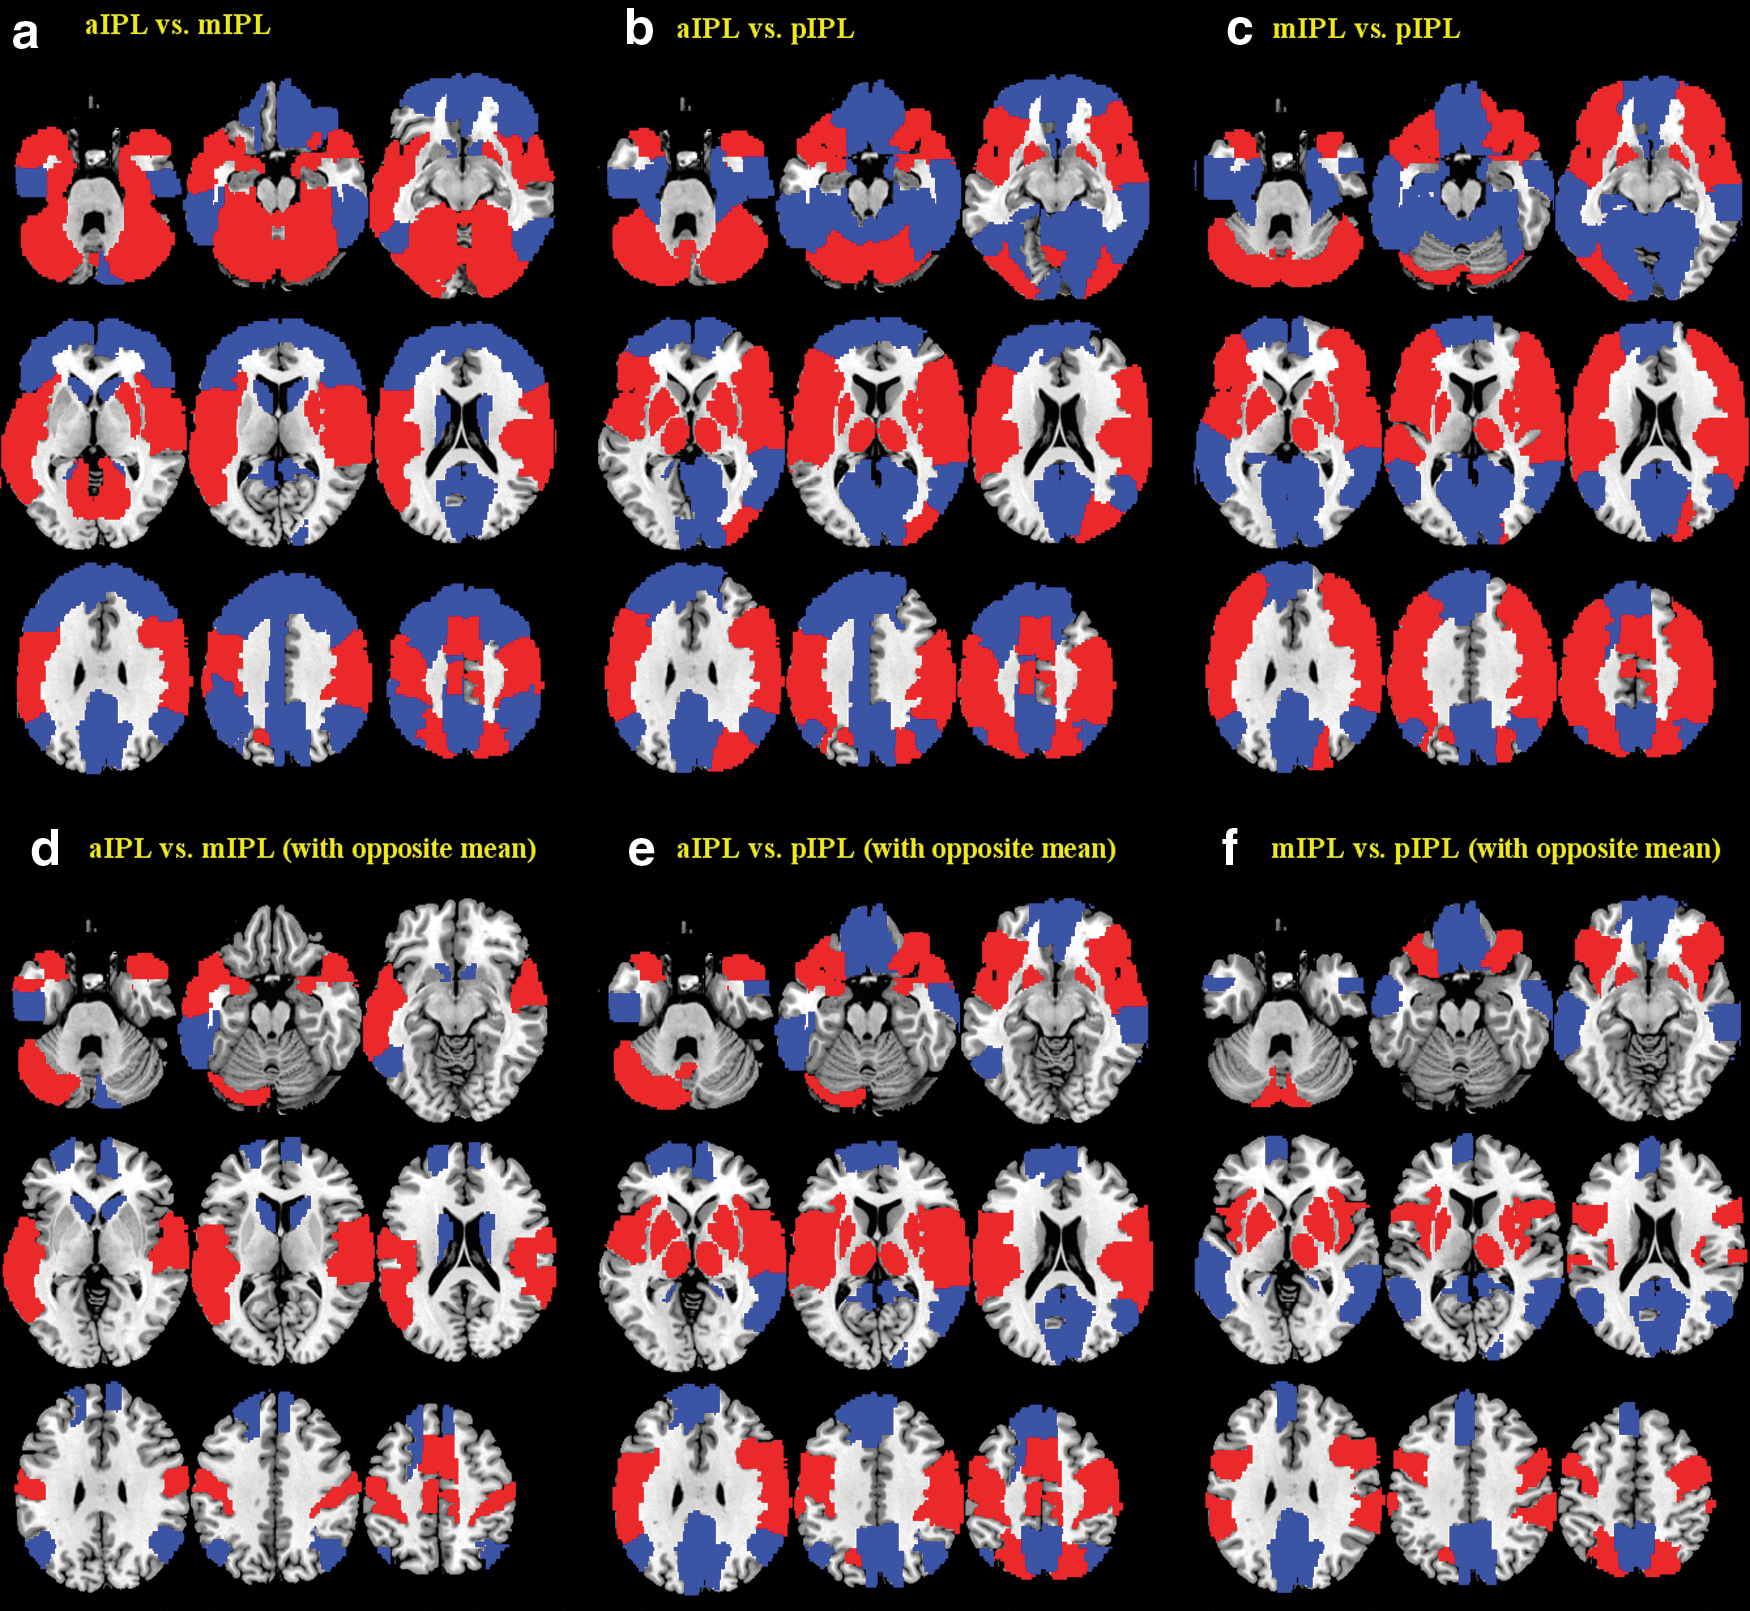
Differences in functional connectivity between anterior (a), middle (m), and posterior (p) IPL [
Differences in Functional Connectivity (p<0.00014, or p<0.05, Corrected for Multiple Comparisons) Between the Anterior and Middle (aIPL Vs. mIPL), Between Anterior and Posterior (aIPL Vs. pIPL), and Between Middle and Posterior IPL (mIPL Vs. pIPL)
Only brain regions showing an opposite pattern of connectivity between the two respective clusters are shown here. “>” indicates aIPL>mIPL, aIPL>pIPL, or mIPL>pIPL, and “<” indicates aIPL<mIPL, aIPL<pIPL, or mIPL<pIPL.
Compared with both the middle and posterior IPL, the anterior IPL showed greater functional connectivity with the rolandic operculum, supplementary motor area, amygdala, postcentral and paracentral gyri, Heschl's gyrus, superior temporal gyrus and pole, right middle temporal pole, and cerebellar crus I, as well as less connectivity with the left superior frontal gyrus, right medial superior frontal gyrus, and left inferior temporal gyrus. Compared with the posterior IPL, both anterior and middle IPL showed greater connectivity with the primary motor cortex, opercular and orbital parts of the inferior frontal gyrus, insula, superior parietal lobule, putamen, pallidum, right thalamus, as well as left cerebellar crus II and left cerebellar lobules VIIb and VIII. Conversely, compared with the anterior and middle IPL, the posterior IPL showed greater connectivity with the middle and medial parts of the orbital frontal gyrus, left medial superior frontal gyrus, gyrus rectus, posterior cingulate gyrus, cuneus, precuneus, and middle temporal gyrus. Compared with the anterior IPL, the middle IPL showed greater connectivity with the caudate and right cerebellar crus II. Compared with the posterior IPL, the anterior IPL showed greater connectivity with the left thalamus and vermis lobule IX, as well as less connectivity with the right cerebellar lobule IX. Compared with the middle IPL, the posterior IPL showed greater connectivity with the right cerebellar crus II.
Hemispheric differences in IPL connectivity
We examined the differences in functional connectivity between the left and right IPL. First, voxels within the left and right IPL mask were subject to functional connectivity-based segmentation separately, with each voxel represented by 116 t values. The resulting clusters were very similar to those obtained with the entire IPL (Supplementary Fig. S2). Second, we compared the functional connectivity of the left and right clusters with the 116 AAL regions. Since regions usually showed higher connectivity to a seed region within the same than a different hemisphere, a direct comparison would only highlight these hemispheric differences. We, thus, focused on those brain regions showing significant connectivity with one hemispheric but not the other cluster, each for the seven IPL subdivisions. The results were summarized in Supplementary Table S5. Later, we described only brain regions showing an opposite pattern of connectivity between the left- and right-hemispheric clusters (Table 4).
Differences in Functional Connectivity Between Left- and Right-Hemispheric Inferior Parietal Lobule Clusters
Voxel-wise connectivities were averaged for each of the 116 AAL masks. Significant connectivities at a threshold of p<0.05, corrected for family-wise error or FWE of multiple comparisons, were marked by “+” (positive) and “−” (negative). Only brain regions showing an opposite pattern of connectivity between the left- and right hemispheric clusters are shown here.
L, left; R, right; G, gyrus; AAL, automated anatomical labeling.
The right, compared with left, dorsal-anterior IPL (cluster 3) showed significantly greater positive connectivity with the right middle frontal gyrus, right triangular part of the inferior frontal gyrus, as well as greater negative connectivity with the left Heschl's gyrus; the right dorsal anterior-middle IPL (cluster 4) showed greater positive connectivity with the right superior frontal gyrus, right orbital part of the inferior frontal gyrus, right insula, right middle cingulate gyrus, right putamen, and left cerebellar crus I and II, and greater negative connectivity with the right cerebellar lobule VI; the right medial posterior-middle IPL (cluster 5) showed greater negative connectivity with the left orbital part of the inferior frontal gyrus; and the right ventral anterior-middle IPL (cluster 7) showed greater positive connectivity with the bilateral Heschl's gyrus and negative connectivity with the right cerebellar crus I. Conversely, the left, compared with right, lateral posterior-middle IPL (cluster 1) showed significantly greater positive connectivity with the right cerebellar crus I and negative connectivity with the right precuneus; the left dorsal anterior-middle IPL (cluster 4) showed greater positive connectivity with the left primary motor cortex; the left medial posterior-middle IPL (cluster 5) showed greater positive connectivity with the right cerebellar crus I; and the left posterior IPL (cluster 6) showed greater positive connectivity with the left orbital part of the inferior frontal gyrus.
Discussion
Resting-state functional connectivities were distinct for the anterior, middle, and posterior IPL, with the anterior IPL comprising dorsal and ventral subdivisions and the middle IPL comprising dorsal anterior-middle, ventral anterior-middle, lateral posterior-middle, and medial posterior-middle subdivisions. The subdivisions showed not only statistically significant differences but also sometimes an opposite pattern of regional connectivities. Importantly, these functional divisions do not follow the anatomical boundaries of the lbIPS, SMG, and AG. Further, we examined the hemispheric differences in the functional connectivity of IPL subdivisions. Altogether, these results highlighted functional heterogeneity of the IPL and suggested the utility of connectivity mapping in the delineation of the functional divisions of a brain area. We summarized the pattern of connectivities in Figure 5 and discussed the main findings in the next section.
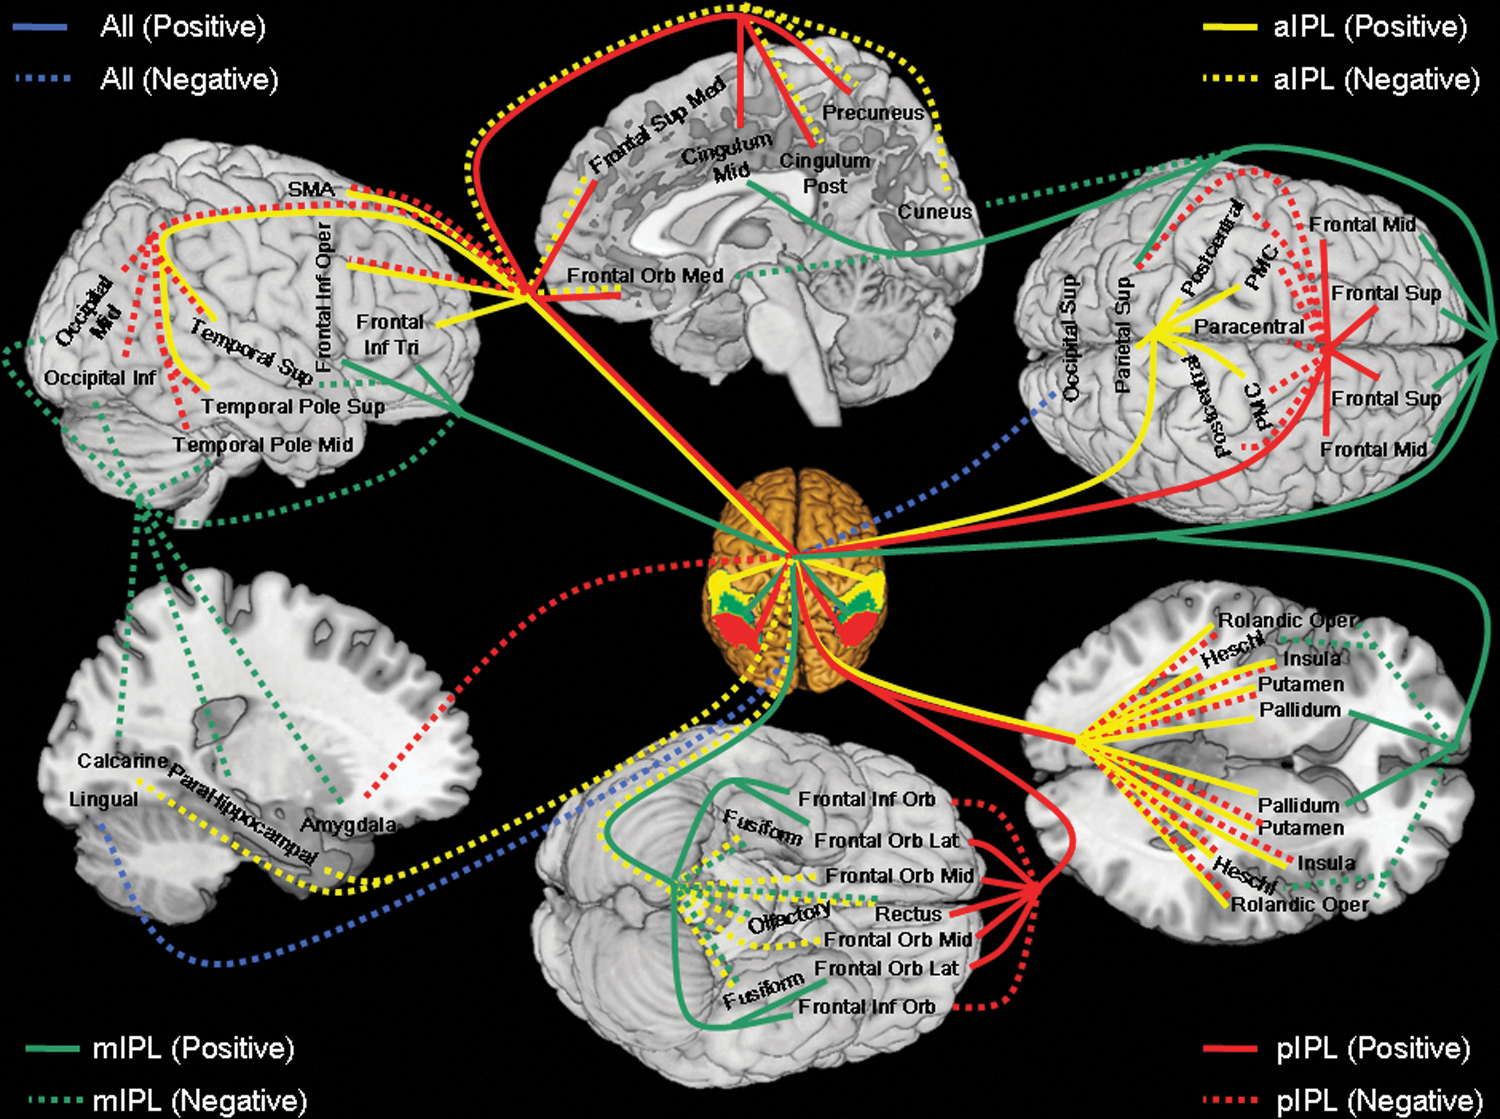
A summary of functional connectivity of the anterior (aIPL, yellow), middle (mIPL, green), and posterior (pIPL, red) inferior parietal lobule, with blue indicating connectivity with all three regions. Positive and negative connectivities are each indicated by solid and dashed lines. PMC, primary motor cortex; Frontal Sup, superior frontal gyrus; Frontal Orb Mid, middle part of orbital frontal gyrus; Frontal Mid, middle frontal gyrus; Frontal Orb Lat, lateral part of orbital frontal gyrus; Frontal Inf Oper, opercular part of inferior frontal gyrus; Frontal Inf Tri, triangular part of inferior frontal gyrus; Frontal Inf Orb, orbital part of inferior frontal gyrus; Rolandic Oper, rolandic operculum; SMA, supplementary motor area; Olfactory, olfactory bulb; Frontal Sup Med, medial superior frontal gyrus; Frontal Orb Med, medial part of orbital frontal gyrus; Rectus, gyrus rectus; Cingulum Mid, middle cingulated gyrus; Cingulum Post, posterior cingulated gyrus; Occipital Sup, superior occipital gyrus; Occipital Mid, middle occipital gyrus; Occipital Inf, inferior occipital gyrus; Fusiform, fusiform gyrus; Postcentral, postcentral gyrus; Parietal Sup, superior parietal lobule; Paracentral, paracentral gyrus; Heschl, Heschl's gyrus; Temporal Sup, superior temporal gyrus; Temporal Pole Sup, superior temporal pole; Temporal Pole Mid, middle temporal pole.
Subdivisions of the IPL
Based on cytoarchitectonic maps, previous studies suggested that the IPL can be divided into subregions beyond the lbIPS, SMG, and AG (Caspers et al., 2006, 2008; Choi et al., 2006). The IPS was subdivided into the human intraparietal area 2 (hIP2), occupying anterior and lateral IPS; the human intraparietal area 3, occupying posterior IPS; and the human intraparietal area 1, located immediately posterior and medial to hIP2 (Choi et al., 2006; Scheperjans et al., 2008a, 2008b). The SMG was divided into three larger and dorsal subregions, PFm, PF, and PFt, and two smaller and ventral subregions, PFcm and PFop (Caspers et al., 2006, 2008). Finally, the AG consists of the anterior and posterior areas PGa and PGp, respectively (Caspers et al., 2006, 2008). More recently, two studies employed DWI tractography to segment right and left IPL (Mars et al., 2011; Wang et al., 2012). The right-hemispheric IPL was divided into five subregions: the most anterior cluster (red, color coded as in Fig. 2 of Mars et al., 2011); two clusters (blue and green) located directly posterior to the red cluster; one cluster (magenta) located posterior to blue and green clusters and occupying the anterior AG; and the most posterior cluster (yellow) that occupies the posterior AG (Mars et al., 2011). The left-hemispheric IPL was divided into six subclusters: a dorsal anterior cluster (blue, color coded as in Fig. 1 of Wang et al., 2012); a ventral anterior cluster (green); and four clusters successively posterior to the green cluster: light green, yellow, orange, and red. The yellow cluster occupies the most posterior part of the SMG, and the orange and red cluster each corresponds to the anterior and posterior AG, respectively (Wang et al., 2012). We compared our clustering results with these previous findings in Table 5.
A Comparison Between the Current Seven Clusters and Subdivisions of the Inferior Parietal Lobule as Identified from Previous Works
Caspers and colleagues (2006); bCaspers and colleagues (2008); cChoi and colleagues (2006); we did not observe a unique cluster that corresponds to PGa. Instead, PGa seems to be related to two clusters, including the lateral posterior-middle IPL (cluster 1, also including the PFm by cytoarchitectonics and close to Mars et al.'s green cluster and Wang et al.'s orange cluster) and medial posterior-middle IPL (cluster 5, also including hIP1 by cytoarchitectonics).
hIP1, human intraparietal area 1; hIP2, human intraparietal area 2.
Thus, analyses of resting-state connectivity suggest distinct functional clusters in the IPL that do not correspond to the anatomical boundaries of lbIPS, SMG, and AG. These functional clusters are also evident from many imaging studies of cognitive tasks. For instance, Otten and Rugg (2001) showed that activations in the lbIPS (x= −54, y=−42, z=48), SMG (x=63, y=−45, z=27), and AG (x=−54, y=−54, z=36) during memory encoding were related to retrieval performance, suggesting that the entire IPL is involved in this mnemonic process. On the other hand, all the coordinates of the peak activations were within the middle IPL cluster as identified here. Similarly, responses to remembered versus forgotten items in two clusters each within the lbIPS (x=49, y=−49, z=48) and SMG (x=60, y=−43, z=30) could be localized to the middle IPL cluster (Daselaar et al., 2004). Studies of semantic processing as in contrasting related versus unrelated word pair identified activations in the lbIPS (x=−36, y=−62, z=50) and AG (x=36, y=−62, z=45), both of which are within the middle IPL (Chou et al., 2006b). Furthermore, an observation of tool use led to activations in the lbIPS (x=−42, y=−42, z=56) and SMG (x=−52, y=−26, z=34), both of which are within the anterior IPL (Peeters et al., 2009). A few other studies have similarly demonstrated functional activations that are best localized to the IPL clusters as identified here with whole-brain connectivity analysis (Clark and Wagner, 2003; Davachi et al., 2001; Mayer et al., 2006; Wagner and Davachi, 2001).
Functional roles of the anterior, middle, and posterior IPL
The anterior IPL (cluster 2 and 3) showed significant connectivity with the primary motor cortex, postcentral and paracentral gyri, and supplementary motor area, consistent with a role in sensorimotor processing (Claeys et al., 2003; Ishibashi et al., 2011; Martinez-Trujillo et al., 2007; Peeters et al., 2009). In contrast, the middle IPL (cluster 1, 4, 5, and 7) showed connectivity with the lateral frontal regions but not with the somatic motor areas. Claeys and colleagues hypothesized a lower-level, luminance-based and a higher-level, attention-based system for motion processing, each involving a region (Claeys et al., 2003) that corresponds to the anterior and middle IPL cluster. Thus, the anterior IPL, directly connected with the somatic motor areas, and the middle IPL, connected with lateral frontal regions, may play a specific role each in luminance-based and attention-based motion processing. These findings were also consistent with diffusion tensor imaging tractography showing a high probability of connection of the ventral premotor cortex with the anterior but not middle or posterior IPL (Rushworth et al., 2006).
The posterior IPL showed positive connectivity with regions of the DMN, including medial prefrontal cortex, posterior cingulate cortex, and precuneus, and negative connectivity with regions of the task-related network such as somatomotor areas (Buckner et al., 2008; Fox et al., 2005; Raichle et al., 2001). Notably, most of the voxels within the posterior IPL are located in the posterior AG, confirming a previous report that the DMN is more closely associated with the posterior than anterior AG (Uddin et al., 2010). In contrast, the anterior AG (within cluster 1 and 5) is functionally closer to the middle IPL. These results support functional parcelation of the anterior and posterior AG (Seghier, 2013).
The IPL is known to be involved in the mathematical cognitive processing (Ansari, 2008; Nieder and Dehaene, 2009). The middle IPL, especially cluster 5, responds consistently to mathematical operations (Cohen et al., 2000; Cohen Kadosh et al., 2007; Delazer et al., 2003; Fulbright et al., 2000; Grabner et al., 2009; Kroger et al., 2008; Naccache and Dehaene, 2001; Piazza et al., 2007; Zhang et al., 2012b). On the other hand, the posterior IPL seems involved in the use of learned mathematics, as when comparing trained and untrained conditions (Delazer et al., 2003; Grabner et al., 2009), in contrast to the middle IPL.
The IPL is also critically involved in attention and memory processing (Ciaramelli et al., 2008; Hutchinson et al., 2009; Uncapher and Wagner, 2009). According to the published coordinates, attention and memory primarily engage the middle and posterior IPL (Astafiev et al., 2003; Beauchamp et al., 2001; Connolly et al., 2002; Corbetta et al., 2000; Corbetta and Shulman, 2002; Henson et al., 1999; Hopfinger et al., 2000; Indovina and Macaluso, 2007; Jack et al., 2007; Johnson and Rugg, 2007; Kincade et al., 2005; Macaluso and Patria, 2007; Pessoa et al., 2002; Shulman et al., 2002; Sylvester et al., 2007; Vossel et al., 2006; Wheeler and Buckner, 2004). In an “attention to memory” hypothesis, Cabeza and colleagues proposed two attentional systems, each involving different parts of the IPL. The center of mass of activity for top-down (median coordinates: x=−36, y=−57, z=42) and bottom-up (median coordinates: x=−50, y=−57, z=38) attention each corresponds to the middle and posterior IPL (Cabeza et al., 2008; Ciaramelli et al., 2008). Further, a work of Corbetta and Schulman (2002) (Ciaramelli et al., 2008; Corbetta and Shulman, 2002) defined the top-down or dorsal attention network, which includes the superior parietal lobule, frontal eye field, as well as the fusiform and middle temporal gyrus; and the bottom-up or ventral attention network, which includes the temporoparietal junction, inferior and middle frontal gyri, as well as ventrolateral prefrontal gyrus. Our study showed that both middle and posterior IPL connected with the inferior and middle frontal gyri and ventrolateral prefrontal gyrus. However, the superior parietal lobule, key to top-down attention, showed positive connectivity to the middle IPL but negative connectivity to the posterior IPL. Only the middle IPL connected with the fusiform gyrus. Our findings, thus, suggested that the middle and posterior IPL each belongs to the top-down and bottom-up attentional systems. However, there is likely a complex interplay between these IPL subregions in attentional processing.
In contrast, the anterior IPL responds to target compared with baseline conditions in “oddball” visual attention tasks (Bledowski et al., 2004; Braver et al., 2001; Kiehl et al., 2001; Linden et al., 1999; Menon et al., 1997). The anterior IPL connected with the supplementary motor area, primary motor cortex, postcentral gyrus, superior temporal gyrus, putamen, pallidum, as well as insula, areas that respond to targets in oddball tasks (Bledowski et al., 2004; Braver et al., 2001; Kiehl et al., 2001; Linden et al., 1999; Menon et al., 1997). On the other hand, the middle IPL as well as its connected areas, including the superior, middle, and inferior frontal gyri, and middle cingulate cortex, respond to novel compared with baseline conditions in the oddball paradigms (Bledowski et al., 2004; Braver et al., 2001; Kiehl et al., 2001; Linden et al., 1999; Menon et al., 1997).
Reviewing fMRI studies of memory retrieval and summarizing the coordinates of activation, Vilberg and Rugg noted that the middle and posterior IPL is each more associated with familiarity and recollection-related judgment (Vilberg and Rugg, 2008). Our findings demonstrated that the middle IPL showed connectivity with the superior parietal lobule, parahippocampus, and middle cingulate cortex, known to be involved in familiarity-related judgment (Daselaar et al., 2006; Montaldi et al., 2006; Ragland et al., 2006; Vilberg and Rugg, 2007; Woodruff et al., 2005). In contrast, the posterior IPL showed connectivity with the posterior cingulate cortex, precuneus, and medial prefrontal cortex, known to be involved in recollection-related judgment (Cansino et al., 2002; Daselaar et al., 2006; Eldridge et al., 2000; Fenker et al., 2005; Johnson and Rugg, 2007; Montaldi et al., 2006; Ragland et al., 2006; Vilberg and Rugg, 2007; Woodruff et al., 2005). It should be noted that the latter finding also accords with a role of the DMN in self-related inferential processing.
Taken together, these findings suggested that anterior, middle, and posterior IPL have distinct patterns of resting-state functional connectivity which mirror their roles in attention, memory, and other cognitive processes.
Hemispheric differences in IPL connectivity and functions
The IPL is known for its hemispheric differences in cognitive functions, with the right IPL predominantly involved in spatial attention processing (Cicek et al., 2007; Husain and Nachev, 2007; Singh-Curry and Husain, 2009) and mathematical cognition (Chochon et al., 1999) and the left IPL involved in tool use (Johnson-Frey et al., 2005; Rushworth et al., 2001, 2003) and language and semantic processing (Awad et al., 2007; Brownsett and Wise, 2010; Sharp et al., 2010; Vigneau et al., 2006). In support of these functional differences, right IPL lesion frequently leads to spatial neglect, while left IPL lesion leads to the syndrome of apraxia (De Renzi, 1985; Rushworth et al., 1997; Goldenberg and Karnath, 2006; Husain and Nachev, 2007; Pazzaglia et al., 2008).
In the current study, the left but not right dorsal anterior-middle IPL (cluster 4) showed significant connectivity with the left primary motor cortex, which was consistent with the hemispheric differences of the IPL in the competency of tool use and motor attention (Devlin et al., 2002; Johnson-Frey et al., 2005; Rushworth et al., 2001, 2003). For instance, Rushworth and colleagues (2001, 2003) observed the left but not right IPL (within our cluster 4) activation during motor attention. In a meta-analysis of seven published positron emission tomography studies, Devlin and colleagues (2002) reported activation of the left IPL (within cluster 2) during tool use under a variety of experimental conditions. The left but not right posterior IPL (cluster 6) showed significant connectivity with the left orbital part of the inferior frontal gyrus, the Wernicke's area, which was consistent with previous findings of hemispheric differences of the AG in language and semantic processing (Awad et al., 2007; Brownsett and Wise, 2010; Sharp et al., 2010; Vigneau et al., 2006). For instance, the left but not right ventral AG responded meaningfully in contrast to meaningless narrative in a speech task (Brownsett and Wise, 2010).
In contrast, the right but not left IPL is implicated in allocating spatial attention (Cicek et al., 2007; Singh-Curry and Husain, 2009). We observed that the right but not left dorsal anterior-middle IPL (cluster 4) showed connectivity with the right superior frontal gyrus, right orbital part of the inferior frontal gyrus, right insula, and right middle cingulate gyrus; the right but not left dorsal-anterior IPL (cluster 3) showed connectivity with the right triangular part of the inferior frontal gyrus and right middle frontal gyrus, areas known to mediate spatial attention (Casey et al., 2000; Corbetta and Shulman, 2002; Egner et al., 2008; Stevens et al., 2005). More broadly, spatial attention involved greater right-hemispheric activation of the superior frontal gyrus, inferior frontal gyrus, and IPL (Stevens et al., 2005). Our findings were also consistent with the hemispheric differences revealed with probabilistic fiber tract analysis (Caspers et al., 2011) that the rostral IPL areas PFt (close to our cluster 3) and PF (close to our cluster 4) showed more consistent connections with the inferior opercular and orbitofrontal areas and insula in the right than the left hemisphere.
Methodological notes
In addition to positive correlations between functionally related brain regions, negative correlations have also been observed between brain regions with theoretically opposed functional roles (Chen et al., 2011; Fox et al., 2005; Fransson, 2005; Greicius et al., 2003; Uddin et al., 2009). Recent studies suggested that the global signal regression, a common step of data preprocessing in seed region-based functional connectivity analyses, is a likely cause of anti-correlated functional networks (Murphy et al., 2009; Weissenbacher et al., 2009). On the other hand, it has also been demonstrated that the multiple characteristics of anti-correlated networks, including cross-subject consistency, spatial distribution, as well as presence with modified whole-brain masks and before global signal regression, are not determined by global regression (Fox et al., 2009). In our previous study of the medial superior frontal cortex that was based on the same data set, we examined this issue by repeating the same analysis only without global signal regression (Zhang et al., 2012a). The results showed a very similar pattern of functional connectivity as in the analyses with global signal regression, suggesting that the negative connectivities are not a result of image preprocessing.
We used correlations between the IPL voxels and 116 AAL masks instead of thousands of voxels of the entire brain for K-means clustering. There were two advantages. First, it reduced computation load by several orders of magnitude. Second, the averaged time series of a brain region is always more stable than the time series of a single voxel. Therefore, we could have more stable correlations using averaged time series. For instance, the voxels at the edge of the brain may have noisy time series, leading to unusual correlations, which, in turn, compromises K-means clustering. On the other hand, we acknowledge that all the 116 AAL regions are not functionally homogenous. We may lose information by averaging them.
Potential clinical implications
Structural and functional abnormalities of the IPL were observed in many neurological conditions, including Alzheimer's disease (Greene and Killiany, 2010; Hanggi et al., 2011; Nelson et al., 2009; Neufang et al., 2011; Xia and He, 2011; Zahn et al., 2005) and mild cognitive impairment (Chong and Sahadevan, 2005; Greene and Killiany, 2010; Hamalainen et al., 2007; Hanggi et al., 2011; Liang et al., 2012; Markesbery et al., 2006; Walker and Walker, 2005). For instance, Liang et al. (2012) showed that the AG connectivity with the DMN was significantly reduced in mild cognitive impairment. Another recent study also suggested that the subregions of the IPL were differentially affected in the progression from mild to severe Alzheimer's disease (Greene and Killiany, 2010). Characterizing the functional connectivity of these subregions would further our understanding of the functions of the IPL and shed new lights on how dysfunctions of the IPL may contribute to the clinical manifestations of these neurological processes.
Footnotes
Acknowledgments
This study was supported by NIH grants R01DA023248 (C.-S.R.L.), K02DA026990 (C.-S.R.L.), R21AA018004 (C.-S.R.L.), and P20DA027844 (Potenza). The NIH had no further role in study design; in the collection, analysis, and interpretation of data; in the writing of the report; or in the decision to submit this article for publication. The authors thank investigators of the 1000 Functional Connectomes Project and those who shared the data set for making this study possible.
Author Disclosure Statement
No competing financial interests exist.
References
Supplementary Material
Please find the following supplemental material available below.
For Open Access articles published under a Creative Commons License, all supplemental material carries the same license as the article it is associated with.
For non-Open Access articles published, all supplemental material carries a non-exclusive license, and permission requests for re-use of supplemental material or any part of supplemental material shall be sent directly to the copyright owner as specified in the copyright notice associated with the article.