
Abstract
Diffusion tensor imaging (DTI) and a longitudinal language learning approach were applied to investigate the relationship between the achieved second language (L2) proficiency during L2 learning and the reorganization of structural connectivity between core language areas. Language proficiency tests and DTI scans were obtained from German students before and after they completed an intensive 6-week course of the Dutch language. In the initial learning stage, with increasing L2 proficiency, the hemispheric dominance of the Brodmann area (BA) 6-temporal pathway (mainly along the arcuate fasciculus) shifted from the left to the right hemisphere. With further increased proficiency, however, lateralization dominance was again found in the left BA6-temporal pathway. This result is consistent with reports in the literature that imply a stronger involvement of the right hemisphere in L2 processing especially for less proficient L2 speakers. This is the first time that an L2 proficiency-dependent laterality shift in the structural connectivity of language pathways during L2 acquisition has been observed to shift from left to right and back to left hemisphere dominance with increasing L2 proficiency. The authors additionally find that changes in fractional anisotropy values after the course are related to the time elapsed between the two scans. The results suggest that structural connectivity in (at least part of) the perisylvian language network may be subject to fast dynamic changes following language learning.
Introduction
Second language (L2) learning is of increasing importance in the globalized world, but as of yet little is known about the neural underpinnings of L2 acquisition. The neural substrate of language learning has been studied by investigating functional plastic changes in the brain; recent studies have shown that learning languages can also lead to structural changes (for a review, see Richardson and Price, 2009), for instance, in the left inferior frontal gyrus (IFG), parietal lobe, and posterior temporal lobe (Mechelli et al., 2004; Osterhout et al., 2008; Stein et al., 2012). In the current article, the authors focus on structural changes in language areas of the brain as a consequence of language learning.
Which areas in the human brain are important for language processing? From previous literature it is known that language processing is not limited to certain brain regions, but employs larger brain networks (Price, 2010). Early anatomically based models of the perisylvian language network consisted of Broca's area, Wernicke's area, and the arcuate tract that connects them (Ojemann, 1991). Recent updates take into account the contribution of parietal and anterior temporal areas (Catani et al., 2005; Hagoort, 2005; Xiang et al., 2010). The area traditionally denoted as Broca's area (Brodmann area [BA] 44, 45) was extended to a larger Broca's complex that also includes part of BA6 and BA47 (Hagoort, 2005, 2013). BA44 and BA45 occupy the left pars opercularis (BA44) and left pars triangularis (BA45) of the IFG. Left BA47 occupies the left pars orbitalis of the inferior frontal cortex. Recent studies have shown that areas in the parietal and posterior temporal lobes are both functionally and anatomically connected to the subregions of Broca's complex (Friederici, 2009; Xiang et al., 2010). The authors therefore address structural changes in the larger perisylvian language network, also including the parietal and posterior temporal regions. Structural changes to the brain can occur either in the gray matter (e.g., gray matter density) or in the white matter tracts that connect different brain regions related to language (structural connectivity changes); they focus on the latter.
Several earlier studies have addressed structural changes to the brain due to L2 learning. Often, a relationship between structural reorganization and L2 proficiency was found, for example, in studies of structural reorganization of gray matter density (Richardson and Price, 2009). For instance, Mechelli et al. (2004) reported that knowing an L2 was associated with increased gray matter density in the left inferior parietal cortex; the degree of structural reorganization was positively correlated with L2 proficiency, but negatively correlated with the age of L2 acquisition. In a study by Stein et al. (2012), the left inferior frontal gray matter density increase after L2 learning was positively correlated with L2 proficiency. Hosoda et al. (2013) were the first to address the relationship between L2 learning and structural connectivity in the brain. Also, for structural connectivity changes, a relationship with L2 proficiency was found; the authors report an L2 proficiency-related increase in the structural connectivity in two pathways in the right hemisphere (between the pars opercularis of the inferior frontal gyrus (IFGop) and the caudate, and between IFGop and temporal areas). They additionally report an increase in gray matter volume of the right IFGop. Summarizing, one could say that, in general, a higher L2 proficiency is accompanied by a larger gray matter density or larger structural increases in either the gray matter or white matter pathways in various parts of the language network of the brain. When studying L2 learning-induced changes in the brain, one should take into account the proficiency level that is reached.
The right-lateralized connectivity increase reported by Hosoda et al. (2013) is interesting with regard to the question of L2 lateralization in the brain. L2 lateralization is, in turn, relevant for the language network that may be undergoing changes during L2 acquisition in this study. It is clear that brain function for language (L1) is left lateralized: functional language lateralization to the left hemisphere is found in 95% of right-handers (the majority of the population) and up to 85% of left-handed people (Lurito and Dzemidzic, 2001; Pujol et al., 1999). For L2, however, there are indications that the amount of left lateralization may be dependent on the proficiency of the L2 speakers and/or the age of acquisition of L2 (Dehaene et al., 1997; Hull and Vaid, 2006; Kelly and Garavan, 2005; Newman-Norlund et al., 2006; Perani and Abutalebi, 2005; Perani et al., 1996, 1998; Wong et al., 2007). For proficient speakers, L2 processing has been found to activate largely the same brain areas as L1 (native language) (Kotz, 2009). However, studies on L2 learning have observed an L2 proficiency-dependent lateralization of brain activation for L2 processing (Dehaene et al., 1997; Perani et al., 1996; Reiterer et al., 2009; Sebastian et al., 2011); less proficient L2 speakers activate a more diffuse network of areas (D'Anselmo et al., 2013), which may include not only the left but also the right hemisphere regions (Kelly and Garavan, 2005; Perani and Abutalebi, 2005), resulting in a less left-lateralized language network. Evidence for less strong left lateralization of language in less proficient L2 speakers has come from studies on story listening (Dehaene et al., 1997; Perani et al., 1998), pitch learning (Wong et al., 2007), and artificial grammar learning (Newman-Norlund et al., 2006). Additionally, the similarity between L1 and L2 may influence the regions involved in L2 processing (D'Anselmo et al., 2013); if L2 is structurally highly similar to L1, this may lead to increased interference between the languages during usage and may require the involvement of additional brain regions outside of the classic language areas, including contralateral areas.
Given the evidence in the literature on functional differences in L2 language lateralization dependent on L2 proficiency, the authors investigated, in the present study, whether an L2 proficiency-dependent brain lateralization exists in the structural connectivity of the perisylvian language network. They deployed diffusion tensor imaging (DTI) to study language pathways and their structural connectivity. The authors hypothesized that structural change as a result of (L2) language learning would not only occur in several isolated brain regions but would also be reflected in the connectivity between important brain areas in the language network. This hypothesis is in line with fast dynamic changes in structural connectivity that have been reported by many studies on working memory and other short-term training, and clinical or animal experiments (for a review, see Johansen-Berg et al., 2010). For example, Scholz et al. (2009) detected a localized increase in structural connectivity following a 6-week training of juggling. Therefore, the present study aims to investigate whether learning an L2 induces fast changes in the structural connectivity between Broca's complex and parietal and posterior temporal regions. They hypothesize that the lateralization of the structural language network will depend on the L2 proficiency of the participants, with less proficient L2 learners showing stronger dependence on right hemisphere pathways.
Methods
Participants
Two groups of participants were recruited (sample 1 had 13 participants [3 males] and sample 2 had 24 participants [4 males]). Participants for both samples were healthy, right-handed German students (18–20 years old). All were late bilinguals who learned L2s (e.g., English) in a German secondary school, as verified in a language questionnaire. In line with the German schooling system, students had started learning English around age 10 (yielding 8–9 years of formal English classroom lessons at the age of testing) and French around age 13 (yielding between 3–7 years of French lessons at the age of testing). Participants completed a general screening questionnaire to assess handedness and screen for medical history, presence of metal, and further MRI exclusion criteria such as claustrophobia. None reported a neurological or psychiatric disease and none was taking medication at the time of the study.
The students came to the Netherlands after completing German high school to pursue university education in Dutch. They undertook a 6-week intensive Dutch-learning course (20-h classroom instruction per week) after arrival in the Netherlands. Immediately after the course, they were required to pass the national Dutch test to qualify as college/university candidates. All participants provided written informed consent before the study started, and the study was conducted according to the institutional guidelines of the local ethics committee (CMO protocol region Arnhem-Nijmegen, The Netherlands) and in accordance with the Declaration of Helsinki.
Procedure
At two time points (before and after the course), the authors acquired DTI scans for each participant and used a cloze test to measure proficiency in Dutch. DTI measurements and cloze tests were always performed on the same day. DTI produces images of biological tissues weighted with the local microstructural characteristics of water diffusion, which is capable of tracing structural connections between brain regions in vivo and providing quantitative measures of brain white matter organization (Le Bihan et al., 2001). The cloze test is part of the national Dutch test (
DTI parameters
The scanning of the participants in Sample 1 was done on a Siemens 1.5 T Sonata scanner with the following parameters: echo planar imaging (EPI) sequence, repetition time (TR)=9900 ms, echo time (TE)=88 ms, 60 diffusion directions defined evenly across the sphere with a diffusion weighting of b=700 sec/mm2, 64 slices, matrix=128×128, FOV=320×320 mm2, and isotropic voxels of 2.5 mm3.
The scanning of participants in Sample 2 was performed on a Siemens 3 T Trio scanner with the following parameters: echo EPI sequence, TR=10,500 ms, TE=94 ms, 110 diffusion directions defined evenly across the sphere with a diffusion weighting of b=1000 sec/mm2, 70 slices, matrix=110×110, FOV=220×220 mm2, and isotropic voxels of 2.0 mm3.
Because differences in the DTI protocol and scanner hardware can influence the estimation of structural connectivity (Landman et al., 2007; Zhu et al., 2011), Sample was included as a regressor in all analyses to control for these possible effects. Please note that all the relevant comparisons reported are from within-subject tests (before vs. after the course), and that within one participant, always the same scanning parameters applied. The possibly present between-subject differences induced by the scanner protocol would therefore always be orthogonal to the investigations reported below.
DTI data analysis
DTI datasets were preprocessed by the DTI toolbox developed at the Donders Institute for Brain, Cognition and Behaviour (Zwiers, 2010). In this diffusion toolbox, a robust artifact detection and rejection method based on tensor estimation is implemented (PATCH), by which not only corrupted slices but also corrupted patches in slices are identified and either corrected or removed from the dataset when cardiac or head motion artifacts arise (Zwiers, 2010). Automatic artifact rejection according to the toolbox settings was used. The different steps in the processing pipeline (realignment, coregistration, artifact detection, and rejection) were manually checked for each participant. The probabilistic tractography technique of FSL (Behrens et al., 2003) was employed to trace the possible pathways between the left parietal lobe (seed region) and each of the four subregions of Broca's complex (left BA6, BA44, BA45, and BA47, as the target region), respectively. To investigate the laterality of these pathways, the same tractography was applied to the right homologous regions. The possible pathways between the posterior temporal lobe (seed) and each of the four subregions of Broca's complex (target) were traced in the same way. The authors additionally included one control tract in the Nstr (number of streamlines) analyses that was unrelated to language processing, from the left occipital cortex to the right occipital cortex.
The seed regions in the parietal and posterior temporal lobe were drawn based on the previous study on the topographical functional connectivity pattern of the perisylvian language network, as described in Xiang et al. (2010). Brain regions in the parietal lobe or posterior temporal lobe that showed significant functional connectivity to (all of) Broca's complex in this study (see Tables 1, 2, and 3 in Xiang et al., 2010) were taken as regions of interest (ROIs) in the current analyses. The ROIs were located in the posterior inferior/medial/superior temporal lobe (BA39/BA37/BA21/BA22) and in the superior/inferior parietal lobule (BA7/BA40). Voxels in these ROIs were dilated (i.e., extended) with a radius of 4 mm under the restriction of not exceeding the boundaries of the parietal or posterior temporal lobe. The purpose of the dilation is to better accommodate the endpoints of fiber bundles. Target regions in Broca's complex (left/right pars opercularis [BA44], left/right pars triangularis [BA45], left/right pars orbitalis [BA47], and left/right [BA6]) were defined according to the automated anatomical labeling template (Tzourio-Mazoyer et al., 2002). An exclusion mask of the sagittal midline was also implemented in the tractography to remove pathways that cross into the other hemisphere. The pathways were visualized with the help of MRIcron (
Number of Streamlines and Fractional Anisotropy Values Before and After the Course in a Second Language (i.e. Dutch)
Nstr and FA values,±SEM.
Significant difference (p<0.05) in Nstr value between before and after measurements as assessed with paired t-tests (N=37). Not corrected for multiple comparisons; no effects survive FDR correction for multiple comparisons (Benjamini and Hochberg, 1995).
Significant difference (p<0.05) in FA value between before and after measurements as assessed with paired t-tests (N=37). FDR corrected for multiple comparisons (corrected FDR significance level q *=0.0222, Benjamini and Hochberg [1995]).
For these tracts, in a regression model, Time_between_scans was found to explain the difference in FA value between before and after the course, the best, and at p<0.05 level (N=37). FDR corrected for multiple comparisons (corrected FDR significance level q *=0.0222).
L, left; R, right; Tem, temporal; Par, parietal; Occ, occipital; Nstr, number of streamlines; FA, fractional anisotropy; FDR, False Discovery Rate.
Parameters of the Most Optimal Models for Cloze Score Improvements
p<0.05; *** p<0.0001.
Cloze_bef, cloze score before the course; R44T_dif, changes of Nstr on the right BA44-temporal pathway.
Parameters of the Most Optimal Model for Cloze Score Before the Course
p<0.01.
LI6T_bef, lateralization index of Nstr BA6-temporal pathway measured before the course.
Two DTI measures were adopted to describe the structural connectivity properties of the traced pathways: Nstr and FA (fractional anisotropy). The probabilistic tractography samples repetitively from the distributions of voxelwise principal diffusion directions, each time computing a streamline from the distribution of fiber connections. Nstr counts how many such samples of streamlines succeed from the predefined seed region to the predefined target region (Behrens et al., 2003). Nstr is an estimation of the number of real fibers based on the artificial reconstruction of these fibers. It should be kept in mind that Nstr (represented by a parameter called “waytotal” in FSL) is not a straightforward measure of tract integrity. It has been suggested that normalized values of waytotal should be used to avoid a possible tractability bias caused by subject motion or scanner noise (Bartsch et al., 2009).
FA is a measure reflecting directional organization of water diffusion that is greatly influenced by the magnitude and orientation of white matter tracts. It is thought to reflect fiber density, axonal diameter, and myelination in white matter (Basser and Pierpaoli, 1996). To avoid subjective thresholding, a probability-weighted average FA was calculated for each pathway and subject using the following equation (derived from Hua et al., 2008):
where Pr i is the probability of the ith voxel to be part of the reconstructed tract, empirically decided by the Nstr that pass through the ith voxel divided by the total Nstr.
To assess the structural laterality of each connection, lateralization indices (LI) were calculated for both Nstr and FA using the following equation:
In this way, a more positive value indicates more left lateralized and a more negative value means more right lateralized. The scale runs from −1 (completely right lateralized) to 1 (completely left lateralized).
Correlation and regression analysis for proficiency in Dutch and structural connectivity profiles
Using SPSS 16.0 (SPSS, Inc., Chicago, IL), two-tailed paired t-tests were employed to compare the difference in cloze score before the course and after the course. Correlation and regression analyses were used to investigate the relationship between proficiency in Dutch and connectivity profiles. The first several steps were carried out by a stepwise regression analysis (Kabe, 1963).
First, the authors investigated whether improvements of proficiency in Dutch could be explained by changes in connectivity profiles of certain pathways, or alternatively, related to connectivity profiles of certain pathways before the course. Changes in Dutch proficiency, Nstr, and FA were calculated by subtracting the value before the course from the value after the course. Improvements on cloze score (Cloze_dif) were regressed on changes in Nstr (Nstr_dif), Nstr before the course (Nstr_bef), and the lateralization index of Nstr_dif (LI_Nstr_dif) and Nstr_bef (LI_Nstr_bef) of all traced pathways. Time differences between the scanning date and course starting/ending dates, time between the two scans (Date_after_course−Date_before_course), and Sample (the sample to which the subject belonged) were entered as control regressors. The summation and changes of summation of left and right Nstr (Sum_Nstr_bef and Sum_Nstr_dif) for each pathway were also included as regressors to control for brain size and the bias of tractability caused by subject motion or scanner noise.
It should be noted that the proficiency in Dutch and the connectivity profiles labeled before the course do not necessarily represent the baseline of zero Dutch learning. About half the participants were scanned 1–4 days into the course due to the time pressure on the scanning schedule (most participants arrived in the Netherlands only 1–3 days before the course started). Several participants reported having formal or informal instruction of Dutch before the course. It is difficult to quantify these learning effects on the basis of the reported learning time, because of mixed effects of informal and formal learning. Thus, the cloze score is taken as the only index of proficiency in Dutch.
First, the authors performed a correlation analysis on cloze scores and the results revealed a significant correlation between Cloze_dif and Cloze score before the course (Cloze_bef) (see Results section for more details). It suggested the possibility that any relationship observed between Cloze_dif and connectivity profiles might be indirectly caused by the relationship between Cloze_bef and connectivity profiles. That is why Cloze_bef was added as a specific regressor to investigate this possibility.
Second, they investigated whether individual variances in proficiency in Dutch before the course may be explained by the connectivity profiles of certain pathways before the course. Cloze_bef was regressed on Nstr_bef and LI_Nstr_bef of each traced pathway. The time difference between the scanning date and the course starting date, the data sample number and Sum_Nstr_bef were entered as control regressors.
The same analysis steps were carried out to investigate the relationship between the cloze score and FA.
Further analyses on BA6-temporal pathway
Based on the results of the regression analyses, two-tailed paired t-tests were employed to compare the difference before the course and after the course for connectivity profiles of the BA6-temporal pathway. Bivariate correlation analysis was used to investigate the relationship between cloze scores and connectivity profiles (Nstr & LI_Nstr) of this pathway.
Based on the results of the correlation analysis, a curve estimation regression analysis was employed to investigate whether there is a nonlinear relationship between cloze scores and connectivity profiles. Logarithmic, inverse, quadratic, and cubic equations were tested in this regression analysis. Data acquired both before and after the course were combined to be the input of the regression model. The relationship between cloze scores and LI, and the relationship between cloze scores and the normalized Nstr of left or right BA6-temporal pathway were investigated. Nstr was normalized by using left or right Nstr divided by the summation of left and right Nstr. The purpose of normalization is to reduce the bias of tractability caused by subject motion or scanner noise (as mentioned previously) and to improve the curve estimation.
Results
DTI fiber tractography discovered robust structural connections for all seed-target pairs in 97% of the participants (Fig. 1). While connections between the parietal or posterior temporal lobe and BA6 or BA44 are observed to mainly lie in the dorsal part of the brain, connections between these two lobes and BA47 go through the ventral part. Connections between the same two lobes and BA45 are seen in both the dorsal and ventral parts of the brain. In Table 1, the Nstr and FA values for each pathway are summarized for the measurements before and after the course.
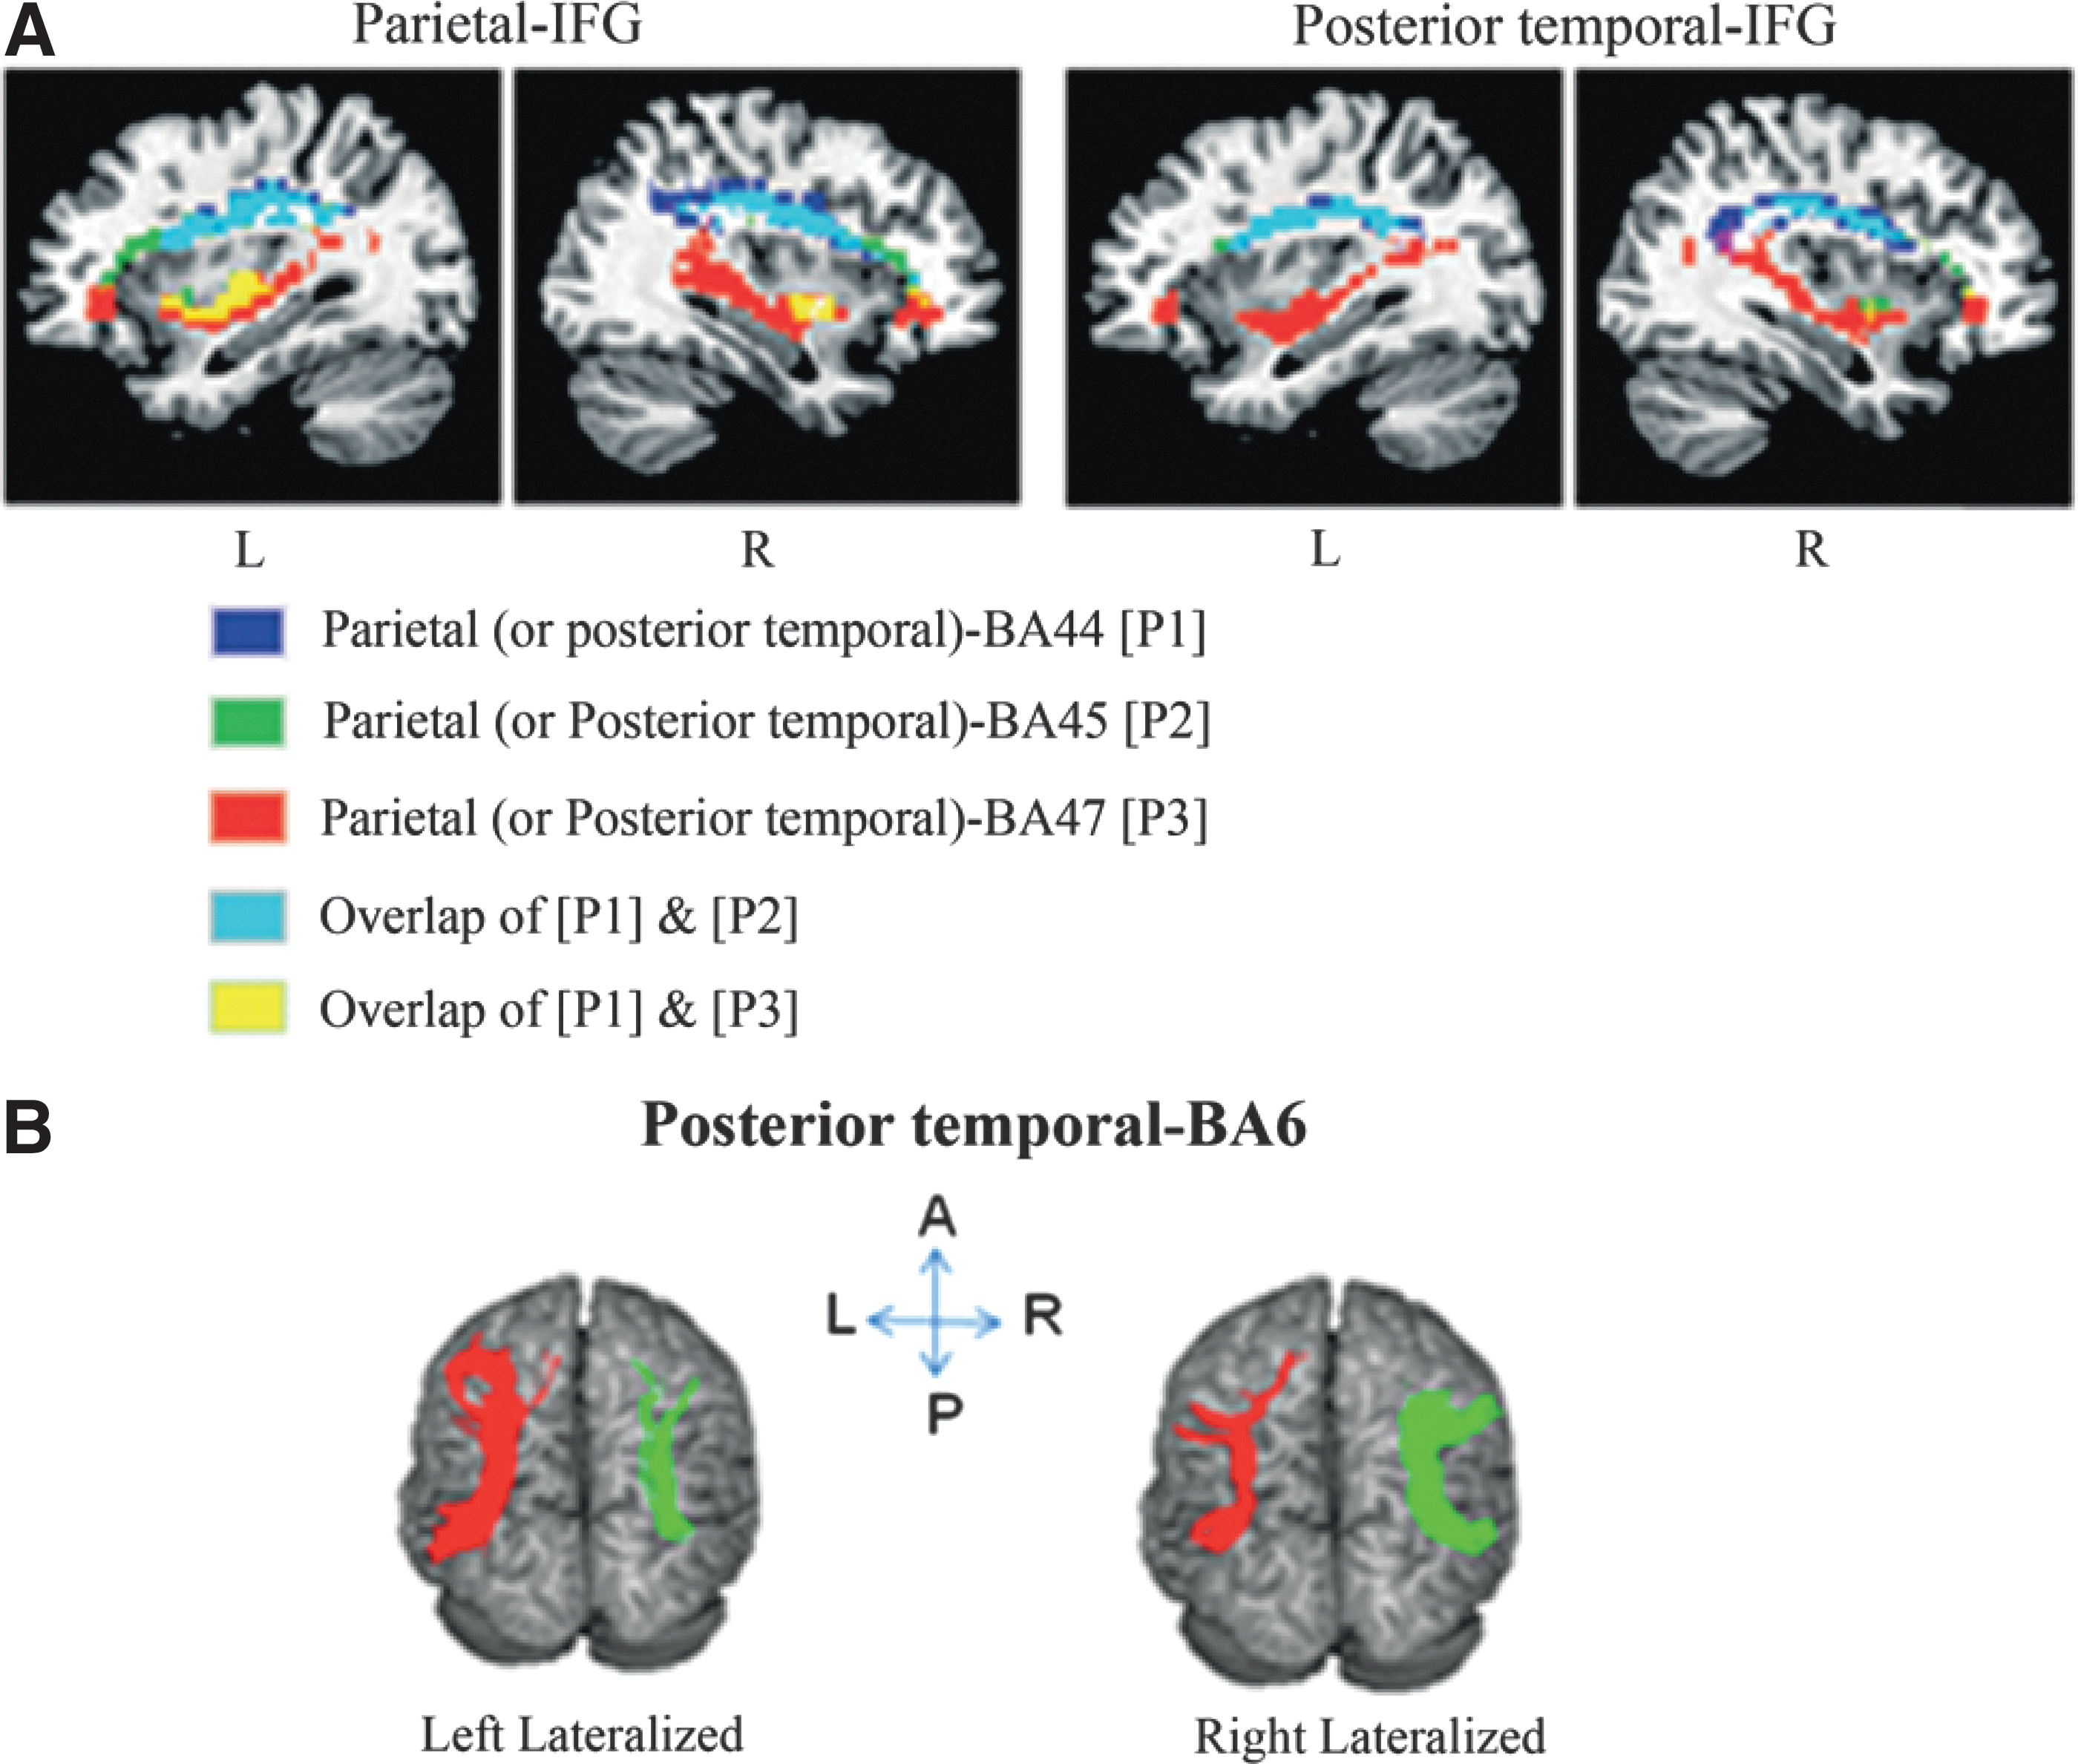
Language network in the brain.
All participants scored higher on the Dutch cloze test after the course (mean=44.5 items, SEM=0.88) compared to before the course (mean=24.9 items, SEM=1.77, t(36)=12.72, p<0.0001, Fig. 2A). There is a negative correlation between Cloze_bef and Cloze_dif (r=−0.89, p<0.0001) and a positive correlation between Cloze_bef and Cloze_aft (r=0.50, p=0.002), see Figure 2B. No effects of Sample (group) were found on the cloze scores obtained (independent sample T-tests on Cloze_before [t(35)=1.20, n.s.] and Cloze_after [t(35)=−0.058, n.s.]).
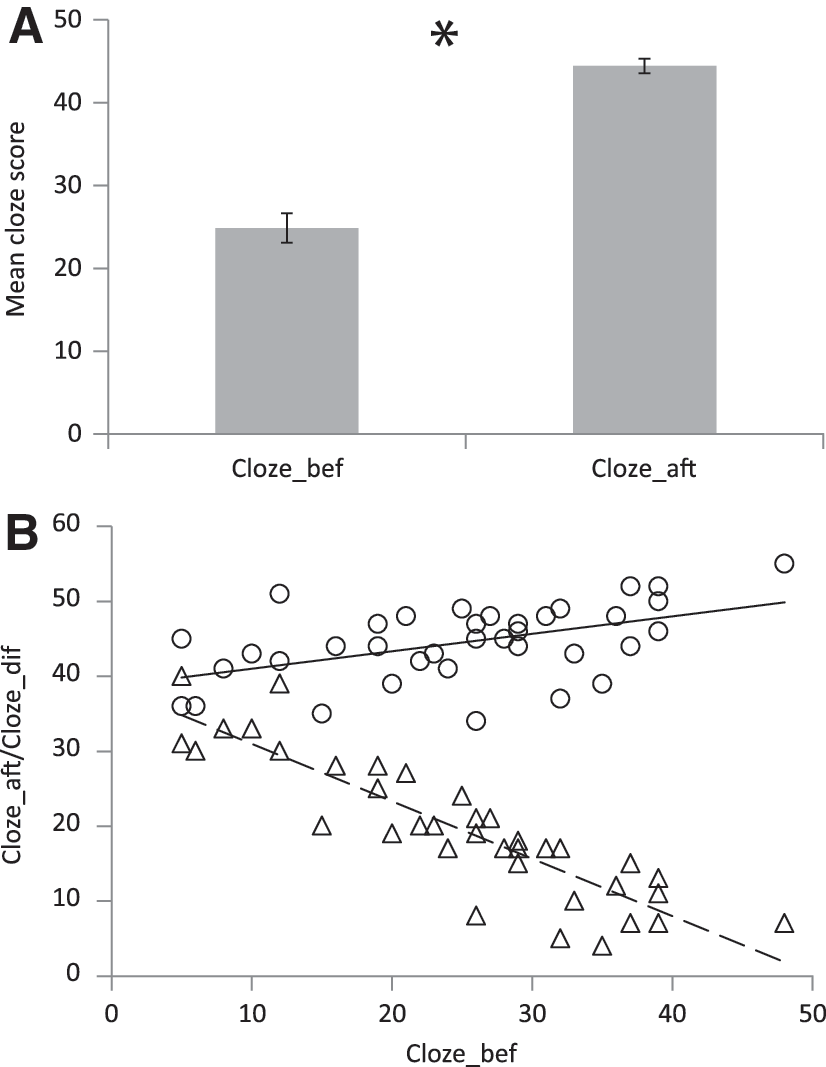
Cloze scores.
The stepwise regression analyses for Cloze_dif found the most optimal model for both Nstr (adjusted R 2=0.80, p<0.0001) and FA (adjusted R 2=0.78, p<0.0001). Table 2 shows the detailed results for regressing Cloze_dif on Nstr or FA of all traced pathways, Cloze_bef and other control variables. Cloze_bef is the largest or only predictor in both models (b=−0.84 for Nstr and b=−0.89 for FA). These results consistently suggest that Cloze_dif is largely influenced by Cloze_bef. The authors therefore looked into the relationship between Cloze_bef and connectivity profiles before the course in more detail.
The stepwise regression analysis for Cloze_bef found the most optimal model for Nstr (adjusted R 2=0.17, p=0.006). However, no model was found for FA. As shown in Table 3, LI6T_bef (Lateralization Index of Nstr BA6-temporal pathway measured before the course) was suggested to be the best predictor for Cloze_bef (b=−0.44). Therefore, this pathway was investigated in further detail.
For the occipital control tract, no differences were found between Nstr_bef and Nstr_aft (t(36)=−1.34, p=0.187). The authors furthermore performed stepwise regression analyses on Cloze_dif, including the Nstr_bef and Nstr_aft of the control tract and Cloze_bef, as predictors; time differences between the scanning date and course starting/ending dates, time between the two scans, and Sample were entered as control regressors. Cloze_bef was found to be the only predictor of Cloze_diff in this model (b=−0.89). When performing further stepwise regression for Cloze_bef, no model was found, indicating that the Nstr of the control tract did not significantly contribute to explain variance of the Cloze scores.
Results for the BA6-temporal pathway
An interesting difference was found between the correlation of Nstr with cloze scores before the course and the correlation of Nstr with cloze scores after the course (Fig. 3A). Before the course, there was a significant negative correlation (r=−0.44, p=0.006) between the cloze scores and the LI of the BA6-temporal pathway (LIT6). A negative LI indicates more right-lateralized pathways; hence, before the course, higher cloze scores were associated with more right-lateralized pathways. Interestingly, after the course (Fig. 3A), this negative correlation turned into a positive trend (r=0.23, p=0.17).
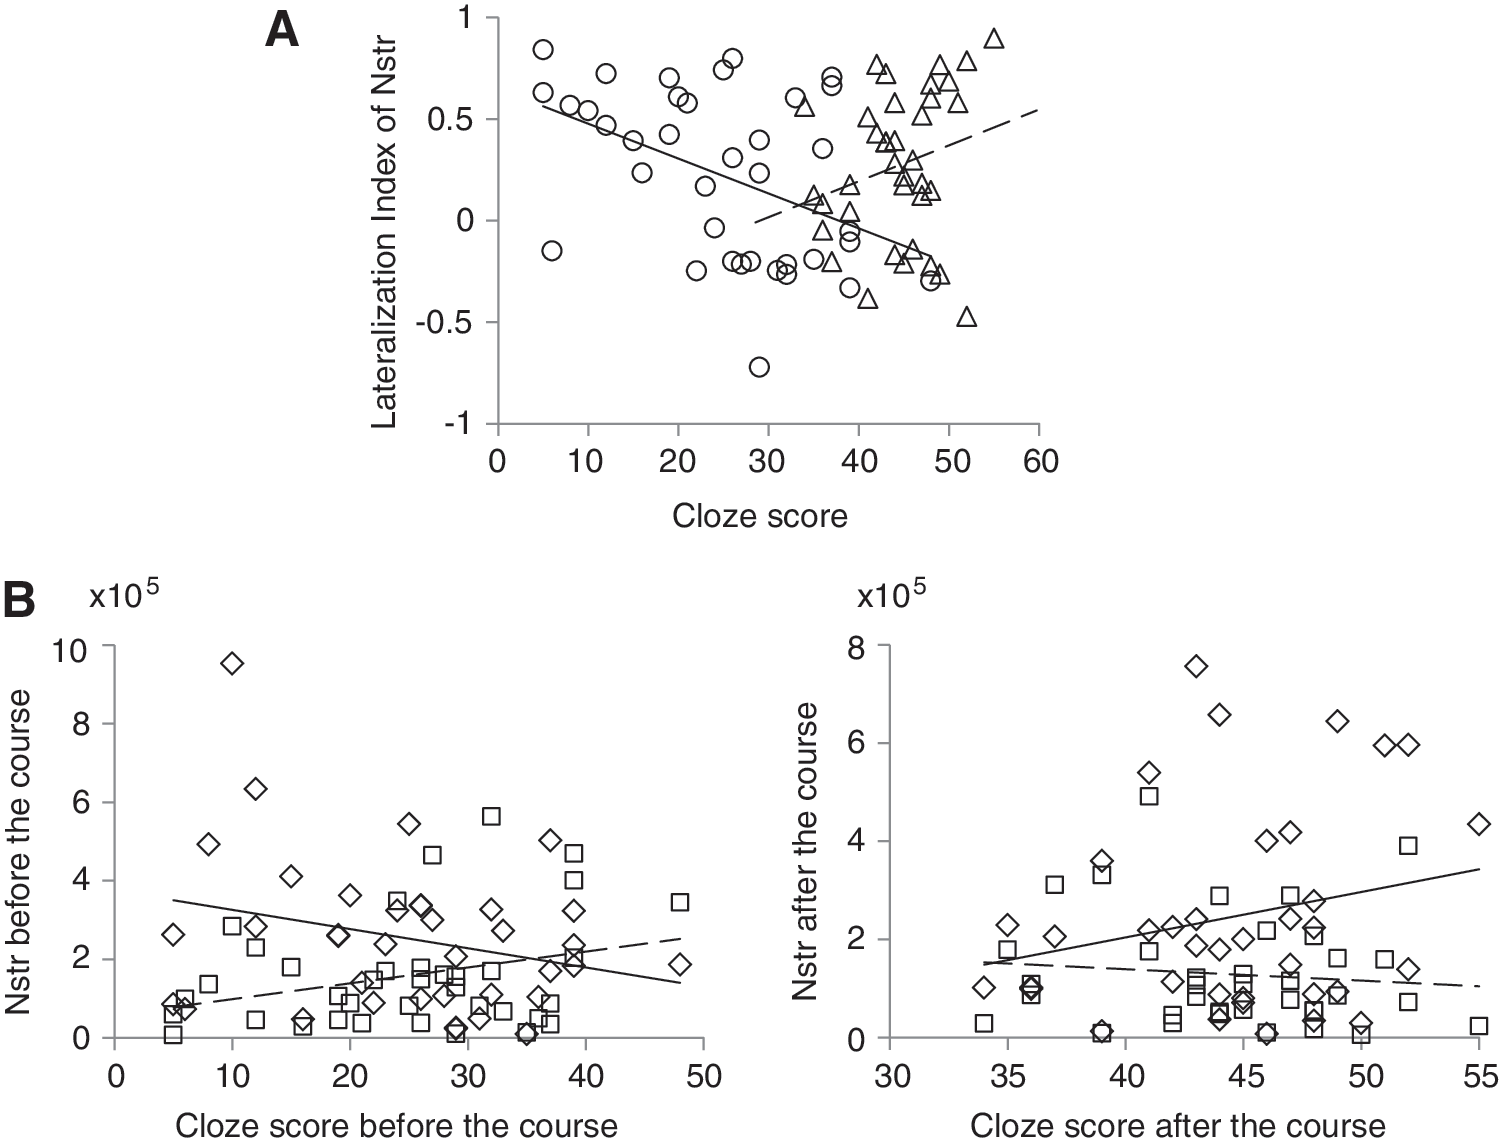
Correlations of cloze scores and structural pathways. This figure illustrates the qualitatively different correlations of cloze scores and structural pathways before the course and after the course.
Since the LI reflects the balance between Nstr of the left and right pathways, the authors assessed Nstr of the left and right BA6-temporal pathways separately. Similar changes were observed as illustrated in Figure 3B: Nstr of the left BA6-temporal pathway (Nstr_L6T) showed a trend of negative correlation with the cloze score before the course (r=−0.27, p=0.11), but a positive trend after the course (r=0.23, p=0.17). The opposite pattern was observed in the right hemisphere; Nstr of the right BA6-temporal pathway (Nstr_R6T) showed a positive correlation trend with the cloze score before the course (r=0.31, p=0.063), but this positive correlation trend was lost after the course (r=−0.10, p=0.55).
The differences in correlation results between Nstr and cloze scores before the course/cloze scores after the course strongly suggested that the relationship between all cloze scores and connectivity profiles cannot be captured by linear dynamics. Therefore, when combining all cloze scores from before and after the course in one model, a curve estimation regression analysis was employed to investigate whether a nonlinear relationship between cloze scores and connectivity profiles existed. Curve fits revealed significant correlations between cloze scores and the LI/Nstr of BA6-temporal pathway as fitted by a quadratic equation (adjusted R 2=0.08, p=0.02, for all three models). Model parameters are shown in Table 4. Please note that even though the analysis revealed a statistically significant quadratic fit to the data, the amount of variance explained by the model (R 2=0.08) is relatively small. The dynamics of the quadratic fit are visualized in Figure 4A, showing a shift in LI6T. With increasing cloze scores, LI6T appears to shift from left to right and then back to left lateralized. Figure 4B reveals the quadratic correlation between normalized Nstr and cloze scores. Normalized Nstr of L6T is higher for low cloze scores and for the upper range of cloze scores, while normalized Nstr of R6T is higher for intermediate cloze scores (compare Fig. 4B with Fig. 3B). Please note that the cloze scores in Figure 4B are derived from only two time points.
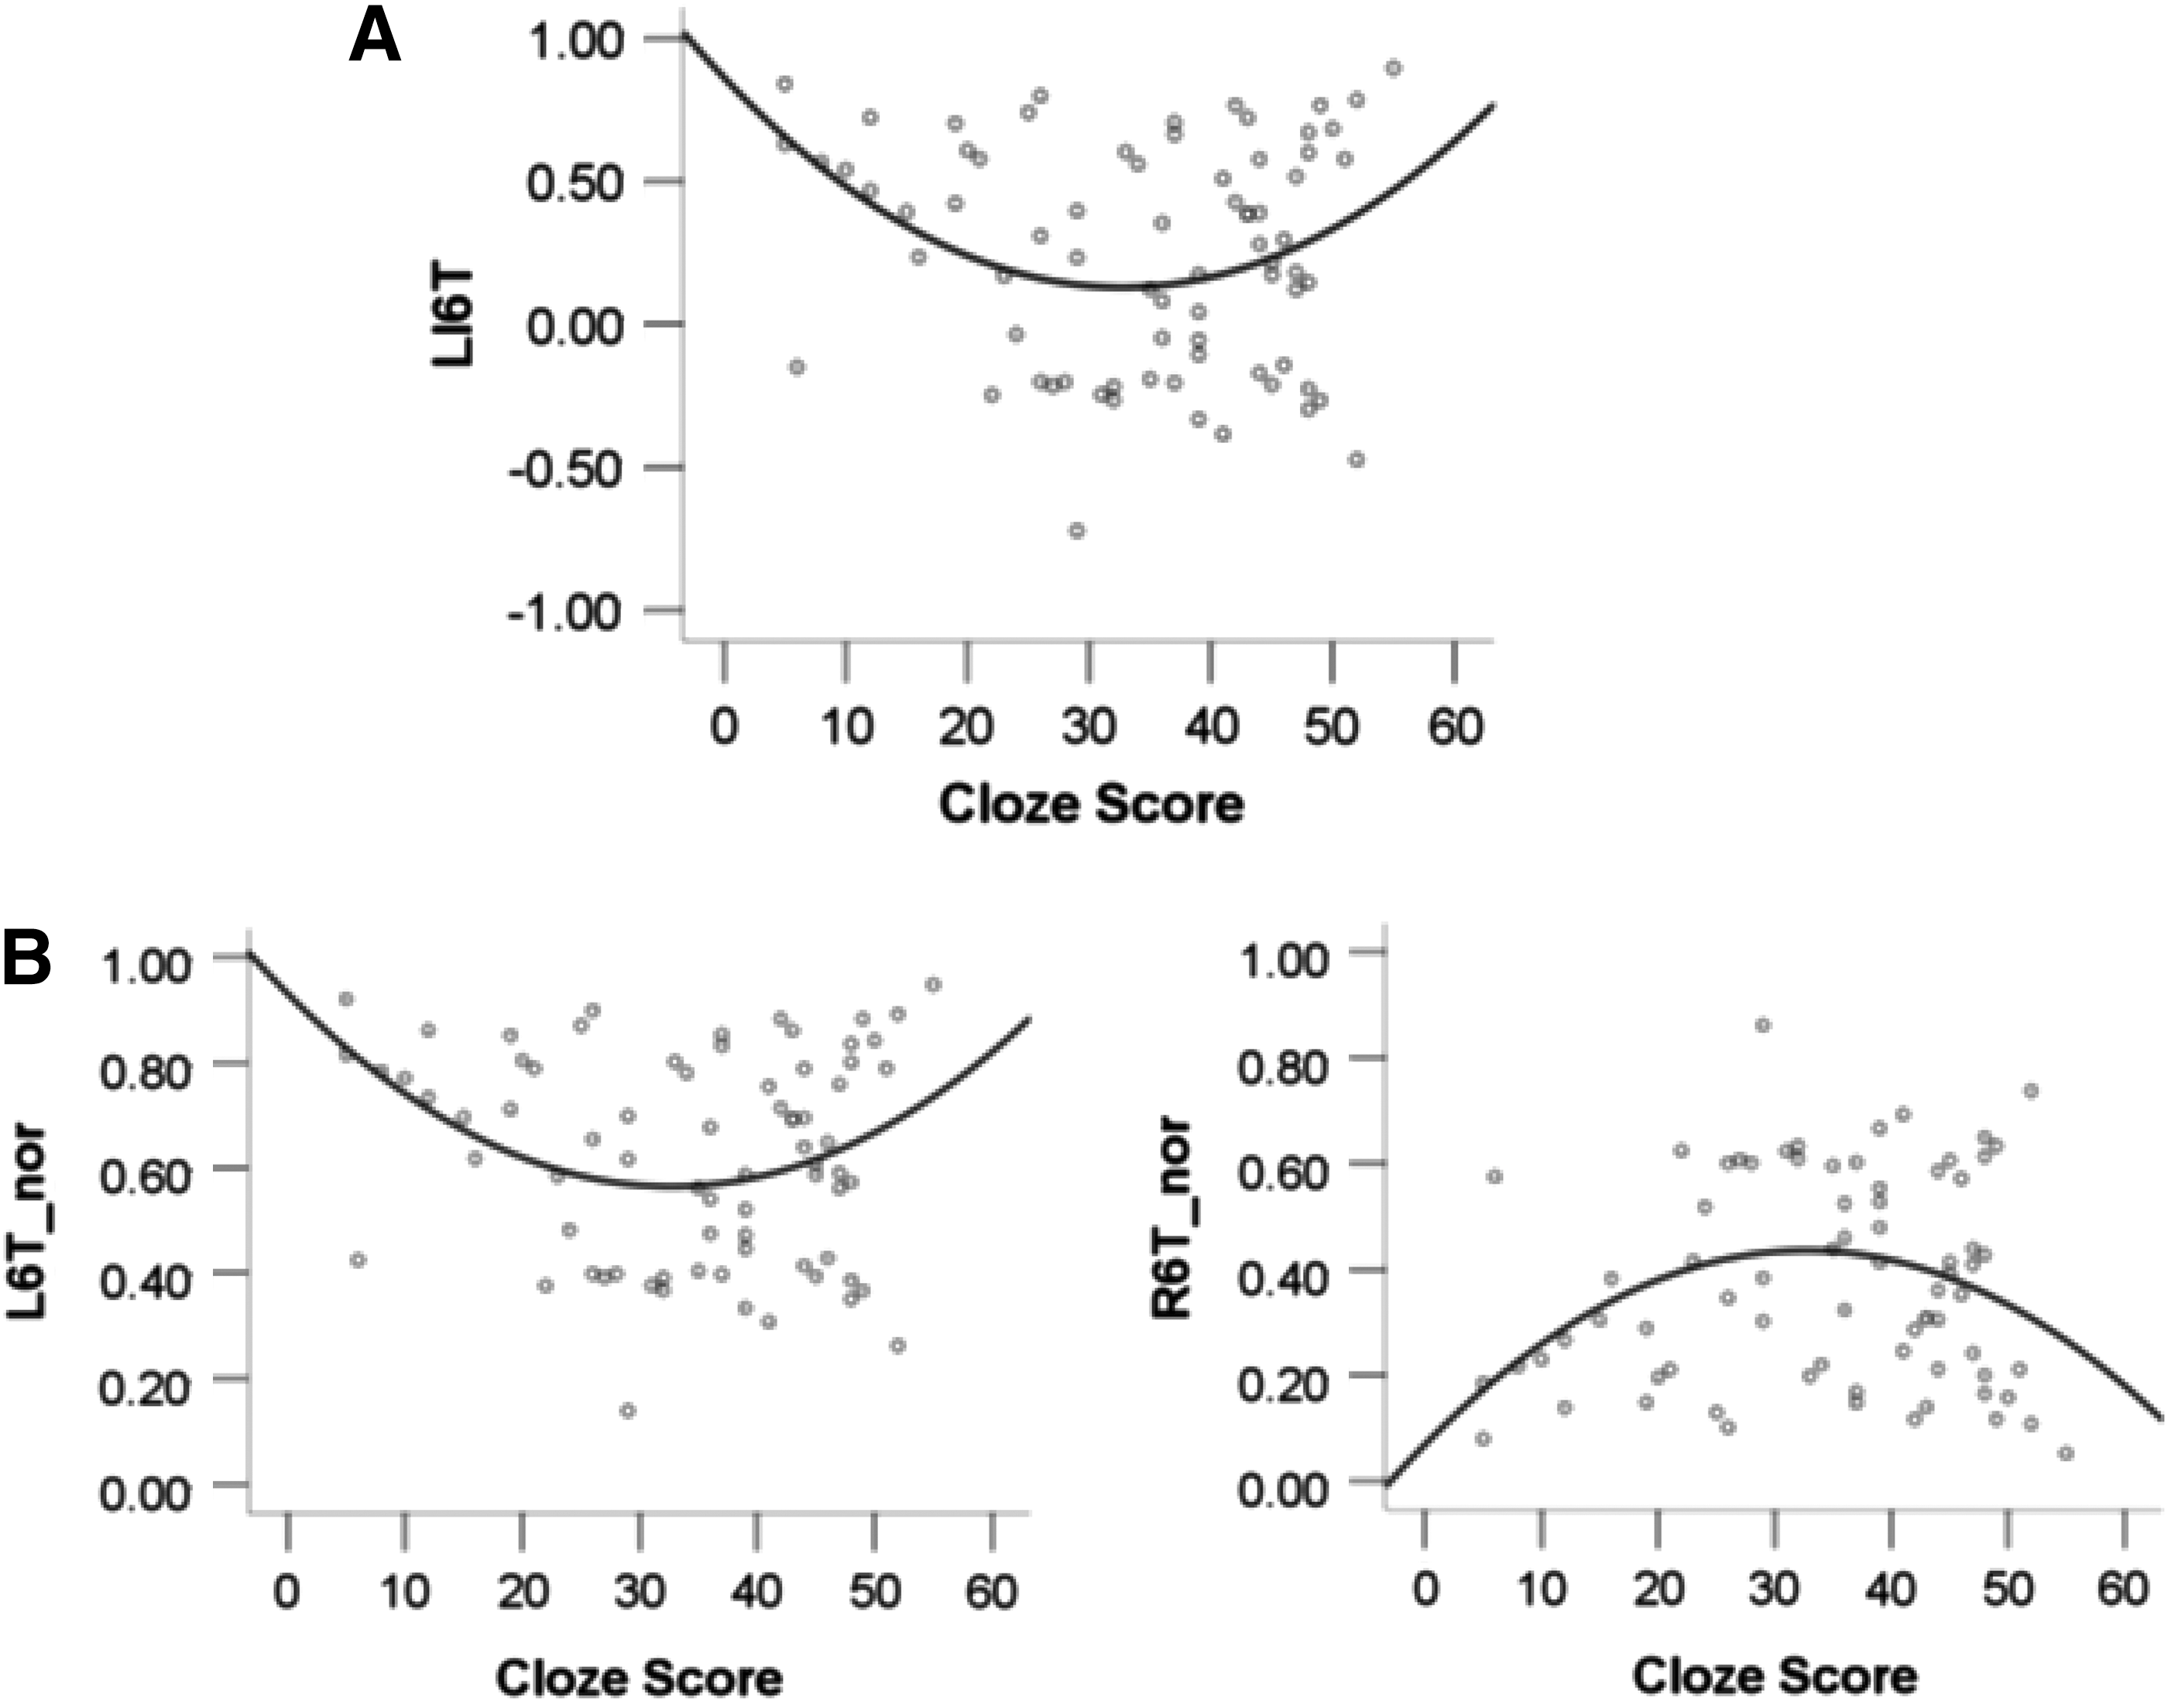
Nonlinear relationship between cloze scores and structural pathways. Correlations between cloze scores and
Parameters of the Quadratic Equation Models on BA6-Temporal Pathway
p<0.001.
LI6T, lateralization index of Nstr BA6-temporal pathway; L6T, Nstr left BA6-temporal pathway; R6T, Nstr right BA6-temporal pathway.
Decreases in FA after the course
In the analyses above, the authors have focused on finding the structural neural correlates of language learning in the brain and have taken L2 proficiency as the measure of language learning success. They have found no correlations between changes in FA values during the course and L2 proficiency. However, when one takes a close look at Table 1, it can be seen that (in contrary to the Nstr values, which show no significant difference between before and after the course after correction for multiple comparisons) FA values after the course are lower than those before the course, especially those in right hemisphere language-related tracts. Paired t-tests indicate significant differences at the p<0.05 level (see Table 1), corrected for multiple comparisons by the False Discovery Rate (FDR) (Benjamini and Hochberg, 1995), a correction method that is suitable for dependent tests (Benjamini and Yekutieli, 2001). Effect sizes (Cohen's d) were in the range of 0.24–0.39 (0.32 on average, moderate effect size). Intrigued by these decreases in FA value, the authors explored which variable, if any, other than L2 proficiency could be related to the FA decreases. A stepwise linear regression model was run for each FA difference value (from 18 tracts in total, see Table 1) with Time_Start (the time difference between the scanning date and the course starting date), Time_End (the time difference between the scanning date and the course ending date), Time_between_scans (Date_after_course minus Date_before_course), and Sample (the sample to which the subject belonged) as variables.
For nine tracts, a model was found, and for all of these nine tracts, Time_between_scans was the best predictor of the FA decreases at a level of p<0.05. Eight of these tracts were situated in the right hemisphere and the strongest regression effect was found for the right BA6-temporal tract (R 2=0.19, B=0.434, t=2.85, p=0.007), which is illustrated in Figure 5. The longer the time between scans, the smaller the decrease in FA value—the regression effect is in the same direction for all tracts. To statistically validate the results and correct for multiple comparisons (one tested all 18 tracts), the authors calculated the correlation (Spearman's rho) of Time_between_scans and the FA difference values also for the tracts for which no regression model was found and determined the FDR using data from all 18 tracts (Benjamini and Hochberg, 1995). They used FDR as the correction for multiple comparisons because this method, in contrast to Bonferroni correction, is also applicable in case the different tests are not completely independent (Benjamini and Yekutieli, 2001). Spearman's correlations were used because several FA difference values were tested borderline significant for non-normality (Shapiro–Wilk test, p<0.05). The FDR corrected significance level was q*=0.022, which was reached by the eight right hemisphere tracts after ranking the p-values, confirming these results. Hence, the fact that the time between the scans was the best predictor in all cases where a model was found, points to a role of time in FA plasticity. Also noteworthy is that in two control regions in the left and right occipital lobe, no FA decrease and no correlation with the time between scans were found (all p>0.42), suggesting the effects are specific to the language tracts tested. There were no effects of Time_between_scans on the lateralization differences in FA before and after the course (all p>0.14). Please note that there were no differences in actual course duration between the participants, that is, the amount of time spent in the language course was equal regardless of the time between scans. Also, Cloze_diff did not correlate significantly with the Time_between_scans (r=0.24, p=0.146).
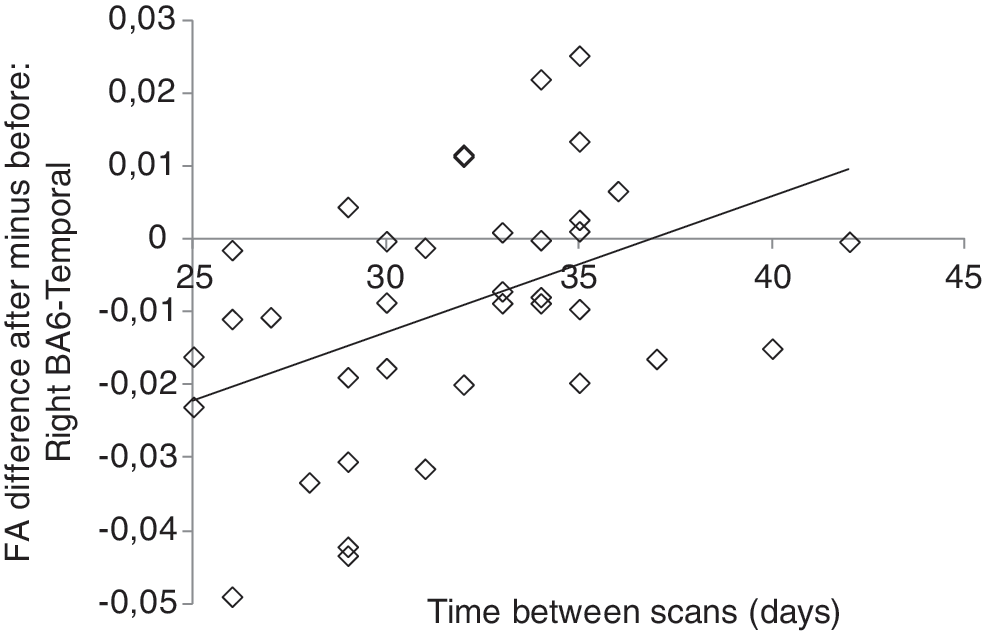
Example of FA decrease. Regression between the FA difference (FA value after minus before the course) in the right BA6-temporal pathway and the time between scans, as measured in days (*p<0.01). It can be seen that the longer the time between scans, the smaller the decrease in FA value. FA, fractional anisotropy.
Discussion
L2 proficiency-dependent laterality shift in structural connectivity
The most interesting result is the discovery of the L2 proficiency-dependent laterality shift in structural connectivity between BA6 and the posterior temporal lobe. With increasing cloze scores, the laterality of the BA6-temporal pathway was found to shift from left to right and, in the end, back to left lateralized. Although the final left lateralization for higher cloze scores did not reach significance, it is clear that after learning, the lateralization of the BA6-temporal pathway has changed to no longer being right lateralized. The underlying normalized Nstr of the left BA6-temporal pathway is higher for low cloze scores and for the upper range of cloze scores, while the Nstr in the right hemisphere is higher for intermediate cloze scores. These results suggest that the laterality of brain activation for L2 processing is L2 proficiency dependent. As reported previously, L2 processing appears to trigger the involvement of more right hemisphere regions when individuals are at a low level of L2 proficiency. These data additionally support the interpretation that L2 processing may return to being left lateralized when individuals have achieved a greater level of L2 proficiency (e.g., Dehaene et al., 1997; Kelly and Garavan, 2005; Perani and Abutalebi, 2005; Perani et al., 1998; Wong et al., 2007). This study shows that this shift in involvement of brain regions is also reflected in the structural connectivity in the language network. Fast structural changes during language learning may induce enhanced structural connectivity in right hemisphere language pathways; when proficiency increases, L2 processing shifts back to being left lateralized.
These results are in line with Hosoda et al. (2013), who showed that during vocabulary learning, the structural connectivity between the right IFG and right temporal areas (pathway, including arcuate fasciculus [AF]) increased with increasing L2 proficiency, similar to these findings. The participants in this study were trained on vocabulary and phonological skills, but not on grammar, and the total training time was ∼45 h in 16 weeks. In this study, students completed 6 weeks of 20 h/week intense classroom training on all aspects of L2 and reached a very high proficiency level after the course. In this sense, these results extend beyond those of Hosoda et al. suggesting that the structural language pathways underlying L2 processing may become more left lateralized again when L2 proficiency reaches very high levels.
It should be noted that the cloze test applied in this study cannot determine whether the participants in the low-, medium-, and high-scoring ranges are using the same strategies when processing L2. Perhaps the changes in structural connectivity reflect that participants in the different scoring ranges achieve their proficiency level in different ways, that is, differences in learning strategies or general language aptitude (Xiang et al., 2012). It is beyond the scope of this article to address this possibility, but it should be kept in mind that the reorganization of structural connectivity may not subserve a constant process. Moreover, the authors report correlations in this study and cannot draw any causal conclusions.
The shift in lateralization from right to left with increasing Cloze scores is partially supported by the results from a quadratic analysis, fitting a quadratic curve to the relationship between Cloze scores and the LI/Nstr of the BA6-temporal pathway. However, the amount of variance explained by this model was relatively low (R 2=0.08). This means that other factors also contribute largely to the variance in the Nstr and LI measures, for example, intrinsic differences in the brain unrelated to language learning, differences in tractography results across the two time points, and variability in assessing the Cloze score. Given that the dynamics between the Cloze scores and LI/Nstr cannot be clearly captured by a simple linear relationship, the authors still believe that the quadratic model gives valuable information regarding the relationship between language learning scores and dynamic changes in the brain.
Decreases in FA values after the course
The authors found no significant relationship between FA values and the level of L2 proficiency. However, the data do show that FA values in the language tracts generally tended to be lower after the course than before (Table 1). Regression analysis showed that the time between the two scans was the best predictor for the amount of FA decrease; the longer the time between two scans, the smaller the decrease in FA value after the course. Although this may appear paradoxical, this pattern is consistent with the quadratic form of the relationship between Nstr and the Cloze score for the BA6-temporal pathway (c.f. Table 4), under the assumption that the first measurement occurs close to the baseline value. The expectation is then that over long periods of time, the FA will return asymptotically to baseline, hence giving the effect that the largest FA difference will be recorded when the interval between the two measurements is small but still sufficiently large that the minimum of the quadratic relationship has been passed. The relationship between time between scans and FA was mostly present in the right hemisphere and not significant in two occipital control tracts.
One explanation for these effects could be general reproducibility issues with regard to measuring FA. It has been reported that test–retest reliability in FA value can vary between 1% and 10% depending on the specific parts of the brain that are measured (e.g., vicinity of gray matter) (Ciccarelli et al., 2003; Farrell et al., 2007). Usually, intersession variation is around 2–3% (Landman et al., 2007). The FA decreases are in the range of 2.1% on average; hence, in the normal intersession variation range and not exceptionally large. If general reproducibility issues were the main cause of the differences observed, it would be unlikely for all FA values to show a decrease after the course—if the effects were random, one would expect to see FA increases as well. Moreover, if the effects were random, it would have been unlikely to find significant decreases or the relationship with the time between scans.
Other researchers have reported increases in FA values in white matter after training (Scholz et al., 2009; Takeuchi et al., 2010; Tang et al., 2010). In these studies, the time spent training was a more important factor in the FA changes than the behavioral performance. For instance, Scholz et al. found no correlation between behavioral performance (in juggling) and FA changes, but there was a positive correlation of FA value with training time. These data also showed a positive relationship of FA with time; the longer the time between the scans, the smaller the FA decrease after the course (Fig. 5). The effect was in the same direction in all areas, also in those left hemisphere areas where the FA decrease and regression effects did not reach significance. This points to a general reorganization effect in white matter related to language processing; more time between the scans could imply more exposure to a Dutch-speaking environment and it entails more time for plasticity to occur. One can only assess the influence of time on FA changes after the course; the authors cannot say anything about the situation before the course.
The FA effects are interesting with regard to these findings for Nstr. The L2 proficiency-dependent laterality shift in structural connectivity was only observed for Nstr but not for FA. Several other studies on the relationship between behavior and the AF also only reported correlations with Nstr but not FA (Catani et al., 2007; Lebel and Beaulieu, 2009). On the other hand, the FA changes show a correlation with time, while there was no significant effect of Time_between_scans on these Nstr results, and the time between scans and L2 proficiency increase was not correlated. Nevertheless, the FA and Nstr results are not necessarily contradictory; FA decreases did not occur to the same rate in the left and right hemisphere tracts, allowing for shifts in lateralization with L2 proficiency as observed for Nstr.
The remaining question is why FA values tend to drop after the start of the course. What could be an explanation for the observed FA decreases? FA decreases with increased performance have been reported previously by Tuch et al. (2005). In this study, reaction times on a visual choice reaction time task correlated positively with FA values, that is, faster performance was related to FA decreases, whereas if performance increase would be accompanied by increases in myelination, an FA increase would have been expected. As a possible explanation for this observed decrease, the authors describe that in anatomic regions containing intravoxel fiber crossing, increased FA of an individual fiber population can result in a decrease in the overall FA. This could also be the case in this study; the AF, for instance, passes through large amounts of crossing fibers. Another possible explanation for finding FA decreases without Nstr decreases could be that dynamic changes in the axonal diameter might be more likely than new axonal connections. This may leave the FA the same, but the volume of the fiber slightly increased (Sagi et al., 2012).
Anatomical connections in the perisylvian language network
The fiber tracking results are generally in agreement with previous findings on language pathways (Catani et al., 2002; Friederici, 2009). The dorsal pathways (BA6/BA44/part of BA45—parietal and temporal pathways) in these results may represent the four components of the superior longitudinal fasciculus (SLF) as reported by Makris et al. (2005). The inferior portion of the SLF is also termed the arcuate fasciculus (AF). The dorsal temporal–frontal pathways found in this study are also proximate to the direct segmentation of AF described by Catani et al. (2007); similarly, the dorsal parietal–frontal pathways found correspond to the anterior segment of the indirect Broca-to-Wernicke pathway running parallel to the main AF.
The ventral posterior temporal–frontal pathways (BA47/part of BA45—temporal pathways) go along the extreme capsule, part of which connects the IFG and the middle-posterior portion of the superior temporal gyrus (Makris and Pandya, 2009). The ventral pathways between the parietal lobe and frontal lobe (i.e., BA47/part of BA45 to parietal pathways in these results) have been described in the dissection of the superior fronto-occipital fasciculus by Catani et al. (2002).
AF and BA6-temporal pathway
Only the dorsal pathway between BA6 and posterior temporal lobe showed an L2 proficiency-dependent laterality shift in structural connectivity and the authors therefore explore the functions of this pathway in more detail. The BA6-temporal pathway is part of the AF, which is implied in the dorsal phonological stream (Duffau, 2008; Frey et al., 2008; Saur et al., 2008; Schmahmann et al., 2007). Clinically, AF is reported to be involved in conduction aphasia (Geldmacher et al., 2007; Geschwind, 1970; Tanabe et al., 1987). Electrical stimulation along the course of the AF generated disorders that affected the phonological form of words (Duffau et al., 2002), and Glasser and Rilling (2008) found that the right AF overlapped with previously reported functional activation locations in phonological processing (bilateral) and prosodic activations (right lateralized). Hagoort (2005) also suggested a role for BA6 in phonological processing in the neurobiological Memory-Unification-Control model of language function.
That the AF is important for phonological processing is relevant for this study since the repetition of phonological cues can aid language learning; dorsal language pathways are implied in the phonological loop of verbal working memory (Baddeley and Papagno, 1988). It is proposed that BA6 is associated with subvocal rehearsal (Baddeley, 2003; Duffau, 2008), keeping verbal materials in working memory and playing a key role in the acquisition of (L2) vocabulary (Baddeley et al., 1998). The shift toward right hemisphere lateralization in less proficient L2 learners in this study could possibly be related to the recruitment of additional right hemisphere areas during phonological processing; phonological and prosodic processing is not strongly left lateralized (Bookheimer, 2002; Grogan et al., 2009; Hesling et al., 2005).
Deterministic and probabilistic tractography of the AF
Relevant to the present findings, there are inconsistencies in the literature on where the AF ends in the frontal lobe. Due to its involvement in conduction aphasia, AF was traditionally regarded as the anatomical pathway between Broca's (BA44, BA45) and Wernicke's area. In the present study, one indeed observed robust AF connections to BA44 and BA45 in most participants, a result supported by findings from Rilling et al. (2008). However, Bernal and Ardila (2009) have argued that the endpoints of AF mainly lie in BA6, as for 83.3% of their 12 participants, the AF projection to Broca's area was absent, while 100% showed projections to BA6. Inconsistencies in detecting AF frontal lobe endpoints may be due to different tracing algorithms. In this study and in the study by Rilling et al. (2008), the newly developed probabilistic tractography algorithm was used, designed to track through crossing fibers by also considering the secondary diffusion direction (Behrens et al., 2007). On the contrary, Bernal and Ardila (2009) used the earlier-developed deterministic tractography (Mori et al., 1999). The limitation of deterministic tractography for detecting crossing fibers was demonstrated in studies investigating the right AF; using deterministic tractography, Catani et al. (2007) found that the right AF was missing in 60% of their participants. Yeatman et al. (2011) directly compared deterministic and probabilistic tractography to trace the left and right AF. While deterministic tractography identified the right AF in 34 of the 55 participants, probabilistic tractography did so in 100% of the participants. The authors concluded that the inability to estimate the right AF with deterministic methods did not imply a missing or extremely lateralized AF, but instead reflected relative partial volume effects of crossing fibers in this region of the brain.
The impression from this discussion is that the BA6-temporal connections are the most robust fiber bundles that can be easily detected with both deterministic and probabilistic tractography. It also means that the tractography results may be less distorted by relative partial volume effects of crossing fibers. This could be an additional reason why it is the only pathway that shows significant shifting effects in lateralization in the present study.
Study limitations and technical concerns
A limitation is that the participants were measured at only two time points during learning. One can therefore not directly investigate the time course of the dynamic changes for any given individual.
When assessing Dutch proficiency in the participants, it became clear that the Cloze scores before the course were negatively correlated with the improvements in Dutch proficiency after the course; participants who scored relatively high before the course, improved less in their Dutch abilities. One might wonder whether this finding could be due to a ceiling effect in the Cloze scores after the course. However, the maximum Cloze score was 60, and the average score reached by participants after the course was 44.5±5.0. Only several students scored above 50 points (Fig. 2B), where Dutch native speakers reach a score of 57.3±2.1 items (Oliver et al., 2012). Of course, the German participants were not expected to reach native level after this one Dutch course. However, given that the test scores indicate there was still room for improvement and given the incremental increase in the difficulty of the test, the authors argue that a ceiling effect in the test scores is unlikely to have taken place. Additionally, they observed that the Cloze scores before the course were more variable than the scores after the course. This finding can partly be explained by the moment of testing at the beginning of the course (within 3 days of starting the course) and fast learning effects, combined with variable prior exposure to Dutch. Please note that the moment of testing was taken into account during all further (regression) analyses that included the Cloze_before data, controlling for any variability caused by the moment of testing. After the course, the participants were more similar in terms of Dutch proficiency. In summary, the authors conclude that the Cloze test data have been able to provide us with an accurate insight of the Dutch skills of the participants before and after the course. Relating the proficiency increase with changes in the brain can reveal mechanisms by which the brain accommodates this proficiency increase.
The present study includes two samples of participants, scanned using different DTI parameters and scanner hardware. They have accounted for any possible differences in results due to sample by including sample as a regressor in all analyses. Checks ensured that the effect of sample was not significant (see the Results section). Moreover, all relevant results that are reported are concerning within-subject changes, over time, in Nstr or FA; between-groups differences are not assessed. Therefore, any relevant comparison done in this study was orthogonal to the possible effect of sample. Furthermore, it has been shown that DTI-based reconstructions of major brain fibers are reproducible regardless of differences in data acquisition (Catani et al., 2002; Mori et al., 2002), although variations may be induced (Landman et al., 2007; Zhu et al., 2011).
In the present study, Nstr is represented by the “waytotal” number of probabilistic tractography in FSL. It is a DTI measure of a recently developed advanced tracking algorithm measuring the Nstr of the traced pathway. In clinical practice, waytotal is considered a good index for white matter properties; it is in better concordance with the clinical rating of motor weakness than FA (Johansen-Berg and Behrens, 2009). However, also waytotal may be subject to individual tractability differences caused by subject motion or scanner noise. One used normalized values of waytotal in the curve fit model to avoid this problem.
Conclusion
The authors demonstrate an L2 proficiency-dependent laterality shift in structural connectivity of language pathways during L2 acquisition, suggesting that structural connectivity in the perisylvian language network may be subject to fast dynamic changes following language learning. Furthermore, it implies that the lateralization of AF may be dependent on an individual's current learning state, with relatively stronger right hemisphere lateralization in less proficient L2 speakers. Future studies with larger samples and improved imaging and analysis techniques are expected to replicate and further investigate fast dynamic structural connectivity changes in the perisylvian language network.
Footnotes
Acknowledgment
This research was supported by the Dutch Organization for Scientific Research (Spinoza Prize to P.H.).
Author Disclosure Statement
No competing financial interests exist.