
Abstract
Although progressive functional brain network disruption has been one of the hallmarks of Alzheimer's Disease, little is known about the origin of this functional impairment that underlies cognitive symptoms. We investigated how the loss of white matter (WM) integrity disrupts the organization of the functional networks at different frequency bands. The analyses were performed in a sample of healthy elders and mild cognitive impairment (MCI) subjects. Spontaneous brain magnetic activity (measured with magnetoencephalography) was characterized with phase synchronization analysis, and graph theory was applied to the functional networks. We identified WM areas (using diffusion weighted magnetic resonance imaging) that showed a statistical dependence between the fractional anisotropy and the graph metrics. These regions are part of an episodic memory network and were also related to cognitive functions. Our data support the hypothesis that disruption of the anatomical networks influences the organization at the functional level resulting in the prodromal dementia syndrome of MCI.
Introduction
Alzheimer's disease (AD) is the pathological cause of the most common dementia in the world, and as many as 50% of people older than age 85 may be afflicted (Corrada et al., 2010; Evans et al., 1989; Fitzpatrick et al., 2004). The diagnostic hallmarks of AD are neurofibrillary tangles and amyloid plaques that are easily identified in postmortem examination (Braak and Braak, 1991), and more recently with in vivo brain imaging techniques (Frisoni et al., 2013). This disease causes significant alterations in brain function, loss of cortical gray matter, and results in premature death (Brookmeyer et al., 2002; Ganguli et al., 2005).
However, in the mild stage of the dementia syndrome, and even in the pre-dementia stage of mild cognitive impairment (MCI), the exact relationships between brain structure, function, and clinical symptoms, are not well understood. For example, there is a significant disruption of the connections between neurons at synaptic level (Selkoe, 2002), which resulted in the “disconnection syndrome” (Bajo et al., 2010; Delbeuck et al., 2003; Geschwind, 1965; Geschwind and Kaplan, 1962; Morrison et al., 1986) model of AD. The defining characteristic is the loss of interregional connectivity (and subsequent clinical symptomatology), but it is still unknown how these changes affect brain function.
Impairment at the neural network level can be evaluated by techniques of recording brain activity in real time [using technologies like magnetoencephalography (MEG) or by studying the brain anatomical network [using diffusion tensor image (DTI)]. MEG has provided critical insights into the disruption of functional brain network architecture (Buldú et al., 2011; Stam et al., 2009) across the spectrum of cognition in aging ranging from a state of normal cognition, through subjective (but not objective) memory symptoms, to MCI to frank dementia (Bajo et al., 2010; Buldú et al., 2011; Stam et al., 2006). Studies of the anatomical networks and connectivity with DTI have shown impairment of the white matter (WM) in MCI (Medina et al., 2006; O'Dwyer et al., 2011). However, little is known about the relationship between these two components of brain network organization (Teipel et al., 2009).
Here, we have attempted to answer a core question related to the underlying disruptions of brain structure and function that characterizes the prodromal dementia syndrome of MCI. That is, what are the relationships among changes in the structural integrity of the connections between brain regions, the dynamic patterns of the brain activity measured with MEG, and the clinical symptoms of MCI? We used the methodologies of graph theory (Bullmore and Sporns, 2009) to analyze the functional connectivity (FC) networks that we obtained through our MEG scans. We then combined these data with those derived from DTI, which allows measurement of the integrity of the connective tracts between brain regions. We were specifically interested in knowing the extent to which physical changes in the brain, manifested as a disruption of the connecting fibers as revealed by DTI, resulted in alterations in the FC networks as measured by MEG, and to changes in cognitive function.
We addressed this question by studying 89 elderly individuals: 52 healthy elderly subjects, and 37 MCI patients whose main feature was a significant loss of memory referred to as amnestic mild cognitive impairment (aMCI) (Petersen, 2011). We studied the relationship between graph theory-derived measures of FC, anatomical interconnectedness measured with DTI data, and neuropsychological test performance. We found significant correlations between the integrity of WM and functional integrity measured in the patients with MCI. Of most importance, we found that those WM tracts that were linked to the measures of FC corresponded to parts of an anatomically defined network that supports episodic memory. Thus, we have identified, for the first time, using multimodal imaging techniques, a direct link between anatomical interconnectedness as measured by magnetic resonance imaging (MRI), and functional interconnectedness as measured by MEG imaging. These results provide important confirmation of the disconnection hypothesis of the structure–function abnormalities in AD, and suggest a possible mechanism that may increase the risk of MCI in normal aging.
Materials and Methods
Sample selection
Eighty-nine individuals participated in this study: 52 elderly healthy controls (HC) and 37 MCI patients (demographical description is included in Table 1). The two groups showed significant differences (p<0.01) in the age, education scores, and MMSE evaluation after a paired t-test. No significant differences were found for the gender distributions after a Chi-square test (p=0.11). None of the participants had histories of major psychiatric disorders or neurological diseases. There was no evidence of stroke or tumor from the structural MRI scans.
Demographic Variables Including Gender, Age, MMSE Scores and Education Scores
Education level is quantified as: 1. Illiterate; 2. Elementary school studies; 3. Secondary school studies; 4. Technical or Mid-level studies; 5. Higher-education or University studies. Data is given as mean (standard deviation).
The p-value was obtained by Pearson Chi-square.
The p-value was obtained by two-sample two-tailed t-test.
MMSE, mini-mental state examination; HC, healthy control; MCI, mild cognitive impairment.
The diagnosis of MCI was based on a neuropsychological examination made at the Hospital Clínico de Madrid and the “UPDC del Ayuntamiento de Madrid.” Healthy people were recruited from the “Seniors Center of the district of Chamartín, Madrid.” MCI patients were classified at stage 3 of the GDS and were diagnosed according to the Grundman et al. (2004) criteria. All of the MCI patients had a Clinical Dementia Rating (Berg, 1988) score of 0.5, and none were taking cholinesterase inhibitors (e.g., donepezil) or other cognitive enhancing medications (e.g., memantine) before MRI and MEG scanning.
The research described in this report was reviewed by the Ethics Committee of the Technical University of Madrid. All of the participants signed a written informed consent before participating in any research activities.
MEG acquisition and analysis
MEG data were acquired with a 306 channel Vectorview system (Elekta-Neuromag) at the Center for Biomedical Technology (Madrid, Spain). The system comprises 102 magnetometers and 204 planar gradiometers, located inside a magnetically shielded room. Sampling frequency was 1 kHz and online filtering 0.1–330 Hz was applied. A head position indicator (HPI) system and a three-dimensional digitizer (FastrakPolhemus) were used to determine the position of the head with respect to the sensor array. Four HPI coils were attached to the subject (one on each mastoid, two on the forehead), and their position with respect to the three fiducials (nasion and left and right preauricular points) was determined. We recorded vertical eye movements, using two electrodes attached above and below the left eye, and a reference electrode on the left earlobe. Subjects were asked to stay calm with their eyes closed for 3 min.
External noise was removed from the MEG data using the temporal extension of signal-space separation (Taulu and Kajola, 2005) in MaxFilter (version 2.2, Elekta-Neuromag) using a 10s raw data buffer and subspace correlation limit of 0.9. The data were subsequently adjusted for head movement every 200 ms and transformed into a common space.
Data were then preprocessed with Fieldtrip (Oostenveld et al., 2011). The continuous time series (resting state) were split into contiguous 4 sec trials. Jump, muscle, and ocular artifacts were automatically detected and trials containing artifacts were removed. Subjects with fewer than 25 clean trials were not considered for further analyses. Notch filters were used to remove the frequency of the power line (50 Hz) and its harmonics, and a bandpass filter of 1–150 Hz was applied. The time series were then filtered into five frequency bands: delta (2–4 Hz), theta (4–8 Hz), alpha (8–12 Hz), beta (12–30 Hz), and gamma (30–60 Hz) with linear finite impulse response filters of order 1000 and 1 sec padding.
We computed the FC between all 5151 unique pairs of the 102 magnetometers in all frequency bands using phase locking value (PLV), a measure of phase synchronization (Mormann et al., 2000). Phase synchronization is not sensitive to the amplitudes of the signals. The instantaneous phase of a signal φj
(t) is first computed using the Hilbert transform, then 1 sec is removed from edges on each side. The instantaneous phase difference is then computed between pairs of signals φj
(t). The PLV was obtained as the mean phase vector, which is based on the circular variance of the phase differences projected onto the unit circle:
where M=4000 is the number of samples in the time series (4 sec sampled at 1000 Hz). PLV indices have values that range from 0.0 to 1.0, where 0.0 indicates uncorrelated phase differences and 1.0 corresponds to perfect phase synchronization.
The computation of PLV between all pair of magnetometers yields a measure of the PLV networks (PLVn), which consists of all 102 nodes connected by their PLV. The networks were fully connected because PLV was never 0. PLVn were averaged across trials leading to one PLVn for each frequency band and subject. The PLVn were processed with graph analysis using two metrics that have already been shown to discriminate AD from healthy elderly people (Stam et al., 2009): network clustering (C) and the characteristic path length (L) normalized over random networks
The clustering of a node Cj
reflects the probability of finding connected triangles in the network with this node. It can be calculated as
Graph metrics such as C and L are absolute measures of the network segregation and integration properties respectively. However, these measures are biased by the strength of the connections and their interpretation is not straightforward. Because we are more interested in the topological properties of these measures, that is, the network organization, we needed to eliminate the contribution of the connection strength. For that we followed the method described by Maslov and Sneppen (2002).
The original networks were “randomized” 100 times, by permuting the weights of the connections. C and L were recomputed for each random matrix and averaged across matrices. Finally, we “normalized” the metrics by dividing the original network parameters by the average of the same parameter from the random networks (Fig. 1). If
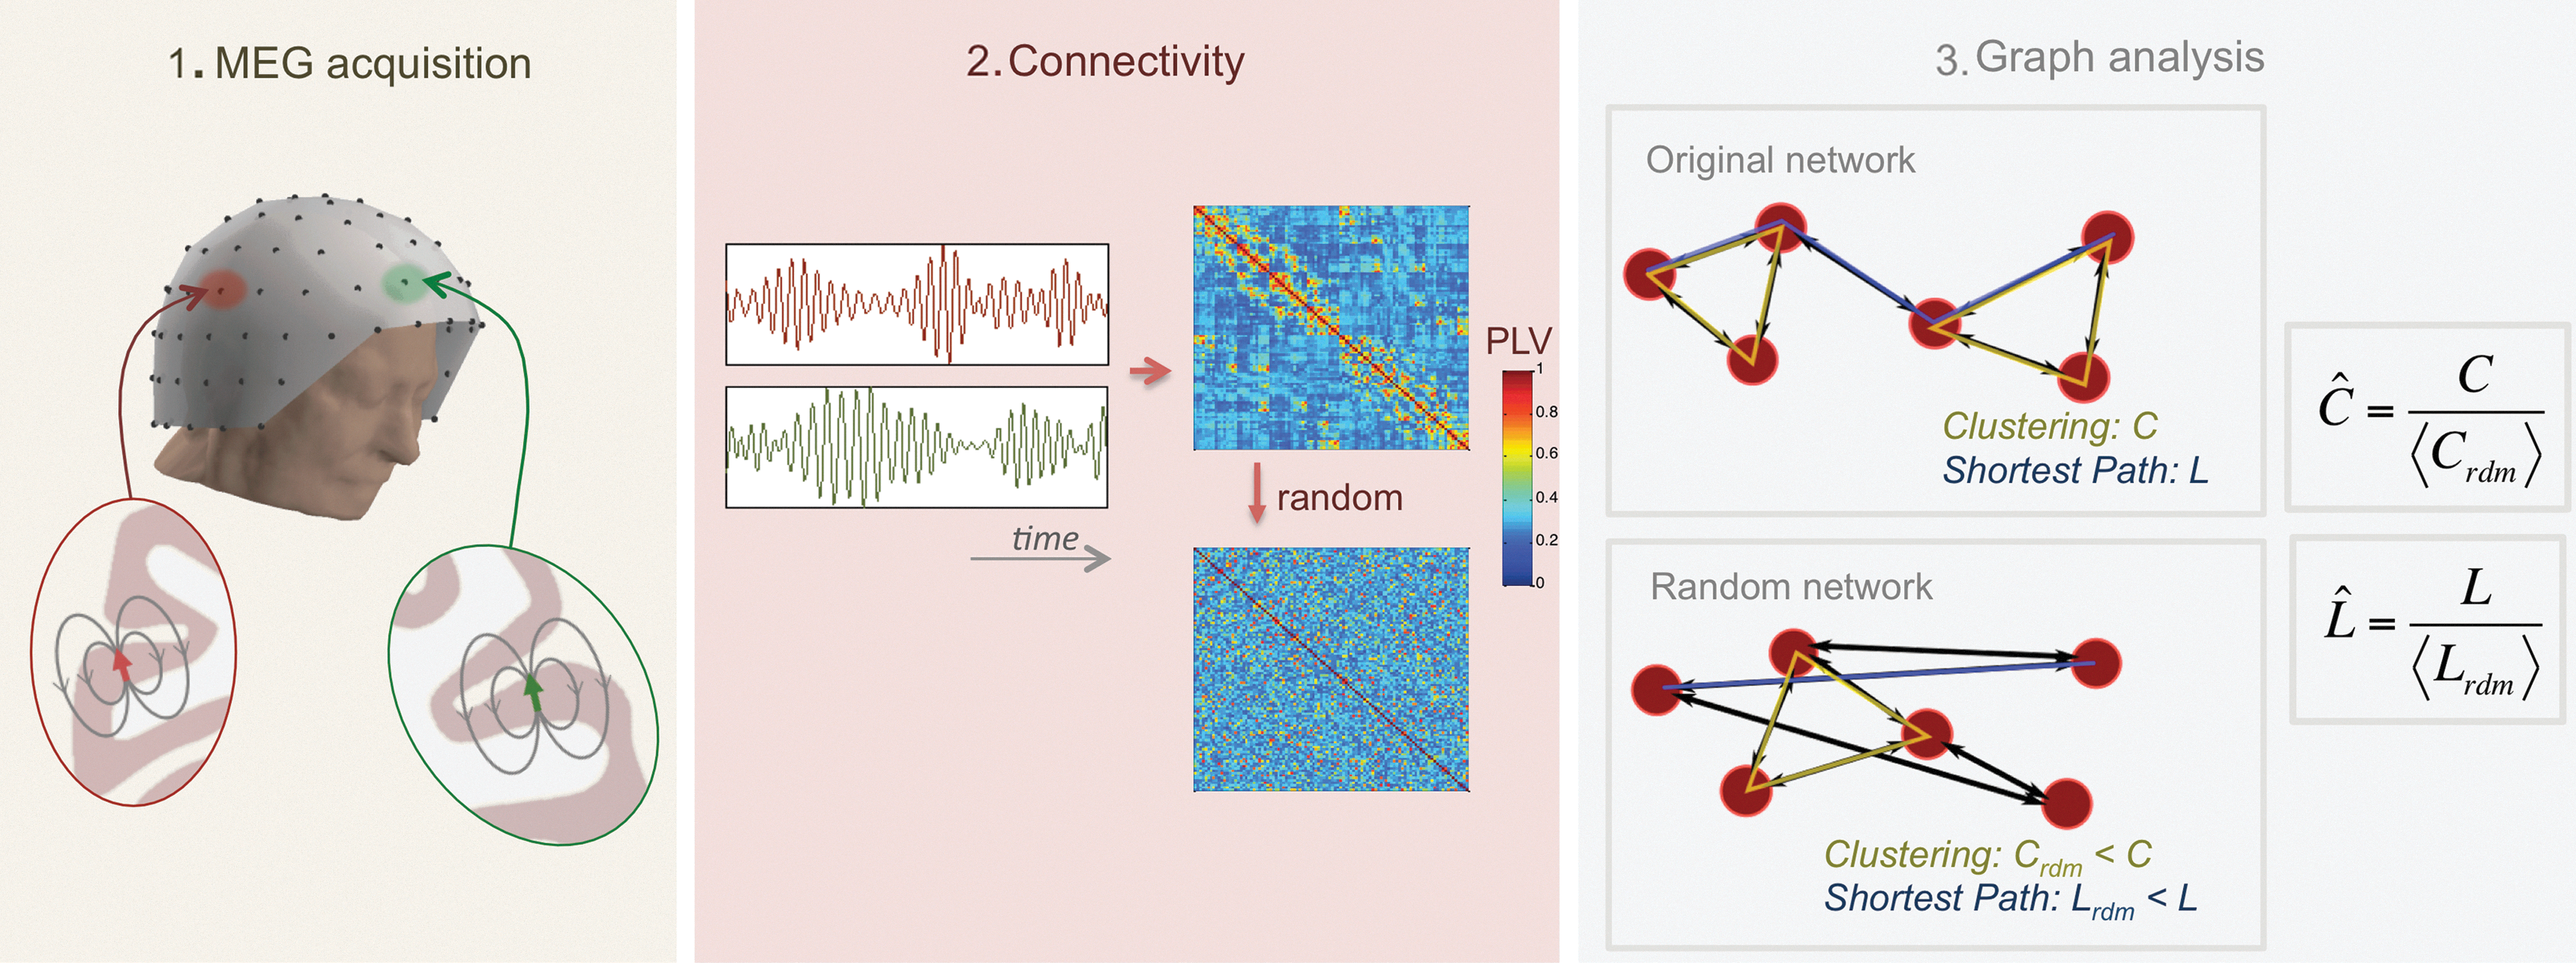
From the neurophysiological signal to the network metric.
MRI acquisition and analysis
All images were collected using a General Electric 1.5T magnetic resonance (MR) scanner, using a high-resolution antenna and a homogenization PURE filter. Three-dimensional T1-weighted anatomical brain MRI scans were acquired with a Fast Spoiled Gradient Echo (FSPGR) sequence with the following parameters: TR/TE/TI=11.2/4.2/450 ms; flip angle 12°; 1 mm slice thickness, a 256×256 matrix, and FOV 25 cm. T2-weighted and FLAIR images were also acquired to identify vascular lesions and WM abnormalities.
Diffusion weighted images (DWI) were acquired with a single shot echo planar imaging sequence with the following parameters: TE/TR 96.1/12,000 ms; NEX 3 for increasing the signal to noise ratio; 2.4 mm slice thickness, 128×128 matrix, and 30.7 cm FOV yielding an isotropic voxel of 2.4 mm; 1 image with no diffusion sensitization (i.e., T2-weighted b 0 images); and 25 DWI (b=900 sec/mm2).
DWI were pre-processed with FMRIB's Diffusion Toolbox (
Voxel-based analyses
VBA of FA images was carried out with SPM8 software (
Multimodal MEG-FA regression analysis
Here, we use a VBA to discover dependencies between graph metrics from FC networks and FA in aMCI subjects. This methodological pipeline was previously employed in a recent research (Fernández et al., 2011), identifying relationships between complexity in MEG signals and FA. Here instead, we introduced into the VBA the graph metrics as covariates to evaluate our initial hypothesis that the integrity of the functional organization of the networks is related to the structural integrity of the WM. We built 10 SPM8 design matrices (5 frequency bands×2 graph metrics) and obtained statistical parametric maps representing the dependency of FA (measured at the voxel-level) with the graph theory parameters. We used an FDR threshold of q<0.01 with an extent threshold of 50 voxels.
Results
Graph absolute measures C and L showed differences between HC and aMCI groups. C was lower for the HC in beta frequency band (p<0.05), while L was higher for the HC in beta frequency band (p<0.01) (Table 2). However, these parameters depend on the strength of the connections: as S increases, C increases and L decreases (Table 2). Thus, normalized graph metrics seems to be a better marker that overcome these differences and just describe the network topography. The results obtained with
Graph Metrics Comparison Between HC and aMCI Groups
Data are given as mean (standard deviation). The p-values were obtained by multifactorial ANOVA, where age and gender were included as factors.
FDR correction for multiple comparisons (q<0.1).
aMCI, amnestic mild cognitive impairment; FDR, false discovery rate.
Normalized Graph Metrics Comparison Between HC and aMCI Groups
Data are given as mean (standard deviation). The p-values were obtained by multifactorial ANOVA, where age and gender were included as factors.
FDR correction for multiple comparisons (q<0.1).
We identified the anatomical basis of the brain network organization by analyzing the integrity of the WM tracts using DTI. We found significant areas of unhealthy WM in the aMCI patients relative to the controls including long fiber bundles connecting to and from the frontal lobes, and more localized damage affecting the integrity of the Papez Circuit, which is critical for memory processing (Fig. 2 and Table 4). There was damage to the anterior thalamic radiations in the left hemisphere, which connects the anterior and medial thalamic nuclei to the frontal lobes (Hua et al., 2008). There were differences in the inferior fronto-occipital fasciculus in both hemispheres, which project caudally from the frontal lobes via the corona radiata to the temporal and occipital lobes (Hua et al., 2008). The interhemispheric connections of the forceps major (occipital lobes) were also abnormal in aMCI patients (Fig. 2). Finally, we found damage in the long inter-regional connections formed by the inferior and superior longitudinal fasciculi, and more localized damage to the cingulum of the hippocampus, which is a critical pathway within the Papez Circuit (Shah et al., 2012).
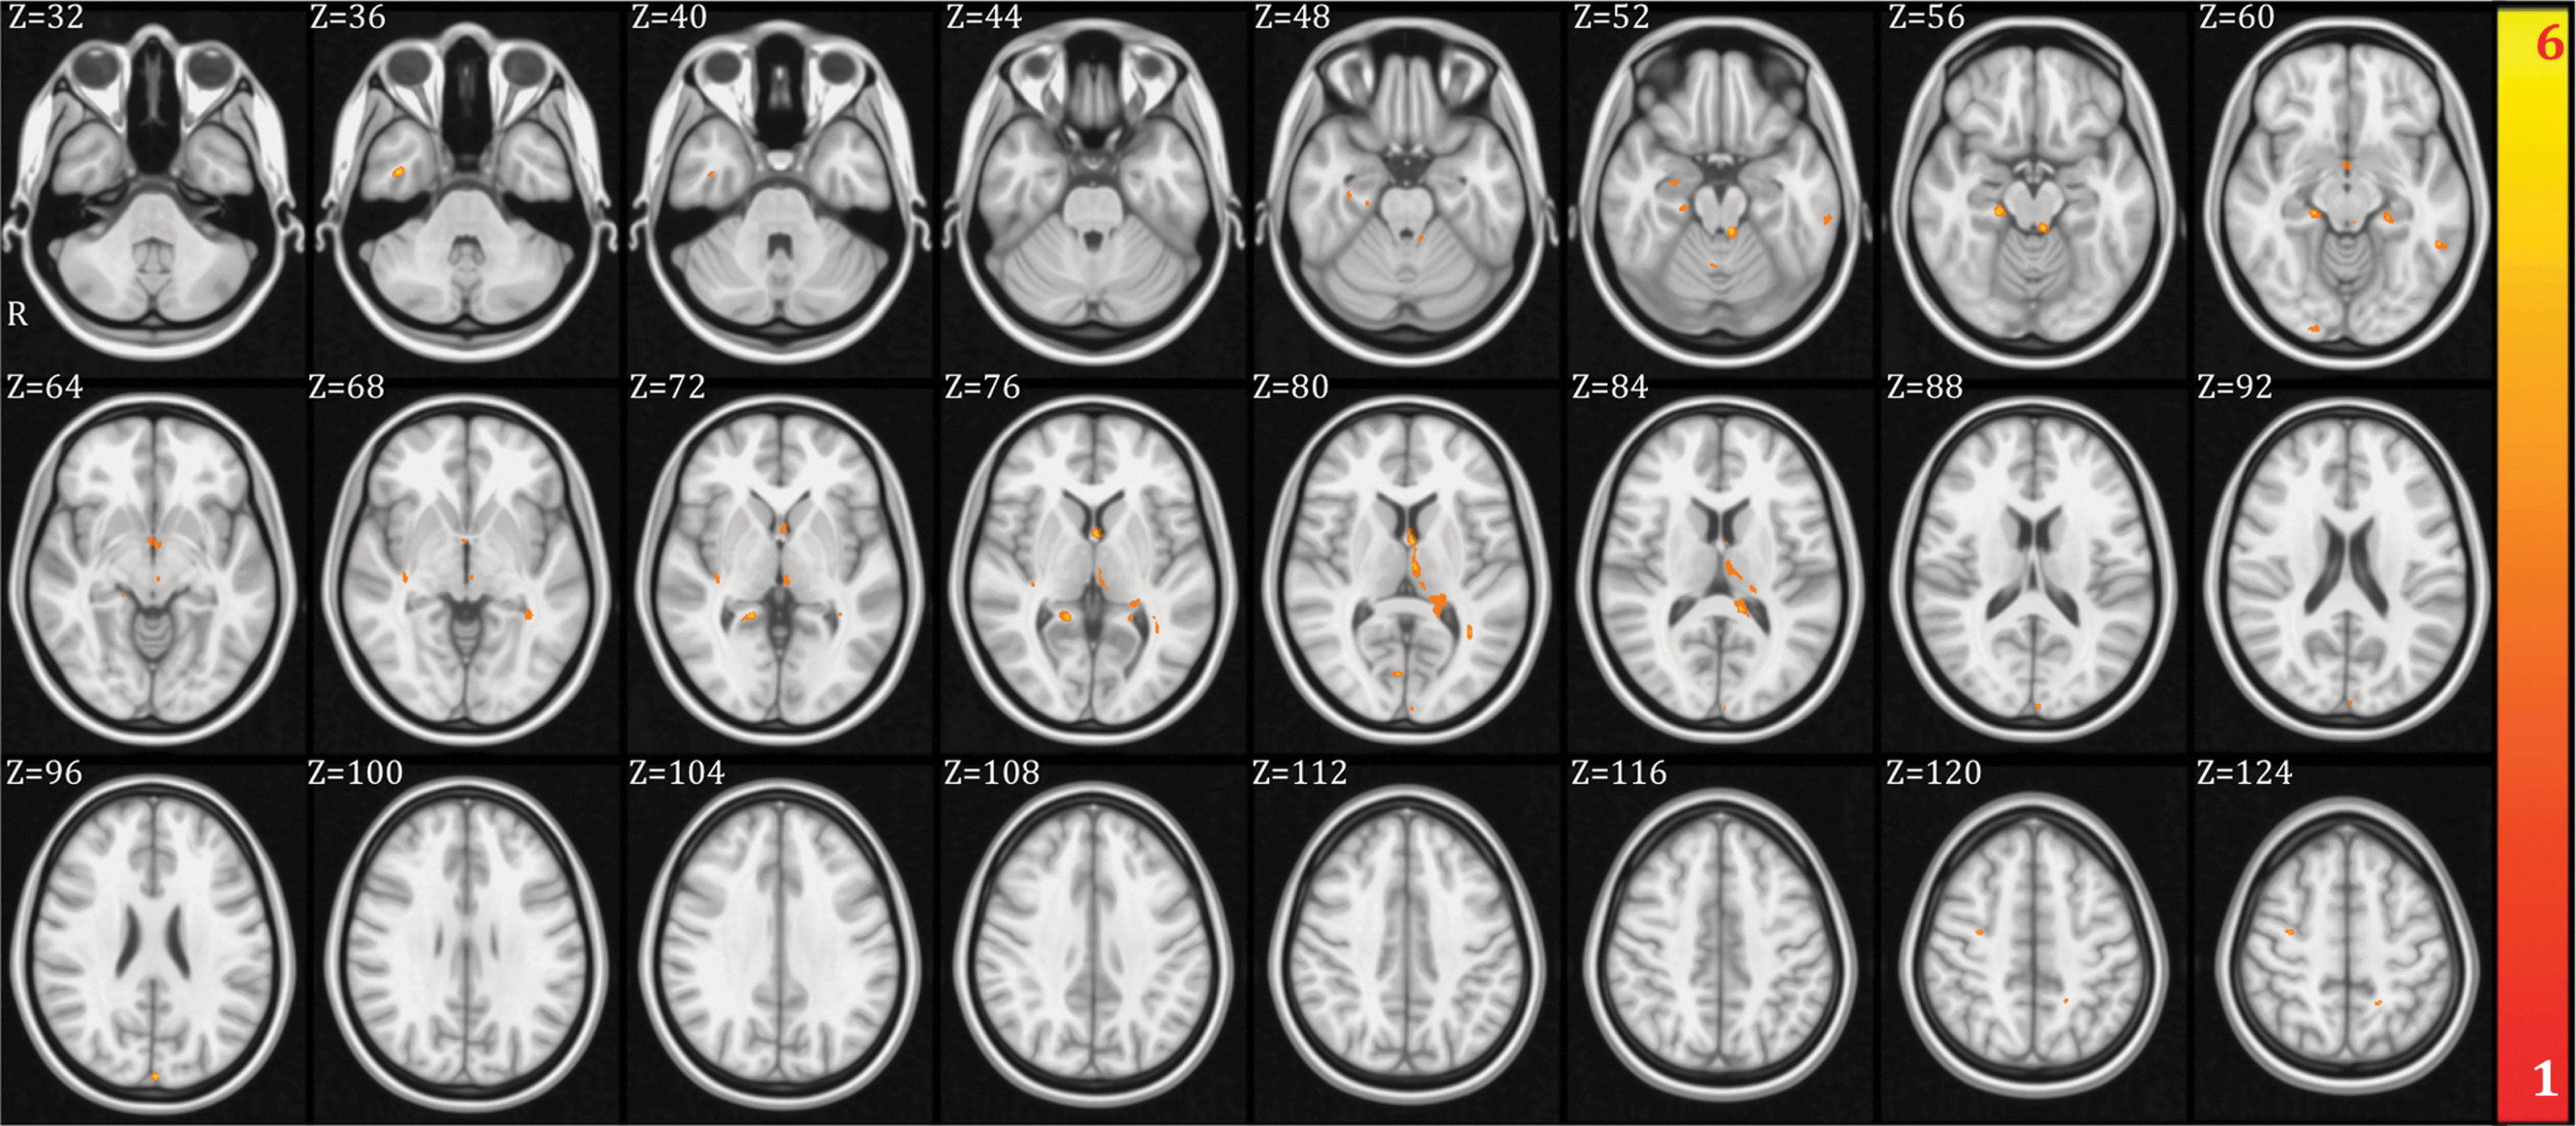
Fractional anisotropy (FA) voxel-based analysis between healthy control (HC) and amnestic mild cognitive impairment (aMCI) groups. Regions that showed higher FA values in HC compared to aMCI (uncorrected p-value p<0.001 and minimum cluster size of 20 voxels) have been highlighted in orange-yellow colors. The colors represent the t-value of the voxels. Color images available online at
MNI Coordinates of the VBA Results Showing Differences in FA Between HC and aMCI Groups (Uncorrected p-Value p<0.001 and Minimum Cluster Size of 20 Voxels)
The tracts were identified with the probabilistic atlas from Johns Hopkins University (Hua et al., 2008). In the table are shown the main tracts where the differences were identified. The table includes the MNI coordinates of the voxel with highest significance, the cluster size and the peak t-value.
MNI, Montreal Neurological Institute; VBA, voxel-based analysis; FA, fractional anisotropy.
We then examined the relationship in both groups (HC and aMCI) between FA (at the voxel level) and all the normalized graph indices in an exploratory analysis, to identify which metrics were dependent on the integrity of the WM. We analyzed the associations between the
We did not find significant associations between graph metrics and FA for the HC group. For aMCI we found significant associations between the normalized measure of clustering (C) and FA in the delta, theta, and alpha bands, but no significant links between normalized characteristic path length and FA (Fig. 3 and Table 5). We observed significant correlations of the FA in the cingulum of the hippocampus in both hemispheres for
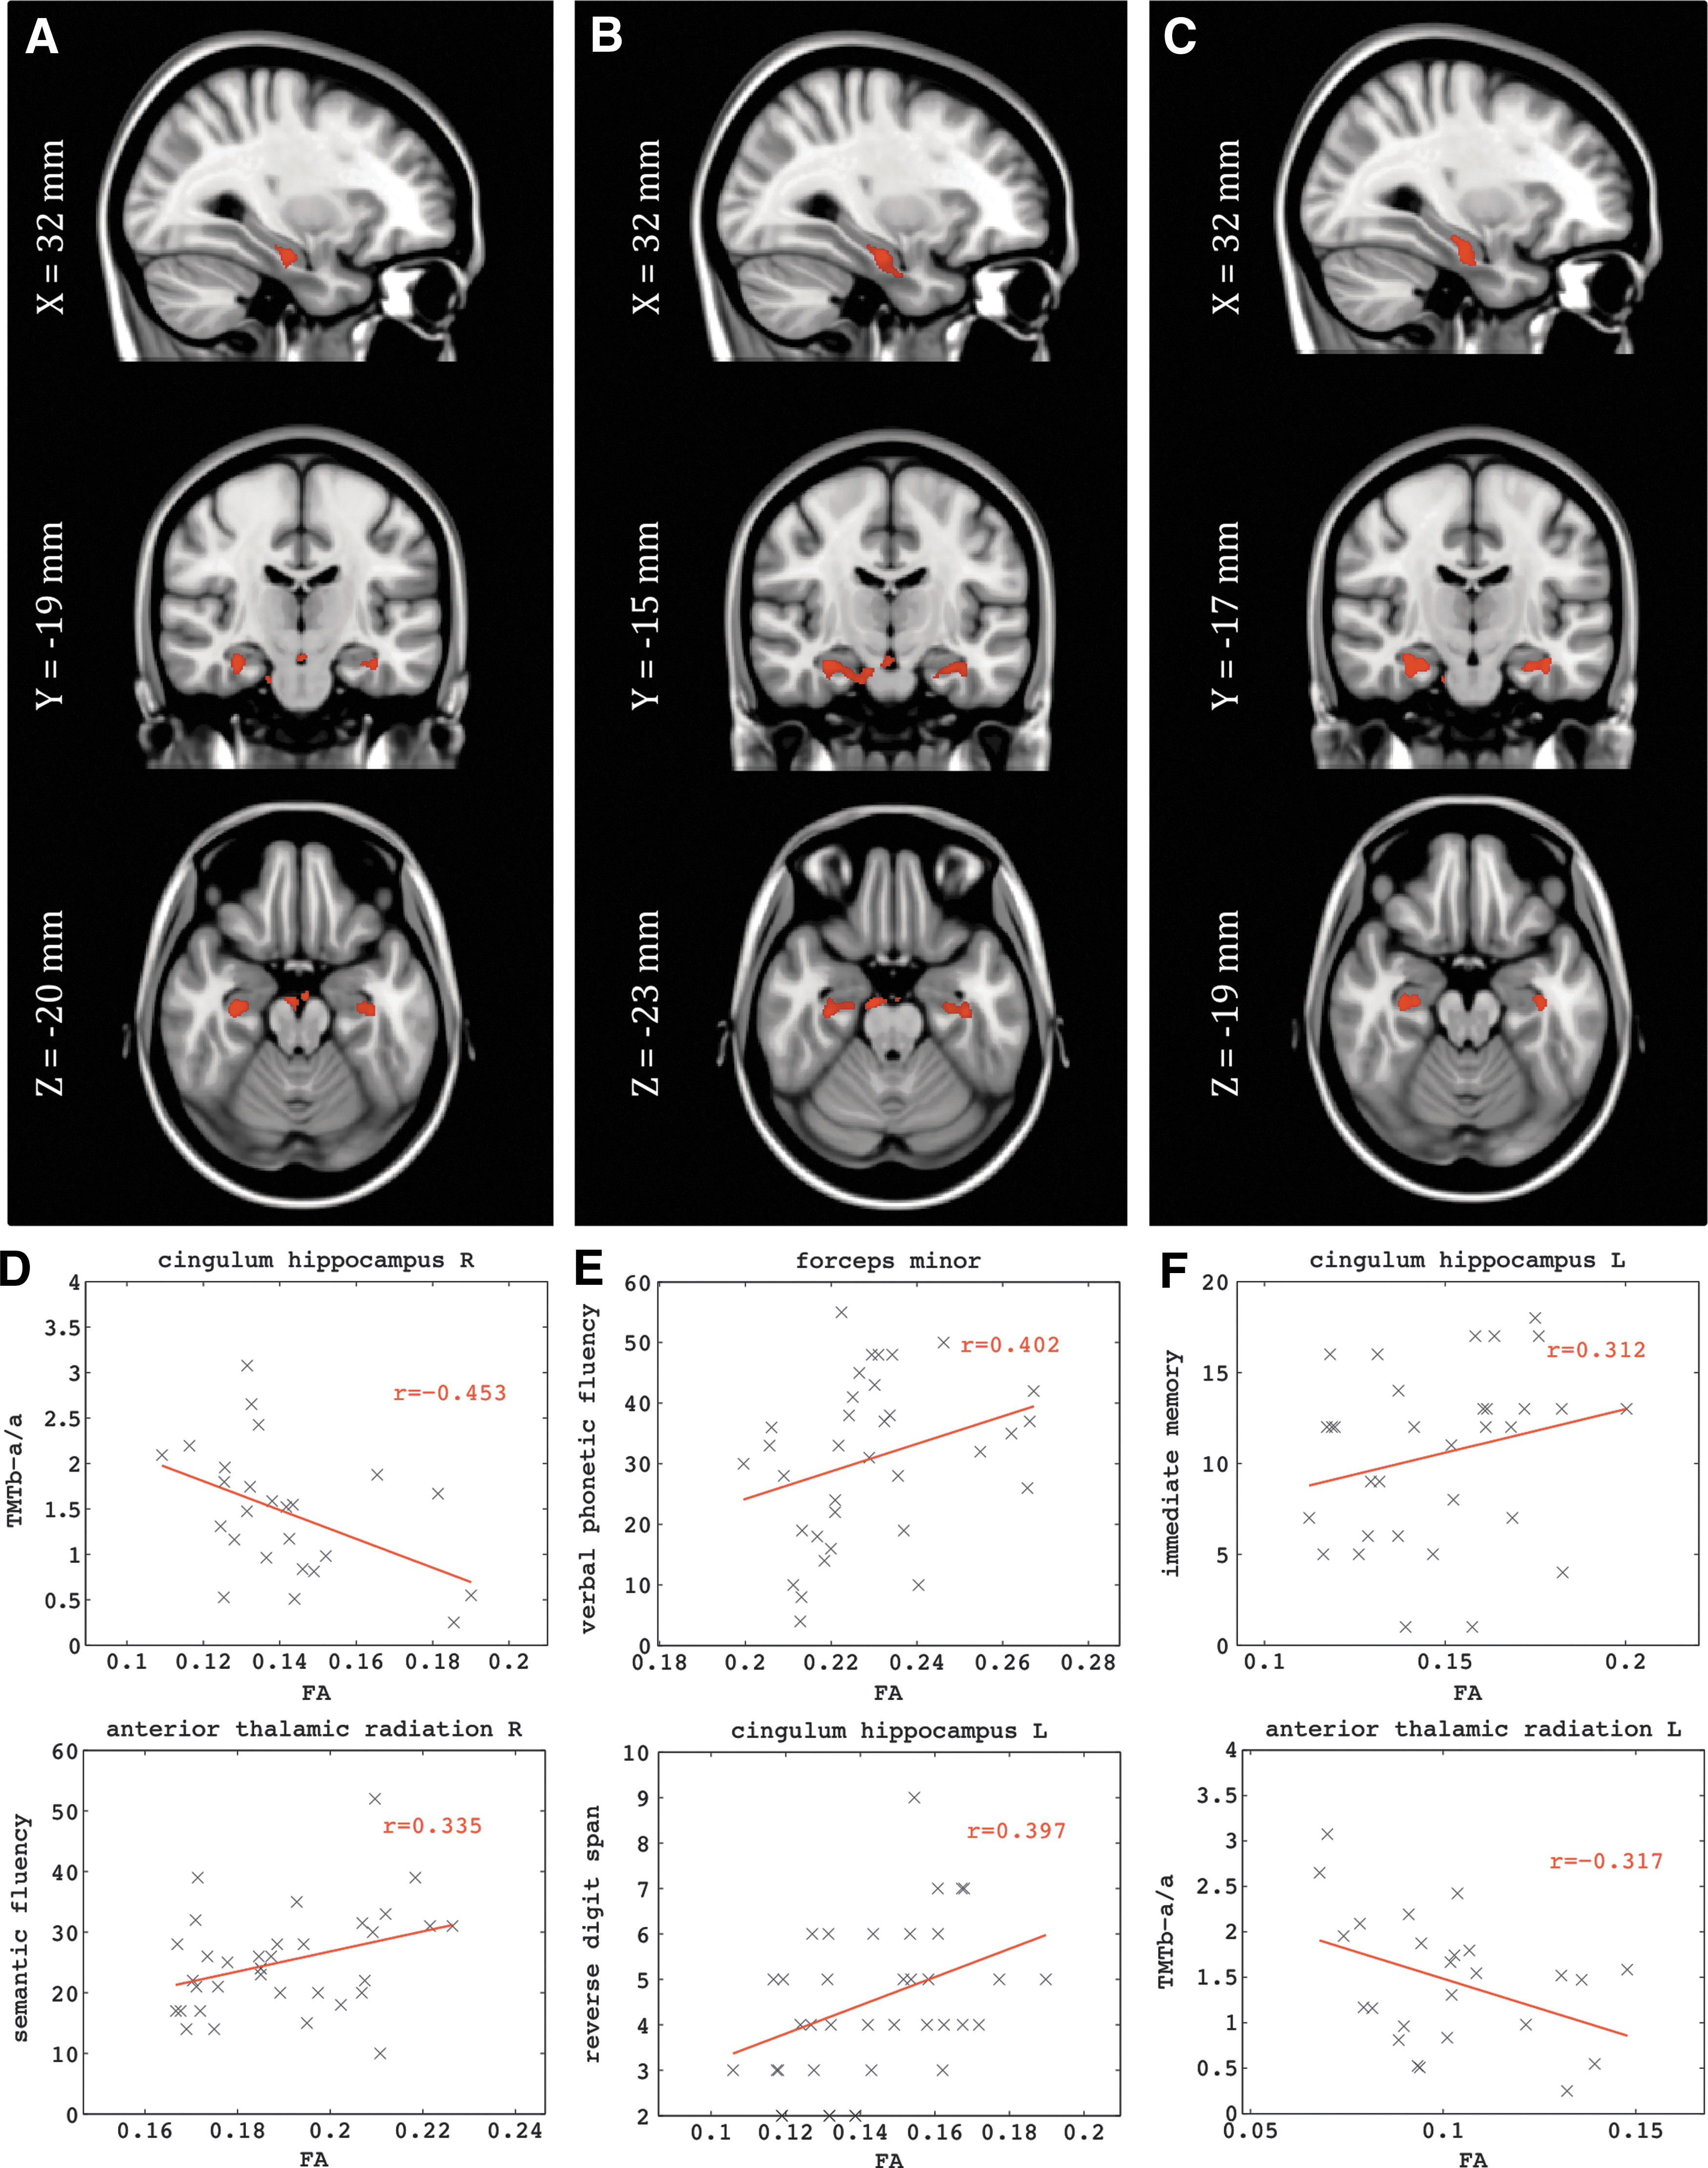
MNI Coordinates for the Tracts Showing Dependence Between FA and the Normalized Graph Theory Metrics in the aMCI Group
Only the normalized clustering in delta, theta and alpha bands showed significant dependence (FDR q<0.01) with the FA in the indicated tracts. These tracts were identified with the probabilistic atlas from Johns Hopkins University (Hua et al., 2008). The table includes the MNI coordinates of the voxel with highest significance, the cluster size (i.e., number of voxels) and the peak t-value. The last three columns contain the average FA and standard deviations across subjects in the WM clusters, and the p-values after a multifactorial ANOVA, including age and gender as factors.
FDR correction for multiple comparisons (q<0.1).
WM, white matter.
These WM regions were also related to the cognitive functions of the aMCI patients. We correlated performance on our neuropsychological tests with the average FA of the clusters. We found that interregional and interhemispheric connections were critical for the successful performance of these tasks. Specifically, phonemic fluency (“tell me as many words as you can beginning with the letter F”) correlated with FA in the forceps minor (connecting the frontal lobes), and that semantic fluency (i.e., “name as many animals as possible within one minute”) was not only correlated with FA in the forceps minor, but also the right anterior thalamic radiation, the right inferior fronto-occipital fasciculus, and the right ILF—that is the long interregional connections (Table 6). The ability of the aMCI patients to recall short prose passages immediately after presentation was associated with FA in the right inferior fronto-occipital fasciculus, right ILF, and the left cingulum of the hippocampus. Recall of those same prose passages after a delay of 20 min was linked to FA in the right inferior fronto-occipital fasciculus. Finally, a measure of frontal system function (i.e., the Trailmaking Test) was correlated with FA in the right cingulum of the hippocampus, the right anterior thalamic radiation, and the forceps minor.
Correlates of the Neuropsychological Scores with the Mean FA Values in Specific WM Tracts
The mean FA values were obtained in the clusters of voxels that showed statistical dependence with the normalized graph theory metrics. All correlations were statistically significant with p<0.01.
Discussion
First, and most important, we report here for the first time the significant associations between the structural integrity of WM as revealed by the DTI, and the functional integrity of the neuronal networks in aMCI patients as revealed by graph theory metrics. In the process of reaching these findings, we also confirmed prior observations of the significant alterations in the integrity of WM in aMCI patients relative to healthy controls (Medina et al., 2006; O'Dwyer et al., 2011), and that there are disruptions of FC of the neuronal networks measured with MEG (Buldú et al., 2011; Stam et al., 2009). It is worth mentioning that this study counts with some limitations: (1) the groups did not match in age nor education level. Although we included age and gender as regressors in all statistical analyses, this could bias the results and hence more homogeneous samples are needed to confirm the findings; (2) the differences in the graph analyses were not statistically robust as they just overcome an FDR correction of q<0.1, however, due to the low number of comparisons we consider this threshold to be enough; further analyses with the networks will be needed to identify more robust markers of the pathology in the topography of the functional networks; (3) the lack of small-world organization in the functional networks has also been observed (Stam et al., 2009), and it could be a consequence of using fully connected weighted un-thresholded networks.
The normalized graph metrics showed that the network organization was more random for the aMCI patients than for the healthy controls in beta frequency band. The aMCI patients had less well organized FC, meaning that brain regions were not communicating as effectively with each other as they were in the cognitively healthy individuals. The more a normalized graph metric differs from one, the further from random the network organization is. In our results all normalized graph metrics were higher than one, therefore positive correlations between the metrics and FA means that this measure of network integrity is related to the “health” of the WM in that particular fiber tract.
The WM regions that were related to the functional architecture of the neuronal networks have a common property; they are anatomical hubs with the role of connecting spatially distant brain regions. The affected frequency bands, delta, theta, and beta all show the loss of clustering organization, which is one sign of a tendency to form a random network among the MCI patients. The WM loss disrupts the normal communication along the entire episodic memory functional network (Lockhart et al., 2012). Although we did not find a significant association between FA and the normalized graph metrics for the HC group, healthy subjects showed a higher average FA in the clusters identified for the aMCI group. This led us to consider that the damage of those regions might form the anatomical basis of cognitive and functional decline.
In our work, a lower performance in episodic memory tests was associated with a reduced network organization during resting state in the MCI group. This is consistent with the observations that the resting state network architecture has been linked to episodic memory performance in healthy control subjects (Buckner et al., 2008), in patients with damage in the medial temporal lobe (MTL) (McCormick et al., 2013), and in AD patients (Stam et al., 2009). The tendency toward a random architecture of the network that we found during “rest,” coupled with the loss of WM integrity, could, at the very least affect memory processing by disrupting encoding and recall stages. This is supported by the observation that there is a correlation between disrupted WM (i.e., lower FA) in the inferior fasciculus and the cingulum of the hippocampus with both encoding and delayed recall of prose passages. Thus, it appears that the MTL, ILF, anterior thalamus, and the forceps minor are forming a network necessary to encode, maintain, and recall information from episodic memory.
Although damage to WM can sometimes be considered secondary to gray matter loss, there is evidence of damage to the WM in the absence of gray matter loss both in human and animal models (Desai et al., 2009; Selnes et al., 2012). Perhaps most important, is the fact that at least some of the WM damage is related to the vascular changes, which are often represented as WM hyperintensities (Zhuang et al., 2010).
Our findings are provocative because they lend support to the idea that the clinical syndrome of AD is at least partially represented as a disconnection syndrome, and that such disconnection can be observed in the prodromal phase between normal cognition and clinical dementia (i.e., MCI). The joint use of anatomical and neurophysiological data in this study provides us with the opportunity to address this question in a way that could not be done with either modality alone. What is not clear from our data is the extent to which other variables, including the presence of the APOE*4 risk gene or the extent of beta-amyloid deposition, affect brain structural and functional health.
The data that we report here are fully consistent with prior MEG studies [see Zamrini et al. (2011) for review]. AD patients have a general decrease in FC across all frequencies (Stam, 2010), indicating less organized functional networks. However, MCI patients are able to muster a possible compensatory response by increasing inter-regional connectivity to support their performance on memory tasks (Bajo et al., 2010), and which may be one expression of brain or cognitive reserve (Satz, 1993; Stern et al., 1992, 1994). The network architecture in MCI patients has a loss of cluster organization and a tendency toward a more random (i.e., less organized) network structure (Buldú et al., 2011), and those patients who subsequently become demented have higher synchronization values (Bajo et al., 2012a). This latter point is important because it suggests that hypersynchronization reflects a pathological state within the neuronal networks. By contrast, individuals with subjective memory complaints (but no evidence of object memory loss) actually underexpress a network that supports recognition memory (Bajo et al., 2012b). Thus, there seems to be a dynamic change in brain function over the spectrum of normal aging through subjective memory complaints to MCI to dementia. Our data suggest a consistency in the observations regarding the neural networks in MCI patients, and add to our understanding of the altered function by providing a structural basis for the functional changes.
It is important to note the contributions of graph theory (Bullmore and Sporns, 2009) to our understanding of brain functional networks. In graph theory we conceptualize an underlying network as consisting of a series of nodes or vertices, and a set of links that connect the nodes. While the nodes in our MEG analysis are grounded in physical space—they represent the individual MEG sensors—the links between the nodes, or path lengths, are related to functional, not physical proximity. Thus, the shortest path length parameter may connect spatially disparate points but which have a high degree of interconnectedness with a relatively few number of intervening nodes. While these graph theory metrics have been used in other electrophysiological studies (Bassett et al., 2006; Stam et al., 2009), this is the first time that these metrics have been shown to be related to brain structural integrity, and specifically the physical connections between brain regions. Teipel et al. (2009) showed a correlation between WM structure in the thalamus, among other structures, and the frontal coherence values at the alpha band with electroencephalography. However, they did not report how the damage of specific WM tracts disrupted the organization of the whole brain network.
There is a growing body of evidence that suggests that measures of the brain functional organization as revealed by MEG show a progressive pattern of change as an individual moves from a state of normal cognition, through subjective memory complaints, to MCI, and finally to clinical dementia. The extent of brain functional abnormality may be related to the speed at which an individual may develop dementia, or may be viewed as representing the extent of neuronal network abnormality that is not completely captured by clinical examination. As the requirements of science demand our ability to detect the earliest evidence of pathological change in the brains of individuals destined to develop the dementia of AD, the sensitivity of MEG to brain functional changes prior to clinical change may be critical.
Conclusion
We have provided evidence that the impairment in specific WM tracts is related to a shift of the functional networks toward a random organization. How these changes fit into the natural history of AD and dementia is yet to be determined. However, these and related data go a long way toward validating the utility of the anatomical-FC (DTI/MEG) in our studies of the natural history of AD.
Footnotes
Acknowledgments
This work was supported in part by funds from the Spanish Ministry of Economy and Competitiveness (PSI2012-38375-C03-01) and the Spanish Ministry of Science (PSI2009-14415-C03-01). The authors are grateful to the research participants and their families for their participation in this study. J.A.P.P. was supported by the Spanish Ministry of Education through the National Program FPU (AP2010-1317). P.G. was supported by a grant of the Campus de Excelencia Moncloa. M.E.L. was supported by a predoctoral fellowship from the Ministry of Education (FPU AP-2008-00175). S.A. was supported by a predoctoral grant of the Basque Government. J.T.B. was supported, in part, by funds from the National Institutes of Health (AG05133, MH098745).
Author Disclosure Statement
No competing financial interests exist.