
Abstract
Studies of resting-state fMRI have shown that blood oxygen level dependent (BOLD) signals giving rise to temporal correlation across voxels (or regions) are dominated by low-frequency fluctuations in the range of ∼0.01–0.1 Hz. These low-frequency fluctuations have been further divided into multiple distinct frequency bands (slow-5 and -4) based on earlier neurophysiological studies, though low sampling frequency of fMRI (∼0.5 Hz) has substantially limited the exploration of other known frequency bands of neurophysiological origins (slow-3, -2, and -1). In this study, we used resting-state fMRI data acquired from 21 healthy subjects at a higher sampling frequency of 1.5 Hz to assess the presence of resting-state functional connectivity (RSFC) across multiple frequency bands: slow-5 to slow-1. The effect of different frequency bands on spatial extent and connectivity strength for known resting-state networks (RSNs) was also evaluated. RSNs were derived using independent component analysis and seed-based correlation. Commonly known RSNs, such as the default mode, the fronto-parietal, the dorsal attention, and the visual networks, were consistently observed at multiple frequency bands. Significant inter-hemispheric connectivity was observed between each seed and its contra lateral brain region across all frequency bands, though overall spatial extent of seed-based correlation maps decreased in slow-2 and slow-1 frequency bands. These results suggest that functional integration between brain regions at rest occurs over multiple frequency bands and RSFC is a multiband phenomenon. These results also suggest that further investigation of BOLD signal in multiple frequency bands for related cognitive processes should be undertaken.
Introduction
Resting-state blood oxygen level dependent (BOLD) fluctuations have been shown to be highly correlated across spatially remote though functionally related brain regions predominantly in the low-frequency range (0.01–0.1 Hz); BOLD fluctuations in this range are commonly known as “low-frequency fluctuations (LFFs)” (Biswal et al., 1995). The correlations of temporally filtered BOLD time series between brain regions are thought to represent functional integration and have been termed “resting-state functional connectivity” (RSFC). Based on RSFC, the human brain can be characterized into multiple networks using approaches such as seed-based correlation (Biswal et al., 1995) and independent component analysis (ICA) (Beckmann et al., 2005; Kiviniemi et al., 2003). These resting-state networks (RSNs) are also derived by studying across-subject covariance of BOLD signal amplitude (functional covariance networks) (Liao et al., 2013; Taylor et al., 2012; Zhang et al., 2011). Functional integration between brain regions and associated RSNs has also been established using other imaging modalities that do not involve temporal filtering such as PET (Friston et al., 1993; Horwitz et al., 1984) and structural connectivity (Greicius et al., 2009). Various nonimaging modalities that involve some temporal processing, such as electroencephalography (EEG) (Musso et al., 2010) and magneto encephalography (Brookes et al., 2011), have also been used to study RSFC.
RSFC has been also detected across different species. Earlier studies have shown presence of a “default mode network” like network in anesthetized monkeys (Vincent et al., 2007), rats (Lu et al., 2012; Pawela et al., 2008), and mice (Jonckers et al., 2011). This RSFC and underlying resting-state fluctuations are shown to be modulated with alterations in physiological condition of the animal models (Kannurpatti et al., 2008). Further, electrophysiological signals obtained through single-cell recordings and EEGs during rest are present across multiple frequency bands, and neuronal networks in the mammalian brain are known to demonstrate oscillations in multiple frequency bands spanning up to 500 Hz (Buzsáki and Draguhn, 2004; Llinas, 1988). Together, these observations imply that functional integration between neuronal processes occurs over a wide range of frequencies. Generally, BOLD fMRI fluctuations used to study functional integration between neuronal processes during rest are temporally filtered in low-frequency band (0.01–0.1 Hz) (Biswal et al., 1995), predominantly to avoid the influence of physiological noises (respiration and cardiac signal) present in BOLD fMRI data. This narrow fMRI frequency band overlaps with multiple frequency bands defined previously by electrophysiological studies: slow-5 (0.01–0.027 Hz), slow-4 (0.027–0.073 Hz), and part of slow-3 (0.073–0.198 Hz) (Buzsáki and Draguhn, 2004; Penttonen and Buzsáki, 2003). In addition, due to hardware limitations preceding recent advances in inverse imaging, the sampling rate for whole-brain fMRI has been limited to about 2 sec, resulting in a frequency bandwidth of fMRI typically between 0 and 0.25 Hz. This has limited further exploration of fMRI signal during resting state in frequencies higher than 0.1 Hz, which may relate to corresponding slow-3, slow-2, and slow-1 frequency bands.
Previous studies have explored functional integration between brain regions at BOLD fMRI fluctuations >0.1 Hz. Cordes et al. (2001), using low-spatial but high temporal resolution resting-state fMRI data, reported significantly higher contribution (∼90%) of LFFs to the RSFC of the auditory, the visual, and the sensory motor networks compared with 0.1–1.1 Hz. Wu et al. (2008), based on whole-brain fMRI scanned at low sampling rate (TR=2 sec, sampling frequency=0.25 Hz), observed decreased RSFC in the sensorimotor cortex, the default mode network (DMN), and the visual network in frequency bands from 0.1 to 0.25 Hz compared with the low-frequency band (0.01–0.1 Hz). Similarly, Niazy et al. (2011) have observed RSNs across multiple low-frequency bands (0.01–0.15 Hz).
Recent advancements in data acquisition sequences and multiband imaging techniques (Feinberg et al., 2010; Feinberg and Yacoub, 2012; Jesmanowicz et al., 2011) have enabled whole-brain fMRI scanning at subsecond temporal resolution. These advancements have significantly increased fMRI bandwidth from 0.25 to ∼5 Hz. Using similar acquisition methods, Lee et al. (2012) have demonstrated interhemispheric connectivity in the sensory motor cortex from BOLD fluctuations in higher frequency ranges (>0.25 Hz) than traditionally used in resting-state fMRI studies (0.01–0.1 Hz). Similarly, Boubela et al. (2013) have shown the presence of the default mode and frontal-parietal networks by applying ICA to BOLD fMRI data acquired at higher sampling rate (TR=354 msec, sampling frequency=2.82 Hz).
Although earlier studies have described the presence of different RSNs in higher frequency bands than LFFs (>0.1 Hz), these studies were mainly performed using a single approach to study RSNs (Boubela et al., 2013; Lee et al., 2012). Moreover, these reports focused on specific networks rather than on the entire collection of RSNs (Boubela et al., 2013; Lee et al., 2012; Wu et al., 2008). Finally, the BOLD signal frequencies >0.1 Hz were generally combined in a single-frequency band to derive RSNs (Boubela et al., 2013; Lee et al., 2012).
Here, we use high-temporal resolution resting-state BOLD fMRI data (TR=645 msec, sampling frequency=1.5 Hz) to investigate functional integration among brain regions in various frequency bands. Resting-state BOLD fMRI data was divided into five frequency bands (slow-1 to slow-5) based on earlier electrophysiological (Buzsáki and Draguhn, 2004) and fMRI studies (Zuo et al., 2010). Functional integration between brain regions was derived using a priori-information-driven approach (seed-based correlation) and a data-driven approach (ICA). For each of the identified RSNs, the relative power contribution from BOLD signal in each of the frequency bands was also calculated. Based on earlier studies, we hypothesize that functional integration within and between brain regions from both task-positive and task-negative networks will be observed in multiple frequency bands. We also hypothesize that both spatial extent and connectivity strength for RSNs will be highly variable across frequency bands.
Materials and Methods
Subjects
All the subject data used for the current study were obtained from the open-sharing data repository Enhanced Nathan Kline Institute-Rockland (NKI) Sample (Nooner et al., 2012). For this study, we used resting-state data scanned at TR=645 msec. Other parameters included were as follows: FOV=240×240 mm2, matrix size=74×74, number of slices=40, TE=30 msec, number of time points=900, with a spatial resolution of 3-mm isotropic voxel. For each of the subjects, a high-resolution T1–weighted magnetically prepared gradient echo (MPRAGE) image was also obtained (FOV=250×250 mm2, TR=1900 msec, TE=2.52 msec, number of slices=176, voxels size=1×1×1 mm3). Further information about subject scanning can be obtained from the project website (
We applied multiple selection criteria to create a homogeneous sample from a total of 129 subjects available in the community sample. First, we excluded those with known history of neurological, psychological, and physiological disorders (e.g., high or low blood pressure) yielding a remaining sample size of 84. Then, only subjects between the age range of 18–35 years were included (n=31). Lastly, we discarded subjects with large head motion (>1 voxel edge) in any direction. In total, 21 subjects (mean: 24 years; STD: 4 years; 12 women) were included for further analyses.
Data processing
Preprocessing
In the current study, we implemented a processing pipeline that was developed using AFNI (Cox, 1996), FSL (
Temporal filtering
Following data preprocessing, BOLD fMRI data was temporally filtered into five distinct frequency bands in order to study frequency-specific functional integration. These frequency bands were (1) slow-5 (0.01–0.027 Hz), (2) slow-4 (0.027–0.073 Hz), (3) slow-3 (0.073–0.198 Hz), (4) slow-2 (0.198–0.5 Hz), and (5) slow-1 (0.5–0.75 Hz), coinciding with the frequency bands defined in earlier electrophysiological (Buzsáki and Draguhn, 2004; Penttonen and Buzsáki, 2003) and fMRI studies (Zuo et al., 2010). The frequency bands slow-5 and slow-4 mainly represented the frequency range (0.01–0.073 Hz) widely employed in resting-state BOLD fMRI studies. Slow-3 represented a combination of frequencies from the classic frequency band widely used in r-fMRI studies (0.073–0.1 Hz) and from the frequency band discarded through temporal filtering (0.1–0.198 Hz). Slow-2 represented BOLD fMRI fluctuations that were generally considered highly contaminated with respiration signal. When recorded explicitly, these respiration and cardiac signals can be filtered out from the specific frequency bands. In the current study, due to lack of external physiological recording, the exact respiration/cardiac frequency for each of the subject was unknown. Hence, we implemented linear regression techniques to reduce the effects of these physiological signals from the BOLD fMRI data. Classically, slow-1 frequency band is defined by a bandwidth of 0.5–1.5 Hz but due to limitation of sampling frequency in the current fMRI study, we have restricted slow-1 band to 0.5–0.75 Hz. In addition, preprocessed BOLD fMRI data without temporal filtering (though the time series were de-meaned, leaving the bandwidth as 0.01–0.75 Hz) was also used in subsequent analysis and will be referred as noFILT.
Independent component analysis
The relative contributions of each frequency band to different RSNs, as well as frequency-specific characteristics of a given network, were studied using a data-driven approach. To analyze the former, first probabilistic group ICA using the temporal concatenation approach in MELODIC software (Beckmann et al., 2005) was performed on unfiltered BOLD fMRI data. RSNs derived using this approach pertain to the whole-frequency band (0.01–0.75 Hz). Forty independent components (ICs) were derived. Spatial correlation was conducted between these group-level IC maps and FCP-1000 IC maps (Biswal et al., 2010) to identify and compute spatial overlap with RSNs (Taylor et al., 2012). For each of the identified RSNs, a corresponding group IC time series was obtained. Fast Fourier transformation was performed on the group IC time series of each of the RSNs. The relative power contributions of each frequency band to the IC time series were calculated as the ratio of the power in the given frequency band to the total power contained in the entire bandwidth (0.01–0.75 Hz).
To study frequency-specific characteristics of various RSNs, group ICA was performed separately on each of the five sets (slow-5 to slow-1) of temporally filtered BOLD fMRI data. Similar to the earlier mentioned analysis, RSNs were identified from each of the group ICA maps using spatial correlation and visual comparison with group IC maps obtained from FCP-1000.
Seed-based correlation
We conducted seed-based correlation using the seven seed regions as defined by Fox et al. (2005) and Wu et al. (2008). Seed regions from the frontal eye field (FEF; 25, −13, 50 MNI space), inferior parietal sulcus (IPS; −25, −57, 46), middle temporal gyrus (MTG; −45, −69, 2), and precentral gyrus (PCG; −45, −9, 39) were selected from task-positive networks, while seed regions from lateral parietal cortex (LPC; −45, −67, 36), medial prefrontal cortex (MPF; −1, 47, −4), and posterior cingulate cortex (PCC; −5, −49, 40) were selected from task-negative networks. For each seed, a 5-mm sphere was created in MNI standard space. The average time series of each seed region were extracted and correlated with all brain voxels to derive subject-level, seed-based correlation maps for a specific seed. These maps were converted into z-score values using Fisher's r–z transformation. MELODIC mixture modeling was also applied to z-score images in order to account for the temporal smoothness and increased degrees of freedom introduced due to use of multiband imaging sequence (Feinberg and Yacoub, 2012). Group-level correlation maps were calculated for each of the seven seed regions by performing one-sample t-tests (p<0.05, FDR corrected). This process was repeated for each of the five frequency bands and for each of seven seed regions resulting in 35 group-level correlation maps. These group-level correlation maps were visualized with the BrainNet Viewer (
Functional connectivity strength for each seed region was calculated on first-level subject-specific maps. To avoid biases due to differences in spatial extent observed across frequency bands, RSFC strength was calculated from a set of regions of interest (ROIs) defined based on FCP-1000 (Biswal et al., 2010) group-level connectivity maps. FCP-1000 group-level connectivity maps included six out of seven seed regions used in current study with the exception of the PCG; hence, the group-level IC map representing the motor network from FCP-1000 was used for PCG. Each of the group-level seed-based correlation map/IC maps from the FCP-1000 project was divided into brain regions that showed positive and negative correlation with the seed region. MNI coordinates of the voxels showing maximum positive/negative correlation were extracted from these brain regions and a 5-mm sphere was created surrounding these coordinates in MNI space. Table 1 lists all the seed regions and corresponding ROIs used to derive positive and negative connectivity strength. MNI coordinates (RAI) for each of the ROIs are also listed. Mean positive and negative connectivity strength was calculated from each of these ROIs for a subject and for a specific frequency band. This process was repeated for each of the seven seed regions for each of the five frequency bands across 21 subjects. Group-level RSFC strength was calculated by taking the mean across subjects for each of the frequency bands and for all of the seven seed regions.
MNI Coordinates (RAI) for the ROIs Defined for Calculation of Connectivity Strength
FEF, frontal eye field; IFG, inferior frontal gyrus; IPS, inferior parietal sulcus; LPC, lateral parietal cortex; MPF, medial prefrontal cortex; MTG, middle temporal gyrus; PCC, posterior cingulate cortex; PCG, precentral gyrus; RAI, right-left, anterior-posterior, inferior-superior; ROI, region of interest.
Results
Independent component analysis
Twelve different RSNs were identified in the group ICA output. Each of the 12 spatial IC maps, along with the corresponding (total) power spectrum, is shown in Figure 1: visual networks (VIS1–3, Fig. 1A–C), the DMN1 (Fig. 1D), the left frontal parietal network (Fig. 1E), the dorsal attention network (Fig. 1F), the right frontal parietal network (Fig. 1G), the DMN2 (Fig. 1H), the superior temporal gyrus (Fig. 1I), the salience network (SAL, Fig. 1J), the PCG1 (Fig. 1K), and the inferior frontal gyrus (IFG, Fig. 1L). Figure 1 also displays the relative contribution of power in each of the five frequency bands to the total power for each of the identified RSNs. In 9 out of 12 identified RSNs, the slow-4 (0.027–0.073) frequency band represented the highest power (∼30%) compared with other frequency bands. The slow-3 frequency band displayed highest power in the temporal gyrus (33%), the higher visual cortex (30%), and the IFG (38%) while the slow-5 band accounted for highest power in the DMN. Slow-2 accounted for ∼5% power across all the RSNs with highest relative contribution observed in the SAL (15%). The (partial) slow-1 frequency band studied here (0.5–0.75 Hz compared with 0.5–1.25 Hz) represented relatively less (<5%) of the total power in frequency band across all the RSNs. The contributions of the slow-4 and slow-3 frequency bands were found to be highly similar across all the RSNs (Fig. 1N).
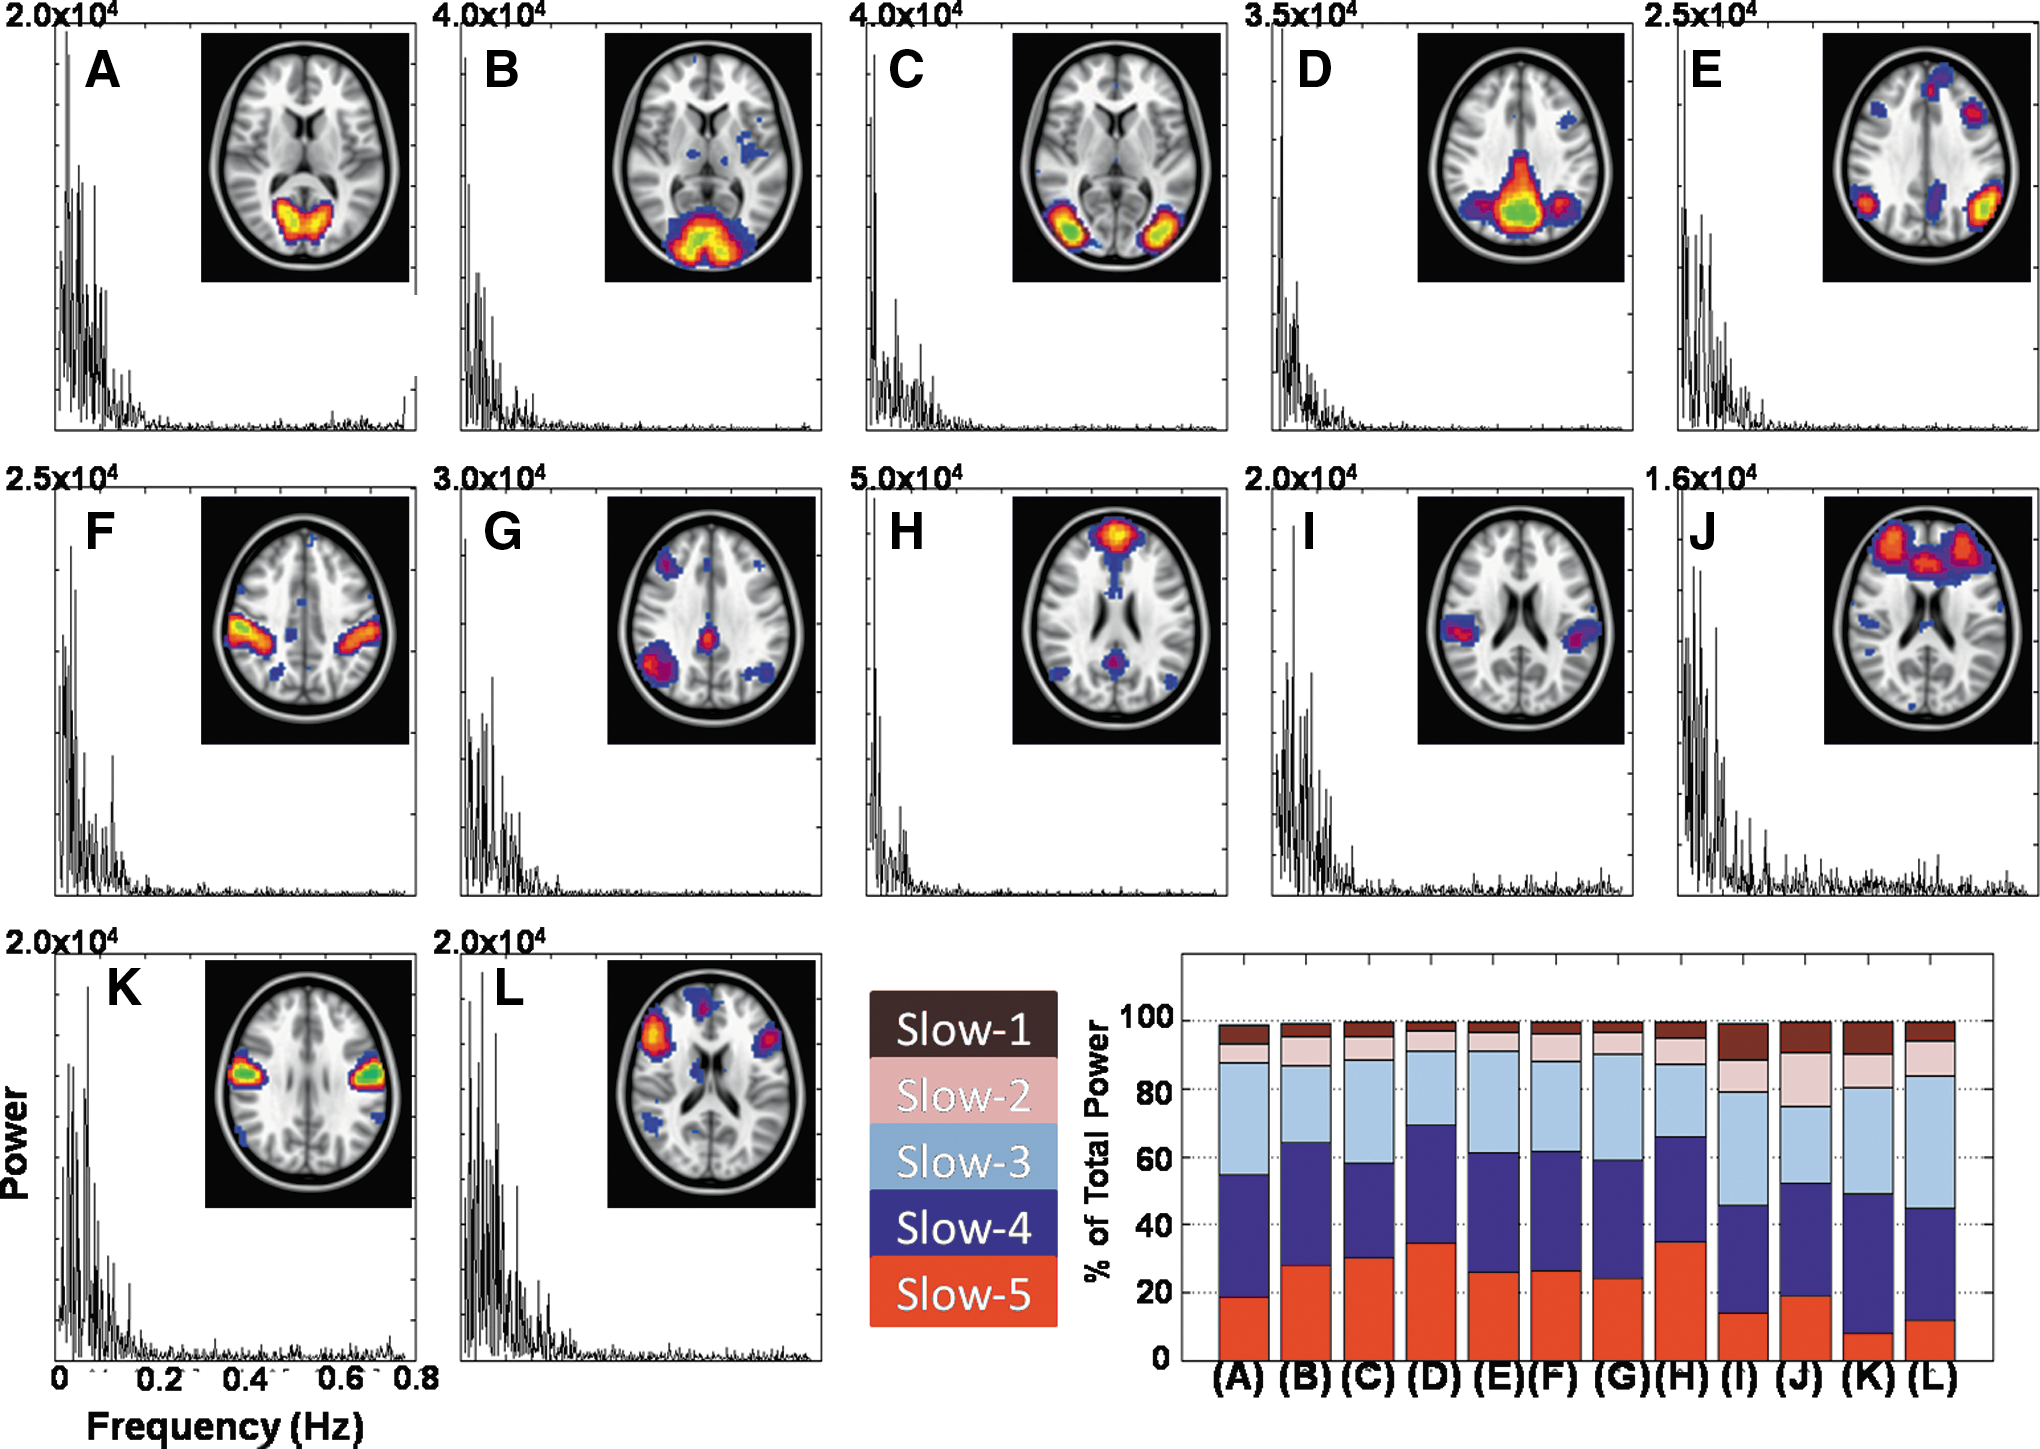
Group independent components derived using unFILT blood oxygen level dependent (BOLD) fMRI data (0.01–0.75 Hz) and corresponding power spectrum of group-level independent component time series from 13 resting-state networks/regions.
Figure 2 displays various RSNs derived using group ICA performed on filtered BOLD fMRI data in five different frequency bands. All the RSNs were consistently observed across three different frequency bands (slow-5, slow-4, and slow-3) though frequency-band-specific differences can be observed for each of the networks. Spatial maps representing the motor network, the IFG, and the DMN showed decreased spatial extent in the slow-2 though spatial extent of the left/right frontal parietal network (Fig. 2E, G) and the temporal gyrus showed little variations. Group ICA performed on the slow-1 frequency band resulted in noisy maps for various RSNs.
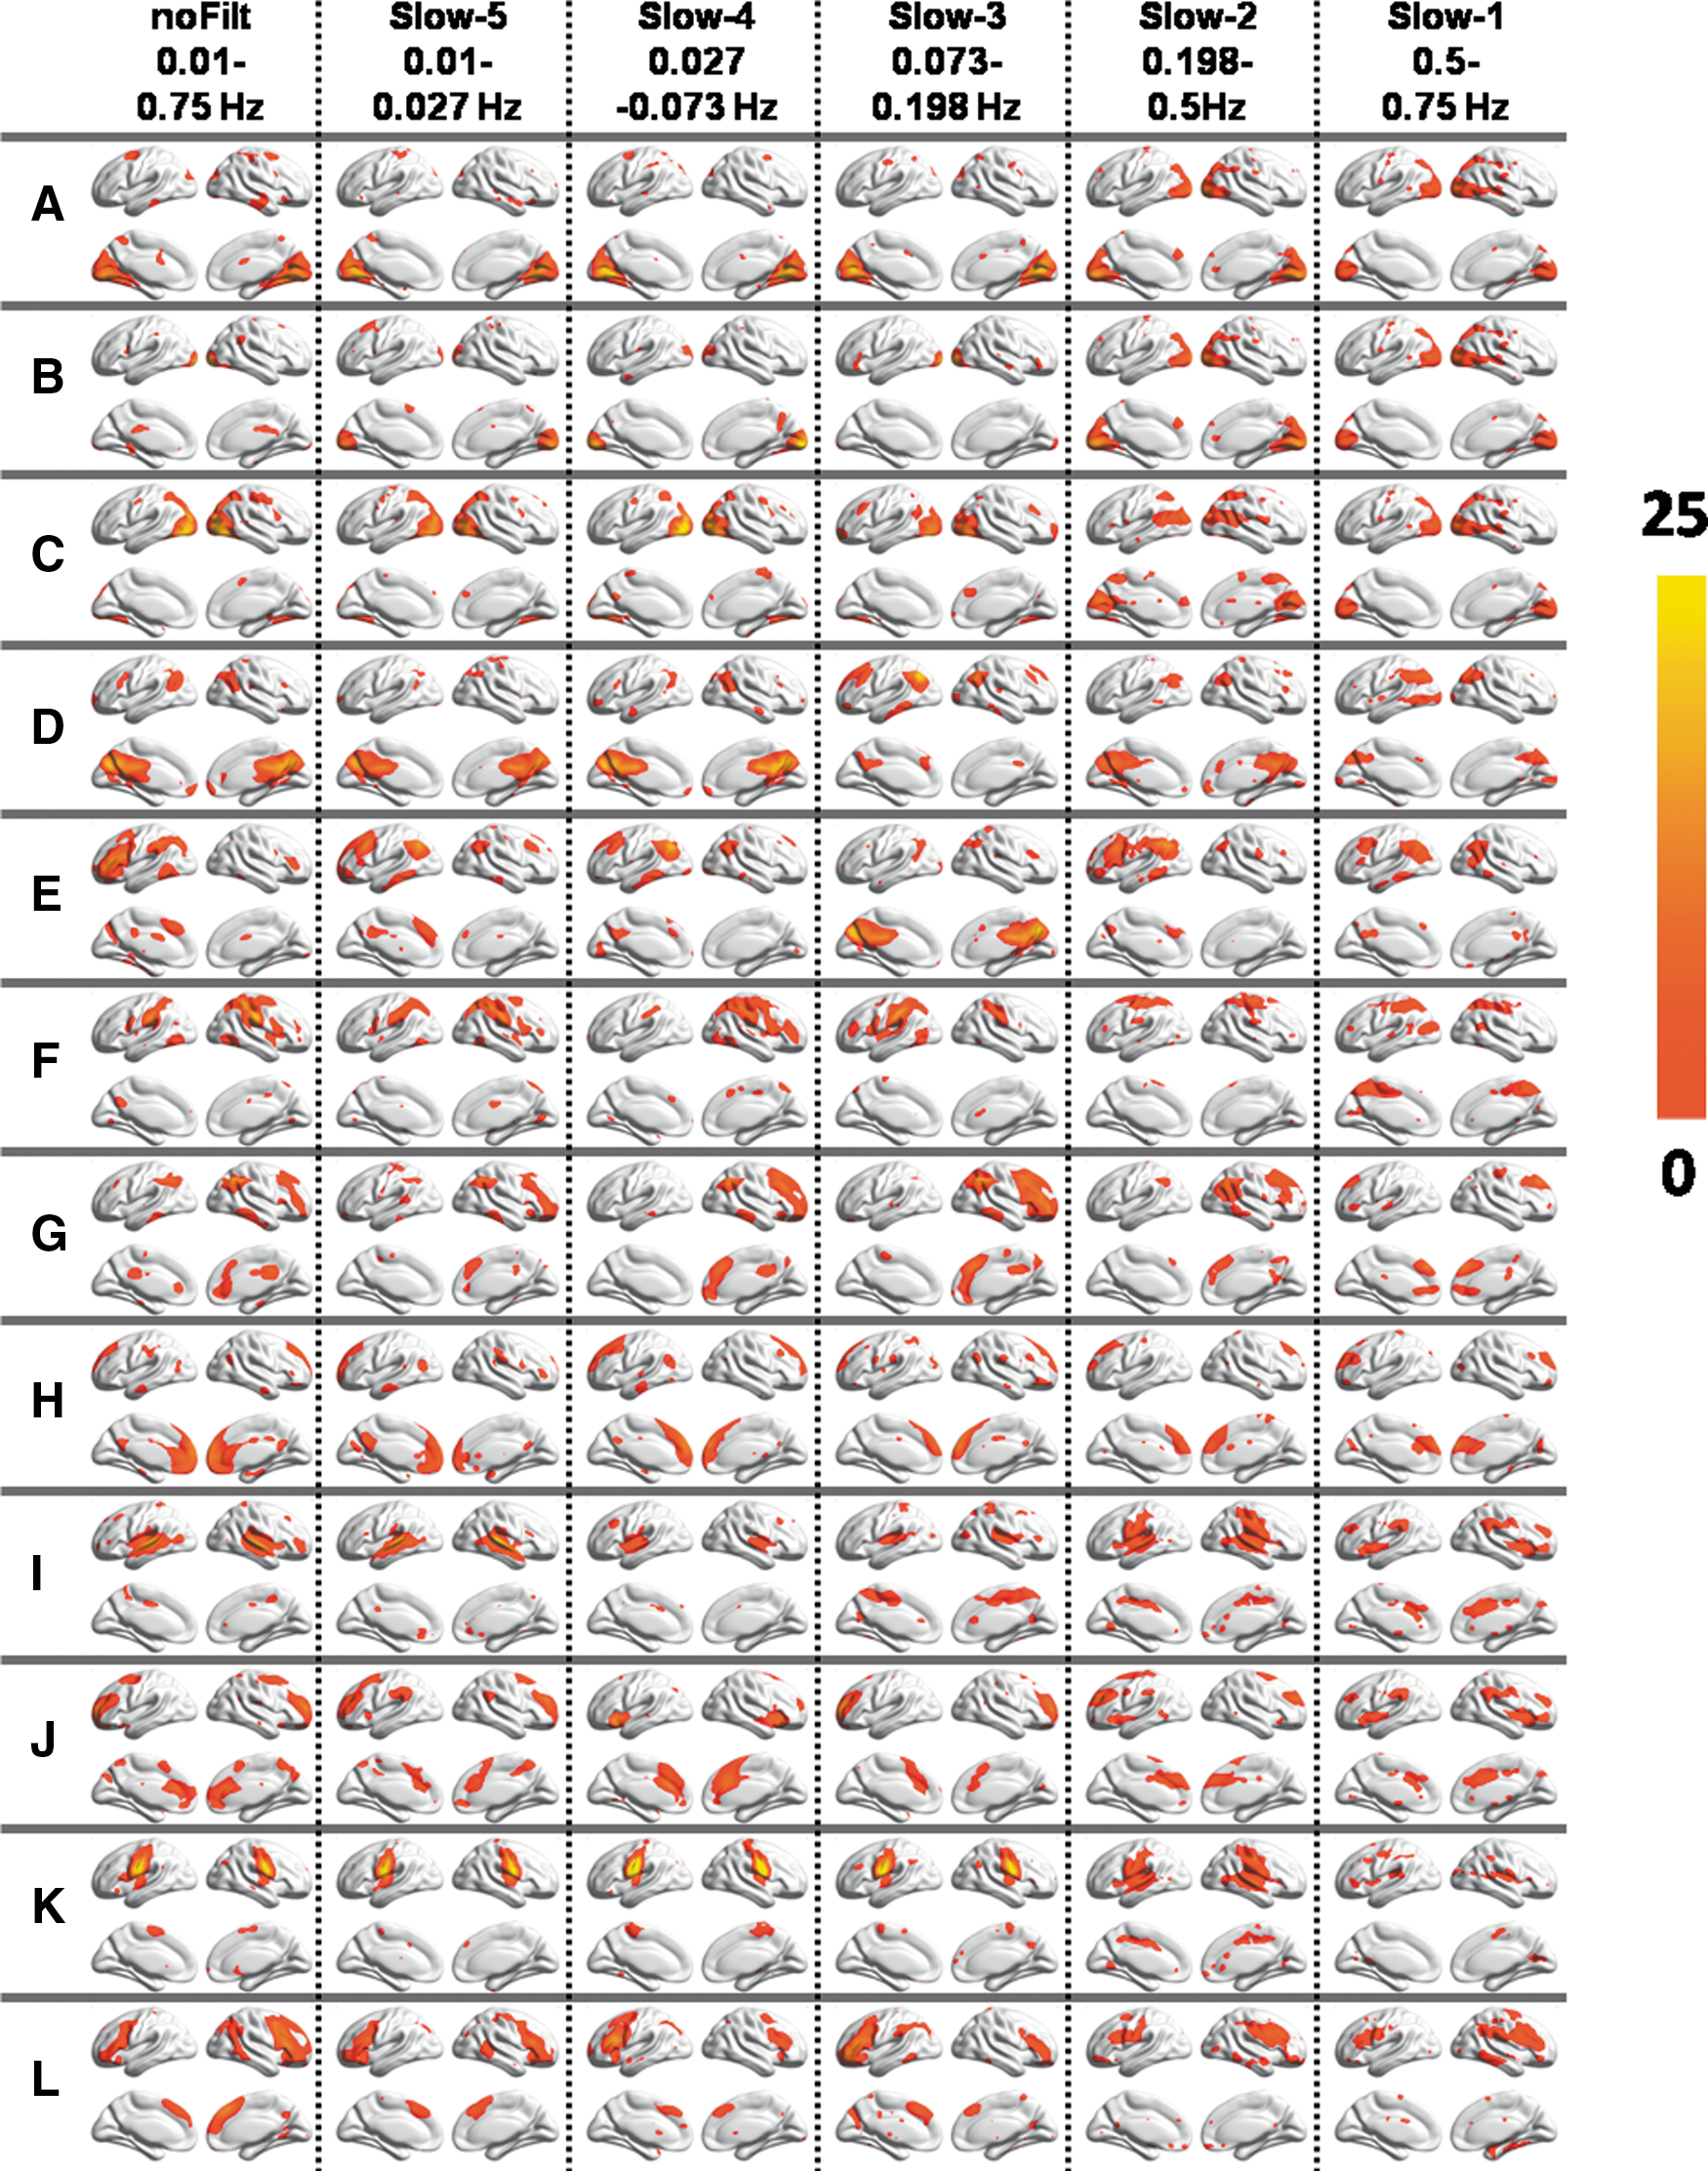
Group independent component analysis (ICA) maps derived from unFILT BOLD fMRI data and corresponding group ICA maps derived from different frequency bands (slow-1 to slow-5).
Seed-based correlation
Figure 3 displays group-level seed-based correlation maps derived using seven different seed regions for each of the five frequency bands (slow-5 to slow-1) (p<0.05, FDR corrected). Known patterns of RSNs for each of the seed regions were observed across all the frequency bands, though frequency-specific differences in spatial extent were observed. With an increase in BOLD signal frequency band from slow-5 to slow-1, positively correlated brain regions showed little differences in spatial extent while negatively correlated brain regions decreased across all the group-level correlation maps. Specifically, connectivity patterns in slow-5, slow-4, and slow-3 bands were quite similar for all the seed regions with the exception of the FEF. Across different frequencies, consistent interhemispheric connectivity was observed between each seed region and its corresponding brain region on the contra lateral side (Fig. 3).

Group-level seed-based correlation maps for each of the five specific frequency bands slow-5, slow-4, slow-3, slow-2, and slow-1 and for seven different seed regions, frontal eye field (FEF), inferior parietal sulcus (IPS), lateral parietal cortex (LPC), medial prefrontal cortex (MPF), middle temporal gyrus (MTG), posterior cingulate cortex (PCC), and PCG. Images show results of one-sample t-test (p<0.05, with FDR correction) overlaid on the surface map using BrainNet viewer.
Figure 4 displays the spatial extent and connectivity strength for each of the seed regions across different frequency bands. The spatial extent of the MTG, LPC, and MPF regions was found to be highly similar in the slow-3 (0.073–0.198 Hz) and slow-4 frequency bands, while other seed regions displayed highest spatial extent in the slow-4 frequency band (0.027–0.073 Hz). Spatial extent at the slow-3 frequency bands was found to be higher than spatial extent at the slow-5 frequency band for all the seed regions. Spatial extent of group-level maps for all the seed regions decreased considerably for slow-2 and slow-1 frequency bands, but significant correlation was observed between each seed regions and its corresponding brain regions on the contra lateral side. Group-level seed-based correlation maps for FEF were highly variable frequency bands while that of IPS and MPF were least variable. Similar to spatial extent, frequency-specific differences were also observed in mean positive/negative connectivity strength across various seed regions. LPC and MPF displayed stronger positive connectivity in the slow-3 frequency band compared with other frequency bands while FEF, IPS, and MTG displayed stronger positive connectivity in the slow-4 frequency band. Positive connectivity strength for slow-2 and slow-1 frequency bands was highly similar across seed regions and was found to be weaker than positive connectivity strength for the slow-5 frequency band at all the seed regions except for MPF and PCG. Connectivity strength at slow-4 and slow-3 frequency bands was found to be higher than slow-2 and slow-5 frequency bands (Fig. 4).
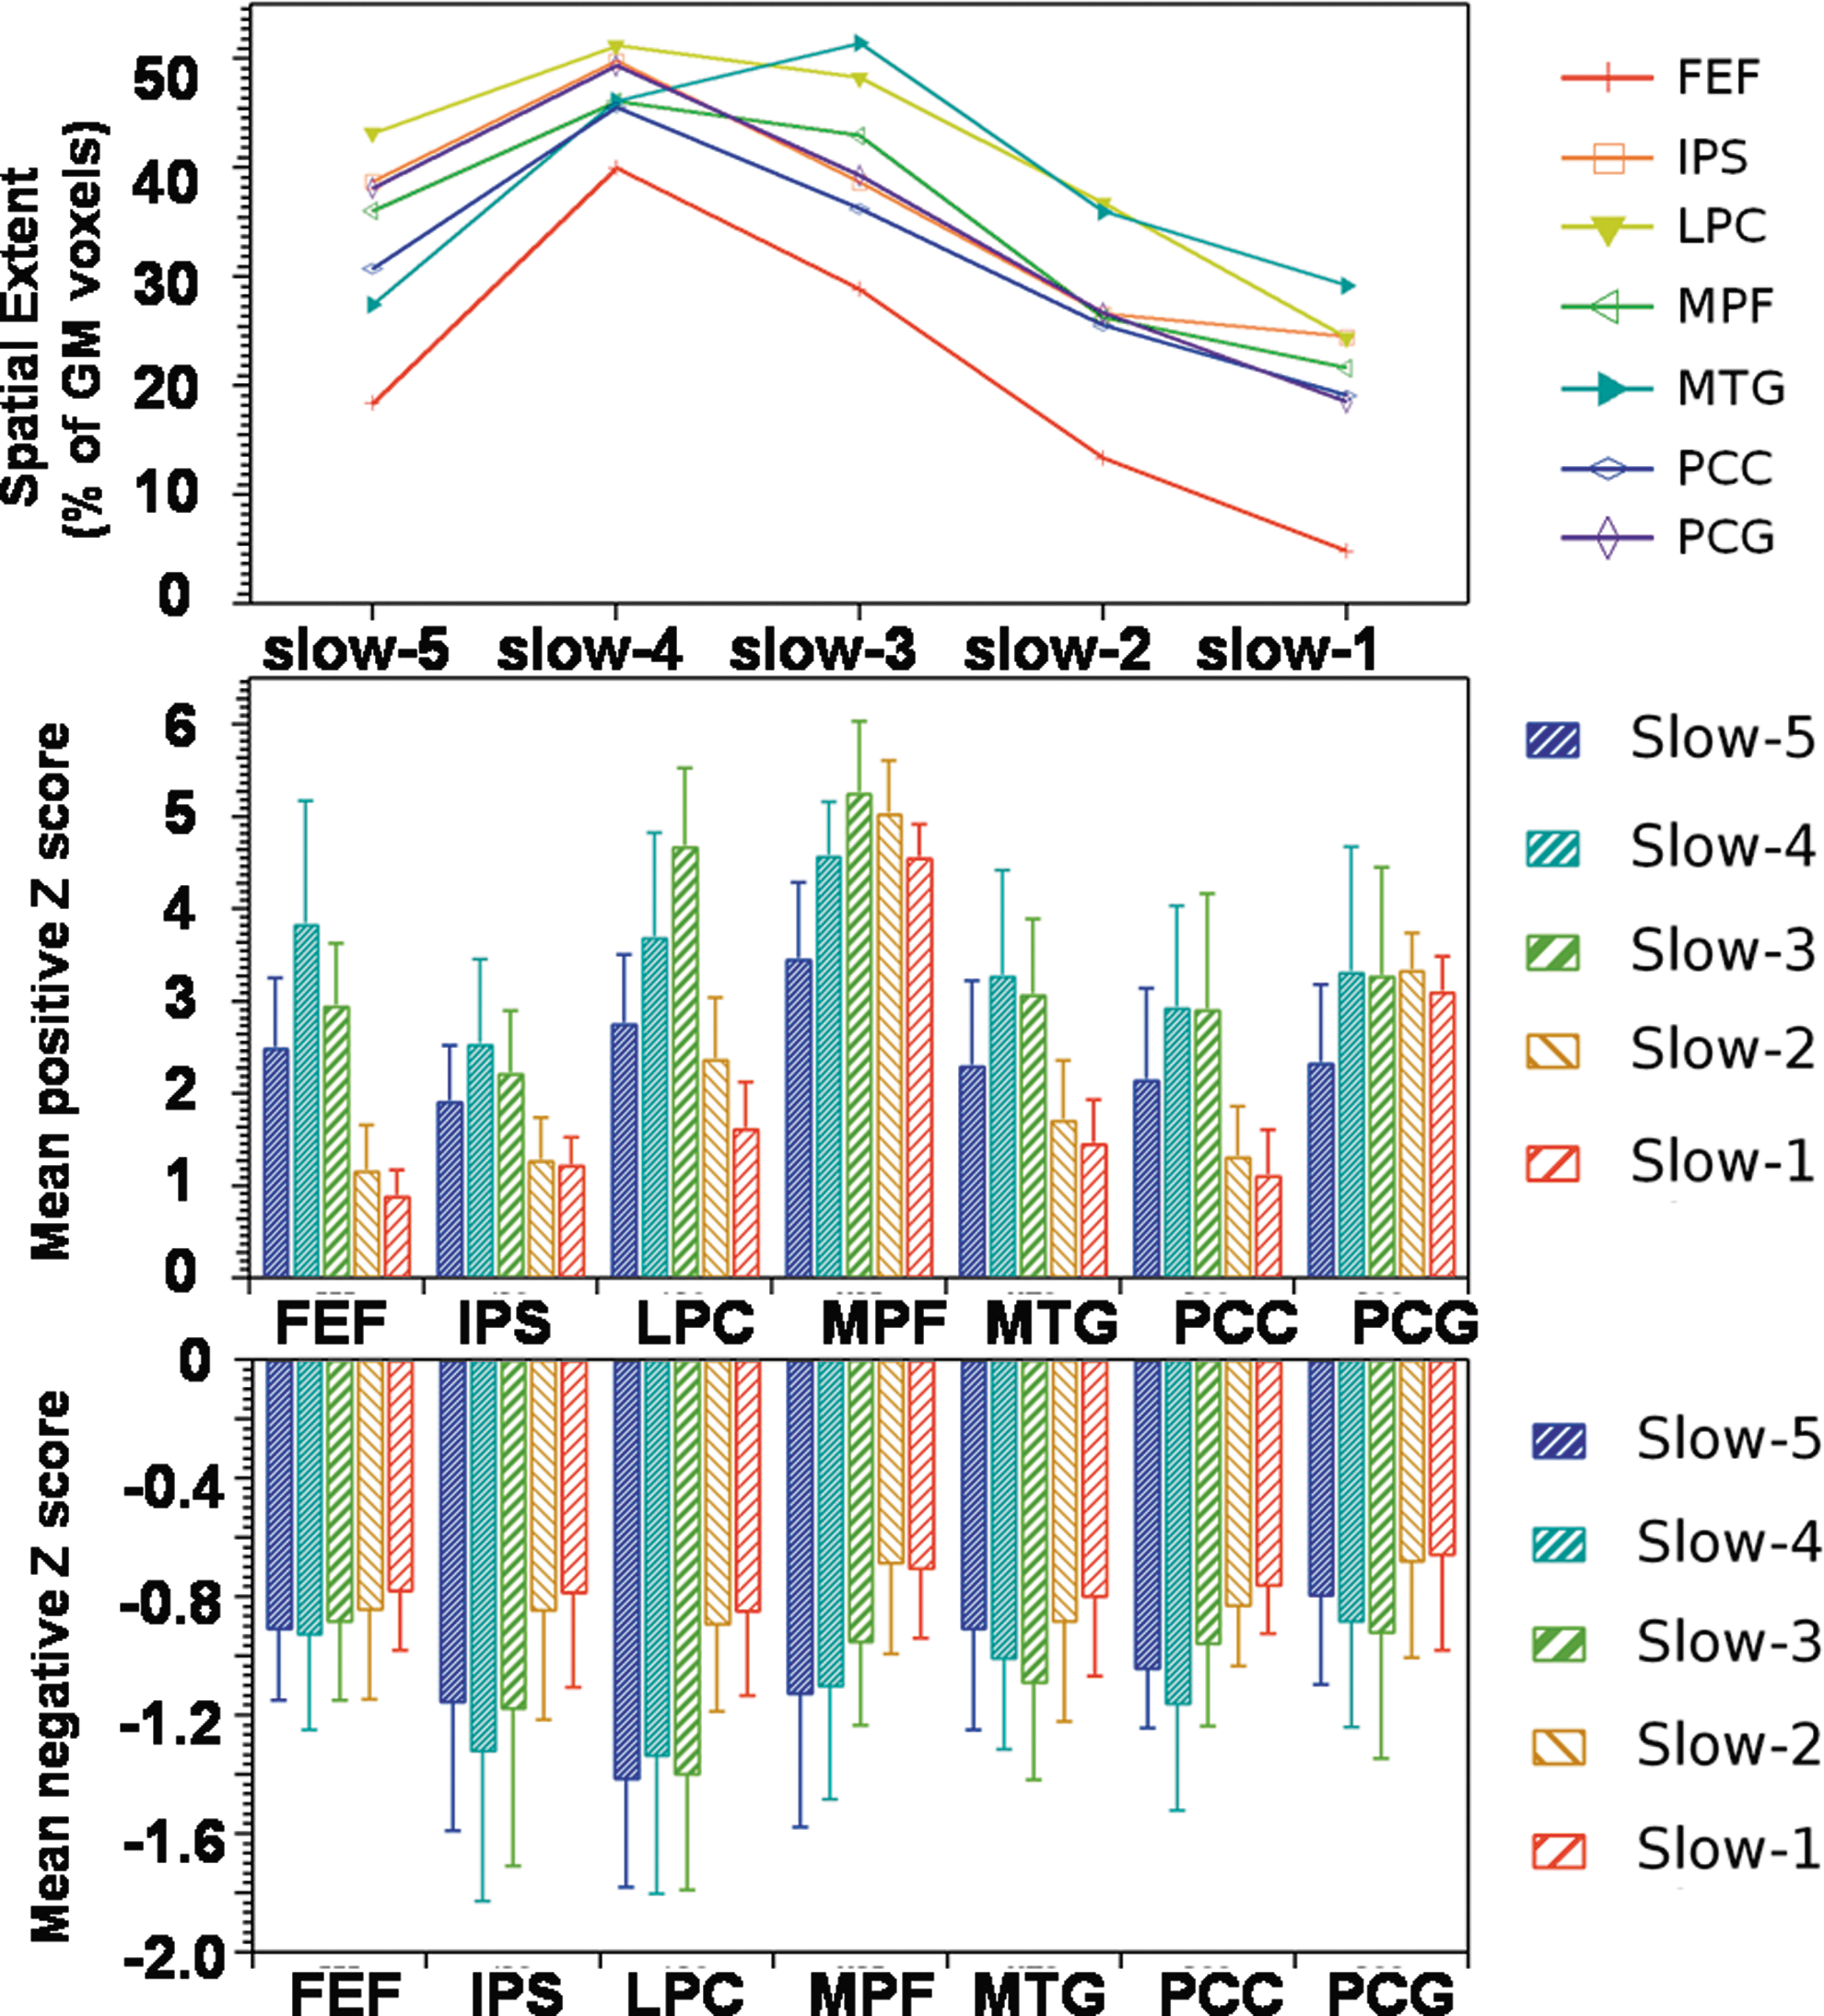
Frequency-specific effects on spatial extent of group-level seed-based correlation maps (top panel), mean positive connectivity strength (middle panel), and mean negative connectivity strength (lower panel) for seven different seed regions, FEF, IPS, LPC, MPF, MTG, PCC, and PCG (one-sample t-test, p<0.05, with FDR correction).
Compared with positive connectivity strength, negative connectivity strength was found to be consistent and weaker across all the frequency bands for each of the seven seed regions. Negative connectivity was found to be stronger in slow-3 frequency bands for PCG, MTG, and LPC, and IPS and PCC displayed stronger connectivity in the slow-4 frequency band. In summary, using ICA and seed-based correlations, although RSNs are largely affected by slow-4 and slow-5 frequency bands, BOLD fluctuations in slow-3, slow-2, and slow-1 frequency bands also contribute significantly to RSFC.
Discussion
In the current study, we used whole-brain resting-state functional MRI data acquired using a short repetition time (645 msec) to investigate functional integration between brain regions during “rest” at multiple frequency bands. Various RSNs that are commonly associated with BOLD signal in slow-5 and slow-4 frequency bands were consistently present at slow-3, slow-2, and slow-1 frequency bands. These slow-3 to slow-1 frequency bands represent higher frequencies (0.073–0.75 Hz) compared with near-standard “low-frequency fluctuations” (0.01–0.073 Hz) represented by slow-4 and slow-5 frequency bands. Although earlier studies have derived the default mode, the fronto-parietal, the sensory motor, and the visual networks using BOLD fluctuation in high-frequency range (>0.1 Hz) (Boubela et al., 2013; Lee et al., 2012; Wu et al., 2008), the current work expands this notion to multiple other RSNs, including the dorsal attention, the salience, and the higher visual networks. Consistent significant connectivity between a seed region and its contra lateral hemispheric ROIs was also observed at all the frequency bands (slow-5 to slow-1). In addition, connectivity within regions from task-positive networks varied considerably across different frequency bands while connectivity between regions from task-positive and task-negative networks was similar across all frequency bands.
Electrophysiological studies have suggested that the human brain operates over a wide range of frequencies, characterized as “slow” bands (<1.5 Hz), EEG bands (1.5–80 Hz), and “fast” bands (80–600 Hz) (Buzsáki and Draguhn, 2004; Penttonen and Buzsáki, 2003). Though EEG and fMRI signals represent different aspects of underlying neuronal activity (e.g., direct vs. indirect measures, respectively), studies have associated multiple RSNs as identified by fMRI with one or more EEG rhythms (Mantini et al., 2007; Meyer et al., 2013; Laufs et al., 2006; Logothetis et al., 2001; Babiloni et al., 2005). In the current study, RSNs were derived based on BOLD fMRI signals temporally filtered in the each of the “slow” frequency bands as defined in electrophysiological studies. Current reports of consistent RSFC between network ROIs at various frequency bands along with the results from previous fMRI and EEG studies imply that RSFC is a multifrequency band phenomenon. The frequency band definitions used in the current study are based on the study by Penttonen and Buzsáki (2003), who argued that different frequency bands in brain oscillations follow a natural logarithmic function. Helps et al. (2008) on the contrary have suggested that these distinct frequency bands might not represent the frequency bands of natural neuronal oscillations. This can imply that BOLD signals when studied in specific frequency bands may represent addition/subtraction effects of individual neuronal fluctuations as opposed to single processes. Earlier studies have shown that multiple neuronal processes can coexist in the same cortical areas and that slower neuronal processes may modulate faster processes (Buzsáki and Draguhn, 2004). Thus, studying BOLD signal in specific frequency bands can relate to studying integration between these individual neuronal processes. Study and interpretation of each individual neuronal processes would require a deeper understanding of underlying neurophysiological mechanisms and better methods to represent these neuronal fluctuations.
The spatial extent of ICA-derived RSNs was found to be highly variable across frequency bands. RSNs, such as the default mode, the visual, and the sensory motor networks, displayed the greatest spatial extent in the slow-4 frequency band (0.027–0.073 Hz), while other RSNs, such as the dorsal attention, the left-right frontal parietal, and the SALs, displayed highest spatial extent in the slow-3 and slow-2 frequency bands. Decrease in spatial extent of the visual and the sensory motor network in slow-3 to slow-1 frequency bands (>0.1 Hz) has been reported in earlier studies (Lee et al., 2012; Wu et al., 2008). In the current work, this property was extended to several other networks. This is the first study to display frequency-specific differences in spatial extent and RSFC strength of different RSNs. These frequency-specific differences in spatial extent can imply the presence of common neuronal oscillations in the regions of the same networks. Earlier electrophysiological studies have shown significant correspondence between a specific RSN and specific EEG rhythms (Helps et al., 2008; Mantini et al., 2007), thus supporting the claim that connectivity within an RSN may be tailored to a specific frequency band. Alternatively, frequency-specific differences in spatial extent with ICA could also be attributed to the nonhomogeneous presence of physiological noise across the brain in the specific frequency bands that are also known to reduce the power of RSFC between brain regions (Birn et al., 2006).
Intranetwork RSFC strength derived based on seed-based correlation analysis for both task-positive and task-negative seed regions was found to be positive across all the frequency bands. Seed regions from task-positive networks are known to be positively correlated with other task-positive brain regions and task-negative seed regions are known to be positively correlated with other task-negative regions in the low-frequency band (0.01–0.1 Hz) (Fox et al., 2005). In the current study, this positive connectivity within task-positive and task-negative networks was observed at each of the frequency bands, though it was highly variable across seed regions and across frequency bands. Consistent positive interhemispheric connectivity between task-positive regions, such as the left/right PCG and visual cortex, in BOLD frequencies higher than LFFs has been reported earlier using the sliding-window approach (Lee et al., 2012). This is in sync with the consistent positive connectivity observed for PCG in the current study for all the frequency bands. In addition, task-positive seed regions (FEF, IPS, and MTG) displayed stronger positive connectivity in the slow-4 frequency band while task-negative seed regions (LPC, MPF, and PCC) displayed stronger connectivity in the slow-3 frequency band. This distinct connectivity pattern for task-positive and task-negative networks may suggest the presence of two distinct neuronal processes represented by these networks. Earlier “resting” EEG studies have observed the presence of a “default-mode-like network” in slow-3 frequency band (Helps et al., 2008), which is consistent with the higher connectivity observed in slow-3 frequency band for task-negative network seed regions in the current study. The same study also reported stronger associations between the EEG power in the slow-3 frequency band and self-reported inattention in ADHD patients compared with controls within the “DMN” network but no differences were observed outside the network. This suggests that the frequency-band-specific differences observed in the current study for task-positive and task-negative networks may reflect underlying cognitive states and need to be studied in detail with neurobehavioral measures.
Task-positive and task-negative networks are known to be anticorrelated (Fox et al., 2005). While in a particular class of cases this strong negative correlation is likely attributed to data processing methodology that involves global signal regression (Saad et al., 2012), other studies have confirmed the presence of anticorrelated networks in human brain (Keller et al., 2013). In the current work, no global signal regression was implemented. As a result, connectivity between task-positive and task-negative networks was found to be weaker compared with connectivity within each network. In addition, less variation in negative connectivity strength was observed across different frequency bands compared with observed variation of positive connectivity strength for all of the seed regions. These results suggest that, unlike within-network functional integration that may be frequency band specific, between-network functional integration may occur over a wider range of frequencies. Earlier studies have shown significant effects of two-choice response task (RT) task versus rest conditions on EEG power both within a “default-mode-like network” (task negative) and outside of a “default-mode-like network” (task positive) (Helps et al., 2009). Specifically, EEG power within DMN channels has been shown to be higher in “rest” compared to “task” conditions in slow-3 and slow-2 frequency bands, while channels outside the DMN displayed the inverse pattern associated with task switching. This implies a coupling between task-positive and task-negative networks associated with the rest/task switching process for goal-directed behavior to be present across multiple frequency bands. In combination with earlier EEG studies, current results of consistent negative correlation observed between task-positive and task-negative network brain regions imply functional integration between networks to be present at wider-frequency band.
In the analyzed data, resting-state BOLD signal was found to have significant power contributions from each of the frequency bands with the exception of the slow-1 frequency band. This is expected because the sampling frequency used in the current study, although higher than tradition fMRI sampling frequency (1.5 Hz compared with 0.5–0.33 Hz in tradition MRI), cannot cover the whole-frequency band of slow-1 fluctuations (0.5–1.5 Hz). In the current study, resting-state BOLD fluctuations from the slow-5 (0.01–0.027 Hz), slow-4 (0.027–0.073 Hz), and slow-3 (0.073–0.198 Hz) frequency bands accounted for a similar amount of power in the BOLD signal across various networks. Although the traditional fMRI bandwidth can measure BOLD fluctuations in slow-3 frequency band, resting-state fMRI studies have temporally filtered BOLD signal in slow-5 and slow-4 frequency bands to avoid the effects of respiratory signal in RSFC analysis and due to higher energy of BOLD signal in this frequency band (Biswal et al., 1995). This respiration signal, known to be present at ∼0.3 Hz (Birn et al., 2006), may overlap with hemodynamic response due to underlying neuronal fluctuations in slow-3/slow-2 frequency bands. This implies that regressing CSF/WM signals out from the data (thought to be highly contaminated by respiration signal) may also reduce the power of the neuronal hemodynamic response in BOLD signal in slow-3/slow-2 frequency bands. In addition, the BOLD signal is known to be an inherently low-frequency signal due to slow hemodynamic response to neuronal firings acting as a low-pass filter. This implies that multifrequency band neuronal oscillations in the brain will be low-pass filtered with higher power in low-frequency bands, and will have decreased power in high-frequency bands. This could explain the limited power contained in slow-2 frequency band (0.198–0.5 Hz). The results from the current study show that the BOLD signal in higher frequency bands, even though not sampled completely (slow-1) and attenuated through hemodynamic response (slow-3, slow-2, and slow-1), is still highly correlated across brain regions. The BOLD signal in higher frequency band displayed RSNs similar to BOLD fluctuations in low-frequency range (slow-5 and slow-4). This implies that these BOLD fluctuations in slow-3, slow-2, and slow-1 frequency bands have a significant presence of neuronal fluctuations, and may provide more information about functional integration in brain.
The noise sources in the BOLD signal are typically thought to comprise of the respiration signal (0.2–0.3 Hz) and the cardiac signal (1 Hz). Using a high temporal sampling rate that results in higher frequency resolution, we have been able to correctly sample the main respiration signal, though the aliasing of the cardiac signal could not be avoided. Earlier studies have used RETROICOR to remove the effects of physiological noises from BOLD fMRI data, which requires explicit recording of the cardiac and respiratory signals (Glover et al., 2000). Due to the lack of physiological measurements for subjects in the current study data, RETROICOR could not be implemented. Other studies have also used the regression of time series from CSF/WM as a means of removing effects of physiological signals from resting-state fMRI data. In a recent study, Chai et al. (2012) used five principal components from CSF/WM time series to regress effects of physiological noises from the data. Here, similar to this method, we have used principal components of CSF/WM time series and derivatives of motion parameters to regress the effects of physiological noises and head motion out from the data. Future studies involving specifically recorded physiological signals would help improve the robustness and reliability of RSFC in multiple frequency bands.
One of the major limitations of the current study is the lack of higher sampling frequency that can cover the whole slow-1 frequency band. It may be possible that with further technical advancement, the sampling rate can be increased; then, one can study the whole “slow” frequency band (up to 1.5 Hz). This may enhance similarities between findings from electrophysiological studies focusing on “fast” neuronal processes and fMRI studies focusing on “slow” neuronal processes. In addition, earlier studies by Hyde et al. (2001) have shown variation in hemodynamic response associated with changes in voxel sizes. While studying presence of neuronal fluctuations at various frequency bands, these changes in hemodynamic response need to be characterized systematically by varying voxel dimensions and sampling frequency. However, in the current study, due to its retrospective nature, such systematic analysis cannot be performed. Further, study by Mazaheri et al. (2006) has shown that T1-weighted images can also be used to characterize brain activity during EPI readout. Future studies should explore such opportunities. In addition, the current study used regression of CSF/WM time series to reduce the effect of physiological noises from BOLD signal. Future studies that use direct measuring of physiological noise sources (respiratory signal and cardiac signal) can improve the reliability and robustness of the results obtained in the current study. It may be possible that by using higher sampling frequency and by greatly reducing the effect of physiological noise sources, one can better define the functional integration between brain regions leading to other RSNs that may reflect neuronal processes of equal or greater importance.
Conclusions
In summary, the current results suggest that functional integration between brain regions measured by BOLD signal correlation occurs at wider frequency bands than examined in previous studies. This functional integration between brain regions of the same network is specific to a frequency band while functional integration between brain regions from different networks is consistently present at multiple frequency bands. This suggests coexistence of two distinct neuronal processes tailored to a specific purpose in each of the networks. Finally, these results suggest significant and highly variable presence of neuronal fluctuations in various BOLD frequency bands that needs to be studied in detail with higher temporal resolution. This may provide further insight in functional integration between various neuronal processes and their roles in cognition.
Footnotes
Acknowledgments
The authors would like to thank Dr. Xin Di and Dr. Paul Taylor for their help in preparing this article. The following research was supported through NIH grant RO1 5R01AG032088 awarded to B.B.B.
Author Disclosure Statement
The authors declare no competing financial interests exist.