
Abstract
In patients with Alzheimer's disease (AD), prominent hypometabolism has been observed in brain regions with minor amyloid load. These hypometabolism-only (HO) areas cannot be explained merely as a consequence of local amyloid toxicity. The aim of this multimodal imaging study was to explore whether such HO phenomenon may be related to pathologies in functionally connected, remote brain regions. Nineteen AD patients and 15 matched controls underwent examinations with [11C]PiB-PET and [18F]FDG-PET. Voxel-based statistical group comparisons were performed to obtain maps of significantly elevated amyloid burden and reduced cerebral glucose metabolism, respectively, in patients. An HO area was identified by subtraction of equally thresholded result maps (hypometabolism minus amyloid burden). To identify the network typically functionally connected to this HO area, it was used as a seed region for a functional connectivity analysis in resting-state functional magnetic resonance imaging data of 17 elderly healthy controls. The resulting intrinsic connectivity network (HO-ICN) was retransferred into the brains of AD patients to be able to analyze pathologies within this network in the positron emission tomography (PET) datasets. The most prominent HO area was detected in the left middle frontal gyrus of AD patients. The HO-ICN in healthy controls showed a major overlap with brain areas significantly affected by both amyloid deposition and hypometabolism in patients. This association was substantiated by the results of region-of-interest-based and voxel-wise correlation analyses, which revealed strong correlations between the degree of hypometabolism within the HO region and within the HO-ICN. These results support the notion that hypometabolism in brain regions not strongly affected by locoregional amyloid pathology may be related to ongoing pathologies in remote but functionally connected regions, that is, by reduced neuronal input from these regions.
Introduction
Alzheimer's disease (AD) is a progressive dementing disorder that is characterized by accumulation of extracellular amyloid plaques and intracellular neurofibrillary tangles as well as neuronal dysfunction and loss of synapses (Braak et al., 1999). According to the amyloid hypothesis, it is assumed that the aggregation of β-amyloid peptides may represent an early event of this disease, causally involved in the pathogenesis of AD by inducing downstream phenomena such as synaptic dysfunction and synaptic loss, finally leading to neuronal cell death and cognitive decline (Hardy and Selkoe, 2002; Selkoe, 2006; Walsh and Selkoe, 2004).
Noninvasive positron emission tomography (PET) imaging enables a visualization of molecular AD-typical pathologies in vivo, such as fibrillary amyloid burden (e.g., using Pittsburgh Compound B ([11C]PiB)) and hypometabolism [using fluorodeoxyglucose ([18F]FDG)], which can be regarded as a measure for neuronal dysfunction (Magistretti and Pellerin, 1999). Many studies in AD patients revealed specific anatomical patterns of increased [11C]PiB amyloid load and reduced [18F]FDG metabolism (Drzezga et al., 2008; Herholz, 1995; Klunk et al., 2004; Minoshima et al., 1997; Silverman et al., 2001), but the number of imaging studies dealing with the topographical relationship and regional overlap of amyloid deposition and hypometabolism is still limited. Recent cross-sectional studies, acquiring [18F]FDG- and [11C]PiB-PET scans in identical samples of AD-patients, showed a high anatomical overlap between the patterns of amyloid deposition and hypometabolism, particularly in the posterior cingulate cortex (PCC) as well as in parietal and temporal cortical areas (Edison et al., 2007; Ng et al., 2007; Shin et al., 2010, 2011). Besides this strong regional overlap, discrepancies between the topographical dispersion of these pathologies were also reported for patients with AD and mild cognitive impairment (MCI), namely brain regions with amyloid deposition showing no major signs of hypometabolism and vice versa (Edison et al., 2007; Li et al., 2008; Ng et al., 2007).
The lack of distinct hypometabolism in brain areas with major amyloid deposition detected in cross-sectional studies could be explained by a temporal delay between the appearance of amyloid deposition and hypometabolism. Our group recently published longitudinal data supporting this hypothesis: In patients with early AD monitored for 2 years, we were able to demonstrate that the progressing anatomical pattern of cerebral hypometabolism continuously assimilates to the initial pattern of amyloid deposition over time (Forster et al., 2012a). Furthermore, baseline amyloid deposition was shown to be positively related to metabolic decline over time in corresponding regions (Forster et al., 2012b). However, these results do not offer an explanation for the inverse discrepancy, that is, hypometabolism in brain areas showing no or minor amyloid burden. An explanation for this phenomenon may be found in effects induced by remote brain pathologies. Regional hypometabolism as a marker of neuronal dysfunction may not only reflect local neurodegenerative pathology but also mirror reduced communication with remote but connected brain areas. In stroke patients, for example, so-called diaschisis effects are well known (i.e., hypometabolism in otherwise unaffected brain regions functionally connected to brain areas involved by the stroke) (Shih et al., 2006; Tatsch et al., 2003). Modern resting-state functional magnetic resonance imaging (rs-fMRI) techniques enable the examination of the human brain's intrinsic functional network structure by measuring correlations of spontaneous low-frequency activity fluctuations in the blood oxygen level-dependent (BOLD) signal (Biswal et al., 1995; Fox and Raichle, 2007; Fox et al., 2005). These rs-fMRI techniques represent an ideal tool to investigate the relationship between the distribution of typical AD pathologies and functional network architecture. A number of recent studies have started addressing these questions and were able to demonstrate a clear overlap between the distribution of typical AD pathologies and the topography of healthy intrinsic connectivity networks (ICN). Particularly, a strong topographical similarity between the distribution of major [11C]PiB-retention as well as [18F]FDG hypometabolism in AD and the topography of the so-called default mode network (DMN), one of the most prominent and consistent ICNs, has been demonstrated (Buckner et al., 2005, 2009). The DMN seems to be associated with processing of internally focused cognitive tasks (Buckner et al., 2008) and includes the following brain regions: PCC, precuneus, hippocampal, inferior parietal, and medial prefrontal cortices (Gusnard et al., 2001; Raichle et al., 2001). In addition to the DMN, AD pathologies also affect areas of other fronto-parietal networks (Lehmann et al., 2013a, 2013b). Apart from the topographical overlap between AD typical pathologies and healthy ICNs, disruption of functional connectivity within these networks themselves has also been demonstrated in AD- and MCI patients (Fleisher et al., 2009; Greicius et al., 2004; Sorg et al., 2007). Furthermore, recent studies already demonstrated interrelations between amyloid deposition, hypometabolism, and disrupted functional connectivity in elderly nondemented PiB-positive subjects as well as in MCI patients (Drzezga et al., 2011; Hedden et al., 2009; Sheline et al., 2010; Sperling et al., 2009). Together, these findings indicate an interrelation between the different molecular pathologies and functional networks and suggest that AD may represent, at least in part, a disconnection syndrome. These insights are forming the basis of the “network degeneration hypothesis,” suggesting that AD as well as other neurodegenerative diseases expands along ICNs (Seeley et al., 2009; Zhou et al., 2012).
All of the mentioned studies mainly focused on the overlap between AD typical pathologies and the anatomy of ICNs, respectively changes thereof. However, the interrelation between molecular pathologies in one area and changes in another functionally connected area within one network has not yet been extensively examined.
Thus, we speculate that distinct hypometabolism in brain areas with minor local amyloid load could be explained by pathologies in remote but functionally connected brain regions. In a region struck by AD pathology, amyloid toxicity may lead to local synaptic dysfunction, resulting in reduced regional neuronal activity and/or disruption of connectivity. This may contribute to reduced neuronal input into remote but functionally connected brain areas, mirrored in hypometabolism there, even if these connected regions are free of primary AD pathology.
A pictorial summary of the proposed model explaining the development of hypometabolism in brain areas less affected by amyloid pathology is illustrated in Figure 1.
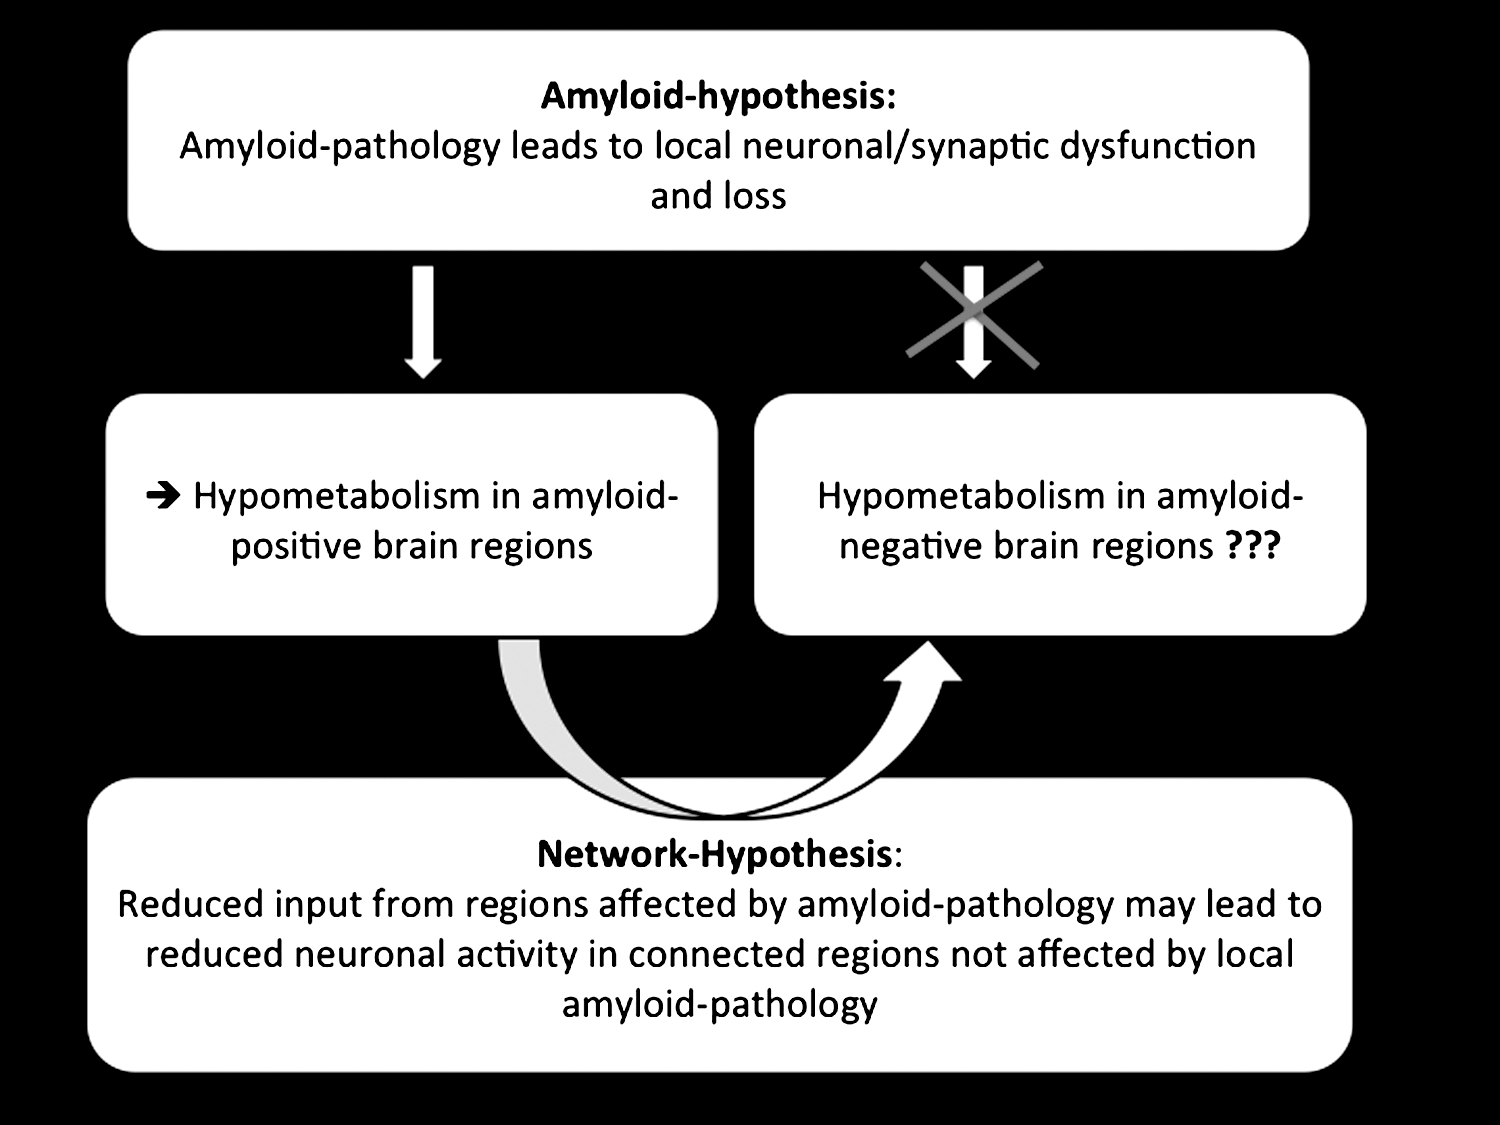
Summary of the proposed model explaining the development of hypometabolism in brain areas less affected by amyloid pathology. According to the amyloid hypothesis, amyloid deposition can cause local synaptic dysfunction as well as a synaptic loss. Reduced neuronal activity or neuronal dysfunction can be measured as hypometabolism by means of FDG-positron emission tomography (PET). Besides local pathologies, also a reduced communication with remote brain areas, affected by amyloid pathology, may lead to a reduced neuronal activity and neuronal dysfunction. A reduced neuronal input from brain areas affected by amyloid pathology may lead to reduced neuronal activity in functionally connected brain areas that are not affected by local amyloid pathology.
In the present study, we tried to collect evidence for this hypothetical model, applying a multimodal imaging approach. We used [18F]FDG- and [11C]PiB-PET for measurement of neuronal dysfunction and amyloid burden in a sample of AD patients. To investigate these abnormalities in the context of the brain's functional network architecture, we used an rs-fMRI dataset of healthy subjects for ICN calculation.
Materials and Methods
Summary of the study design
In a first step, the patterns of hypometabolism and [11C]PiB uptake of AD patients [compared with healthy controls 1 (HC1)] were matched and subtracted to identify the regional overlap as well as discrepancies of these pathologies. Afterward, a region showing distinct hypometabolism without major amyloid pathology [hypometabolism-only (HO) area] was used as seed region for a region-of-interest (ROI)-based functional connectivity analysis in an rs-fMRI dataset of elderly healthy controls 2 (HC2). To analyse the Alzheimer-specific pathologies within this connectivity network, the anatomical overlap between network and PET abnormalities was examined. Furthermore, ROI-based and voxel-wise correlations were calculated between metabolism in the HO seed ([18F]FDG-SUVRs) and in the depending connectivity network or in brain areas outside the ICN. To crosscheck out hypothesis, we repeated the described analytic steps using an ICN seeded by a brain area without any measurable AD pathologies (i.e., no major amyloid uptake and normal metabolism).
A schematic overview of the study design is illustrated in Figure 2.
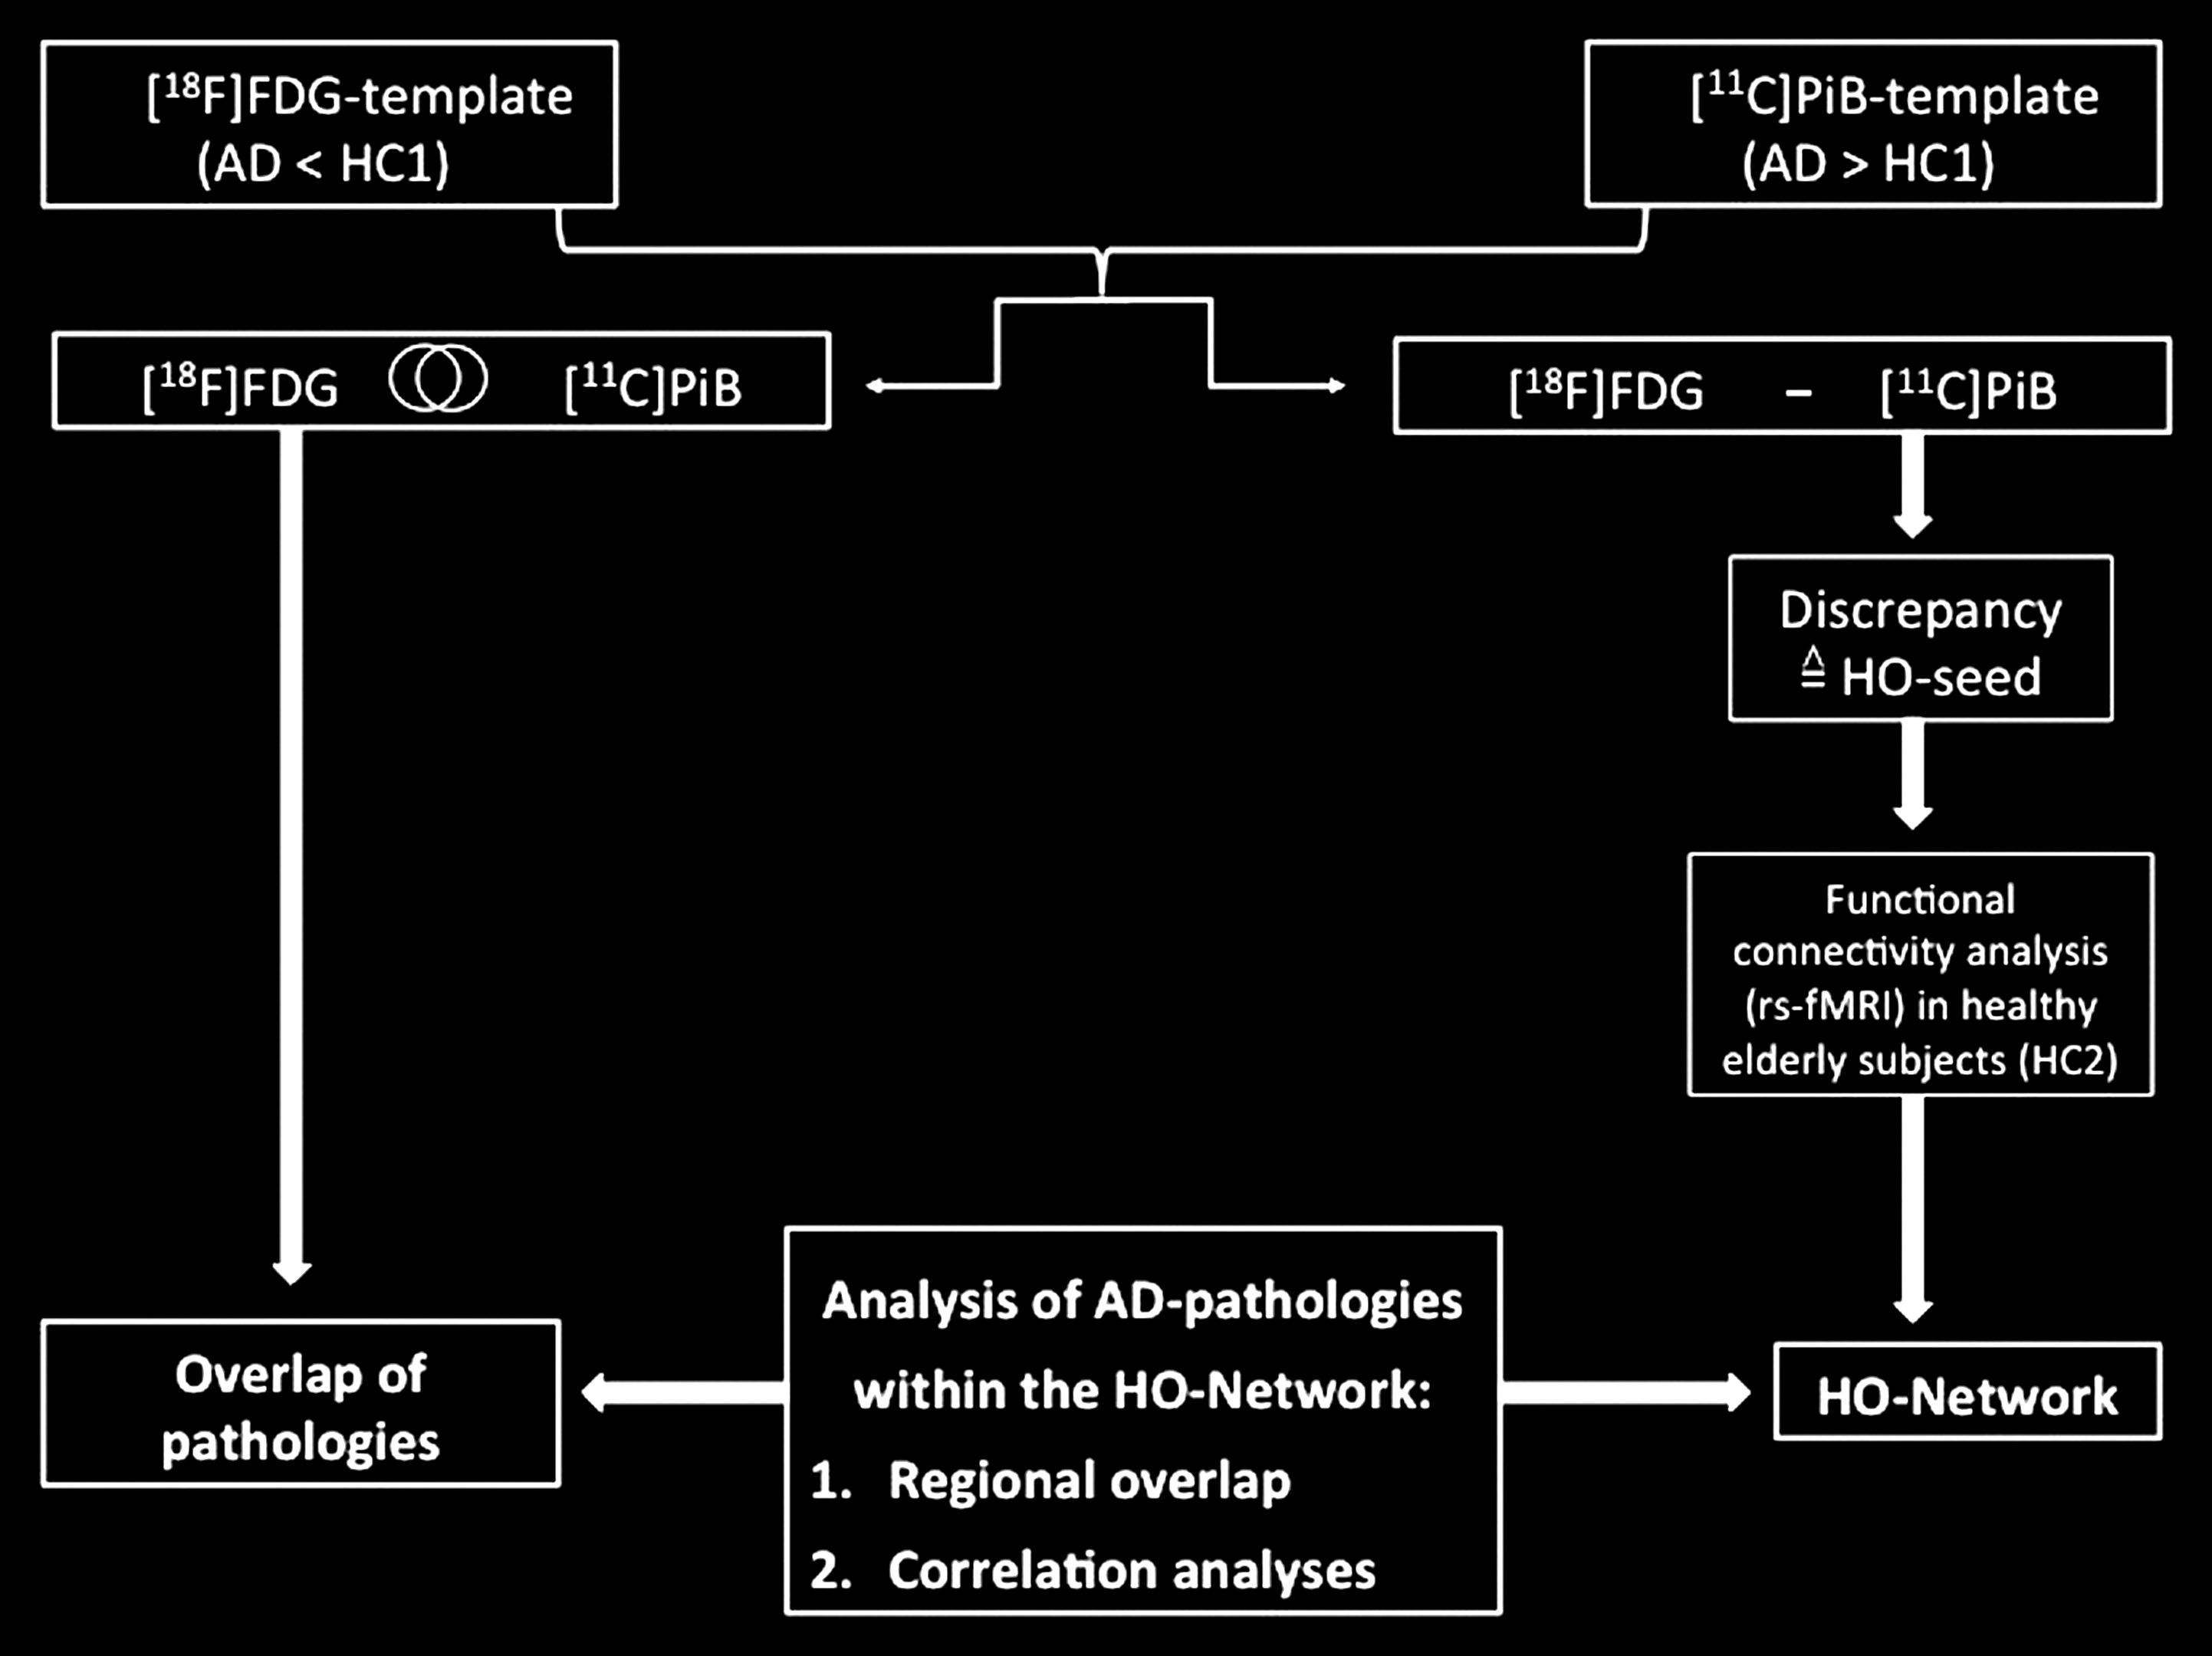
Study design schematic. (1) Patterns of hypometabolism and [11C]PiB uptake of Alzheimer's disease (AD) patients [compared with healthy controls 1 (HC1)] were matched and subtracted to identify the regional overlap and discrepancies of these pathologies. (2) A region showing distinct hypometabolism without major amyloid pathology [hypometabolism-only (HO) area] was used as a seed region for a region-of-interest (ROI)-based functional connectivity analysis in a resting-state functional magnetic resonance imaging (rs-fMRI) dataset of elderly healthy controls 2 (HC2). (3) The anatomical overlap between the HO network and the PET abnormalities was examined. (4) Correlations (ROI-based and voxel-wise) were calculated between metabolism in the HO seed ([18F]FDG-SUVRs) and in the depending HO network or in the entire brain. (5) To cross-check our hypothesis, we repeated the analytic steps 2–4 using an intrinsic connectivity network (ICN) seed based on a brain area without any AD pathologies (i.e., no major amyloid uptake and normal metabolism).
Participants
Nineteen right-handed AD patients (11 male/8 female/mean age: 67.21±7.96) were recruited from the outpatient unit for cognitive disorders [Department of Psychiatry, Technical University of Munich (TUM), Germany]. The patients had to fulfil the National Institute of Neurological and Communicative Disorders and Stroke-Alzheimer's Disease and Related Disorders Association (NINCDS-ADRDA) (McKhann et al., 1984) diagnostic criteria for probable mild to moderate AD, including memory loss and impairment in at least one further cognitive domain, for example, language or executive function. As a part of their dementia workup, patients underwent examinations with structural T1-weighted MRI, [18F]FDG-, and [11C]PiB-PET, received an assessment of Apolipoprotein E (APOE) genotype and a standard battery of neuropsychological tests, including an assessment of global cognitive impairment with the Consortium to Establish a Registry for AD–Neuropsychological Assessment Battery (CERAD) (Morris et al., 1988) and global functional impairment with the Clinical Dementia Rating (CDR) scale (Morris, 1993). In addition, 15 age-matched right-handed cognitively normal elderly subjects, recruited by advertisements and acting as the PET control group, underwent an identical imaging and neuropsychological test procedure (HC1; 5 male/10 female/mean age: 64.60±5.77).
For identification of specific healthy functional ICNs, we employed the dataset of a pre-existing population of 17 right-handed elderly cognitively normal subjects (HC2; 7 male/10 female/mean age: 65.05±5.62), who had undergone examinations with structural and rs-fMRI. This group received the same described battery of neuropsychological tests and an APOE genotype assessment.
AD patients and control subjects were not included in this study if they met the previously described exclusion criteria (Drzezga et al., 2008). Standard antidementive medication with acetylcholine-esterase (AchE) inhibitors was not regarded as an exclusion criterion. AchE-inhibitor therapy is not expected to have a relevant immediate effect on the pattern of amyloid deposition; with regard to cerebral glucose metabolism; it has been demonstrated that AchE-inhibitor therapy may slow down longitudinal metabolic decrease in AD but it does not contribute to major changes in the metabolic pattern (Keller et al., 2011). For this reason, we did not interrupt the medication but, to ensure a steady-state situation, we did not include patients who were treated for less than 3 months.
The study protocol was approved by the ethics committee of TUM and the German radiation protection authorities. All participants provided written informed consent regarding their participation and the scientific evaluation of their data. A summary of relevant demographic and neuropsychological data is given in Table 1.
Subjects' Characteristics
Data are given as mean±standard deviation. p-Values are results from t-tests, otherwise noted.
AD, Alzheimer's disease; APOE, Apolipoprotein E; APOE ɛ4 (+/−), carrier/noncarrier of the APO-E ɛ4-allele; CDR, Clinical Dementia Rating; fMRI, functional magnetic resonance imaging; MMSE, mini mental state examination; n, number of subjects; PET, positron emission tomography.
PET data acquisition and analysis
Structural MRI examination for all AD patients and control subjects (HC1) was performed on a Siemens 1.5 Tesla Magnetom Symphony scanner (Siemens AG, Erlangen, Germany); all PET examinations were performed on the same Siemens ECAT HR+ scanner (CTI, Knoxville, TN) in 3D mode, using established and previously published tracer-specific acquisition protocols (Drzezga et al., 2008; Forster et al., 2012a). The first step of the PET data evaluation consisted of a visual inspection of all individually reconstructed [11C]PiB and [18F]FDG images, followed by basic image processing and voxel-based statistical group analyses, using statistical parametric mapping software (SPM5; Wellcome Department of Cognitive Neurology, London, United Kingdom) in MATLAB (version 7.5), as well as an ROI-based approach using the Marsbar toolbox (
Voxel-based analysis
The structural MRI datasets were spatially normalized to the standard SPM MRI T1 template in Montreal Neurological Institute (MNI) space using default transformation parameters. [11C]PiB and [18F]FDG images were first co-registered to each individual volumetric MRI and then spatially normalized to the T1 MRI MNI template (using warping parameters derived from the individual MRI normalization) (Drzezga et al., 2008; Forster et al., 2012a; Grimmer et al., 2009; Ziolko et al., 2006). Normalized images were represented on a 79×95×69 matrix with 2×2×2 mm voxel size and smoothed with an isotropic Gaussian full-width-at-half-maximal kernel of 12 mm. Voxel-wise whole-brain group comparisons (AD patients vs. HC1) were calculated in the neurobiologically expected directions with a consistent probability threshold of p<0.01, a false discovery rate (FDR) corrected for multiple comparisons, and a threshold for minimum spatial extent of 20 contiguous voxels throughout all PET analyses.
ROI-based analysis
For a semi-quantitative approximation of the global amyloid burden as well as hypometabolism, [18F]FDG- and [11C]PiB-uptake values were obtained in a previously used large bi-hemispheric ROI, consisting of frontal, temporal, parietal, and retrosplenial cortical areas [frontal-lateral-retrosplenial-ROI (FLR-ROI)] with known vulnerability for AD pathologies (Drzezga et al., 2011; Forster et al., 2012b; Hedden et al., 2009). Standardized uptake value ratios (SUVRs) were calculated using the cerebellum as reference tissue. The [18F]FDG- and [11C]PiB-SUVRs were compared between AD patients and HC1 using independent sample t-tests; p-values<0.05 were considered statistically significant (Forster et al., 2012b).
Partial volume effect (PVE) correction
To control the PET data for a potential influence of regional cortical atrophy, a correction for partial volume effects (PVE) of both [18F]FDG- and [11C]PiB-PET data was performed, applying a previously described algorithm in the PMOD software package (PMOD Technologies Ltd., Adliswil, Switzerland) (Drzezga et al., 2008). Voxel-based as well as ROI-based analyses were calculated with both PVE-corrected and noncorrected PET data.
Identification of seed regions for ICN analyses
To compare the patterns of cerebral hypometabolism and amyloid deposition, equally thresholded and stereotactically normalized statistical T-maps from the group comparisons of [18F]FDG- and [11C]PiB-PET data were overlaid. For identification of regions showing hypometabolism without major amyloid-deposition (HO), the [11C]PIB pattern was subtracted from the [18F]FDG pattern, using MRIcron (
Furthermore, for a countercheck-analysis, brain areas without major amyloid deposition and without significant hypometabolism in AD patients were identified by subtracting the pattern of elevated amyloid uptake from the pattern of brain regions showing preserved metabolism. On the basis of the map resulting from this analysis, an “AD-pathology-free” ROI was designed as described earlier and also used as a seed region for rs-fMRI analyses.
rs-fMRI data acquisition and analysis
For the analysis of functional connectivity networks, MRI was performed on a 3 T whole-body MR scanner (Achieva, Philips, Netherland), using an eight-channel phased-array head coil in a pre-existing group of healthy control subjects (HC2). As previously described (Sorg et al., 2013), all participants underwent 5 min of structural MRI and 10 min of rs-fMRI. For co-registration and volumetric analysis, T1-weighted anatomical data were obtained from each subject by using a magnetization-prepared rapid acquisition gradient echo sequence (echo time [TE]=4 msec, repetition time [TR]=9 msec, inversion time [TI]=100 msec, flip angle=5°, field of view [FoV]=240×240 mm2, matrix=240×240, 170 slices, voxel size=1×1×1 mm). fMRI data were collected using a gradient echo EPI sequence (TE=35 ms, TR=2000 ms, flip angle=82°, FoV=220×220 mm2, matrix=80×80, 32 slices, slice thickness=4, and 0 mm interslice gap); 10 min of scanning result in 300 volumes for the resting state.
SPM5 was used for motion correction, spatial normalization into the stereotactic MNI space, and spatial smoothing with an 8×8×8 mm Gaussian kernel. The first three functional scans of each fMRI session were discarded due to magnetization effects for each participant.
For ROI-based functional connectivity analysis, the BOLD signal time courses of all voxels within the ROI were extracted, Butterworth bandpass filtered for frequencies ranging from 0.009 to 0.08 Hz, and reduced to an ROI-representative time course by singular value decomposition. This time course was put into a first-level fixed-effects general linear model, and a voxel-wise multiple regression was performed to calculate a correlation map between the BOLD time course from the ROI and the time course from all other voxels within the brain for each subject using SPM5. Regressors for global gray matter, white matter, and cerebrospinal fluid signal for each subject, calculated by segmentation based on structural MRI, were included as covariates of no interest in each model (Fox et al., 2005; Hedden et al., 2009). Group analyses were performed with SPM5 using the same thresholds as for PET-data analyses (p<0.01, FDR-corrected, threshold for minimum spatial extent of 20 contiguous voxels) to identify brain areas showing a significant intrinsic functional connectivity with the HO seed or the “AD-pathology-free” seed across this healthy population.
Cross-modality analyses
To enable cross-modal analyses between different pathologies within the underlying functional networks, the HO-ICN as well as the “AD-pathology-free” ICN as defined in HC2 was retransferred into the AD-patient group and overlaid with the topographical patterns of the AD-characteristic PET abnormalities. To quantify these results, a percentage of overlap was calculated via the formula: #voxels of PET abnormalities within the network divided by #voxels of PET abnormalities.
To examine quantitative inter-relations between pathologies within the HO area and typically connected regions, we performed ROI-based and voxel-wise correlation analyses. In the ROI-based approach, correlations were calculated between mean cerebral [18F]FDG-SUVR measured within the HO seed (in patients) and within the HO-ICN (as transferred into the patient group). This correlation analysis was repeated for mean SUVR values extracted from the HO and from brain areas outside of the HO-ICN in patients, which were identified by subtracting the HO-ICN from an anatomical automatic labeling–whole-brain cortical surface template created with the WFU_pickatlas (Maldjian et al., 2003, 2004). To avoid auto-correlation, an area with a radius of 20 mm around the HO seed was subtracted from the templates. Pearson correlation coefficients and comparisons between them were regarded significant at a threshold of p<0.05.
Besides ROI-based correlation analyses, voxel-wise correlations also across patients were calculated by means of the “multiple regression analysis” design in SPM5. Using the mean metabolism ([18F]FDG-SUVR) within the HO seed as covariate, correlations with the metabolism in the entire brain across all patients were identified without any a-priori hypothesis. The results of this analysis are suggested to reflect “metabolic connectivity,” that is, the regions in which metabolism is up- or downregulated in synchrony to the seed region across subjects. According to previous studies (Morbelli et al., 2012; Oishi et al., 2005), a statistical threshold of p<0.001 and an extent threshold of 20 contiguous voxels were allowed for this analysis. The resulting correlation map was overlaid and visually compared with the ICN as well as with the pattern of the AD-specific PET abnormalities.
Results
Demographic characteristics and cognitive parameters
There were no significant demographic differences with regard to age, distribution of gender, and APOE genotype between AD patients and HC1, participating in the PET studies. Mini mental state examination (MMSE) scores were significantly lower and CDR scores were significantly higher in patients compared with HC1 (p<0.05). Healthy control subjects selected for the rs-fMRI study (HC2) also showed significantly different MMSE- and CDR-scores as well as no differences with regard to age, APOE genotype, and gender distribution in comparison with the AD patients (p<0.05, Table 1).
[11C]PiB and [18F]FDG PET analyses: voxel-based group comparisons, overlap, and discrepancies
Since no relevant differences between PVE-corrected and noncorrected PET data concerning the regional distribution patterns of hypometabolism and [11C]PiB-uptake were found (Supplementary Figs. S1 and S2; Supplementary Data are available online at
A strong regional overlap between the patterns of amyloid deposition and hypometabolism in AD was found especially in temporoparietal cortices, PCC, and precuneus, with both abnormalities exhibiting a slightly asymmetric extension, dominantly affecting the left hemisphere in this population (Fig. 3).
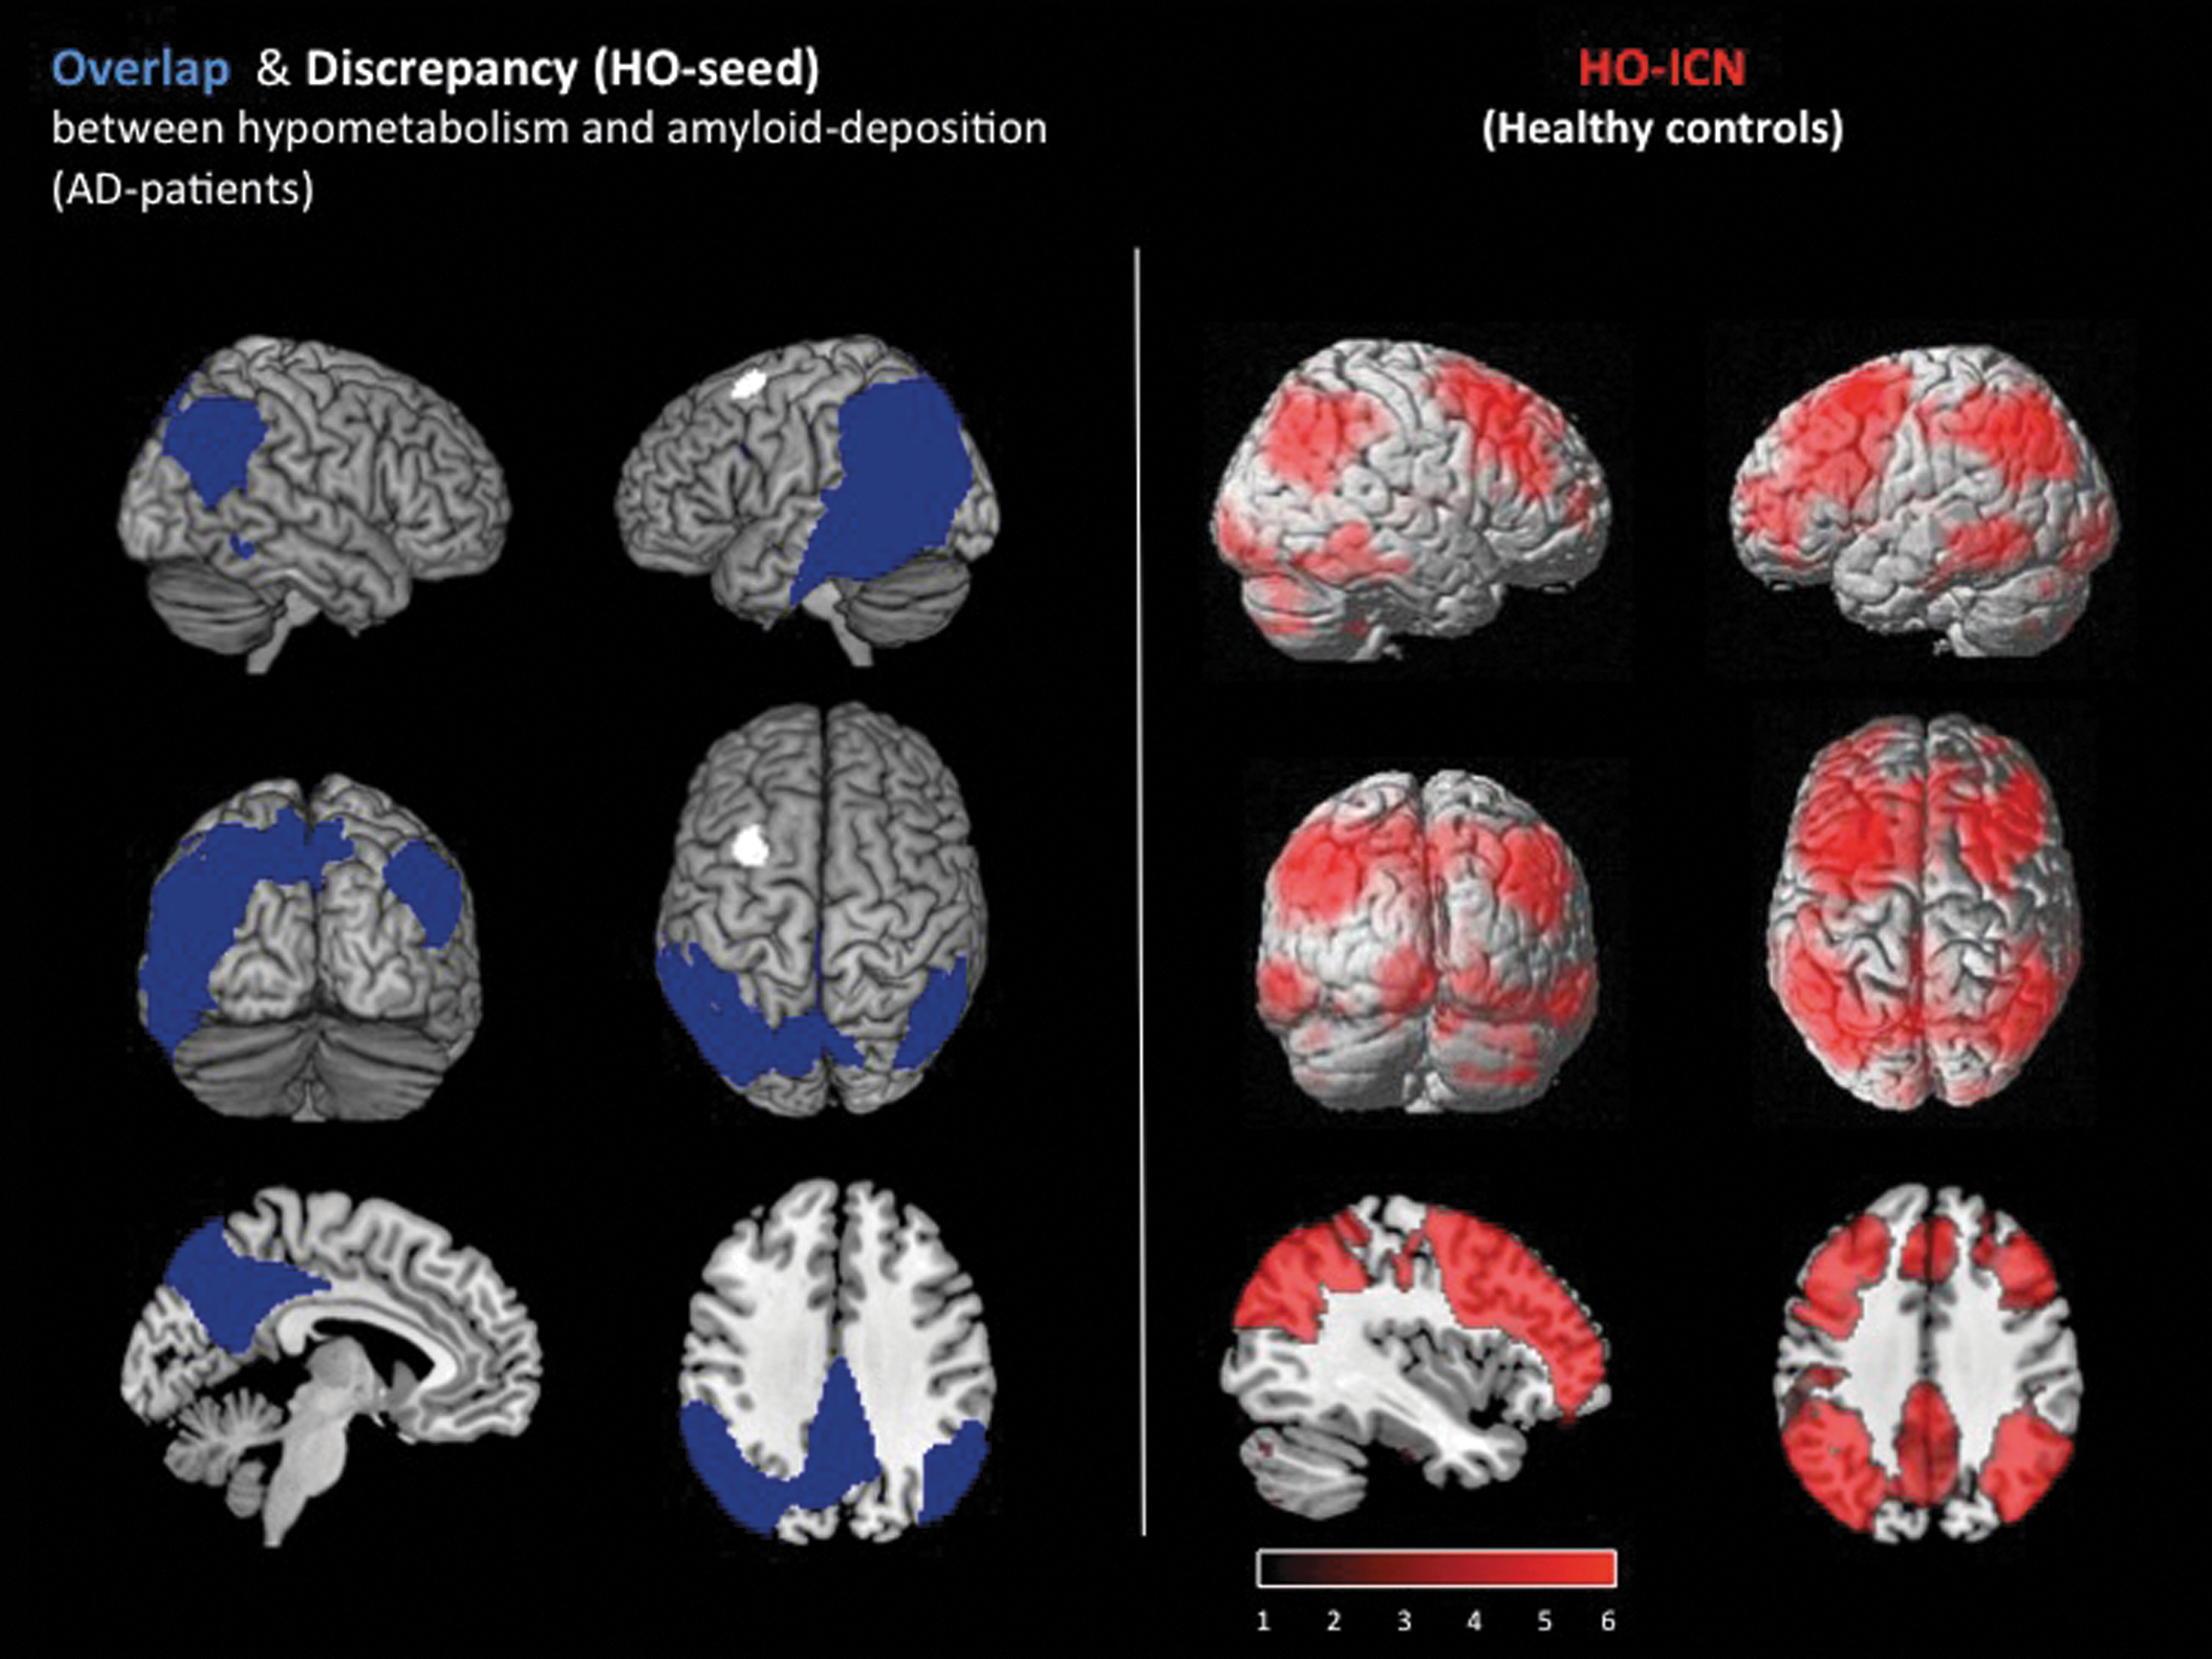
Left: Overlap (blue) and discrepancy (=HO-seed; white) between amyloid deposition and hypometabolism in 19 AD patients compared with 15 elderly healthy control subjects; p<0.01, false discovery rate (FDR) corrected. Results are displayed on a standard MRI template. The most prominent discrepancy between amyloid and hypometabolism (white cluster) was used as the seed for ROI-based functional connectivity analysis (HO-seed). Right: ICN (red) of the HO seed; measured in an rs-fMRI dataset of 17 elderly healthy subjects. Significance threshold p<0.01 FDR corrected. Results are displayed on a standard MRI template.
The most prominent hypometabolic brain region without co-localized [11C]PiB-uptake increases was identified in the left middle frontal gyrus (MNI-coordinates: −30 12 62; Fig. 3), and used as a seed region for an ROI-based functional connectivity analysis. In addition, an “AD-pathology-free” area showing unaffected metabolism and no major [11C]PiB-uptake increases was located neighboring the HO seed in the left superior frontal gyrus (MNI-coordinates: −14 −12 60) and used as a control seed region for rs-fMRI analysis.
Functional connectivity analyses
To identify the underlying functional connectivity network, the HO-ROI was used as a seed region for a whole-brain functional connectivity analysis in an rs-fMRI dataset from HC2 subjects. Brain areas in which the BOLD-signal time course was strongly positive correlated with the BOLD-signal time course of the HO seed were found to be predominantly located in precuneus, frontal, parietal, and temporal cortices of both hemispheres. Less significant correlations were found in occipital, cerebellar, and thalamic areas (Fig. 3).
The additionally calculated ICN of the “AD-pathology-free” control seed is mainly located in frontal and parietal cortices bilaterally, as well as in left precuneus, right temporal cortex, and bilateral cerebellar areas (Supplementary Fig. S4).
Multimodal imaging
Anatomical overlap of ICN, hypometabolism, and amyloid deposition in AD
After superimposing the HO-ICN with the regional patterns of amyloid pathology and hypometabolism in AD patients, an anatomical overlap was found, including the following brain areas: Precuneus and PCC bilaterally as well as lateral temporal and parietal cortices with a larger extension over the left hemisphere (Fig. 4; PVE-corrected data: Supplementary Fig. S3). The percentage of overlap, calculated via the formula: #voxels of PET–abnormalities within the network divided by #voxels of PET abnormalities, revealed 65% (PVE-corrected data: 78%).
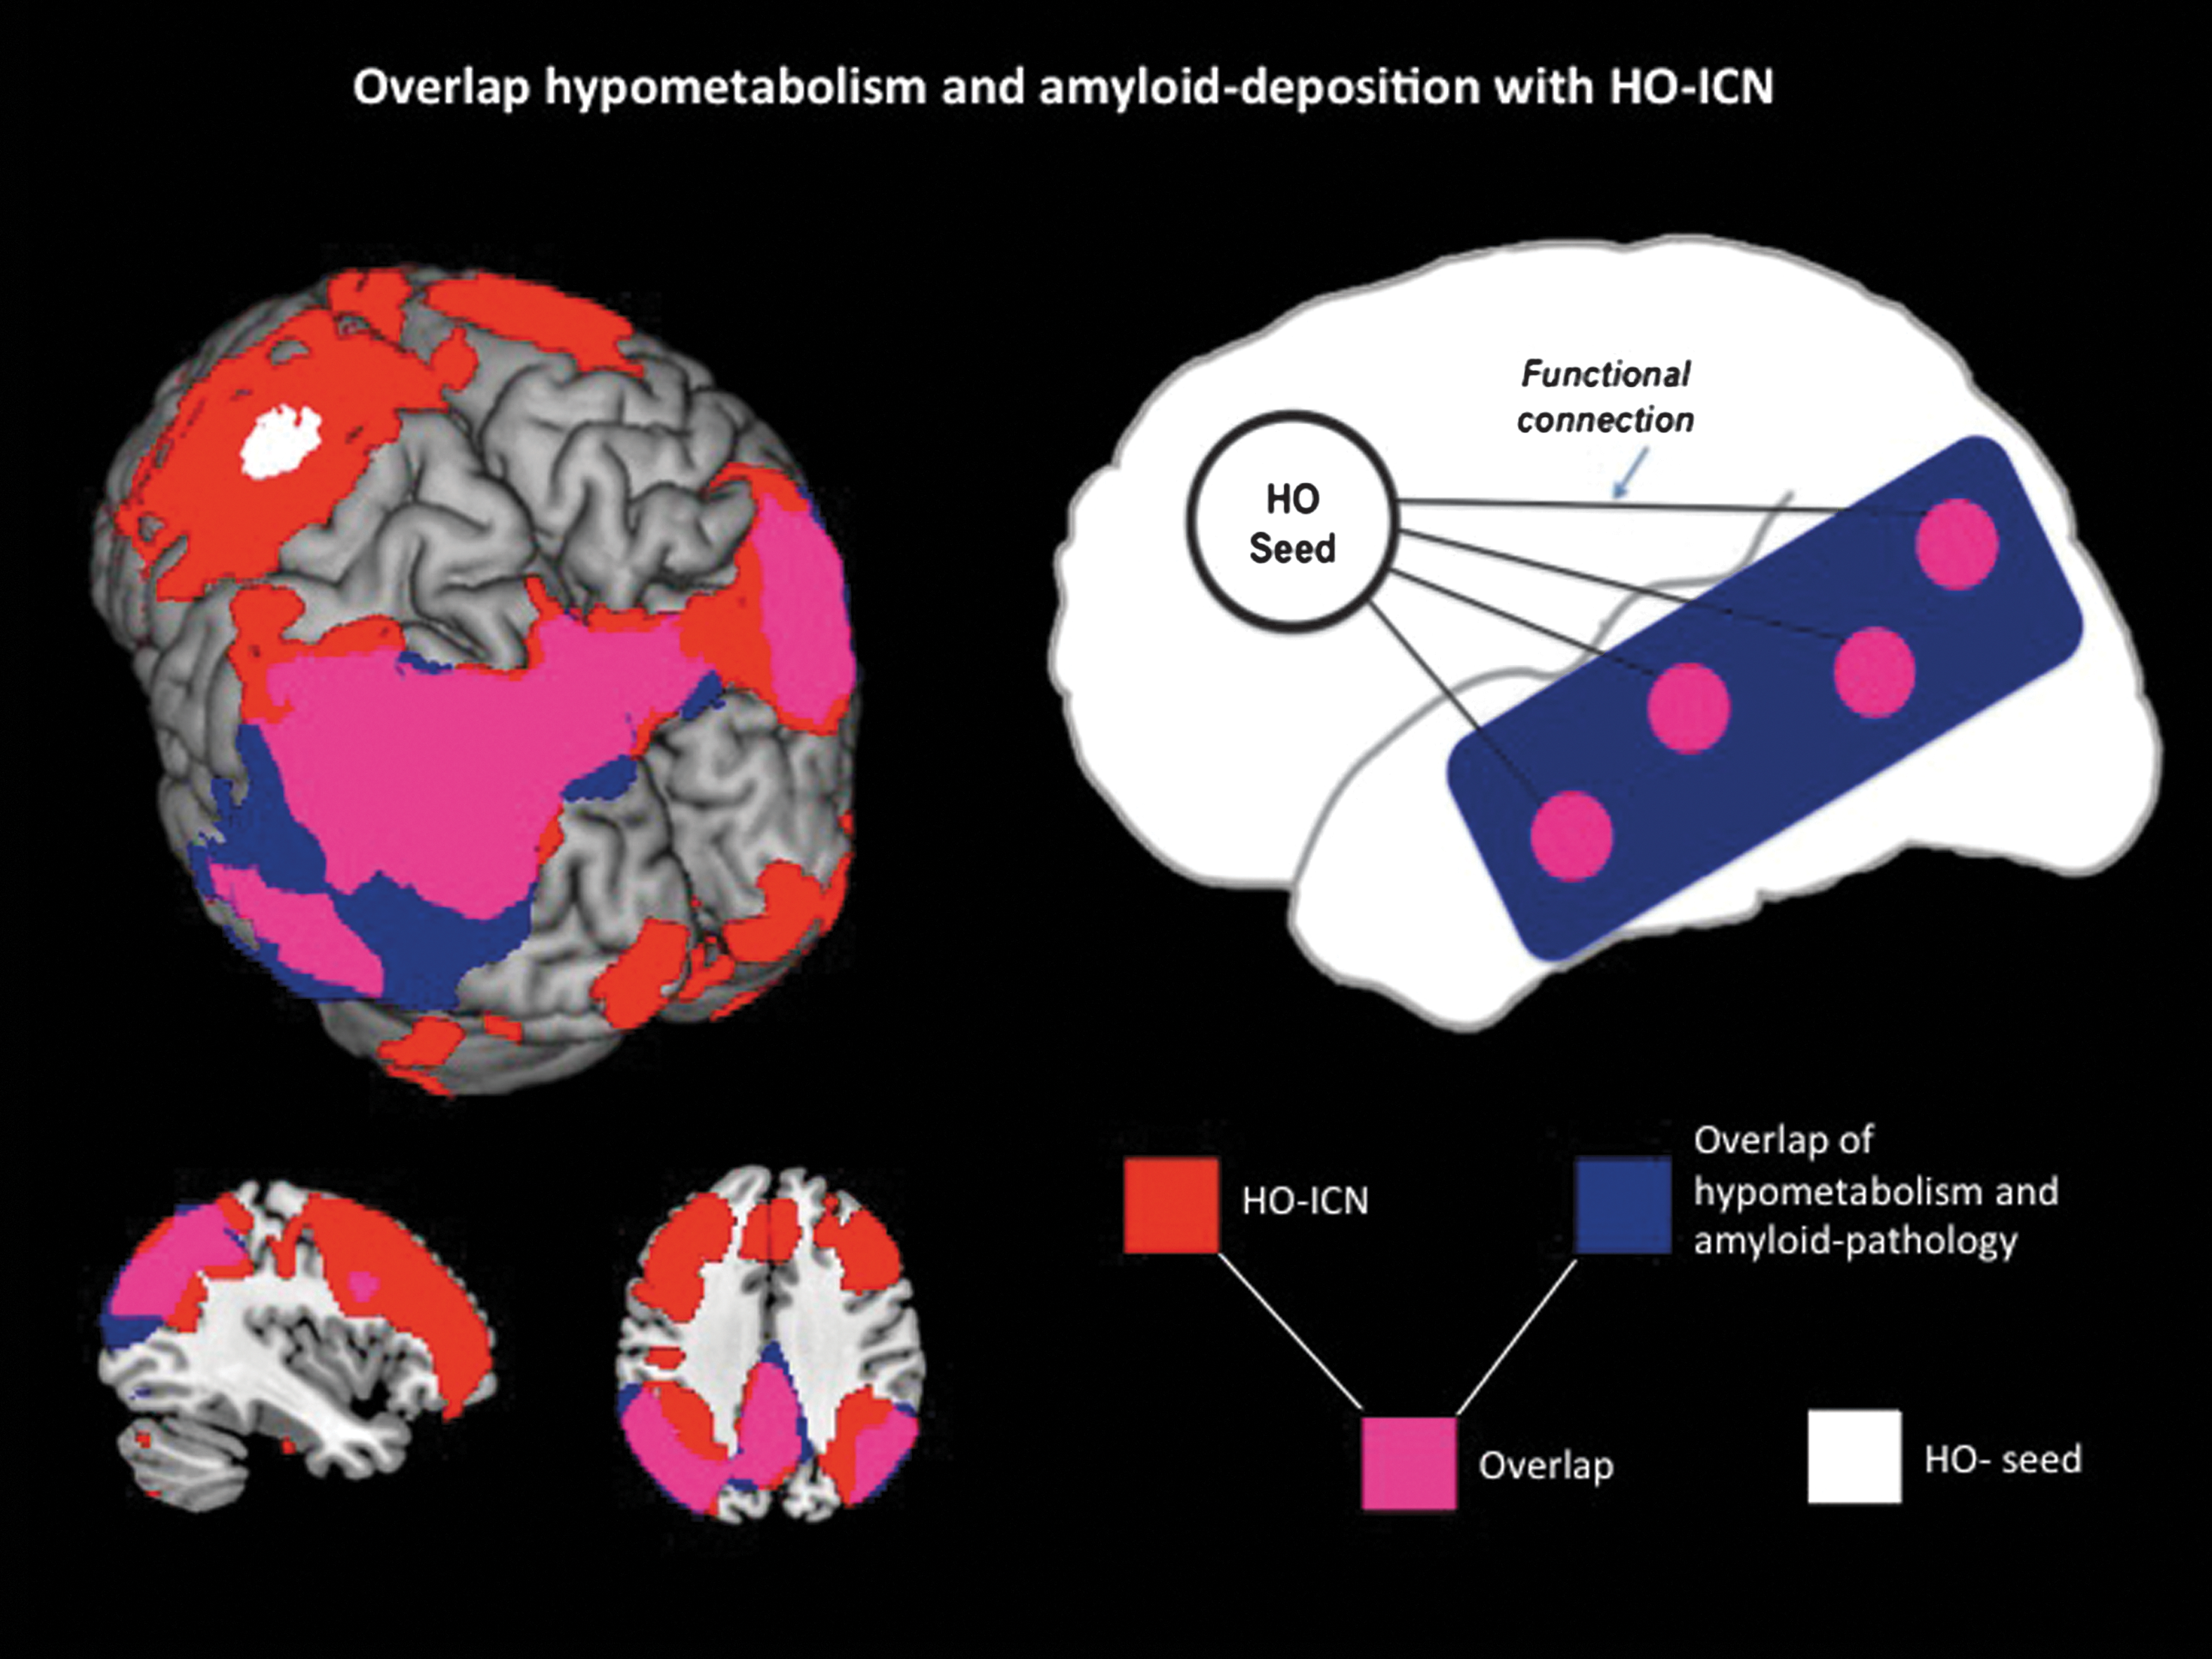
Left: Overlap (purple) of AD-specific pathologies (amyloid deposition and hypometabolism; blue) measured in 19 AD patients compared with 15 elderly HC1 and HO-ICN (red, seed: white) acquired in 17 elderly HC2. Significance thresholds p<0.01 FDR corrected. Results are displayed on a standard MRI template. Right: Schematic model to illustrate the strong anatomical overlap (purple) between remote but functionally connected brain areas (HO-ICN; red) and AD pathologies (amyloid deposition and hypometabolism; blue).
This anatomical overlap between ICN, hypometabolism, and amyloid deposition could not be demonstrated for the control ICN obtained by the frontal “AD-pathology-free” seed (Supplementary Fig. S4). This ICN seems not to be located in brain areas affected by measurable AD pathologies.
ROI-based and voxel-wise analyses
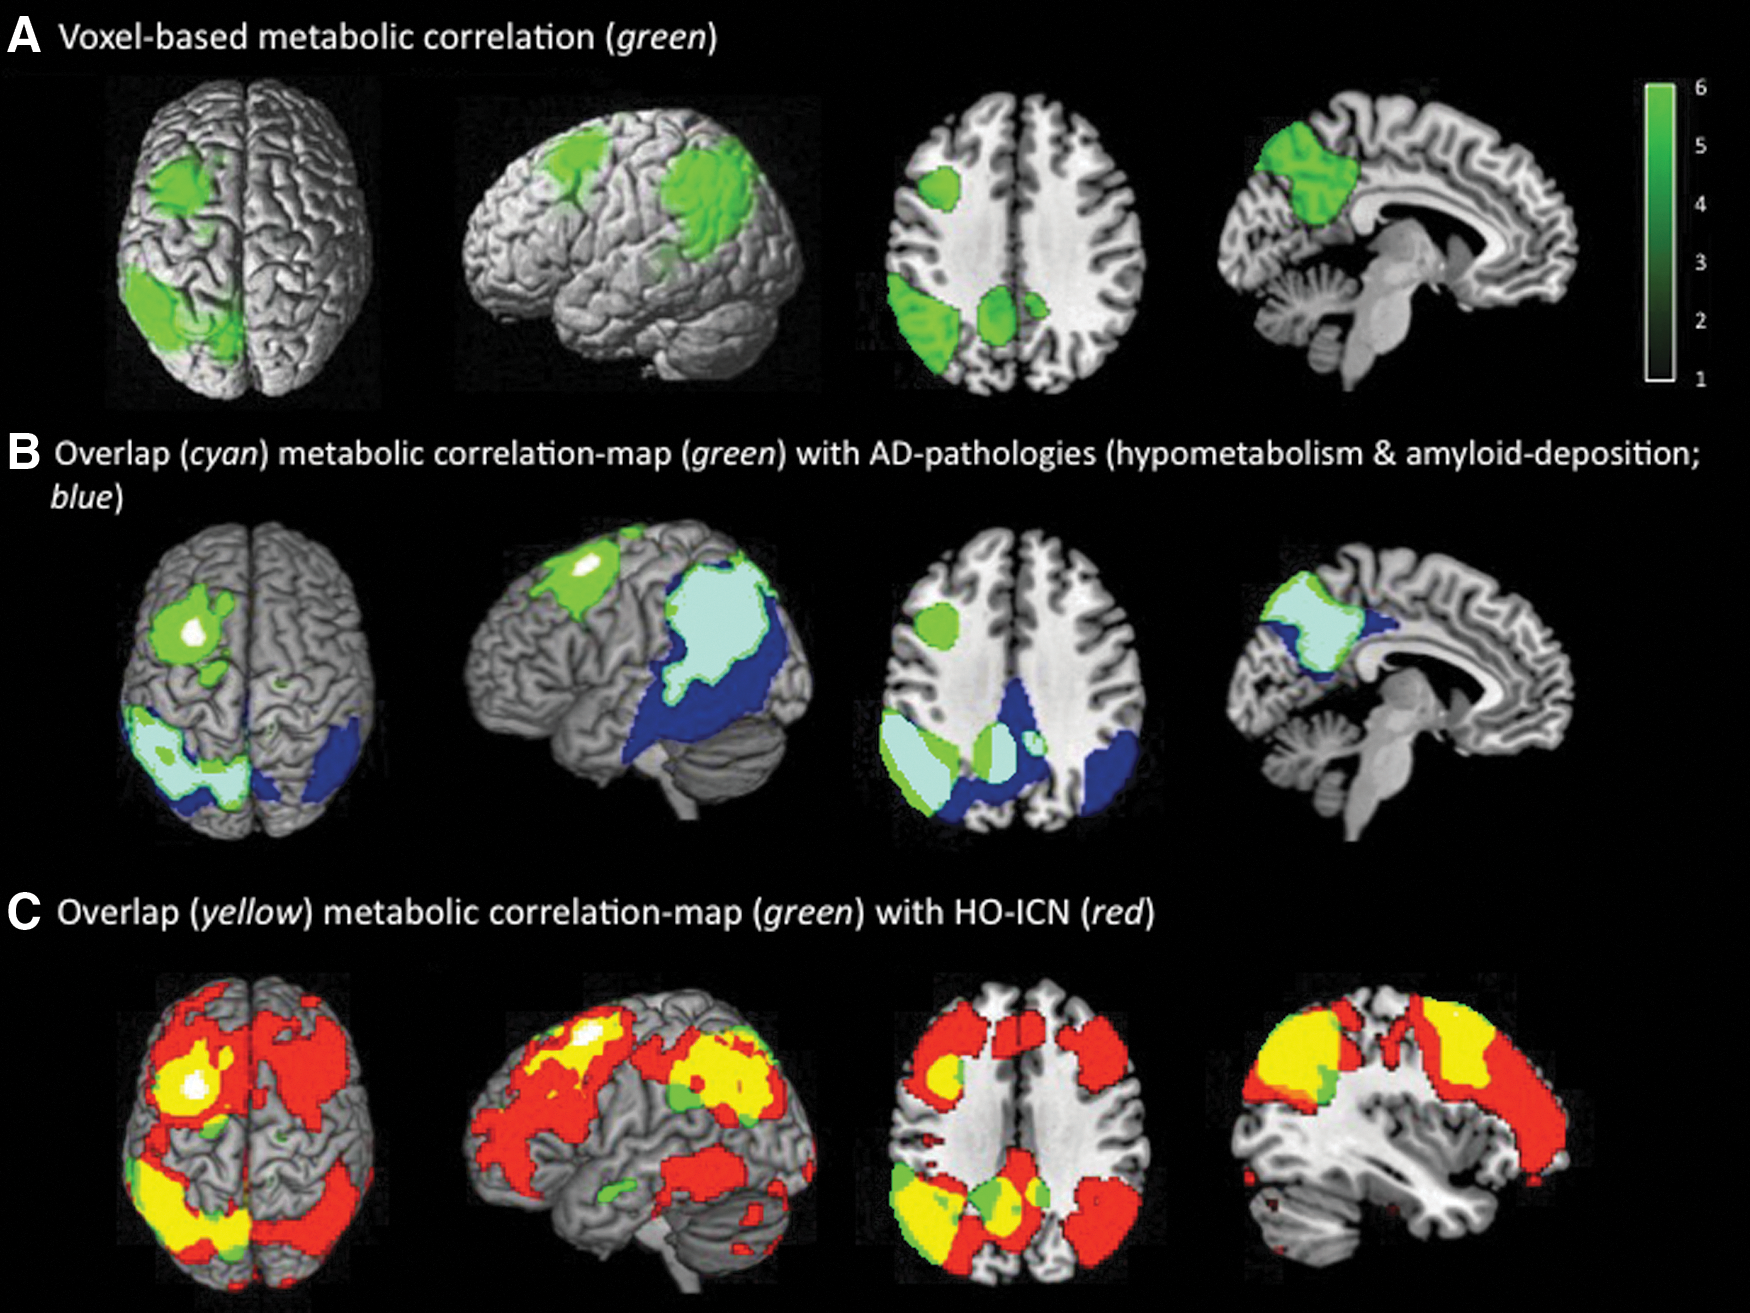
Associations between the different PET findings within the HO-ICN were quantified using correlation analyses. Strong ROI-based correlations between mean [18F]FDG-SUVR in the HO seed and the corresponding HO-ICN were found (r=0.907, p<0.001), which were significantly stronger than correlations between HO-seed and nonconnected brain areas outside the HO-ICN [r=0.680, p=0.001; comparison of correlation-coefficients: p=0.05 (two-tailed), p=0.03 (one-tailed)] (Fig. 5). Correspondingly, the results of the hypothesis-free voxel-wise correlation analysis between mean HO-[18F]FDG-SUVR and metabolism across the entire brain illustrate that metabolism in the HO seed shows a strong positive voxel-wise correlation with metabolism in left-hemispheric frontal, parietal, and temporal brain areas, including the precuneus. This resulting correlation map shows a striking overlap with the anatomical patterns of the AD-specific pathologies in our AD population, particularly in the left temporo-parietal cortex, and, furthermore, is almost completely located within brain regions belonging to the HO-ICN (Fig. 6; PVE-corrected data: Supplementary Fig. S5).
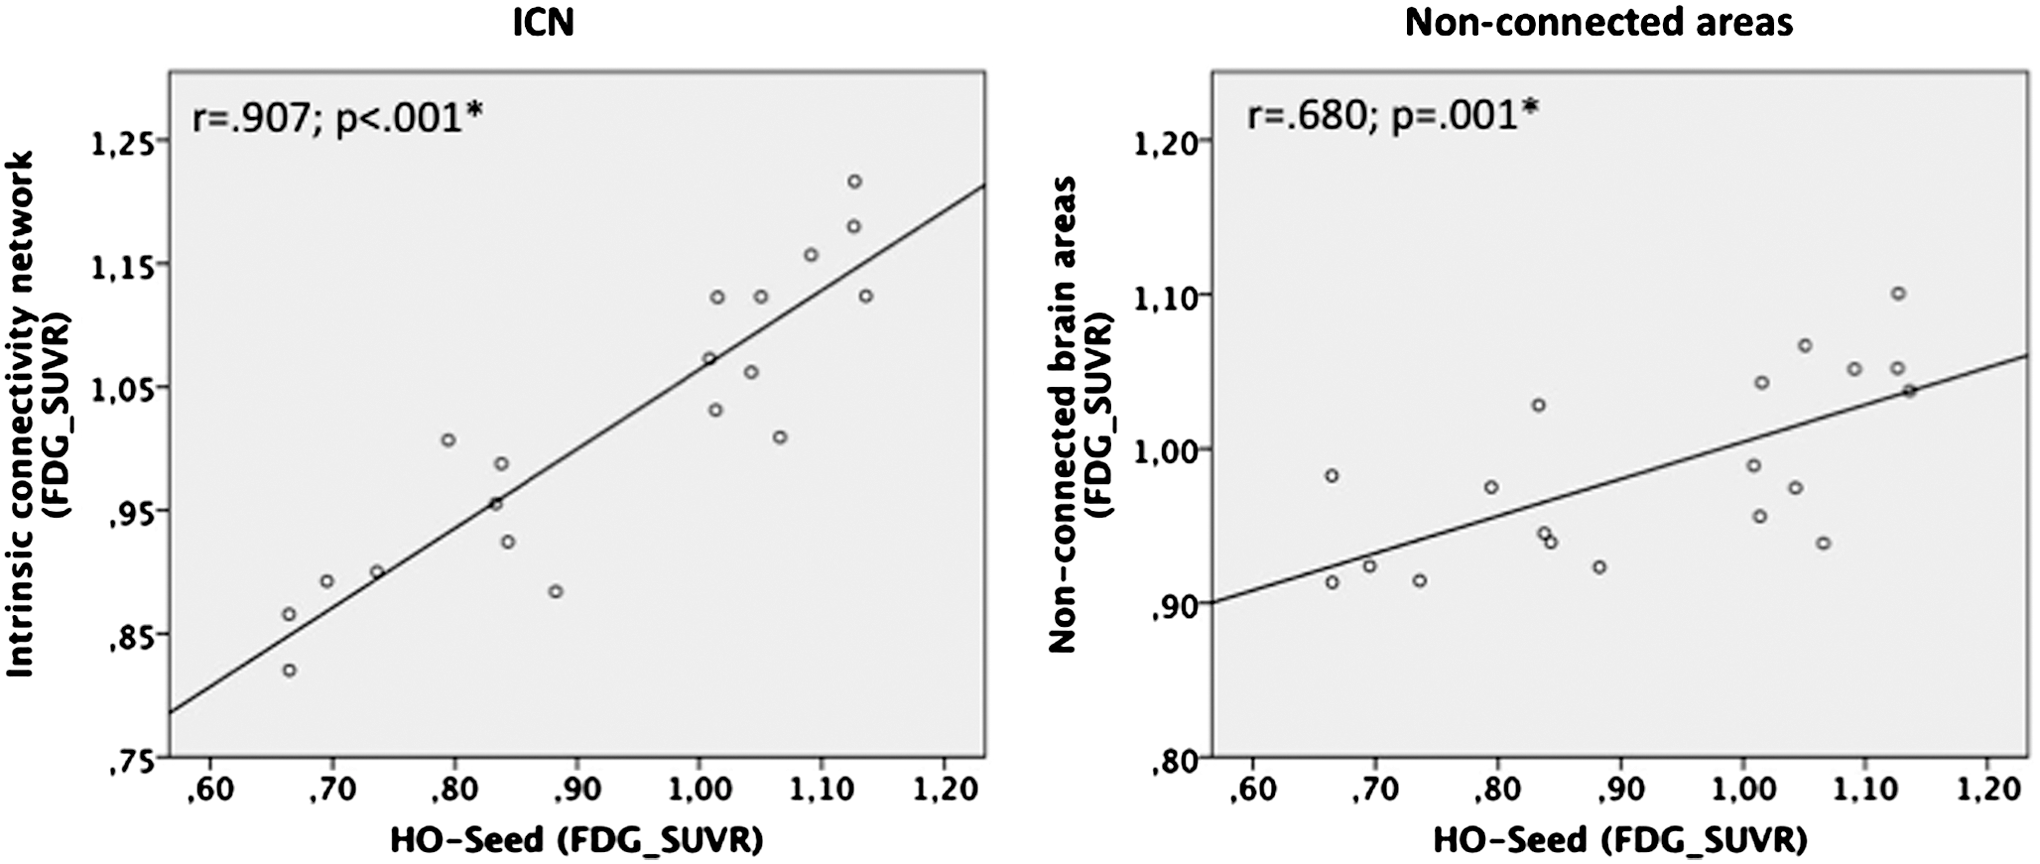
Correlations between mean metabolism ([18F]FDG-SUVR) in the HO seed and mean [18F]FDG-SUVR in the HO-ICN (left) resp. mean [18F]FDG-SUVR in nonconnected areas (right).
Discussion
Discussion of the main results and integration in the current state of research
Summary
The aim of our present study was to investigate the hypothesis that hypometabolism in brain areas relatively spared from local amyloid pathology in AD may be a consequence of diminished functional interaction with connected brain areas affected by amyloid toxicity. Multimodal imaging methods were used to measure neurodegenerative pathologies, that is, reduced neuronal activity and amyloid burden, in AD patients and to identify associated ICNs in healthy controls. We were able to demonstrate that hypometabolic brain regions, both affected and spared from amyloid pathology, are part of one common functional ICN. Furthermore, we were able to show that the degree of metabolic abnormality between unaffected and amyloid-affected regions within this network is tightly correlated. To our knowledge, these results provide for the first time some evidence for the concept that hypometabolism in less amyloid-affected brain regions in AD may be a consequence of pathologies in remote but functionally connected brain areas.
To cross-check our hypothetical model, we calculated a control ICN using an “AD-pathology-free” seed, which, in contrast to the HO-ICN, showed no distinctive overlap with the patterns of amyloid deposition and/or hypometabolism in AD patients (Supplementary Fig. S4), supporting the specificity of our findings.
PET analyses
The findings of our PET analyses are generally in line with previously published AD studies. Relative to healthy controls, our AD patients showed typical patterns of hypometabolism (Herholz, 1995; Minoshima et al., 1997; Silverman et al., 2001) as well as amyloid deposition (Drzezga et al., 2008; Grimmer et al., 2009; Klunk et al., 2004), confirming the selection of a small but representative sample of AD patients. After superimposing these patterns, a distinctive overlap was identified in posterior brain regions, which is also consistent with previously published studies (Buckner et al., 2005; Edison et al., 2007; Forster et al., 2012a; Ng et al., 2007; Shin et al., 2010, 2011). Besides this strict posterior overlap, differences between the topographical distribution of amyloid deposition and hypometabolism were also found, especially in the frontal cortex as described earlier (Edison et al., 2007; Forster et al., 2012a; Li et al., 2008; Ng et al., 2007). We observed brain areas harboring amyloid burden but being unaffected by hypometabolism, which has been discussed earlier, potentially reflecting a temporal delay between the appearance of amyloid deposits and the onset of neuronal dysfunction (Forster et al., 2012a, 2012b). In addition to these discrepancies, the most prominent hypometabolic area without major [11C]PiB uptake was identified in the left middle frontal gyrus and used as a representative HO region for our further analyses. In contrast, an “AD-pathology-free” area not distinctly affected by any of the monitored AD pathologies was identified in the left superior frontal gyrus and used for control condition analyses. To test for the potential effects of cerebral atrophy and PVE on the observed [18F]FDG- and [11C]PiB-abnormality patterns, PVE correction of all PET data was carried out. Confirming our findings, the strong posterior overlap of AD pathologies and the frontal HO area were present in the PVE-corrected PET data as well. Thus, it is not likely that the observed topographical discrepancies between these abnormalities can be attributed to cortical atrophy.
Results of the multimodal imaging analyses
The HO area was used as a seed region in an rs-fMRI dataset of healthy elderly controls to identify brain regions usually connected to this area under physiological conditions. A striking anatomical overlap between the HO-ICN in healthy subjects and brain regions affected by AD pathologies in patients was observed, including PCC, precuneus, lateral, temporal, and parietal areas, indicating that both amyloid-affected and unaffected hypometabolic brain regions are a part of one common functional ICN. Furthermore, the finding that brain regions functionally connected to the HO seed are predominantly containing areas affected by both amyloid pathology and neuronal dysfunction, supports the idea that neuronal dysfunction in amyloid-spared brain regions may be a consequence of reduced communication with/input from amyloid-affected brain regions. Thus, the finding of hypometabolic changes without local amyloid pathology would not necessarily contradict the amyloid hypothesis, postulating that neuronal dysfunction and disruption of functional connectivity are downstream consequences of amyloid toxicity (Hardy and Higgins, 1992; Hardy and Selkoe, 2002; Selkoe, 2008; Walsh and Selkoe, 2004). It is not surprising that we observed a stronger metabolic connectivity between regions usually functionally connected. The interesting finding is, however, that a stronger correlation was detected between regions clearly affected by hypometabolism in the patient group. Thus, rather than “metabolic connectivity” across subjects, we observed “hypometabolic connectivity” between two regions affected by hypometabolism. Although global effects may also have influenced the correlation of metabolism in the HO area and in the HO-ICN, we would expect that this correlation would rather be diminished than increased by individual variations of neuronal dysfunction, that is, hypometabolism. From this perspective, the higher correlation between the two regions affected by hypometabolism strongly suggests that the effects of neuronal dysfunction in both regions may be systematically inter-related. Even more convincing than this ROI-based correlation analysis may be the voxel-based analysis. When using the metabolic values derived from the HO region as a covariate for a voxel-based correlation analysis without any a priori hypothesis, we obtained a pattern of significantly correlating metabolic values, which strikingly resembled the preidentified pattern of hypometabolism in the AD group and the HO network, respectively (Fig. 6 and Supplementary Fig. S5). Again, this indicates that, indeed, a systematic relation between hypometabolism in the HO region and in the functionally connected regions may exist.
The vulnerability of cortical hub regions for different AD-pathologies
As mentioned earlier, we observed a strong overlap between amyloid deposition, hypometabolism, and the HO-ICN, particularly in the PCC and precuneus. These brain regions are known to be key components of the DMN and seem to represent “cortical hub regions,” that is, showing high intrinsic functional connectivity to many other areas of the brain (Buckner et al., 2005, 2008). It has been speculated that these regions may play an important role in moderating inter-regional neuronal communication (Buckner et al., 2009; Drzezga et al., 2011; Tomasi and Volkow, 2010). A breakdown of the DMN has been demonstrated, particularly in these regions in AD, MCI and even in amyloid-positive subjects without apparent cognitive impairment (Hedden et al., 2009). Recently also the cortical “hubness” of these key regions has been shown to be disrupted in AD- and MCI patients (Drzezga et al., 2011; Hedden et al., 2009). The distinctive vulnerability of these regions for different forms of pathology (amyloid deposition, hypometabolism, and network disruption) as opposed to the high levels of intrinsic connectivity of these regions in healthy subjects has led to the assumption that distinctive intrinsic neuronal activity during a lifetime could facilitate later development of local AD pathologies and neurodegeneration (Buckner et al., 2005, 2008). Indeed, it has been shown that high synaptic activity induces an increase of amyloid production and -accumulation (Cirrito et al., 2005; Kamenetz et al., 2003), which, in turn, may have a direct synaptotoxic impact (Hardy and Higgins, 1992; Selkoe, 2008). Supporting this concept, a recent study was able to demonstrate a distinct overlap and correlation between hypometabolism and disruptions of cortical hub connectivity in PCC/precuneus in amyloid-positive MCI patients (Drzezga et al., 2011). Interestingly, the latter study also showed that hypometabolism in the PCC was correlated with disruptions of functional connectivity in remote frontal brain regions, indicating that neurodegenerative pathology may exert remote effects. We believe that our current data provide further evidence that amyloid pathology and consequential neuronal dysfunction in posterior cortical hub regions may contribute to neuronal dysfunction in remote but functionally connected brain areas via disruption of connectivity, reflected in hypometabolic changes in both regions. This disconnection theory is underlined by our findings demonstrating strong semiquantitative correlations between the degree of hypometabolism in the HO area and in the HO-ICN struck by both amyloid and hypometabolism (Fig. 4).
The “network degeneration theory”: different explanatory approaches to why the development of AD pathologies follows ICNs
The occurrence of AD pathologies within ICNs is in line with the recently described “network degeneration hypothesis” (Seeley et al., 2009; Zhou et al., 2012), postulating that neurodegenerative diseases may spread along specific connectivity networks and, in turn, may also be responsible for neural network dysfunction (Buckner et al., 2005; Drzezga et al., 2011; Palop et al., 2006). For example, Seeley et al. (2009) demonstrated that disease-specific atrophy patterns for different dementia syndromes closely match healthy functional ICNs. Another recently published study, dealing with clinical variants of AD, was able to show that syndrome-characteristic patterns of hypometabolism as well as syndrome-specific connectivity maps are consistent with the anatomy of healthy ICNs (Lehmann et al., 2013a), indicating an involvement of specific networks in different clinical phenotypes.
Spread of toxic amyloid
So far, it is not clear why expansion of neurodegeneration follows predefined functional networks. A spread of amyloid pathology following neuronal connections could be considered relevant; however, it would not explain why neuronal dysfunction is also observed in regions relatively free of amyloid deposits. The findings of our study complement this discussion by offering an explanation on how the expansion of specific hypometabolism patterns may follow functional networks without even requiring the presence of major amyloid pathology in the dependent areas. Naturally, the discussed functional deactivation effects are expected to be more pronounced in regions which are strongly connected to areas affected by major neurodegenerative pathology, implying that such a phenomenon would become apparent initially in prominent networks. Correspondingly, the detected HO region was located in a brain area that was marginally associated with the DMN and, consequently, the resulting HO-ICN showed an overlap with the typical pattern of the healthy DMN.
The role of neurofibrillary tangles in the spread of pathologies within ICNs
It has been recently discussed that the spread of neurofibrillary tangles could play an important role in the pathogenesis and expansion of AD neurodegeneration. Studies using animal models and in vitro-methods have suggested that tau-pathology located in the cell body may be transported through axonal transport and spread even trans-synaptically within neuronal networks (Clavaguera et al., 2009; de Calignon et al., 2012; Frost et al., 2009; Liu et al., 2012), thus possibly leading to a progression of disease within ICNs. The development of tau-pathology may start in brain regions with a high amyloid concentration (Chabrier et al., 2012), spread trans-synaptically, and may cause neuronal dysfunction in remote but functionally connected areas. Since this spread seems to occur predominantly along predefined connectivity pathways, our results are generally consistent with this theory. However, the observed strong semiquantitative correlation between reduced metabolism in spatially divided brain regions within an ICN suggests that functional disconnection may essentially contribute to the characteristic pattern of hypometabolism observed in AD. Such effects of connectivity disruption may not necessarily require traveling of original AD pathology within cerebral networks.
Neuronal dysfunction versus interruption of connectivity
Amyloid deposition may disrupt the function and vitality of neurons locally by inducing inflammatory processes as well as neuronal cell death, leading to a reduced neuronal input and dysfunction in functionally connected brain areas. Furthermore, amyloid aggregation may interrupt neuronal communication and trans-synaptic interaction (Selkoe, 2008), which may also lead to a reduced activation of connected areas. Neuronal dysfunction may be observed in regions not strongly affected by primary AD pathology, as the disconnection, that is, functional deactivation, may initiate or promote the development of neurodegeneration in these originally unaffected brain regions. Based on the recently demonstrated relations between structural connectivity and functional connectivity (Hermundstad et al., 2013), structural alterations also such as atrophy may lead to a disruption of connectivity (La Joie et al., 2012). Since no distinct neuronal atrophy was demonstrated in relevant brain regions in this study (Supplementary Figs. S2, S3 and S5), our data are somewhat in favor of the interruption hypothesis; most likely, however, a combination of different phenomena may best explain our results.
Explanation of inconsistent results in previous studies
A previous study by Morbelli et al. (2012) reported reduced metabolic connectivity between areas typically affected by hypometabolism in prodromal AD and the rest of the brain and interpreted these findings as reduced functional connectivity. Although we report strong metabolic connectivity between hypometabolic areas in our study, the findings of Morbelli and associates are not necessarily conflicting with our findings for the following reasons: In contrast to this recently published study, we used a different methodological approach, by comparing metabolism between two predefined ROIs, both known to be affected by hypometabolism in our population. The strong quantitative correlation between hypometabolism in the HO area and the HO-ICN found in our study does not necessarily serve as proof of a particularly high functional connectivity between these regions; it may rather reflect an inter-relation between a pathology observed in one region, mirrored in another functionally connected region by lack of input. In other words, in subjects with a strong neuronal dysfunction in a region A, functional input to a functionally connected region B will be more impaired as compared with a subject with less neuronal dysfunction in region A. This correspondence of abnormalities might dissociate in the progression of AD due to the development of independent pathologies in the two remote brain areas or due to a complete interruption of connectivity.
In summary, our findings not only provide further support for the network degeneration hypothesis, but also offer a new perspective on the mechanisms of the expansion of AD pathologies.
Limitations
There are several limitations to the present study. We compared results derived from different imaging techniques, which may be difficult and problematic due to a different methodical sensitivity. Identical statistical thresholds may not automatically guarantee equal weighting of the findings. Furthermore, the results of this cross-sectional study do not allow making statements about chronological sequences and causal relationships between these different AD pathologies. Future longitudinal studies should try to address these effects. It is also important to note that the identified left frontal HO area is probably not completely free of any amyloid load, despite not showing significantly elevated [11C]PiB-uptake. Soluble amyloid oligomers would have been missed by amyloid PET imaging. Typically, the frontal cortex has been described to exhibit distinct [11C]PiB uptake in patients with AD, however, usually in more frontopolar regions (Drzezga et al., 2008; Forster et al., 2012a). In this context, the detected HO area as well as all the results is of exemplary nature. Due to the relatively small sample size, our findings may not be easily generalized on the overall population of AD patients and need to be reproduced in larger samples in further related research.
However, despite the limitations mentioned earlier, the current findings provide some initial evidence for a concept, which may contribute to the patterns of abnormality detected in AD and may point to a potentially relevant pathomechanism. It may be worthwhile to be aware of the underlying thesis, when drawing conclusions to the anatomical distribution and regional expansion of AD pathology.
Conclusion
Strong associations between hypometabolism in brain areas without major amyloid burden and AD-specific pathologies in remote but functionally connected brain areas were demonstrated. The results indicate that hypometabolism in AD as measured by [18F]FDG-PET may reflect reduced neuronal activity in consequence of not only regional but also remote pathologies. Hypometabolism in brain areas, which are not strongly affected by local amyloid pathology, may be caused by diminished neuronal input from functionally connected areas impaired by amyloid toxicity. In summary, the results of the present study represent a link between the amyloid hypothesis and the network degeneration hypothesis, representing two important theories aiming at explaining pathophysiological processes in AD.
Footnotes
Acknowledgments
The authors are grateful to the participants of the study and the staff of the Departments of Nuclear Medicine and Psychiatry for their help in recruitment and data collection. This work was supported in part by the German research foundation (DFG) (DR 445/4-1 and DR 445/5-2 to A.D.) and the German Academic Exchange service (DAAD; M.T.).
Author Disclosure Statement
No competing financial interests exist. Alexander Drzezga is acting as a consultant for GE Healthcare, Avid/Lilly & Piramal.
References
Supplementary Material
Please find the following supplemental material available below.
For Open Access articles published under a Creative Commons License, all supplemental material carries the same license as the article it is associated with.
For non-Open Access articles published, all supplemental material carries a non-exclusive license, and permission requests for re-use of supplemental material or any part of supplemental material shall be sent directly to the copyright owner as specified in the copyright notice associated with the article.