
Abstract
In Alzheimer's disease (AD), recent findings suggest that amyloid-β (Aβ)-pathology might start 20–30 years before first cognitive symptoms arise. To account for age as most relevant risk factor for sporadic AD, it has been hypothesized that lifespan intrinsic (i.e., ongoing) activity of hetero-modal brain areas with highest levels of functional connectivity triggers Aβ-pathology. This model induces the simple question whether in older persons without any cognitive symptoms intrinsic activity of hetero-modal areas is more similar to that of symptomatic patients with AD or to that of younger healthy persons. We hypothesize that due to advanced age and therefore potential impact of pre-clinical AD, intrinsic activity of older persons resembles more that of patients than that of younger controls. We tested this hypothesis in younger (ca. 25 years) and older healthy persons (ca. 70 years) and patients with mild cognitive impairment and AD-dementia (ca. 70 years) by the use of resting-state functional magnetic resonance imaging, distinct measures of intrinsic brain activity, and different hierarchical clustering approaches. Independently of applied methods and involved areas, healthy older persons' intrinsic brain activity was consistently more alike that of patients than that of younger controls. Our result provides evidence for larger similarity in intrinsic brain activity between healthy older persons and patients with or at-risk for AD than between older and younger ones, suggesting a significant proportion of pre-clinical AD cases in the group of cognitively normal older people. The observed link of aging and AD with intrinsic brain activity supports the view that lifespan intrinsic activity may contribute critically to the pathogenesis of AD.
Introduction
Alzheimer's disease (AD) is both the by far most frequent neurodegenerative disease and the by far most frequent cause of age-related dementia (Blennow et al., 2006). At age of 60, about 1–2% of people suffer from AD-dementia; this proportion doubles all 5 years with almost half of 90-year-old persons being affected by AD-dementia (Hebert et al., 2003). Beside several risk factors ranging from genetic factors to cerebrovascular events to lifestyle, age is the clearly most important risk factor for sporadic AD (Herrup, 2010). The amyloid hypothesis of AD states that amyloid-β (Aβ)-pathology is the critical initiating event in AD, starting with aberrant clearance of Aβ-peptides followed by consecutive peptide aggregation, including plaques, pathology spread, and disruption of neural activity and connectivity (Selkoe, 2002). Recent findings suggest that Aβ-pathology might start about 30 years before first symptoms arise (Bateman et al., 2012; Jack et al., 2013), and Aβ has been linked with increased levels of brain activity and specific metabolic pathways (i.e., aerobic glycolysis) particularly in hetero-modal brain areas with high functional connectivity (FC) (Buckner et al., 2005, 2008, 2009; Dickerson and Sperling, 2009; Drzezga et al., 2011; Jagust, 2012; Sorg et al., 2007, 2009; Sperling et al., 2009; Vlassenko et al., 2010). Linking aging, sporadic AD, Aβ-pathology, and increased neuronal activity, a recent hypothesis suggested that lifespan intrinsic (i.e., ongoing) brain activity particularly in hetero-modal areas of high levels of FC may trigger regional Aβ-pathology and therefore the rise of AD (Buckner et al., 2009; Jagust and Mormino, 2011). Given that AD may have a 20–30-year-long pre-clinical period, this model suggests that due to advanced age and therefore potential impact of pre-clinical AD, intrinsic activity of older persons resembles more that of patients than that of younger controls. While most studies have investigated the impact of either aging or disease on brain's activity (Goh, 2011; Grady, 2008; Grady et al., 2003; Park et al., 2012), few studies have compared brain activity across healthy young, healthy elderly, and patients with AD (Buckner et al., 2000; Hafkemeijer et al., 2012; Sun et al., 2012). In particular with respect to intrinsic brain activity, a systematic approach focusing on the degree of similarity or dissimilarity across groups instead of simple group differences is—to the best of our knowledge—missing.
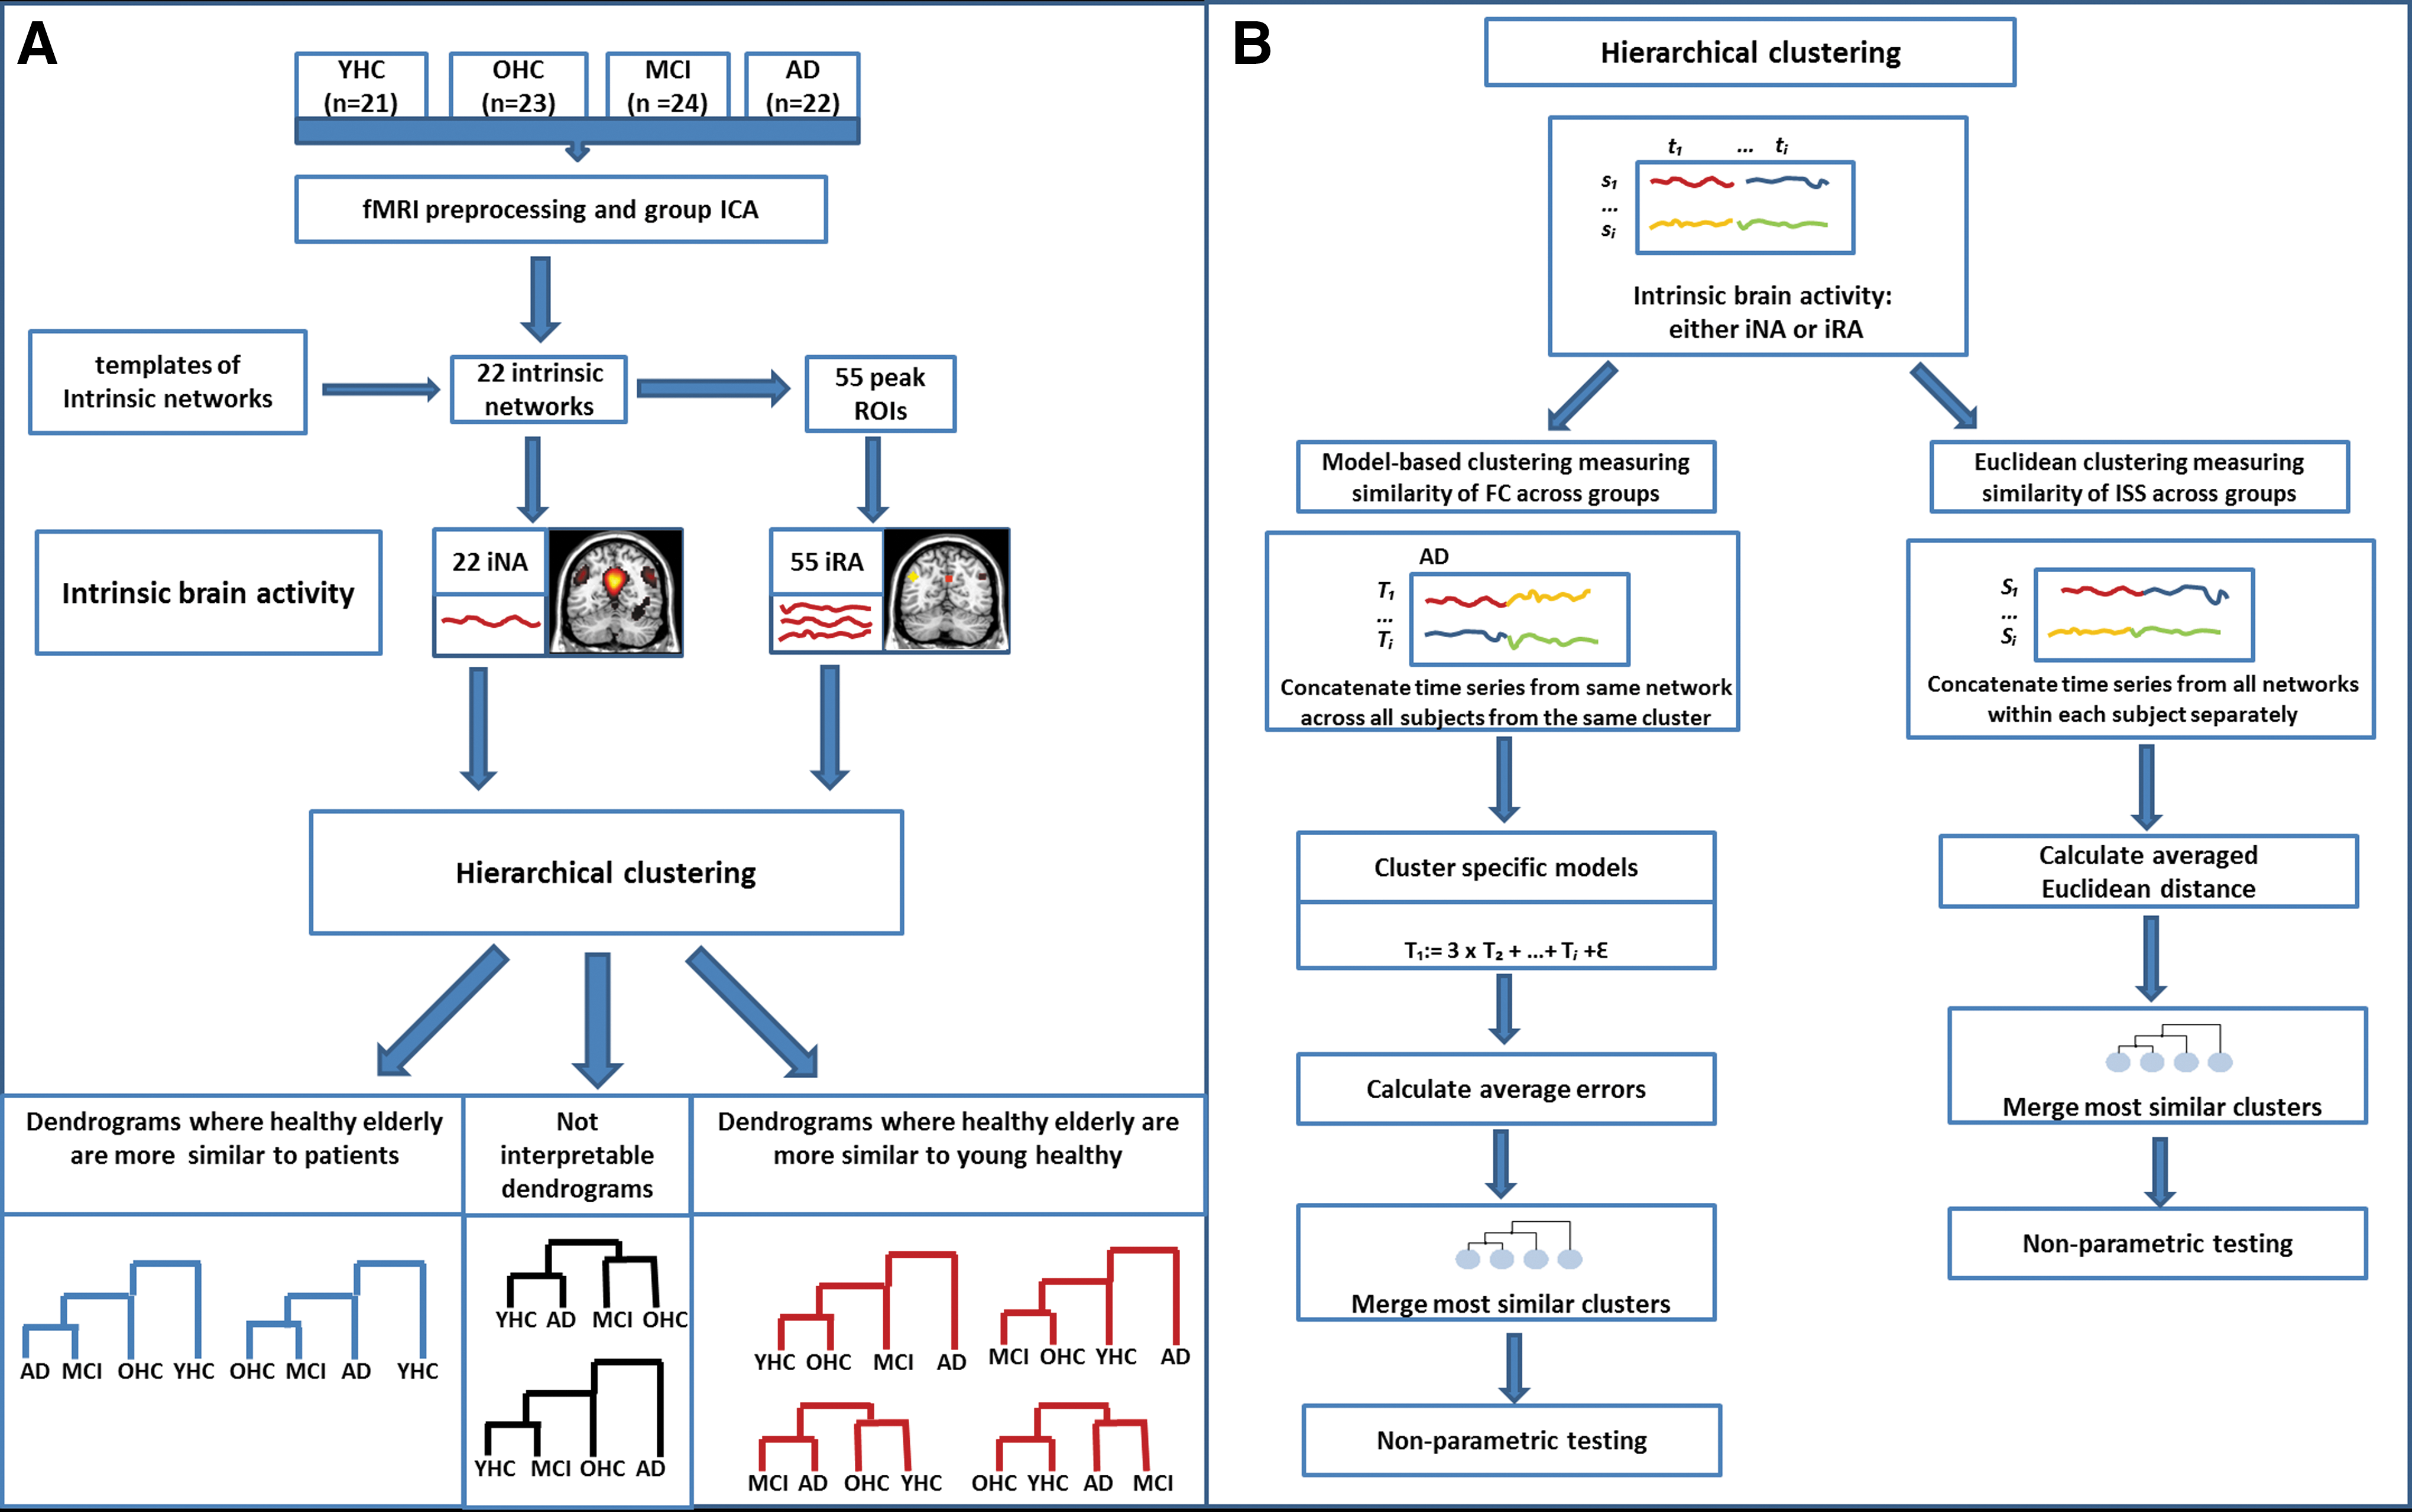
The current study addresses this question by combining resting-state functional magnetic resonance imaging (rs-fMRI) with hierarchical clustering in groups of younger healthy persons at age of about 25 (young healthy controls [YHCs]), older healthy persons without any cognitive impairment at age of about 70 (older healthy controls [OHCs]), and patients with mild cognitive impairment (MCI; high-risk state for AD) and AD-dementia of equal age. Hierarchical clustering allows for estimating similarity or dissimilarity of given measures across groups. Rs-fMRI allows for estimating blood-oxygenation-level-dependent (BOLD) fluctuations, which are used as surrogate for intrinsic brain activity. Spatial patterns of synchronized BOLD fluctuations characterize intrinsic networks with some of them (such as the default mode network [DMN] or fronto-parietal attention networks [AN]) covering hetero-modal areas of increased FC (Buckner et al., 2009). These networks and regions that are affected by very early AD constitute the main focus of the current study. To identify such intrinsic networks, we used independent component analysis (ICA) of rs-fMRI data. ICA decomposes imaging data into independent components of spatial z-maps (reflecting networks' BOLD FC pattern) and corresponding time courses (reflecting networks' activity across time). Two different measures of intrinsic brain activity were derived from these components (Fig. 1A). First, intrinsic networks' time courses were used as surrogate for intrinsic network activity (iNA). Second, to identify regions of highest FC, we took peaks of networks' spatial z-maps and used averaged BOLD fluctuations of spherical regions-of-interest (ROI) around these peaks as surrogates for intrinsic brain activity (iRA). Both iNA and iRA, respectively, were put into hierarchical clustering procedures to estimate similarity of intrinsic brain activity across groups. To control for the choice of networks and regions, respectively, we used different ensembles of networks or regions for clustering (e.g., only the DMN or the DMN and attention networks). To control for clustering approaches, we used two different hierarchical clustering procedures, namely, Average Linkage Clustering based on Euclidean distance (Jain and Dubes, 1988), which estimates similarity of intrinsic brain activity inter-subject-synchronicity (ISS) across groups (van Kesteren et al., 2010), and model-based clustering (Plant et al., 2013), which estimates similarity of intrinsic FC across groups (Fig. 1B).
Study design.
Materials and Methods
Subjects and task
Twenty-one YHC (10 women, age 18–30 years), 23 elderly healthy controls (15 women, age 60–90 years), 24 patients diagnosed with MCI (13 women, age 62–79 years), and 22 patients diagnosed with AD-dementia (9 women, age 62–79 years) participated in this study (Table 1). All subjects provided informed consent in accordance with the Human Research Committee guidelines of the Klinikum rechts der Isar, Technische Universitat München. Patients were recruited from the Memory Clinic of the Department of Psychiatry, healthy controls by word-of-mouth advertising. Examination of every subject included medical history, neurological examination, informant interview (only for older participant; Clinical Dementia Rating [CDR] [Morris et al., 1988]), neuropsychological assessment (Consortium to Establish a Registry for Alzheimer's Disease [CERAD] [Morris et al., 1989]), and structural MRI. Patients with MCI (CDR-global=0.5) met criteria for MCI, including reported and neuropsychologically assessed cognitive impairments, largely intact activities of daily living, and excluded dementia (Gauthier et al., 2006). Patients with AD-dementia fulfilled criteria for mild dementia (CDR-global=1) and the National Institute of Neurological and Communicative Disorders and Stroke and the Alzheimer's Disease and Related Disorders Association (NINCIDS-ADRDA) criteria for AD (McKhann et al., 1984). Participants without cognitive impairment did not complain memory decline and perform within the range of 1 standard deviation of age and education norms for each CERAD subtest. Exclusion criteria for entry into the study were other neurological, psychiatric, or systemic diseases (e.g., stroke, depression, and alcoholism) or clinically remarkable structural MRI (e.g., stroke lesions) potentially related to cognitive impairment. Ten patients with AD/8 patients with MCI/6 healthy older controls were treated for hypertension (Beta-blockers, ACE-inhibitors, and Calcium channel blockers), 4/5/3 for hypercholesterolemia (statins), 2/2/0 had diabetes mellitus, 6/3/0 received antidepressant medication (Mirtazapine, Citalopram), and 22/0/0 received cholinesterase inhibitors. Younger healthy persons were free of any medication.
Mean and SD of Demographic and Cognitive Characteristics of AD, MCI, OHC, and YHC Samples
F values and sign. for ANOVA for all measures except gender.
Kruskal–Wallis test.
AD, Alzheimer's disease; CERAD, Consortium to Establish a Registry for Alzheimer's Disease; MCI, mild cognitive impairment; MMSE, Mini-Mental State Examination; OHCs, older healthy controls; SD, standard deviation; sign., significance; YHCs, young healthy controls.
Data acquisition, preprocessing, ICA, and definition of intrinsic brain activity
All subjects underwent structural MRI and 10 min of rs-fMRI, respectively. For rs-fMRI, subjects were instructed to keep their eyes closed and not to fall asleep. We verified that subjects stayed awake by interrogating via intercom immediately after each scan. MRI was performed on a 3-T MRI scanner using 8-channel phased-array head coil (Achieva, Philips, Netherlands). For coregistration, T1-weighted anatomical data were obtained by using a magnetization-prepared rapid acquisition gradient echo sequence (TE=4 ms, TR=9 ms, TI=100 ms, flip angle=5°, FoV=240×240 mm2, matrix=240×240, 170 slices, voxel size=1×1×1 mm3). Rs-fMRI used a gradient echo EPI sequence (TE=35 ms; TR=2000 ms; flip angle=82°; FoV=220×220 mm2; matrix=80×80; 32 slices; slice thickness=4 mm; 0 mm interslice gap).
Standard data preprocessing and analysis steps are described in detail in the Supplementary Data (Supplementary Data are available online at
Subsequently, we performed standard group-ICA of fMRI data (Allen et al., 2011; Calhoun et al., 2009). We decomposed preprocessed rs-fMRI data of all subjects into 75 spatial independent components using a group-ICA framework (Calhoun et al., 2009) implemented in the GIFT-software (
Finally, to specify types of intrinsic brain activity, network time courses were used as estimates of iNA. To define iRA, we performed a seed-based approach. Individual z-maps derived from ICA were analyzed by the use of one-sample t-test across all participants, threshold at p<0.05 family wise error (FWE) cluster level corrected (Fig. 2 and Table 2); peak voxels of significant clusters of networks represent areas of highest FC, and BOLD time courses of spherical ROIs centered on such peaks defined iRA for a total of 55 regions (Table 3). More specifically, time courses of voxels within each ROI were extracted, bandpass-filtered for frequencies ranging from 0.009 to 0.08 Hz, and reduced to an ROI-representative time course by singular value decomposition. For each subject, the global gray matter, white matter, and cerebrospinal fluid (CSF) BOLD-signals were extracted by linear regression analysis.
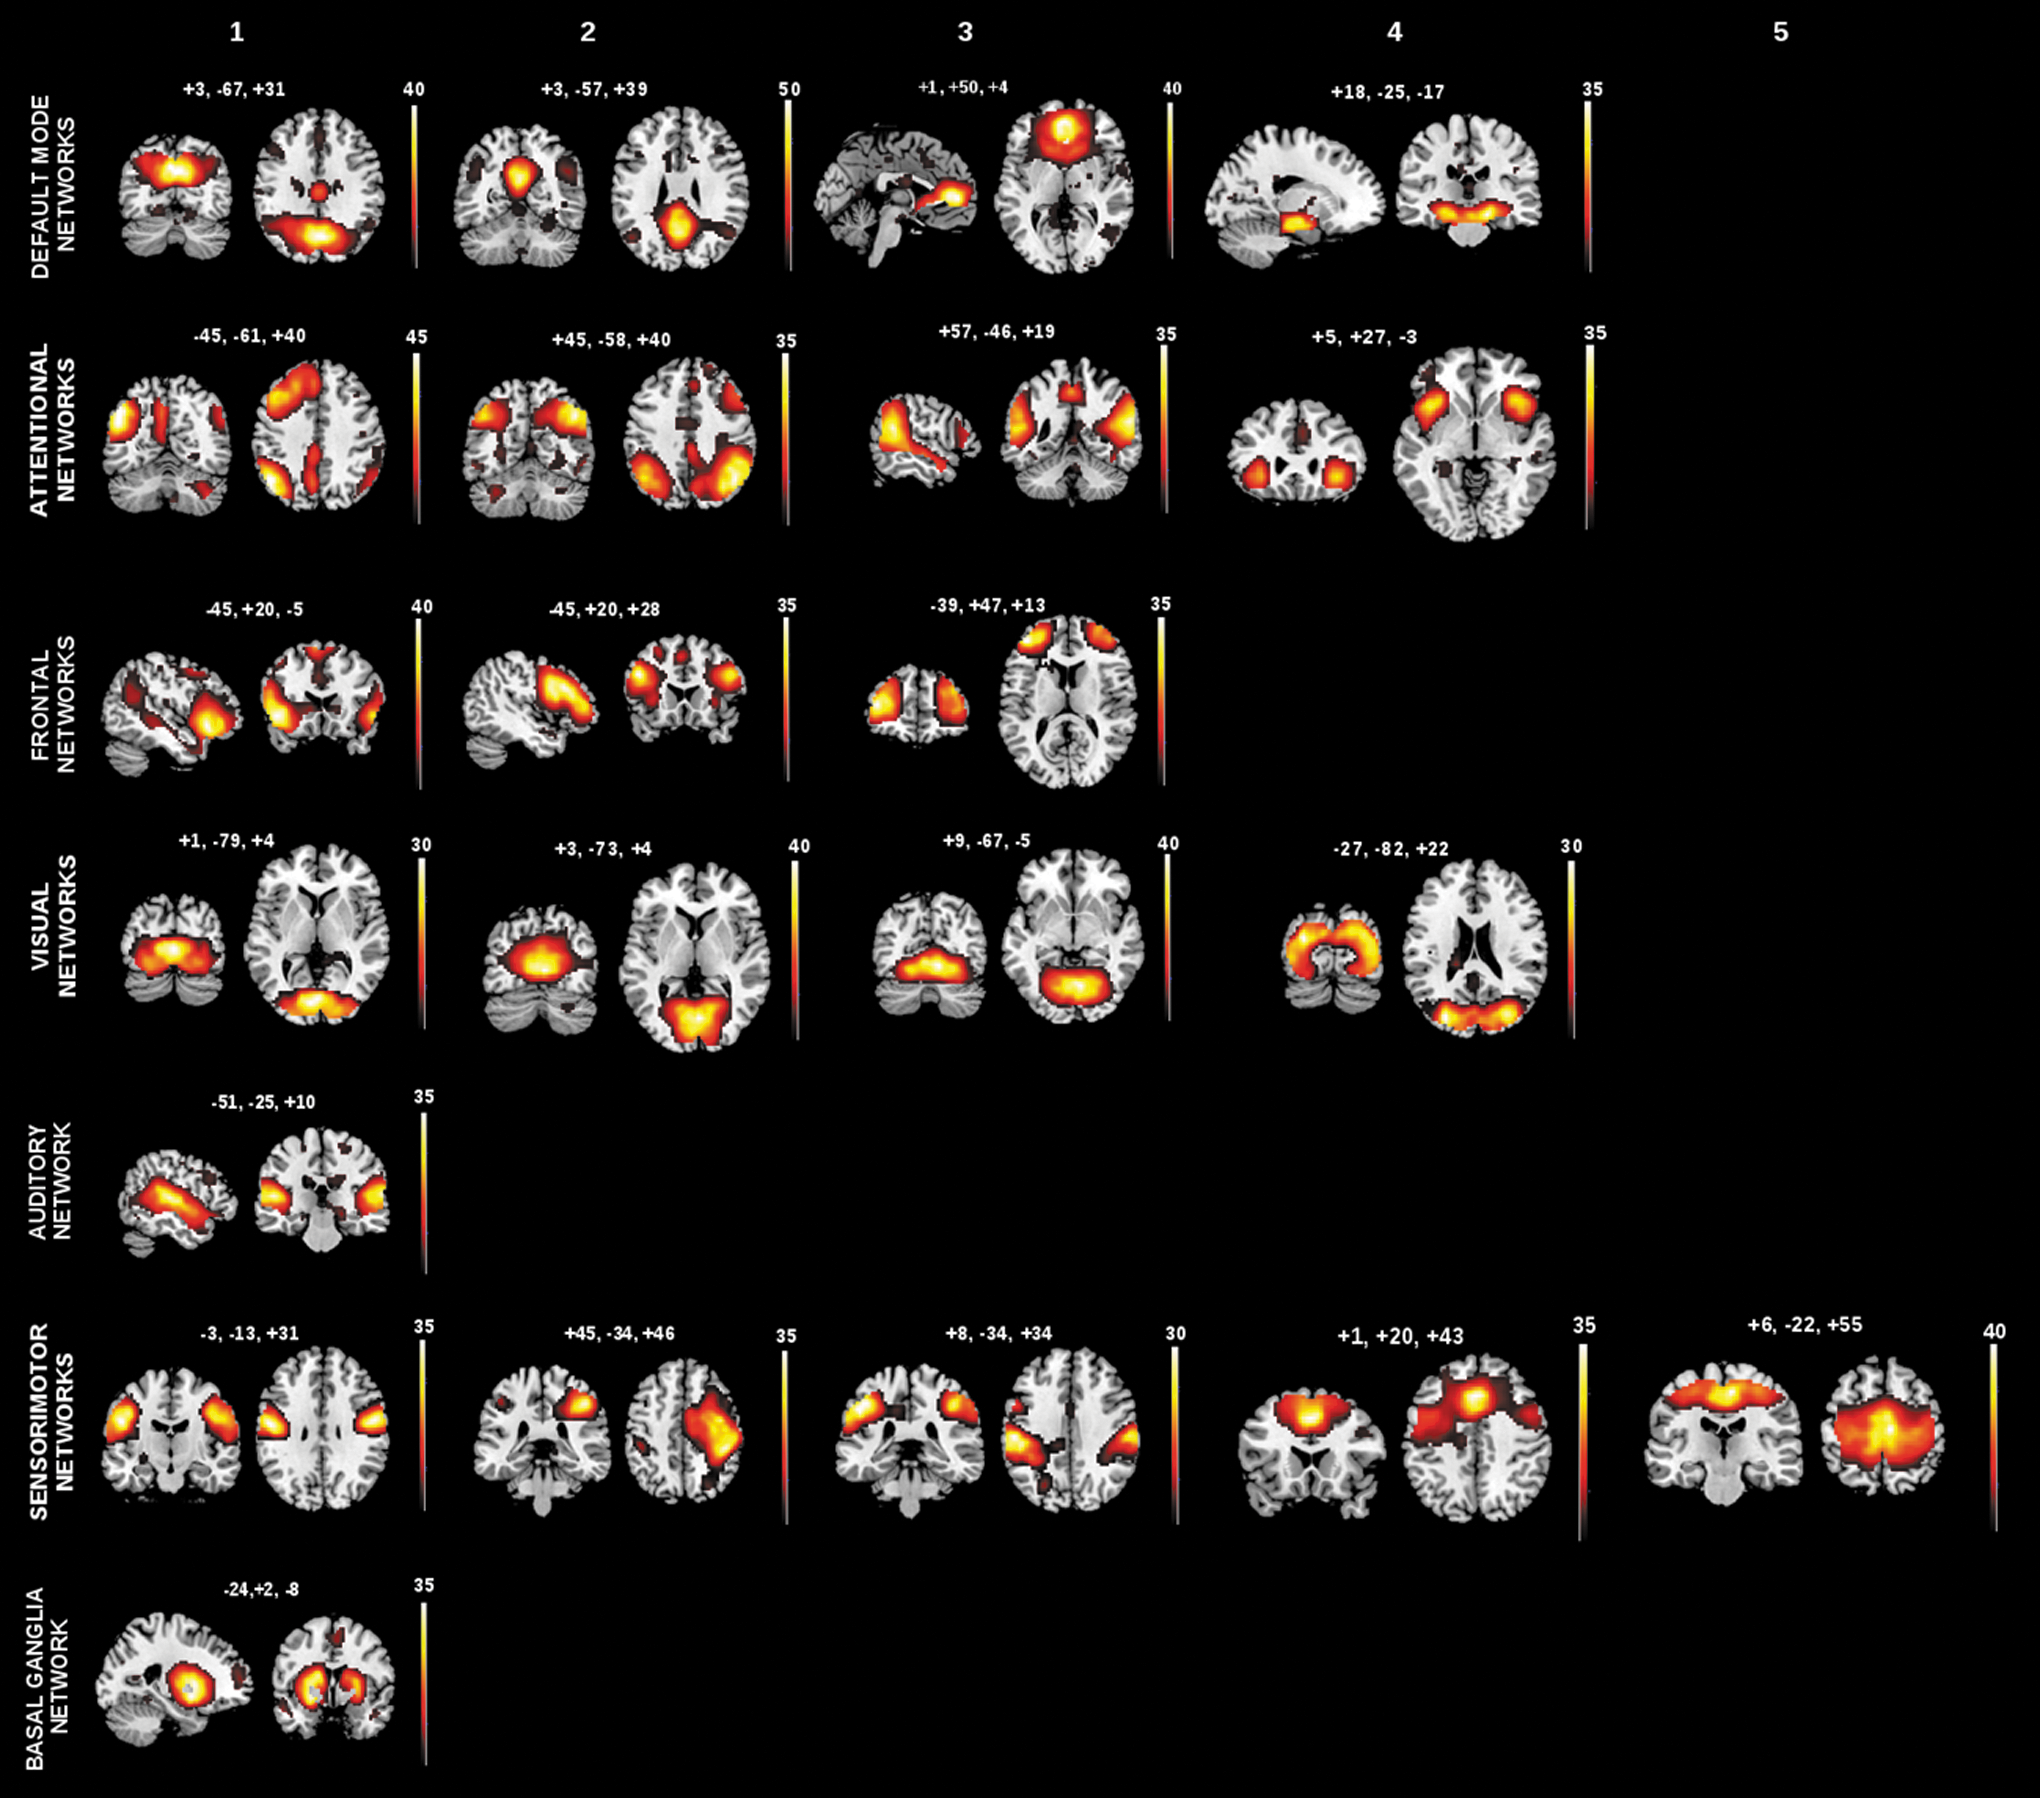
Spatial maps of intrinsic networks. Spatial patterns, derived from spatial ICA of rs-fMRI data from patients with Alzheimer's disease, mild cognitive impairment, OHC, and younger healthy persons. Twenty-two components were identified as intrinsic networks by spatial regression with canonical network templates. Identified intrinsic networks include four default mode networks, four attentional networks, three frontal networks, four visual networks, one auditory network, five somatosensory networks, and one basal ganglia network. Color maps illustrate results of one-sample t-test on the individual back-reconstructed subject component patterns across patients and controls (p<0.05, cluster-level family-wise error corrected). Color maps are superimposed on a single-subject T1 image. Red to yellow scales represent t-values. Color images available online at
Peak Voxels, Coordinates, Anatomical Labeling, and Cluster Size of the Identified 22 Intrinsic Networks
AAL, anatomical automatic labeling; DMN, default mode network; FWE, family-wise error corrected; ROI, regions-of-interest.
Peak Voxels, Coordinates, Anatomical Labeling, and Cluster Size of the 55 Selected Peak Voxels from the Previously Identified 22 Intrinsic Networks
Hierarchical clustering
We used hierarchical clustering (Tan et al., 2008), to investigate the similarity of intrinsic brain activity among groups. Clustering procedure clusters data objects according to the similarity between objects. Hierarchical clustering constructs a dendrogram that visualizes the hierarchical structure of the dataset. A dendrogram is a binary tree where each leaf node represents an object, each inner node represents a cluster of objects, and the root node represents the full dataset. At each level of the tree hierarchy, the two most similar clusters are merged. In the current study, we organized the subjects' individual time series of intrinsic brain activity in four respective groups: YHC, OHC, MCI, and AD. These four groups form clusters, which are the initial data for the further clustering procedure. The leaves of the tree hence do not contain single objects but whole clusters. These clusters are then merged stepwise according to their similarities. As a similarity measure between two clusters, the distance between the clusters is used. The edges between a cluster and its child clusters inside the dendrogram represent these distances. The clustering algorithm starts with the predefined number of clusters, which are the four groups YHC, OHC, MCI, and AD. In the clustering procedure, the distances between the current clusters are calculated and the two clusters with the smallest distance, that is, those with the highest similarity, are merged. This procedure results in a dendrogram, which shows the distances of all groups to each other. After the clustering of the four groups, it is obvious from the dendrogram which groups are most similar to each other and which are dissimilar (Fig. 1A, B). Of 18 possible dendrograms, 6 dendrograms were of particular interest: 2 reflecting increased similarity of healthy aging to patients (Fig. 1A, in blue) and 4 reflecting increased similarity between healthy aging and healthy young (Fig. 1A, in red). The remaining 12 possible dendrograms were considered as not interpretable dendrograms (Fig. 1A, in black), as they bear no interpretable information. To enable a comparison among the four representations, the distances D of each dendrogram were normalized by the maximum distance Dmax
of the respective dendrogram:
Cluster distance based on Euclidean distance
We assessed cluster distance by two different approaches: cluster distance based on the Average Linkage method with the Euclidean distance (Jain and Dubes, 1988) and a model-based approach (Plant et al., 2013) (Fig. 1B). Average Linkage method with the Euclidean distance (Jain and Dubes, 1988) was used to determine the similarity between two clusters (Fig. 1B, right part). This means that the averaged Euclidean distance is calculated between all pairs of elements in the two clusters. As a first step, intrinsic brain activity time series, that is, iRA and iNA, respectively, were separately concatenated within each subject. This resulted in vectors of intrinsic brain activities consisting of Tn×Pn dimensions, where Tn is the number of different intrinsic brain activity time series and Pn is the number of time points. After that, the four initial clusters were created. The distance between two clusters was calculated as the averaged Euclidean distance between all pairs of within-subject's concatenated intrinsic brain activity time series belonging to different groups. The Euclidean distance measures the level of correlation of within-subject intrinsic brain activity across subjects, hence reflecting similarity of inter-subject synchronicity of intrinsic brain activity across groups (van Kesteren et al., 2010). More formally, the distance between two clusters C
1 and C
2 is defined as follows:
where x and y are vector objects reflecting linearized intrinsic brain activity of subjects belonging to different clusters and the Euclidean distance disteuclid
for x and y is defined by
Cluster distance based on linear models
In our model-based approach (Plant et al., 2013), a cluster is represented by a set of linear combinations of intrinsic brain activity time series. The distance between two clusters is defined by the errors resulting from these linear models. This approach is based on the assumption that there exist dependencies among intrinsic brain activity time series. Thus, every univariate time series, t, can be expressed by a linear combination of several other univariate time series, for example, t=0.5t 2+3t 5+t 12+ɛ. The clustering of the subjects is therefore based on these characteristic interaction patterns, which represent FC among networks or regions. All subjects inside one cluster share the same interaction pattern among the time series. Hence, a cluster is defined by a set of mathematical models, β, describing the cluster-specific interaction pattern of intrinsic brain activity.
To get such a model, we first defined the four initial clusters. After that, the time series of iNA (or iRA) derived from the same network (or region) were concatenated across subjects belonging to the same group cluster. We then modeled linear combinations of across-subjects' concatenated time series, reflecting group-specific FC of intrinsic brain activity. More specifically, let cluster C consists of
where
We assume that not all intrinsic activity time series are interacting. Instead, we want to find the major interaction patterns. That is why the number of summands (time series) in the linear combination model is reduced by the use of stepwise selection and the Bayesian Information Criterion (BIC) (Plant et al., 2013). BIC is a method to select the best model as it chooses a balance between the goodness of fit according to the data and the complexity of the model. In our case, BIC punishes models with too many time series. The stepwise selection starts with an empty set of explanatory time series and then greedily adds or removes a time series until the best model according to BIC is found. Using BIC and stepwise selection, a portion of the elements in βi
can be set equal to zero. The model of cluster C is then defined by the final set of
To estimate the distance between two clusters, we apply the cluster models (set of linear combinations) to the single subject's activity time series. We calculate the distance Dc
(Y
*) from subject Y
* to cluster C with model β. More formally, it is as follows:
The resulting mean square error ɛj
reflects the distance of subject Y
* to cluster C, respectively, to the model of cluster C. The distance between two clusters C
1 and C
1 is defined by the averaged cluster distance of all subjects of both clusters, more specifically by computing the error of all subjects of cluster C
1 with respect to the model of cluster C
2 and vice-verse, summing up the squared errors and averaging:
with K 1 :=|C 1| and K 2 :=|C 2|.
In the clustering procedure, the models for every cluster are calculated with the greedy search and BIC at first. After that the two most similar clusters, according to the sum of errors between all objects of one cluster to the other cluster, are merged. The model for the newly generated cluster is recalculated afterward. These steps are performed iteratively until all clusters are merged.
Clustering of intrinsic brain activity from different ensembles of networks/regions
There are different suggestions that favor different networks or regions as being degraded first by AD. For example, some authors suggest the DMN to be affected first (Seeley et al., 2009; Sheline and Raichle, 2013), while others favor hetero-modal areas of high FC including the DMN (Buckner et al., 2009; Jagust, 2012). Uni-modal or subcortical networks, such as sensorimotor or basal ganglia networks, are assumed to be degraded later in the course of AD (Buckner et al., 2009). To test for suggested network/regional vulnerability along the course of AD, we performed clustering for distinct ensembles of networks and regions. Network of interests were networks known to cover hetero-modal areas of high FC; specifically, we used multimodal networks, that is, DMN, ANs, and frontal networks. To test for specificity of similarity clustering, we investigated also unimodal and subcortical networks, that is, sensorimotor, auditory, visual, and basal ganglia networks (Allen et al., 2011) (Figs. 3 –6).
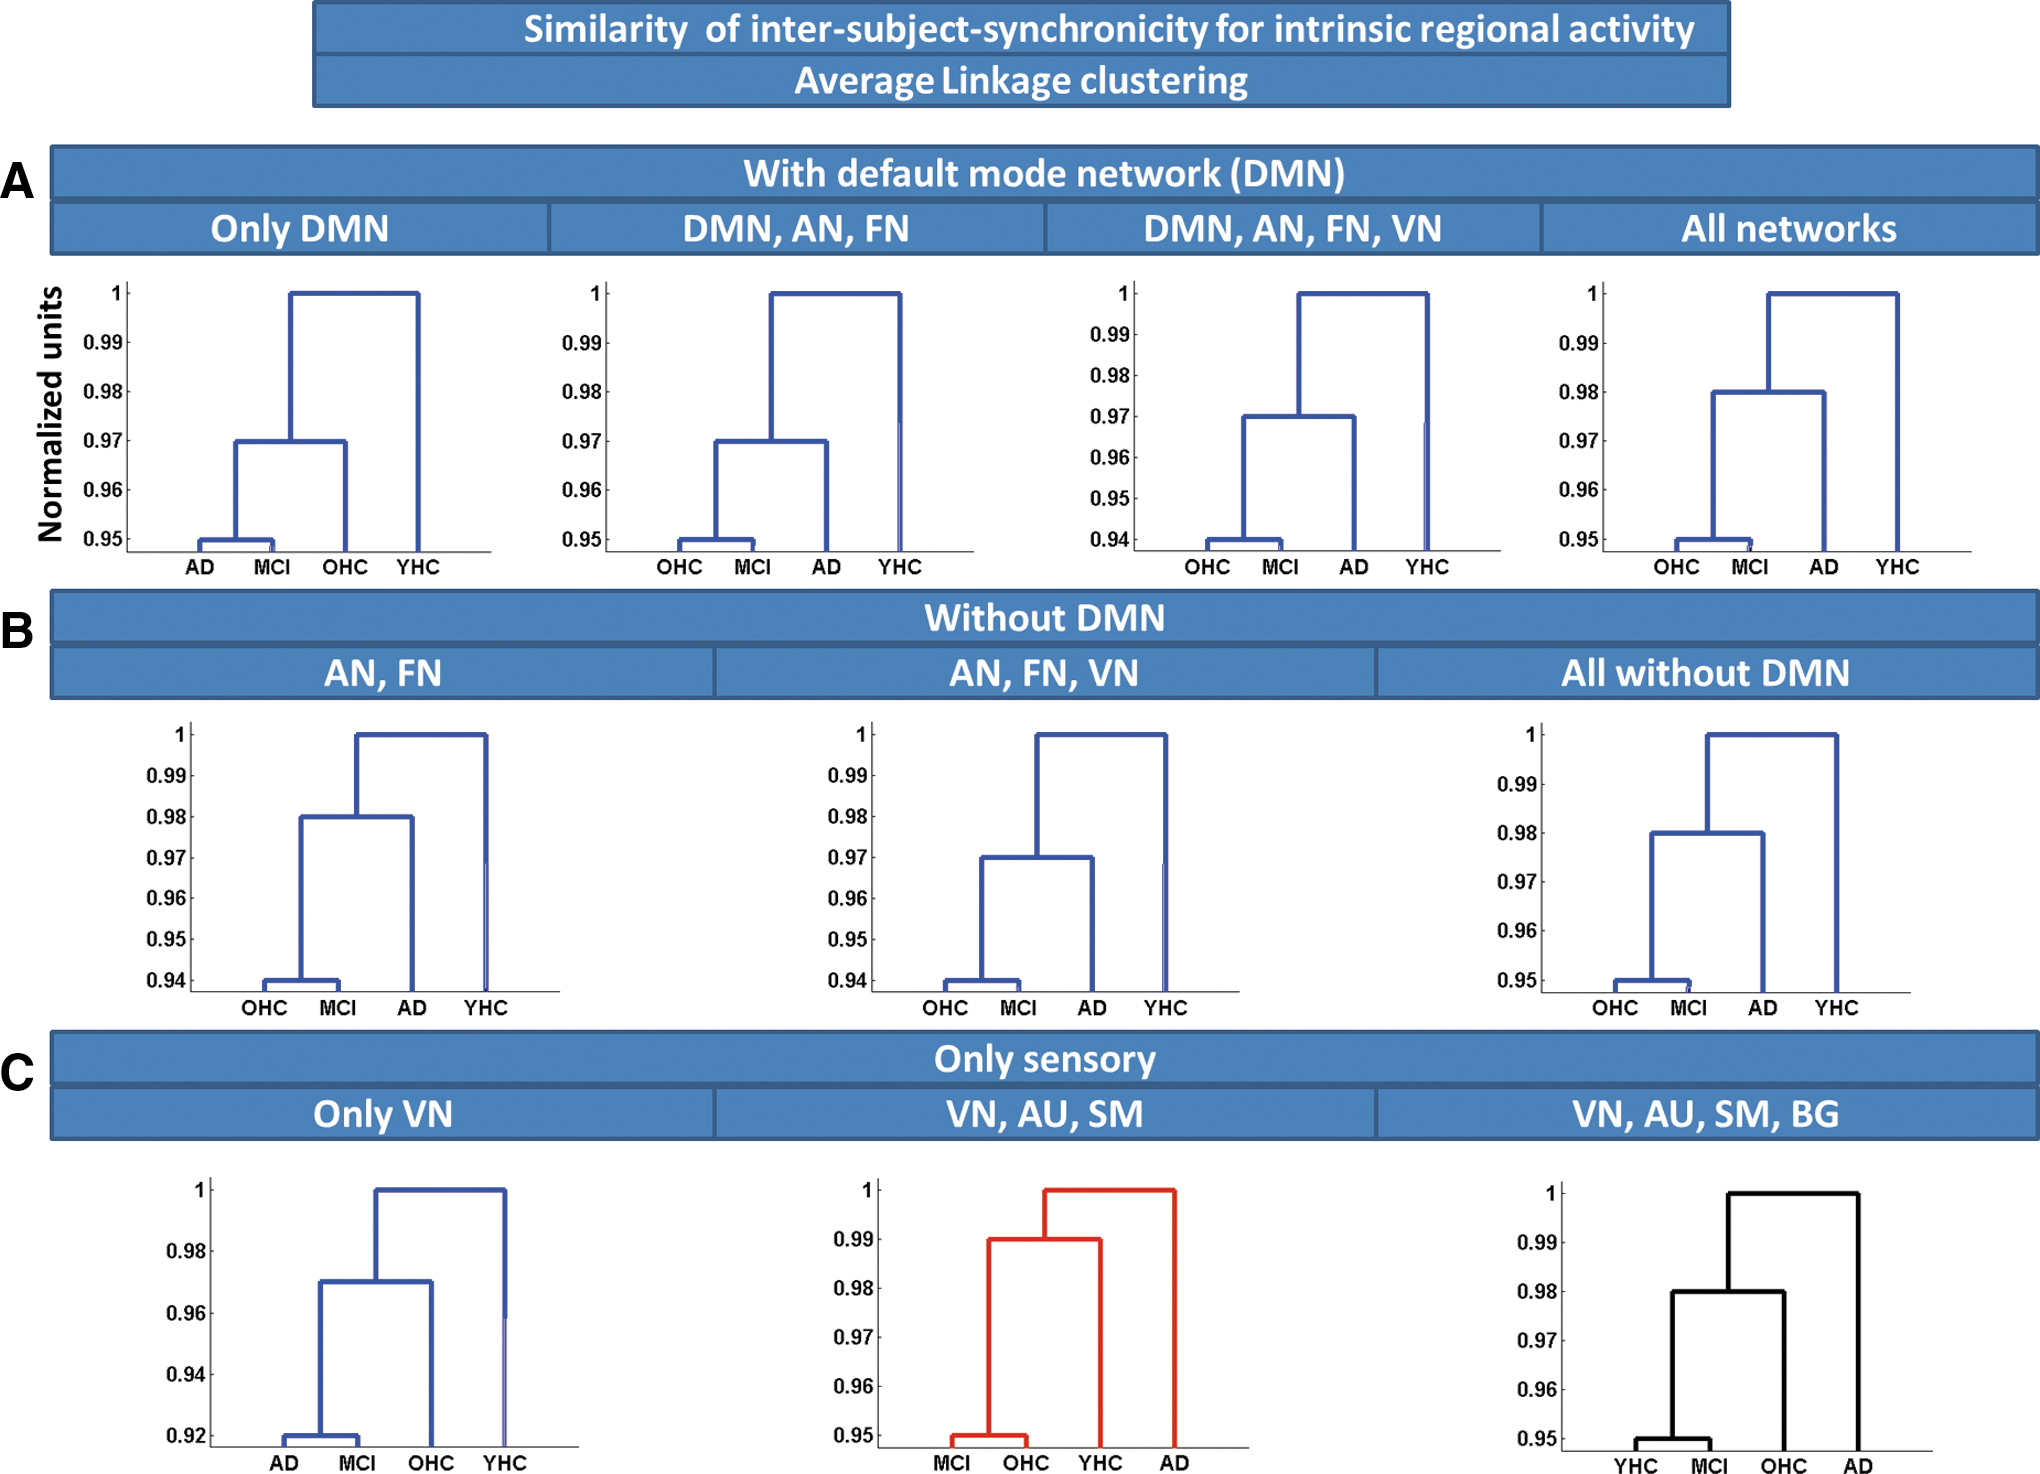
Similarity of ISS for intrinsic regional activity, estimated by Average Linkage clustering. Average Linkage clustering based on Euclidean distance was used to estimate similarity of ISS for intrinsic regional activity across groups of subjects. Clustering was applied on different regional ensembles:
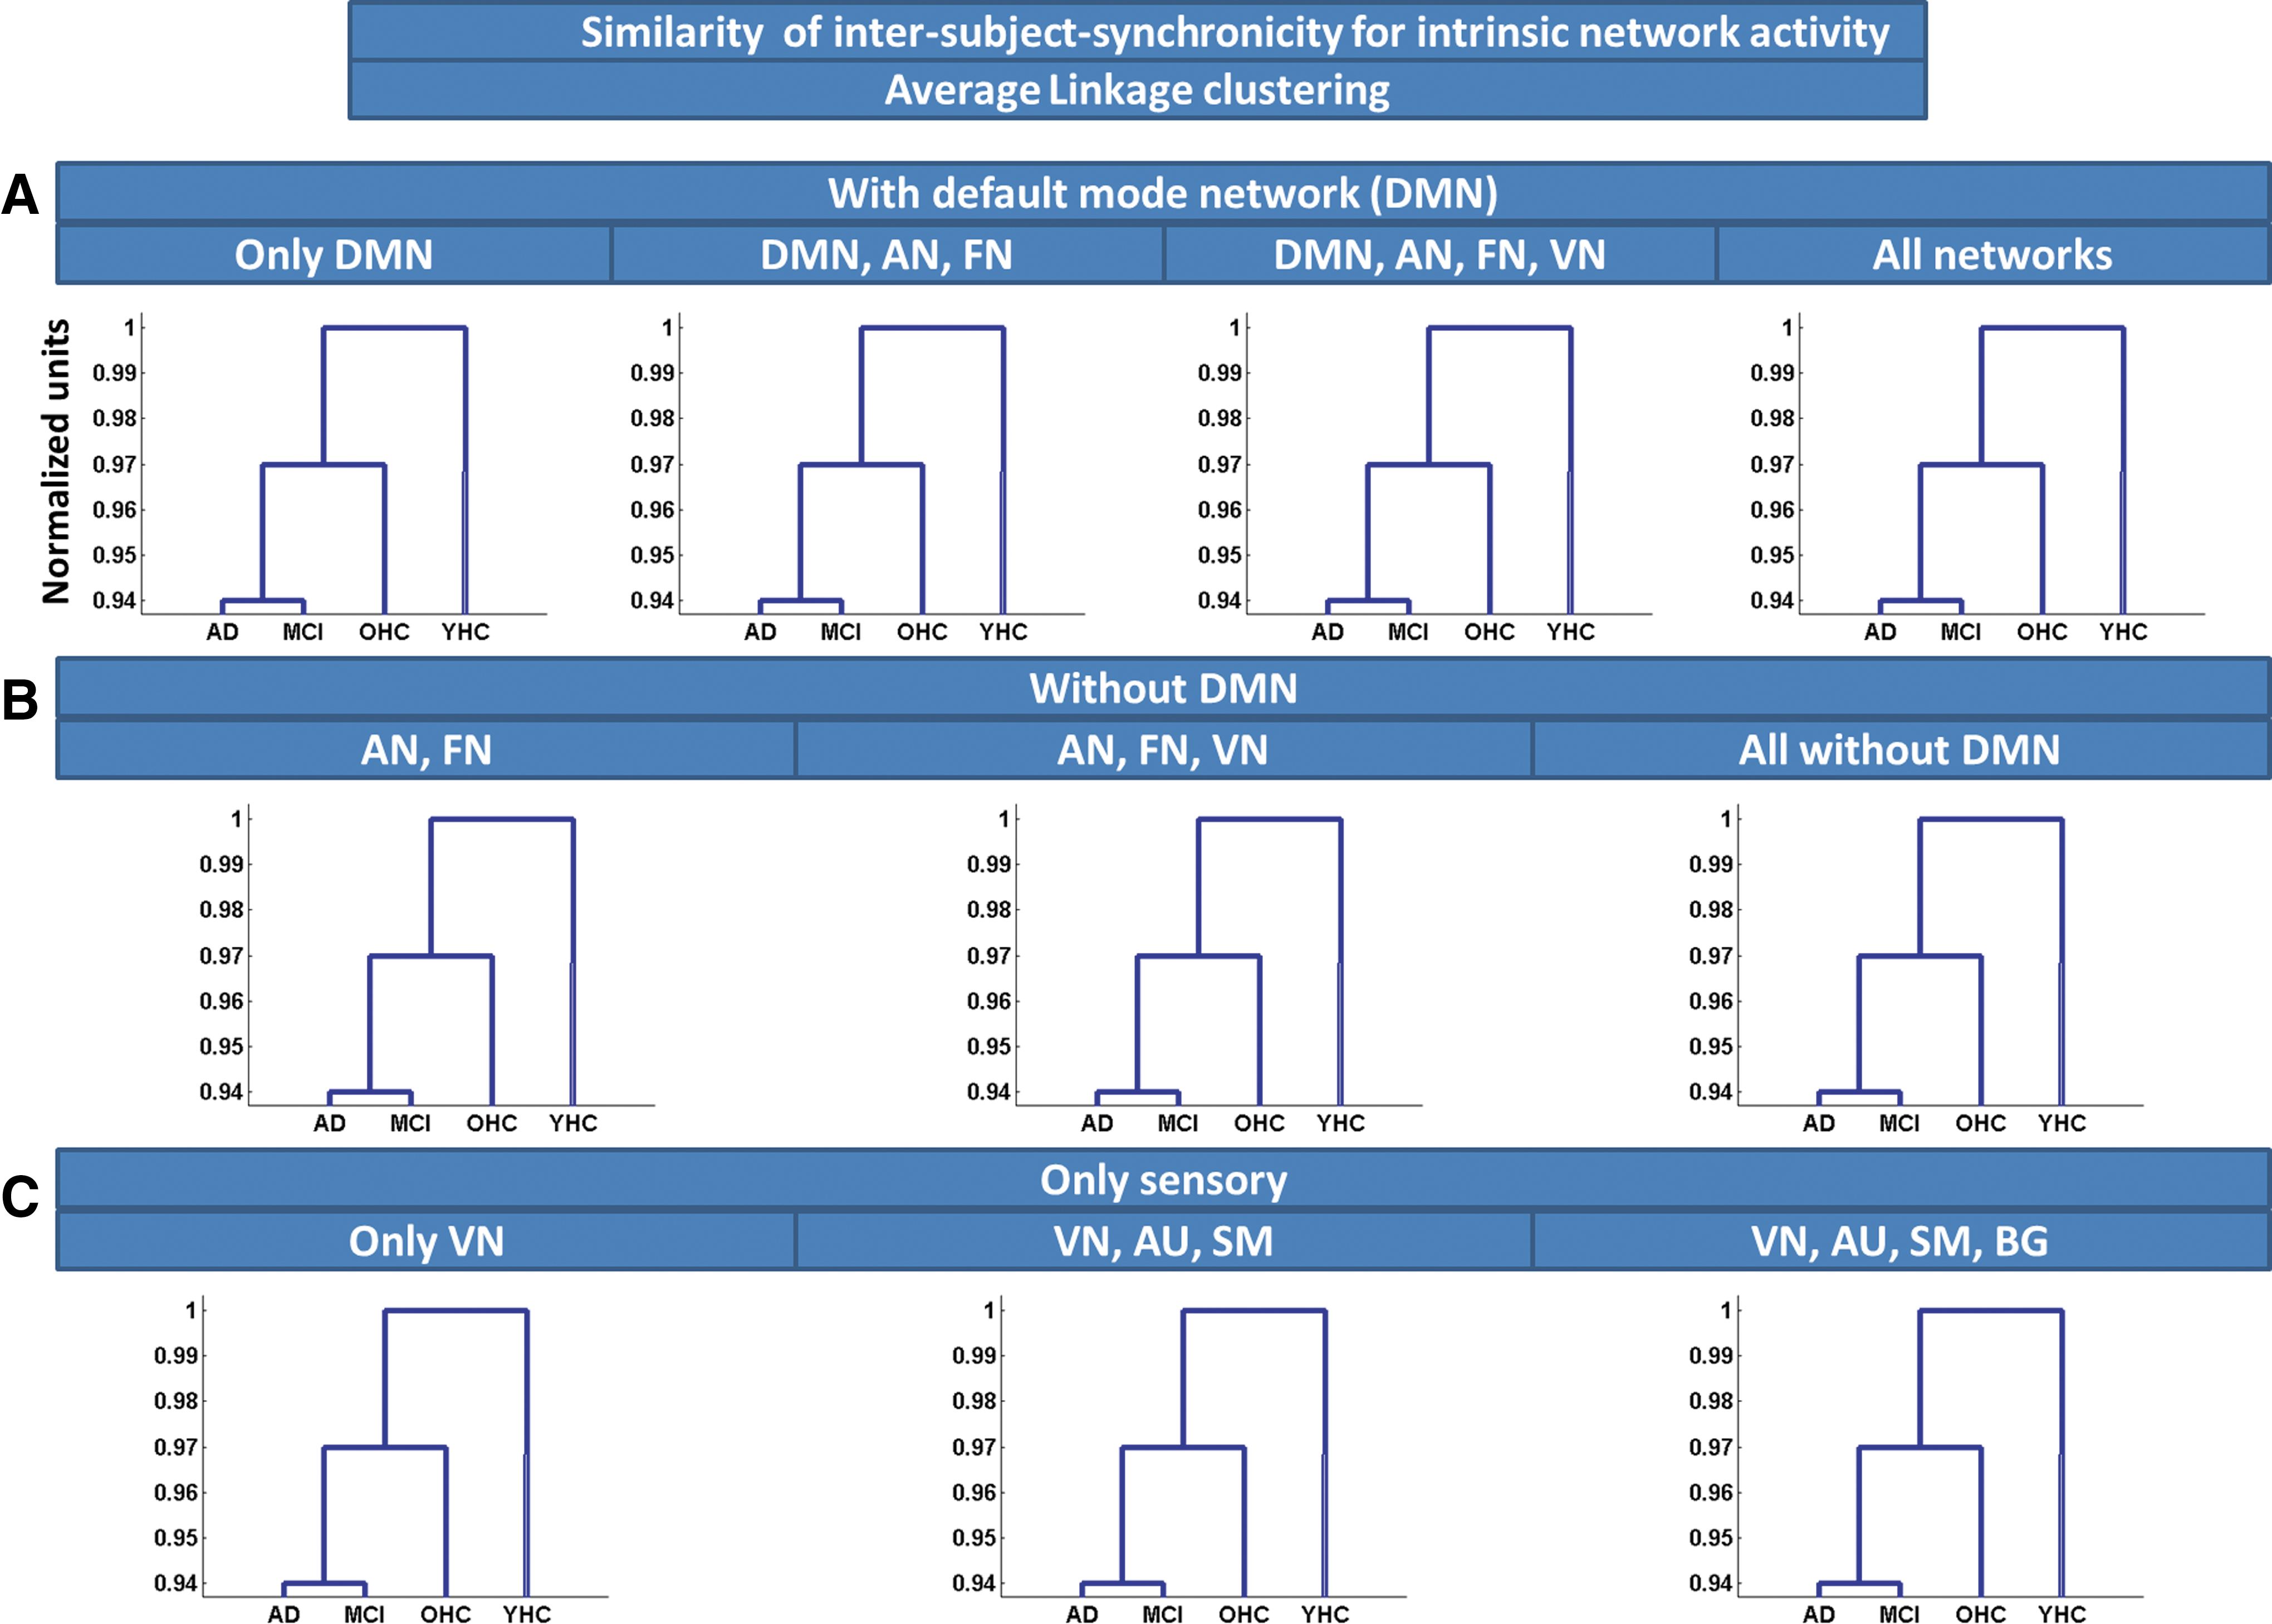
Similarity of ISS for iNA, estimated by Average Linkage clustering. Average Linkage clustering based on Euclidean distance was used to estimate similarity of ISS for iNA across groups of subjects. Clustering was applied on different network ensembles:

Similarity of FC among intrinsic regional activity, estimated by model-based clustering. Model-based clustering based on linear combinations of time courses was used to estimate similarity of FC among intrinsic regional activity across groups of subjects. Clustering was applied on different regional ensembles:
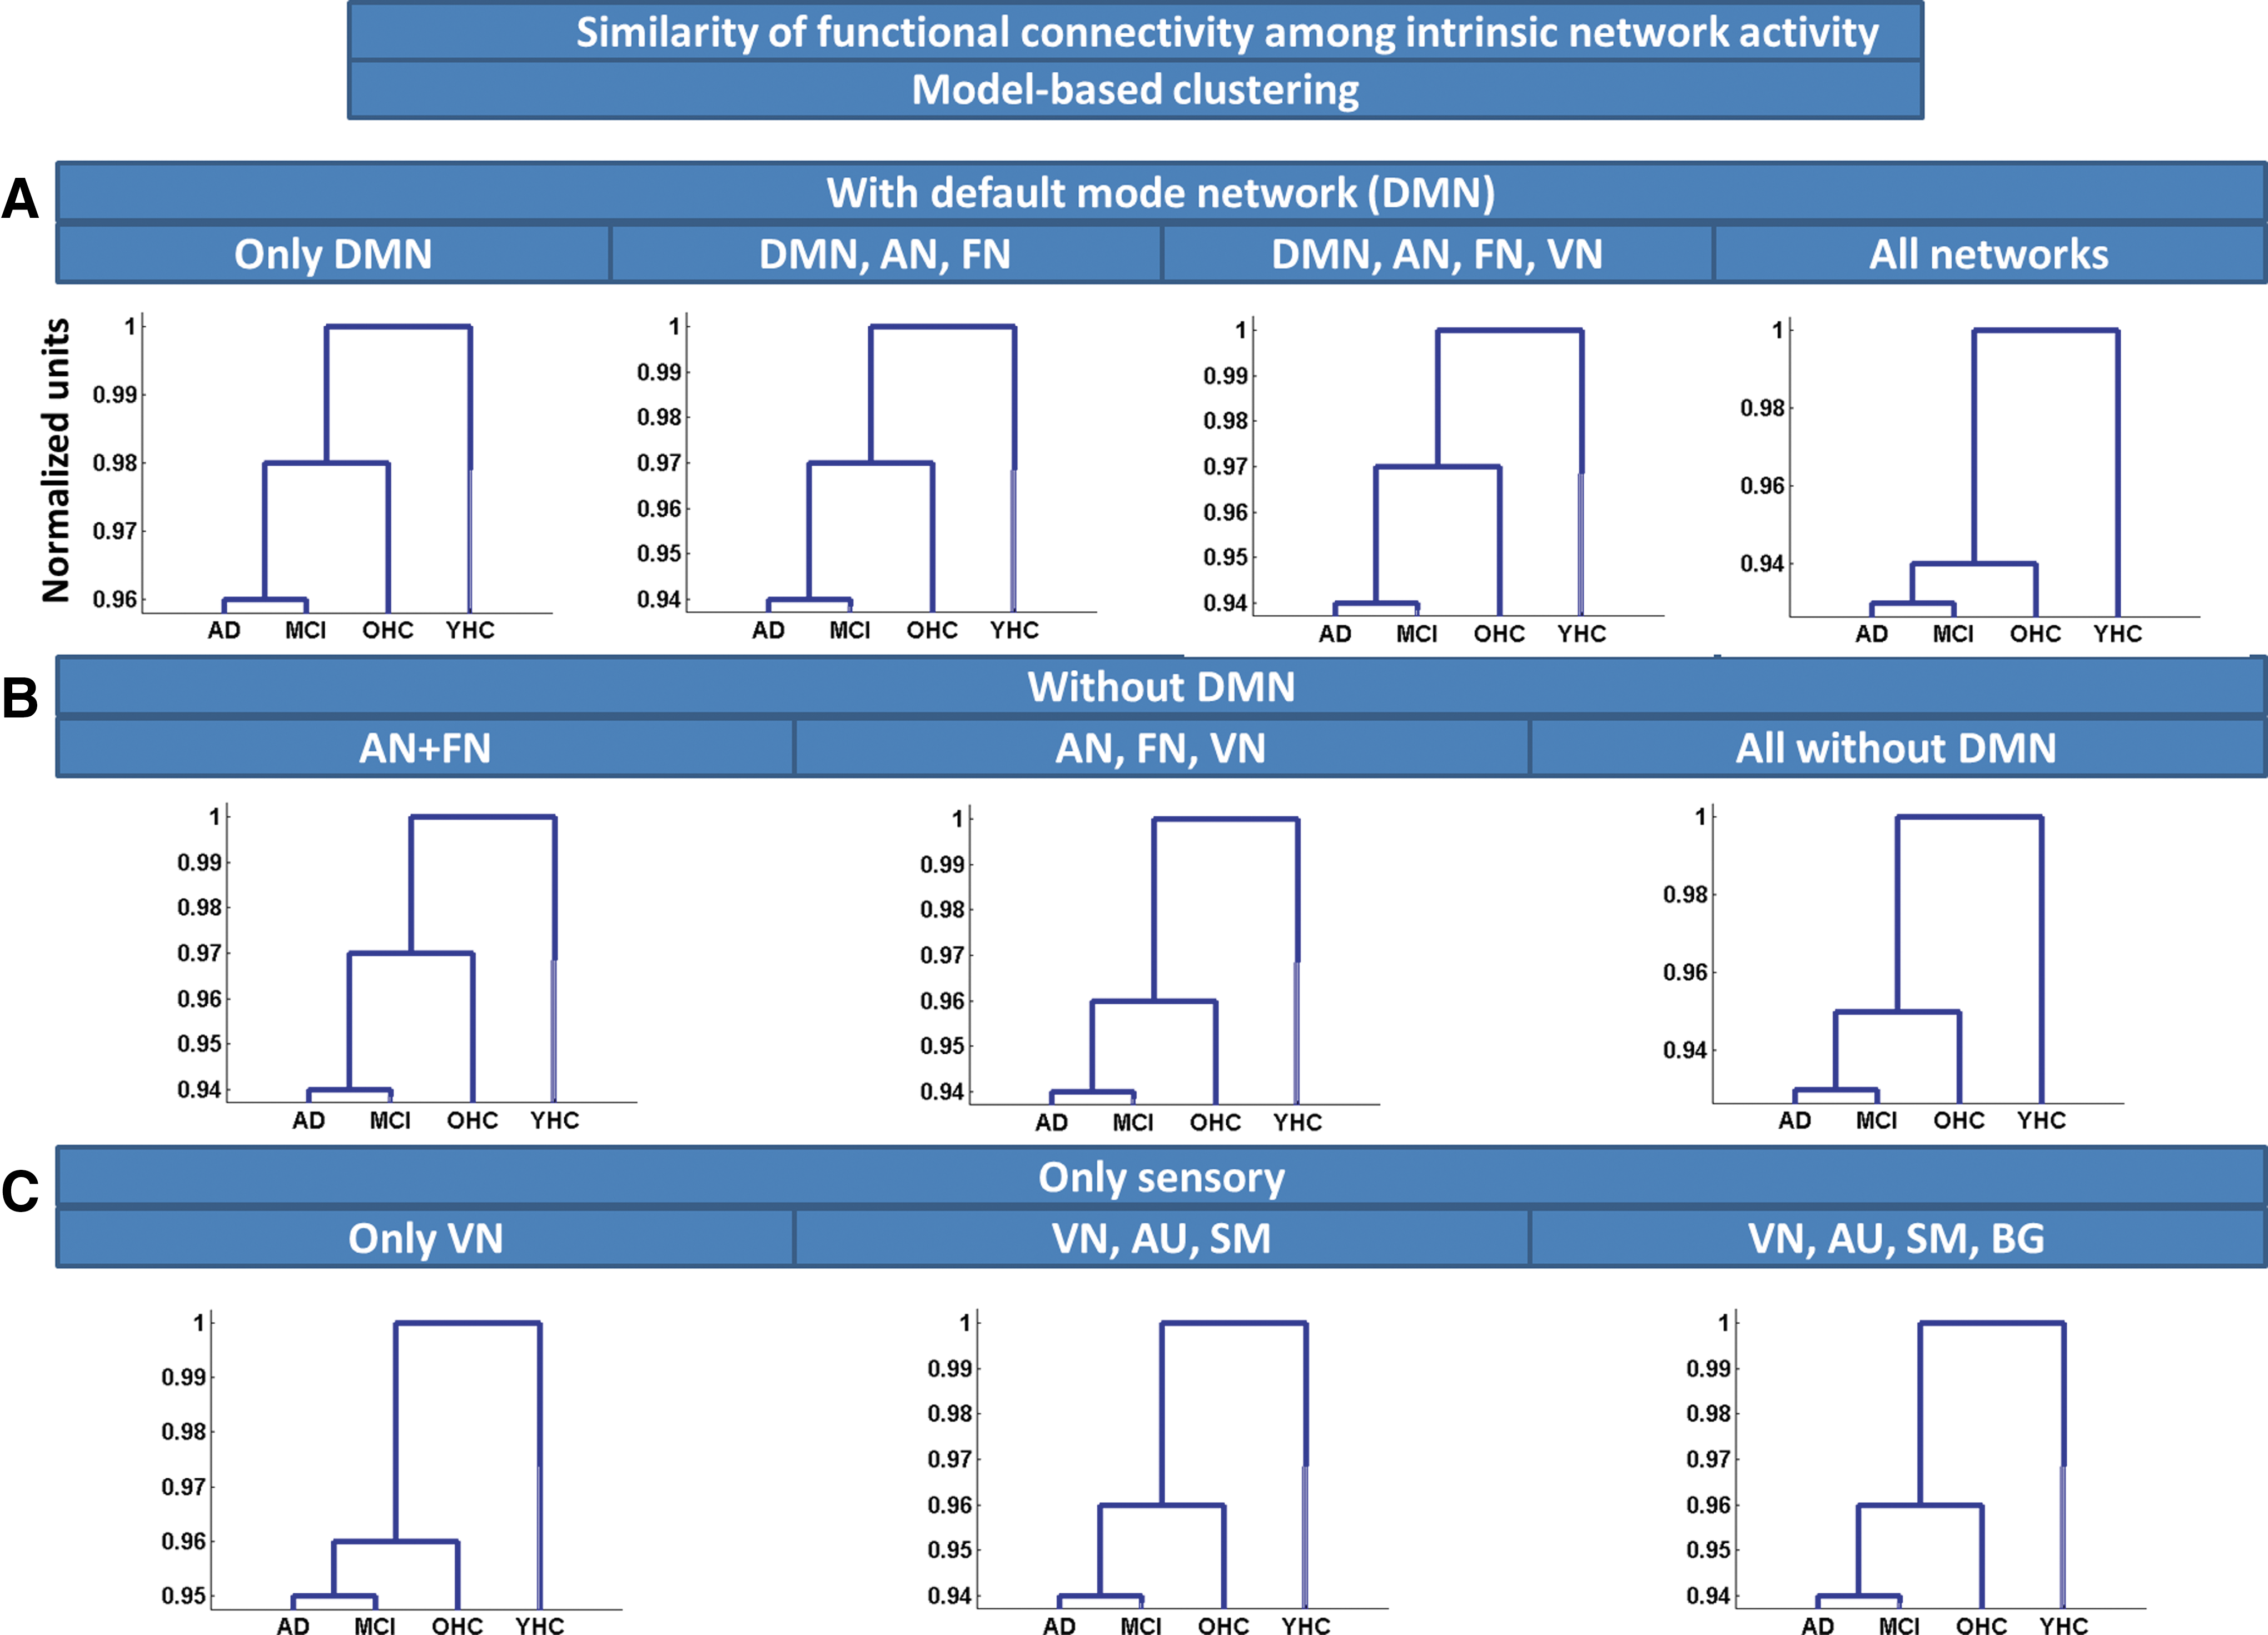
Similarity of FC among iNA, estimated by model-based clustering. Model-based clustering based on linear combinations of time courses was used to estimate similarity of FC among iNA across groups of subjects. Clustering was applied on different network ensembles:
Finally, to control statistically whether output dendrograms of clustering were biased by other factors than input, we used nonparametric control testing by randomly labeling individual subject's time series across clusters for 10,000 permutations. As described previously, there are 18 possible dendrograms. This means that every dendrogram is expected to have an occurrence probability of
Results
ICA of rs-fcMRI data across all subjects with model order 75 revealed 22 intrinsic networks of interest by the use of automated network selection based on previously described network maps (Allen et al., 2011). Networks include four DMN, four attentional, three frontal, four visual, one auditory, five sensorimotor, and one basal ganglia subnetworks, consistent with previous studies (Allen et al., 2011) (Fig. 2 and Table 2; Table 3 for 55 peak voxels of significant clusters; p<0.05, FWE cluster-level corrected). DMN covered retrosplenial cortex and medial prefrontal cortices (PFCs); attention networks covered mainly lateral prefrontal and temporoparietal cortices, such as dorsolateral PFC and inferior and superior parietal cortices; frontal networks covered lateral and medial PFCs; visual networks were located in medial and lateral occipital cortices; the sensorimotor networks were centered around primary somatosensory and motor cortices; and the basal ganglia network covered the striatum and thalamus.
Similarity of ISS estimated by Average Linkage clustering
To estimate similarity of ISS (van Kesteren et al., 2010) across groups, we applied Average Linkage clustering based on Euclidean distance on different ensembles of iRA (Fig. 3 and Supplementary Table S1) and iNA (Fig. 4 and Supplementary Table S2), respectively. For iNA, OHCs were consistently more similar to patients than to young healthy participants, indicating increased similarity of ISS between patients and older persons. Clustering output was independent from chosen network ensembles (Fig. 4A–C). Average Linkage clustering of iRA revealed a similar pattern; that is, OHCs were more similar to patients than to young healthy persons (Fig. 3A–C). For primary networks' iRA, OHCs were clustered nearer to younger healthy controls than to patients (Fig. 4C).
Similarity of FC estimated by model-based clustering
To estimate similarity of intrinsic FC via linear combinations of activity time courses, we applied model-based clustering of iRA and iNA, respectively. For iNA, OHCs were more similar to patients than to young healthy persons, suggesting increased similarity of FC between patients and elderly persons. Clustering output was independent from chosen network ensembles (Fig. 6A–C and Supplementary Table S3). Model-based clustering of iRA revealed a similar pattern, with OHCs being more similar to patients than to young healthy participants (Fig. 5A–C and Supplementary Table S4; only one exception for the DMN, see Fig. 5A).
Discussion
To investigate the similarity of intrinsic brain activity along aging and AD, we applied rs-fMRI and hierarchical clustering in healthy younger and older persons and patients with MCI and AD-dementia. Independently of measures or regional sources of intrinsic activity, intrinsic activity of older persons resembled more that of patients than that of younger persons. Our results provide evidence for the larger similarity of intrinsic brain activity of healthy 70-year persons with that of patients with or at risk for AD than with that of younger persons, potentially due to a significant proportion of pre-clinical AD cases in the group of healthy older persons. Further, data link aging and AD with intrinsic brain activity, supporting the view that lifespan intrinsic activity may contribute to the pathogenesis of AD.
Intrinsic activity of 70-year-old healthy persons resembles more that of patients with or at risk for AD of equal age than that of younger persons at age of 25 years
Hierarchical clustering revealed that intrinsic brain activity of healthy older persons of about 70 years is consistently more alike that of patients with MCI or AD-dementia of equal age than that of healthy younger persons of about 25 years (Figs. 3 –6). This result is independent from both the investigated type of intrinsic activity and its specific regional sources. (i) Type of intrinsic brain activity. We investigated four different aspects of intrinsic activity. Basically, we distinguished between regional and intrinsic network-related activities. iNA was defined by intrinsic network time courses that were derived from spatiotemporal components of an ICA of fMRI data, while iRA was defined directly by BOLD-signals from selected ROI. Further, both iRA and iNA were analyzed in two different forms. First, ISS (van Kesteren et al., 2010) of time courses directly reflecting region's (or network's) intrinsic activity (Figs. 3 and 4); ISS was analyzed for similarity across subjects by the use of Euclidean distance clustering (Jain and Dubes, 1988). Second, linear combinations of time courses reflecting several regions' (or networks') inter-regional (or inter-network) intrinsic FC (Figs. 5 and 6); such linear combinations were analyzed for similarity across subjects by the use of model-based clustering (Plant et al., 2013). One should note that beyond pair-wise FC of two networks (or regions), linear combinations of several networks' (or regions') time courses enable us to represent graphs of networks (or regions) of larger length than two; this means that our clustering approach based on such linear combinations is sensitive for group dissimilarities in graphs of larger length. (ii) Regional or network-related ensembles. Previous studies in pre-clinical AD indicate that both the DMN and hetero-modal areas of high FC are affected by Aβ-pathology in first (pre-clinical) stages of AD (Buckner et al., 2009; Drzezga et al., 2011; Jack et al., 2013; Jagust and Mormino, 2011; Sheline et al., 2010; Sperling et al., 2009). Indeed, for most (except of one see Fig. 5) regional or network-related ensembles overlapping with the DMN or hetero-modal areas of high FC, we found that older persons' intrinsic activity was more alike that of patients than that of younger controls (Figs. 3 –6). Beside one contradictory exception, we found a similar result also for ensembles covering only primary and subcortical areas, suggesting that intrinsic activity of elderly is in general more similar to patients than that to younger persons. An explanation for similarity of primary and subcortical networks might be that these networks are not strongly affected by early AD, therefore being similar in its intrinsic activity to that of cognitively normal persons of the same age. Taken together, our data provide consistent evidence for larger similarity of intrinsic brain activity of healthy 70-year persons with that of patients with AD of the same age than with that of younger persons at age of about 25 years.
Implications for pre-clinical AD and lifespan intrinsic activity
AD is essentially related with Aβ-pathology (Selkoe, 2002), which seems to start about 20–30 years before first symptoms arise (Bateman et al., 2012; Jack et al., 2013). For example, Bateman et al. (2012) estimated—based on CSF Aβ-peptide levels for familial AD cases over two generations—the onset of Aβ-pathology for a period of about 25 years before first symptoms arise. Since during older age the prevalence of AD-dementia doubles all 5 years with almost half of 90-year-old persons suffering from AD-dementia, our sample of 70-year-old cognitively normal persons may include a significant proportion of pre-clinical AD cases. There is convincing evidence for substantial interaction between Aβ-pathology and intrinsic activity and connectivity both at micro- and large-scale level (Buckner et al., 2005; Busche et al., 2008; Drzezga et al., 2011; Jagust and Mormino, 2011; Palop and Mucke, 2010; Sheline et al., 2010; Sperling et al., 2009). Therefore, our finding of stronger similarity for intrinsic activity between elderly and patients instead of between elderly and younger participants suggests a relevant portion of pre-clinical AD cases with significant Aβ-pathology in our sample of healthy older participants.
For the groups of older participants with and without cognitive impairments, mean age was comparable, suggesting that groups differed specifically for the presence of symptomatic AD. When considering observed larger similarity between older persons, MCI patients, and AD patients compared with younger persons, our data suggest that the transition from healthy aging to AD-dementia has a smaller effect on intrinsic brain activity than lifespan aging. This finding links aging and AD with intrinsic brain activity and is consistent with the view that lifespan intrinsic activity may contribute to the pathogenesis of AD. When additionally accounting for previous findings about mechanistic links between intrinsic activity and Aβ-pathology (Buckner et al., 2009; Busche et al., 2012; Dickerson and Sperling, 2009; Drzezga et al., 2011; Jagust and Mormino, 2011; Palop and Mucke, 2010), our data suggest that lifespan intrinsic activity may be relevant for Aβ-pathogenesis. To test this idea, further studies that investigate explicitly Aβ-pathology and intrinsic activity across aging are necessary.
Study limitations
Our study has several limitations. First, since there were no data available about Aβ-status of participants particularly of asymptomatic older persons, we are not able to estimate the amount of pre-clinical AD cases based on Aβ-peptide CSF levels or PiB-PET status. Future studies that include molecular imaging via PET or CSF-biomarkers are necessary for more precise analysis. Second, our analysis of similarity along age and AD for intrinsic activity focused on younger persons at age of 25 years; that is, we compared the effects of aging for the period of 25–70 years with the effect of symptomatic AD at 70 years on intrinsic activity. However, to compare effects of aging and AD in more fine-tuned way, it would be important to test whether the same pattern of results holds also for younger healthy people at age of 40 or 50 years. Further studies including persons of wider age range are necessary to test the hypothesis of lifespan intrinsic activity effects on AD pathogenesis in a more detailed way. Third, patients with AD-dementia were medicated by cholinesterase inhibitors representing potential confounding effects on group comparisons (Pa et al., 2013). However, we found similar results for untreated MCI patients, suggesting the reliability of our findings for patients with AD-dementia. Fourth, increasing atrophy along age and progressive AD may confound group comparisons for intrinsic activity. Simple adding of brain volumes as covariate-of-no-interest (as in classical statistics, e.g., two-sample t-tests) is not possible for clustering procedures. Therefore we dispensed with explicit atrophy correction. Alternatively, we included a larger amount of regions/networks in analyses, which are known to be affected differentially by atrophy along aging and AD [e.g., primary sensorimotor areas versus the DMN (Braak and Braak, 1991; Buckner et al., 2005)], and asked for consistent findings across these differentially affected areas/networks. Since our findings were consistent across different areas/networks and of comparable strength, we suggest that atrophy effects on intrinsic activity may not be the critical driving factor of dissimilarity across groups. Notwithstanding, our results have to be carefully interpreted with respect to potential influences of brain structure changes. Finally, our measures of intrinsic activity are essentially relying on the BOLD signal. Caution is advised when comparing BOLD-signals across different groups, as observed differences might arise from altered neurovascular coupling and not from different neuronal activity across groups (D'Esposito et al., 2003). So far, we cannot exclude that AD and aging-related effects on neurovascular coupling instead of effects on neuronal activity account for the observed dissimilarity in intrinsic brain activity between elderly and AD.
Conclusion
Intrinsic brain activity of healthy elder persons resembles more that of patients with AD than that of healthy younger persons. This finding suggests a significant proportion of pre-clinical AD cases in the group of cognitively normal older people. The link of aging and AD with intrinsic brain activity supports the view that lifespan intrinsic activity may contribute critically to the pathogenesis of AD.
Footnotes
Acknowledgments
This work was supported by the German Federal Ministry of Education and Research (BMBF 01EV0710 to A.M.W. and 01ER0803 to C.S.), the Alzheimer Forschung Initiative (AFI 08860 to V.R. and 12819 to C.S.), the Kommission für Klinische Forschung of the Klinikum rechts der Isar der Technischen Universität München (KKF 8765162 to C.S.), and the Helmholtz Young Investigators Groups Program. The authors are grateful to the participants of the study and the staff of the Department of Psychiatry and Neuroradiology for their help in recruitment and data collection.
Author Disclosure Statement
The authors declare no competing financial interest.
References
Supplementary Material
Please find the following supplemental material available below.
For Open Access articles published under a Creative Commons License, all supplemental material carries the same license as the article it is associated with.
For non-Open Access articles published, all supplemental material carries a non-exclusive license, and permission requests for re-use of supplemental material or any part of supplemental material shall be sent directly to the copyright owner as specified in the copyright notice associated with the article.