
Abstract
The brain's default mode network (DMN) has attracted tremendous attention, but its topology still lacks a substantial and operative definition. At the same time, recent efforts based on coactivation analysis suggest significant involvement of concomitant activation as an origin of synchronous activity, which is the basis of the network detection. Therefore, to establish the biological significance of the intrinsic remote connectivity, understanding such co-occurrence networks may be crucial. This study shows the results of monitoring the network's signal variation during random transitions among two divergent tasks and rest epochs. The subset of the DMN nodes showed three distinct activity levels; it was simultaneously characterized by the lack of a transition response between blocks. Additional connectivity analysis revealed components covering the other DMN nodes showing overshooting in response to a transition that were still connected to the posterior cingulate cortices (PCC), but by different signal components. The overall finding of multiple connectivity modes in the DMN provides a relevant explanation about the two seemingly contradictory characteristics of the network, robustness and variation.
Introduction
The concept of the default mode network (DMN) originated by the recognition of a group of brain areas that were found to be deactivated during many tasks (Raichle et al., 2001; Shulman et al., 1997). Their activity level was negatively correlated with task demand, suggesting the spontaneous nature of the underlying process (Mason et al., 2007; Singh and Fawcett, 2008). Thus, although the original concept of DMN was based on the cognitive subtraction method, that is, simple comparison of signal levels, a considerable number of present studies employ inter-regional connectivity to identify biomarkers or neural substrates. This approach originates from the discovery of an activity tightly synchronized across subcomponents (Fox et al., 2005b; Fransson, 2005), observable even under anesthesia (Vincent et al., 2007) that lead to an extensive research on large-scale functional connectivity in general.
Ever since functional connectivity between regions was first measured by correlation (Biswal et al., 1995), synchronization has played a major role in finding a connection between brain nodes using functional magnetic resonance imaging (fMRI). This approach allowed extremely consistent detection of the network, but it also introduced some variation in the DMN anatomy. For example, inclusion of the anterior cingulate cortex (ACC), whose rostral part (rACC) often coincides with the cluster margin, is still vague despite its pivotal role in executive function (Margulies et al., 2007; Polli et al., 2005). The rACC is explicitly included in DMN by some authors (Gili et al., 2013; Polli et al., 2005), but not others, because the cluster was either described as medial prefrontal cortex (MPF) (Boly et al., 2007) or not extending to the rACC. Another marginal region, the precuneus or Brodmann area (BA) 7 m has been excluded from DMN in an extensive review (Buckner et al., 2008), while some authors have argued the importance of the precuneus as a DMN member (Utevsky et al., 2014). Such discrepancy is regularly found across connectivity studies, reflecting a lack of a unique definition of DMN, pointed out by authors (Margulies et al., 2009).
The present study, extending our previous report on a small number of subjects (Aso and Fukuyama, 2012), is in accordance with the recent efforts to explore coactivation networks to confirm the fundamental rationale behind functional connectivity MRI (fcMRI) (Crossley et al., 2013; Laird et al., 2013). These studies reported a significant overlap between the coactivation and connectivity networks, which suggests the involvement of coactivation in the fcMRI. However, some differences underscoring contribution of intrinsic connectivity were observed in the latter. Given that the main target of the fcMRI studies is intrinsic connectivity between important regions, and that mere coactivation does not logically imply connection, delineating those two would be essential in establishing the biological significance of functional connectivity.
In the present study we applied both a general linear model (GLM)-based approach and a typical data-driven approach to a task-loaded fMRI dataset designed to fluctuate the DMN both positively and negatively. This approach helped in classifying the components, that is, the network connections, by the response property. The results revealed one main DMN core network and two subnetworks, each still connected to the posterior cingulate cortices, providing clues to unexplained DMN features.
Materials and Methods
Subjects
Before the experiment, participants suffering from any medical, neurological, or psychiatric illnesses, or those taking any prescription medications were excluded. Twenty healthy subjects (15 males and 5 females; age range 18–33 years) were enrolled; the data from one subject were eliminated from subsequent analyses because of tiredness during the scan, which resulted in poor recall of the presented narratives. All subjects had normal or corrected vision and were right-handed as assessed by the Edinburgh Handedness Questionnaire.
Ethics statement
Experiments were approved by the Ethics Committee of the Kyoto University Graduate School and Faculty of Medicine. All participants provided written informed consent on a form reviewed by the ethics board.
Data acquisition
Task
Subjects were placed in the supine position in the scanner with bilateral head restraint pads to minimize movement. Visual stimulation was created on a personal computer using the Cogent toolbox (University College London;
We used a block design fMRI paradigm with two types of task block and a resting fixation block pseudo-randomly alternating every 24 sec (Fig. 1). Subjects were instructed to fixate on the central fixation point and not think of anything in particular during the rest blocks. The rest block was always followed by the task block, whereas the task block was followed by either another task type or the rest block, to minimize anticipation while avoiding three consecutive task blocks.
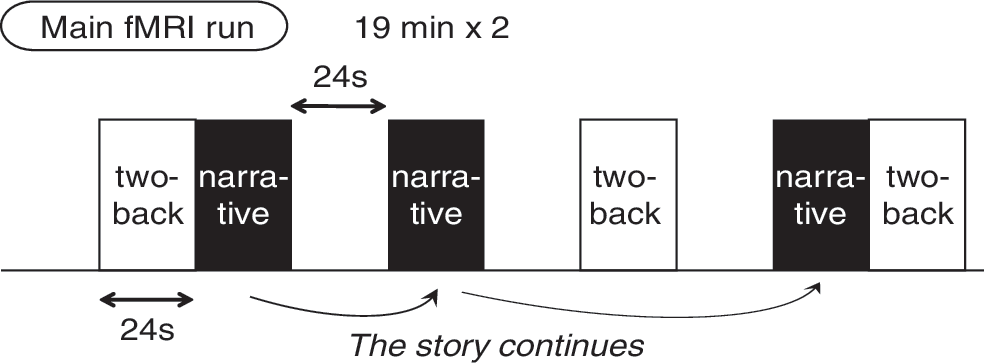
Temporal structure of the main functional magnetic resonance imaging (fMRI) runs.
The two tasks were selected to evoke opposite responses in DMN relative to rest, without considering direct comparison. To evoke the DMN activation, the participants read narratives of curious stories with no online response (task narrative appreciation [NA]; refer to Table 1 for narrative contents). This task was designed to evoke the comprehension of the characters' situations; this arrangement is a common component of many DMN-recruiting tasks (Fletcher et al., 1995). In addition, there is direct evidence for narrative-related DMN activity (Xu et al., 2005). To create a set of brief narratives operationally, we identified major story-gathering websites that introduce posts in 2-channel, the largest internet forum in Japan (
Narratives Used for the Narrative Appreciation Condition
Each narrative lasted for the number of blocks shown in parentheses in the first column.
Narratives were introduced through a serial presentation of Japanese bunsetsu, a phonetic break comprising a word and its postpositions or suffixes, with a duration of 1000 msec and a 200-msec interstimulus interval (20 stimuli per 24-sec block). Each of the five narratives was divided into five to eight consecutive sections; therefore, the stories were presented intermittently. At the end of the last block of each narrative, seven hyphens were presented.
For the DMN-deactivating conditions, a two-back, verbal working memory (WM) task was used, during which subjects pressed a button when a presented word was identical to the one we had observed two stimuli back in the sequence (2.4-sec retention period). To delineate the task type, each stimulus in the WM blocks was accompanied by two asterisks at both ends of the words. The WM task involves typical challenging, goal-directed behavior, and recruits the frontoparietal network or task-positive network (TPN) (Shehzad et al., 2009). With the same temporal structure as in the NA task, participants viewed a word or a short modifier phrase of between four and seven Japanese characters in length. To identify the DMN deactivation as originally proposed, we committed the first, short acquisition run (lasting 504 sec, 210 volumes) to DMN mapping using only the WM task (described later). The second and third runs lasted 1176 sec (490 volumes) with all three block types.
Data acquisition and preprocessing
Functional images were acquired using a Siemens 3 T whole-body MRI system with an eight-channel array coil, using a T2*-weighted gradient-recalled echo pulse sequence (field of view=192 mm; matrix=64×64; 38 oblique axial slices; slice thickness=3.0 mm; repetition time=2400 msec; echo time=30 msec; and flip angle=90°). For offline distortion correction, magnetic field mapping images were also acquired in the same field of view between the second and third runs (gradient-recalled echo images with echo times of 19 and 7.46 msec). The data were preprocessed and analyzed using the statistical parametric mapping software (SPM8; Wellcome Department of Cognitive Neurology, London, United Kingdom), implemented in MATLAB on a Linux operating system. Images were preprocessed using interscan slice time correction and three-dimensional motion correction with treatment of distortion and distortion-by-motion interaction (Hutton et al., 2002). For all participants, high-density three-dimensional images (MPRAGEs) of the brain were acquired for spatial normalization to the Montreal Neurological Institute template. The functional images were warped and resliced according to this transformation and smoothed using an isotropic Gaussian filter with kernel width of 6 mm.
Data processing
GLM analysis of the fMRI data
At the individual level, we modeled all three sessions in one SPM design matrix. This approach included regressors for the six head motion parameters (translation and rotation around three axes) to account for first-order, motion-related variance. All other regressors were created by convolution of mass neuronal-activity models, as either a unit impulse or a boxcar function, with a canonical hemodynamic response function to simulate the fMRI signal.
For the first brief run intended for DMN mapping by deactivation, we had only one regressor of interest modeling the WM task versus the rest. The negative parameter estimate map for this regressor was expected to include DMN.
The second and third runs had regressors for the (de)activation by the WM and NA tasks relative to rest. Transitions between blocks were also modeled as a zero-duration event occurring every 24 sec. These were then entered into a first-level multiple regression for each voxel, creating individual subject's statistical maps for contrasts of interest using the beta weights estimated from each participant's GLM.
After the individual first-level analyses, we conducted voxel-wise, one-sample t-tests based on a random-effects model in which the individual-response parameter was used as a random factor (Friston et al., 1999). The resulting set of voxel values for each regressor was set to the threshold t>7.07, which corresponded to p<0.05, corrected for multiple comparison over space (Friston et al., 1996). Therefore, we employed only the height threshold to ensure activity levels in the clusters, but because we had a priori knowledge about the activation, uncorrected thresholds of p=0.001 (t>3.61) were also used in the figures to delineate undetected regions even at the attenuated threshold. All the clusters reported in this study survived cluster extent threshold of 154 voxels, which corresponds to family-wise error-corrected p=0.05.
Regions of interest time course analysis
In each statistical brain map, we selected small square regions of interest (ROIs) (27 mm3) centered on the statistical peaks, and extracted signal time courses as the percentage of change from the session mean in each ROI. For the plots in Figure 2, only the consecutive task blocks (NA–WM or WM–NA) between the rest blocks were pooled, leaving the separated task blocks unused in this analysis.
Head motion analysis
To test the possibility of head motion contamination in block transition-related signals, we evaluated the spatial distribution or motion artifacts. Voxels suffering from motion artifacts are identified by a two-sided F-test with the threshold p<0.05, corrected for multiple comparisons, using the parameter estimates for the six motion regressors. These individual F-test maps were then converted to binary maps, assigning one to every voxel above the threshold. The 19 individual binary maps were combined to create a group map with a subject count in each voxel. Because we carefully controlled the head motion mainly by instruction and monitoring during the fMRI session, the within-session maximum translation/rotation was 2.03 mm/1.52°, respectively.
To quantitatively confirm the nonrandom distribution of transition responses, a globally normalized z-score map was created for the block transition-related group activation. The z-scores were then pooled across the participants from individual clusters according to WM<NA (DMN) and WM>NA (WM) comparisons. Clusters from each DMN components were selected by masking the automated anatomical labeling (AAL) atlas (Tzourio-Mazoyer et al., 2002). The z-scores of the transition response were then compared by two-tailed t-test between the DMN and WM peaks.
Independent component analysis
We performed an additional independent component analysis (ICA) on the group dataset of two main runs (490×2 time points×19 participants) using the GIFT toolbox (Calhoun et al., 2001). After the preprocessing described above, global mean was removed at each time point. We also ran the pipeline without the intensity normalization to confirm the robustness of the result. This set of MATLAB scripts provides a flexible ICA pipeline based on ICASSO, a procedure to assure the stability of ICA results against local minima problems (Himberg et al., 2004). With no information on the cognitive task given, the fMRI data were subjected to the ICASSO pipeline in which the ICA optimization was repeatedly run 10 times both bootstrapping (resampling) the data and randomizing initial conditions. During these iterations, repeated occurrence of similar components indicated the robustness of each estimated component as a strong cluster to survive in a similarity graph. The clustering was performed with hierarchical agglomerative clustering using the average linkage criterion. We chose the Infomax algorithm with a predetermined number of components, or model order, of 30.
Choices of model order have been arbitrary or empirical when authors sought for a compromise between insufficient decomposition and splitting of the large-scale cortical networks (Calhoun et al., 2009; Cole et al., 2010; Smith et al., 2012). Abou-Elseoud and others reported, using ICASSO, model orders fewer than 21 gives a general picture of cortical networks whereas model orders 30–40 covers more minor networks with some separation of overlapping subnetworks (Abou-Elseoud et al., 2010). The authors thought that 30 would be a reasonable choice to evaluate overlapping connectivity while keeping the regions connected in each independent component (IC) (Jafri, 2008; Jann et al., 2010). To assess reliability and validity of the connectivity, ICAs with model order of 20 and 56 were also run for comparison. This value, 56, was the average of automatically estimated model order for every participant by the toolbox function based on minimum description length (Li et al., 2007). In the resulting z-maps, they set a voxel threshold of z=2.33 (p=0.01, one-tailed), but used another threshold of z=1.0 for displaying purpose.
We summed the Z-values within the AAL ROI corresponding to posterior cingulate cortices (PCC), MPF, and rACC to sort out the DMN subnetworks by the signal contribution. The best-fit PCC component was discarded as strong artifact due to selective involvement of cerebrospinal fluid centered on the cistern of the great cerebral vein. Results from the other two model order settings were also sorted out, but the angular ROI was also used to capture IC14/20 and IC43/56 separated from the MPF component. We then created time course plots from the IC time courses by averaging task-related responses where WM and NA blocks occurred consecutively to see task relevance of the ICs. To capture other DMN-like ICs, additional template matching was performed using the core-DMN mask based on the main GLM result (rest>WM and NA>rest; light blue voxels in the Fig. 2A). All the components from each of the three ICAs (ICA-20, ICA-30, and ICA-56) were sorted according to the goodness-of-fit to the DMN template measured by summed Z-values.
Task engagement of each IC was statistically confirmed using the time course of back-projected individual ICs (Meda et al., 2009; Zhang and Li, 2012). Individual IC time courses were decomposed by linear regression with one of the reference time courses (NA, WM, and block transition) convolved with the canonical hemodynamic response. The estimated beta weights, or association estimation, were averaged over participants to represent the degree of task relatedness of the component.
Results
Task-induced responses
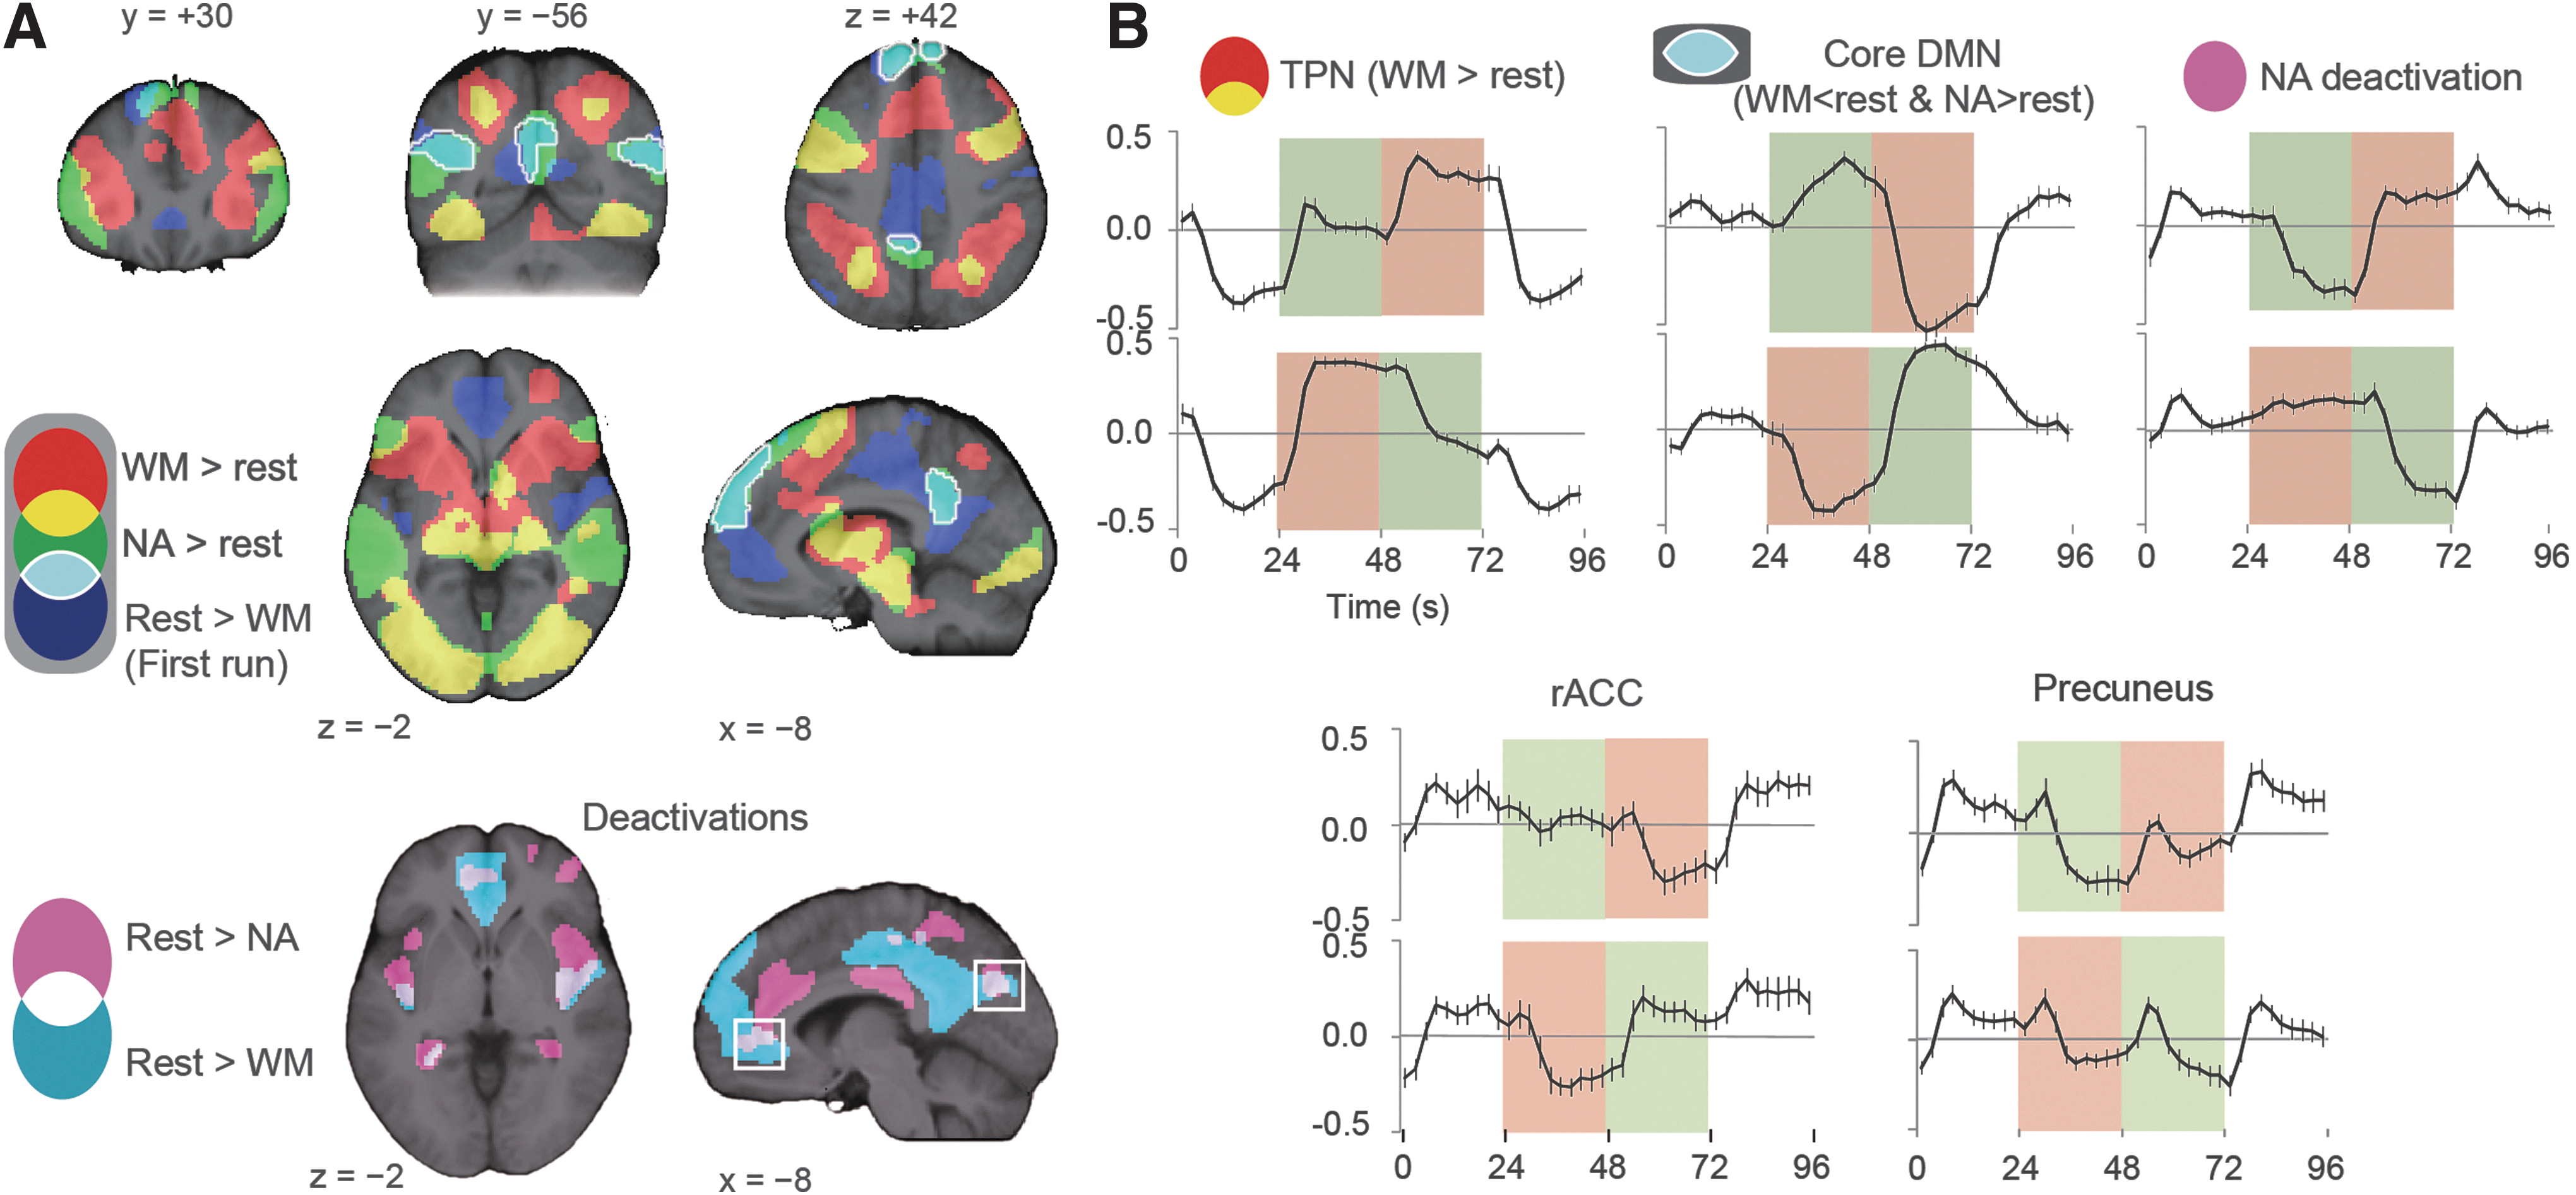
Brain activation/deactivation maps and ROI time courses are shown in Figure 2 and Supplementary Fig. S1 (Supplementary Data are available online at
Activation/Deactivation Statistical Peaks Above Height Threshold of p=0.05, Corrected for Multiple Comparisons, Except Where Indicated
BA, Brodmann area; DLPFC, dorsolateral prefrontal cortices; DMN, default mode network; rACC, rostral anterior cingulate cortex; PreSMA, pre-supplementary motor area; TPJ, temporoparietal junction; WM, working memory.
Brain regions that were recruited during NA (green) had a specific overlap (light blue with a white edge) with the WM deactivation in MPF, PCC, and the temporoparietal junction (TPJ); however, some DMN nodes were outside the cluster (the hippocampus and rACC). The NA-related PCC cluster extended from BA 23/31 to the retrosplenial areas (BA 29/30), but not to the precuneus. The NA task also bilaterally activated the so-called social brain (Blakemore, 2008) components, comprising the superior temporal sulci, MPF, and the inferior frontal gyri. The signal extracted from all of the overlapping voxels (light blue) confirmed the three signal levels, with the rest period showing an intermediate signal level (Fig. 2B, Core DMN).
The areas that positively responded only to the WM task (red) encompassed the saliency network (SaN), consisting of the dorsal ACC and the frontal operculum/anterior insula (Seeley et al., 2007). Furthermore, these cluster peaks showed a notable response to each block transition, which was consistent with the known properties of the SaN (Fox et al., 2005a). The time course from the dorsal ACC peak showed three activity levels reciprocal to DMN (Supplementary Fig. S1).
The areas showing NA-specific deactivation (Fig. 2A, magenta) were as follows: DLPFC, a subset of the SaN, the pericallosal cortices (or a periallocortical region adjacent to the corpus callosum), and the anterior inferior parietal lobule. The averaged time course from these regions confirms weak activation in response to the WM task, as indicated by the overlap with the WM activation (Fig. 2B). We also identified some purely rest-related clusters (white) with negative responses to both NA and WM. Raw time courses in the rACC and the inferior precuneus confirmed that these regions were most active during rest as well as block transition-related.
A broad response to a block transition
As indicated by the raw time courses, many regions showed a transient signal increase during every block transition (Figs. 2 and 3, the peak coordinates are listed in Table 2). As previously reported (Fox et al., 2005a), this transition-related signal increase was diffuse in such a manner that we could detect it in the global signal (Fig. 3A). Spatial distribution of this broad response is shown in Figure 3B (top). There was a clear tendency for the core DMN to be outside the clusters; this pattern is consistent with the actual time courses from DMN lacking a response to a transition (Fig. 3D).
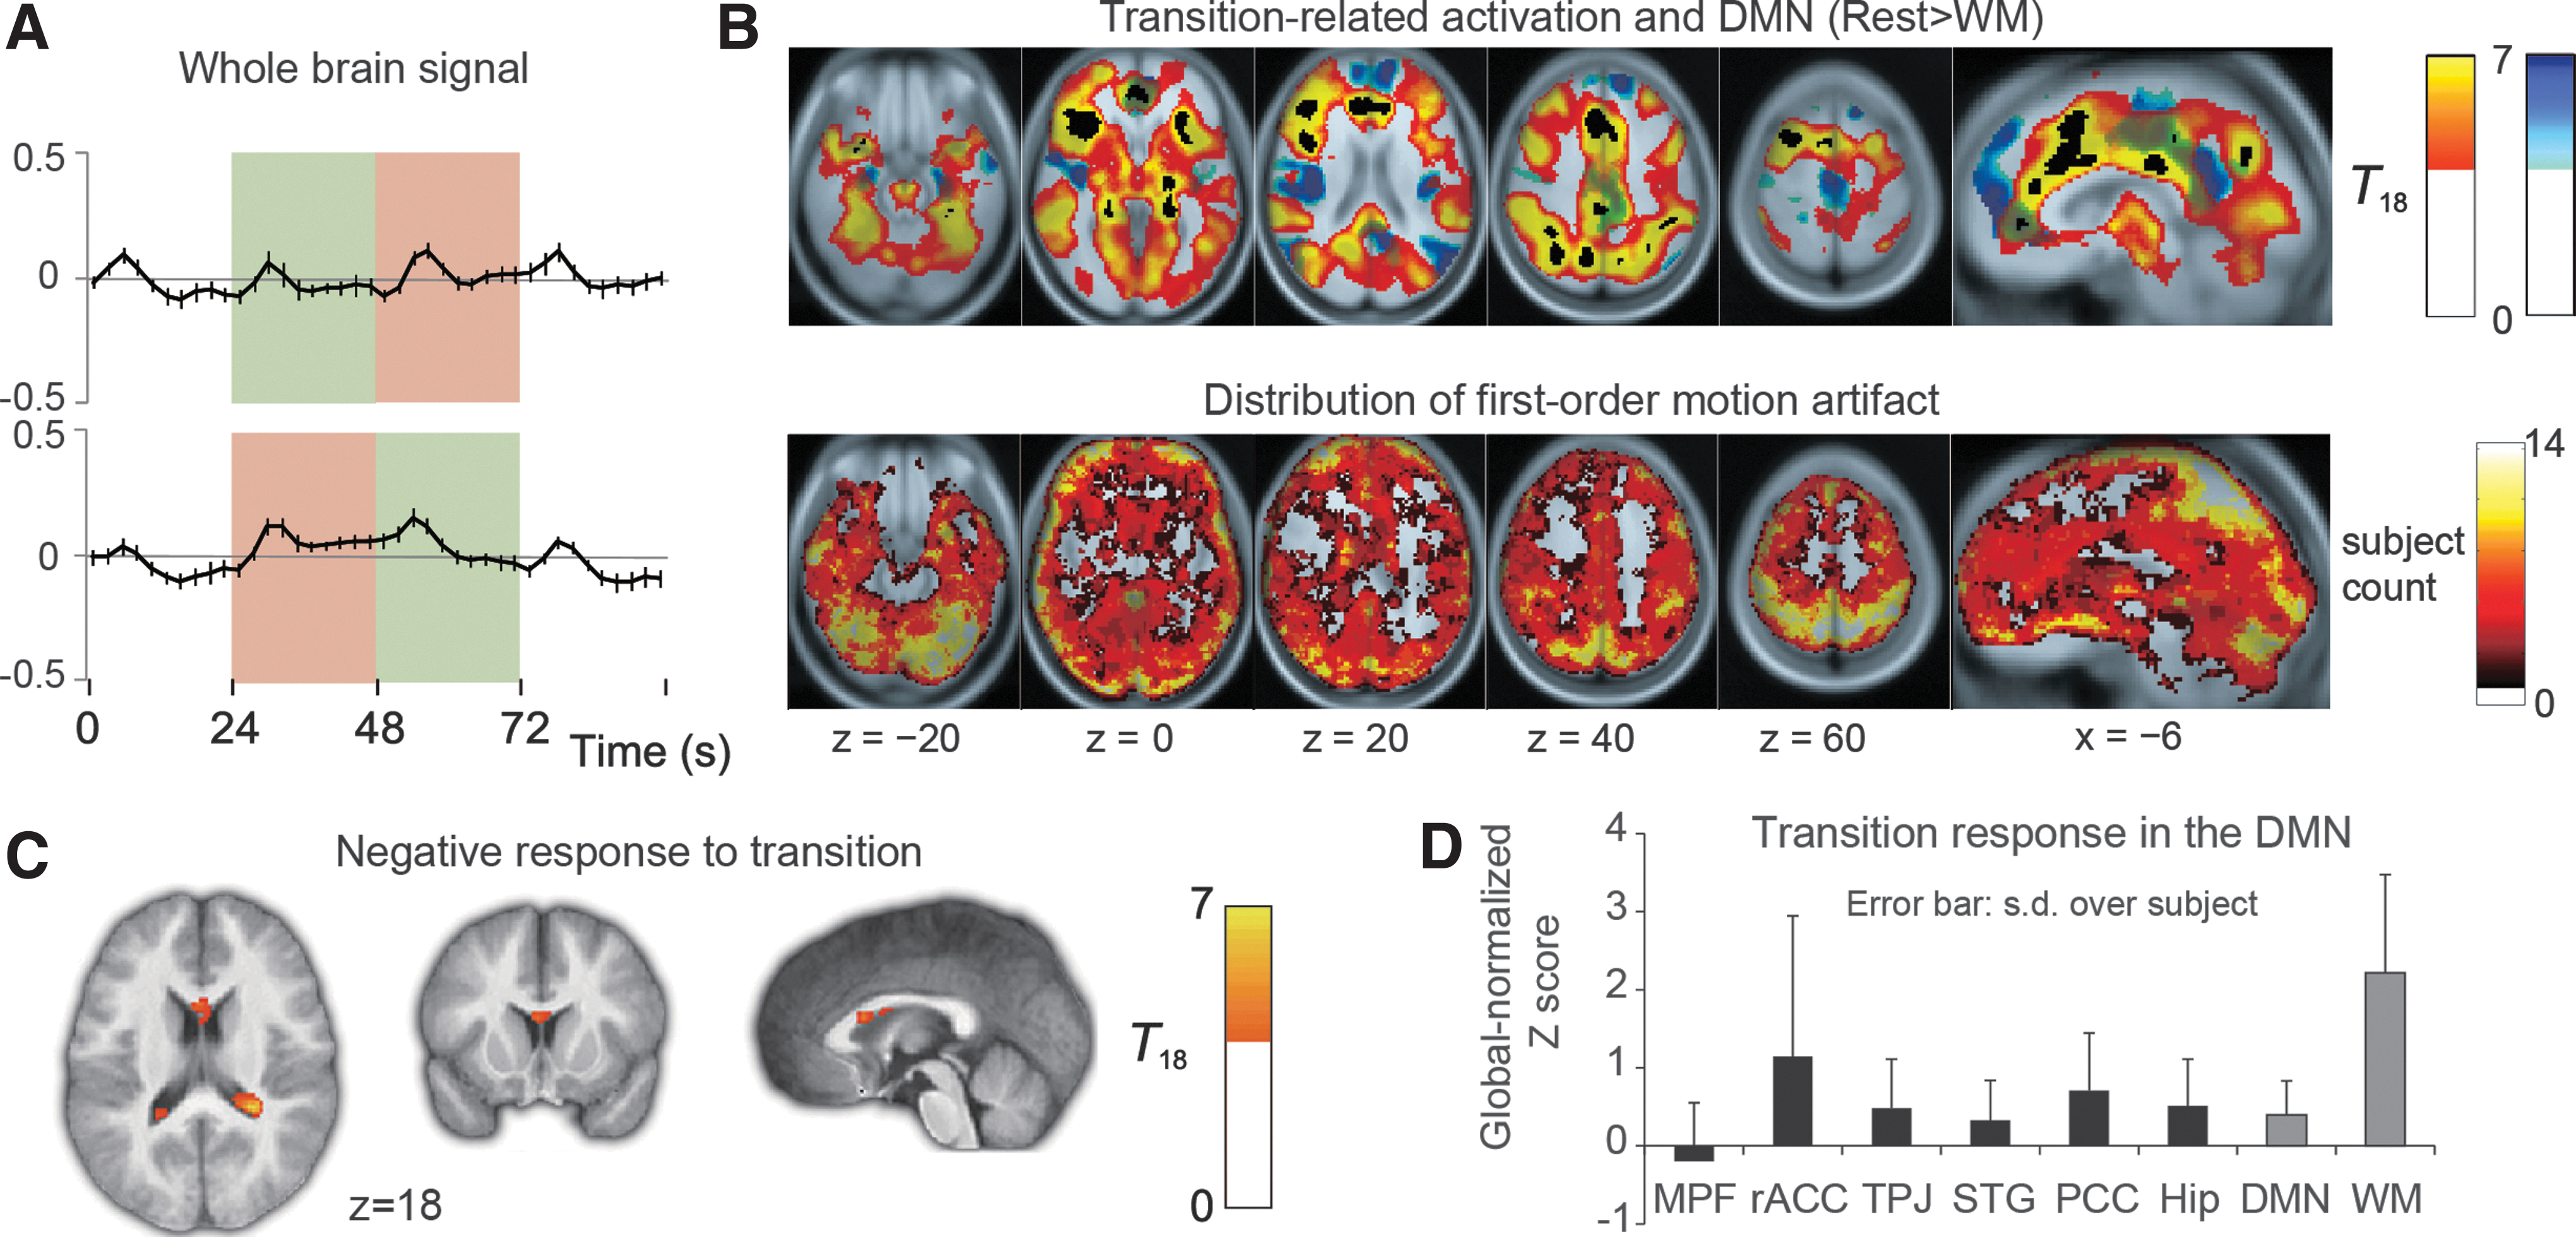
The response to a block transition.
The motion artifacts exhibited spatial distribution different from the transition response (Fig. 3B, bottom). The motion-sensitive voxels were found primarily on the brain surface where head dislocation has a significant effect on partial volume in the voxels. The transition response was more diffusely distributed in the gray matter both in the medial and the lateral side of each hemisphere.
The core DMN regions did not show significant deactivation either. Even at the attenuated threshold, the statistical map (Fig. 3C) demonstrated limited areas around and within the CSF, indicating absence of such a response in the gray matter. Figure 3D shows the globally normalized z-score values from the transition response statistical map. The DMN peaks show significantly lower but nonnegative scores compared with the WM peaks (p<0.001), except for the rACC (p=0.042).
ICA-defined PCC networks
By sorting the ICA components by the mean z-score in the three DMN ROIs, we identified DMN subnetworks (Fig. 4). Both the PCC and rACC-centered components had a significant PCC contribution exceeding the threshold (PCC/IC1 peak z-value: 4.63; rACC/IC15:3.52), but the MPF-centered IC10 had relatively weak contribution (peak z-value=2.21). Its contribution to the TPJ was prominent on the other hand (cluster peak z=2.95). The first PCC-related IC was centered on the precuneus and extended toward the middle cingulate and pericallosal cortices, with considerable overlap with the first IC in the PCC/precuneus region. The time course was characterized by a block transition response, consistent with the precuneal raw time course in Figure 2B. At the same time, there was slight, but significant deactivation to both tasks confirmed by the task association estimate (bar graph). The first MPF-related IC had both spatial extent and a time course representative of the DMN/NA-related areas. Finally the rACC-centered IC, peaking at the anterior tip of the cingulate sulcus, also extended to the PCC along the pericallosal structure. This component showed some transition response and NA-related deactivation consistent with the SPM deactivation map (Fig. 2A, magenta). The ICA pipeline with different numbers of predetermined model order showed similar split of the DMN indicating robustness of these ICA-derived connectivity structure (right panels). This set of DMN-like components were robust against the choice of data-centering methods between global signal removal and voxel-wise mean removal.
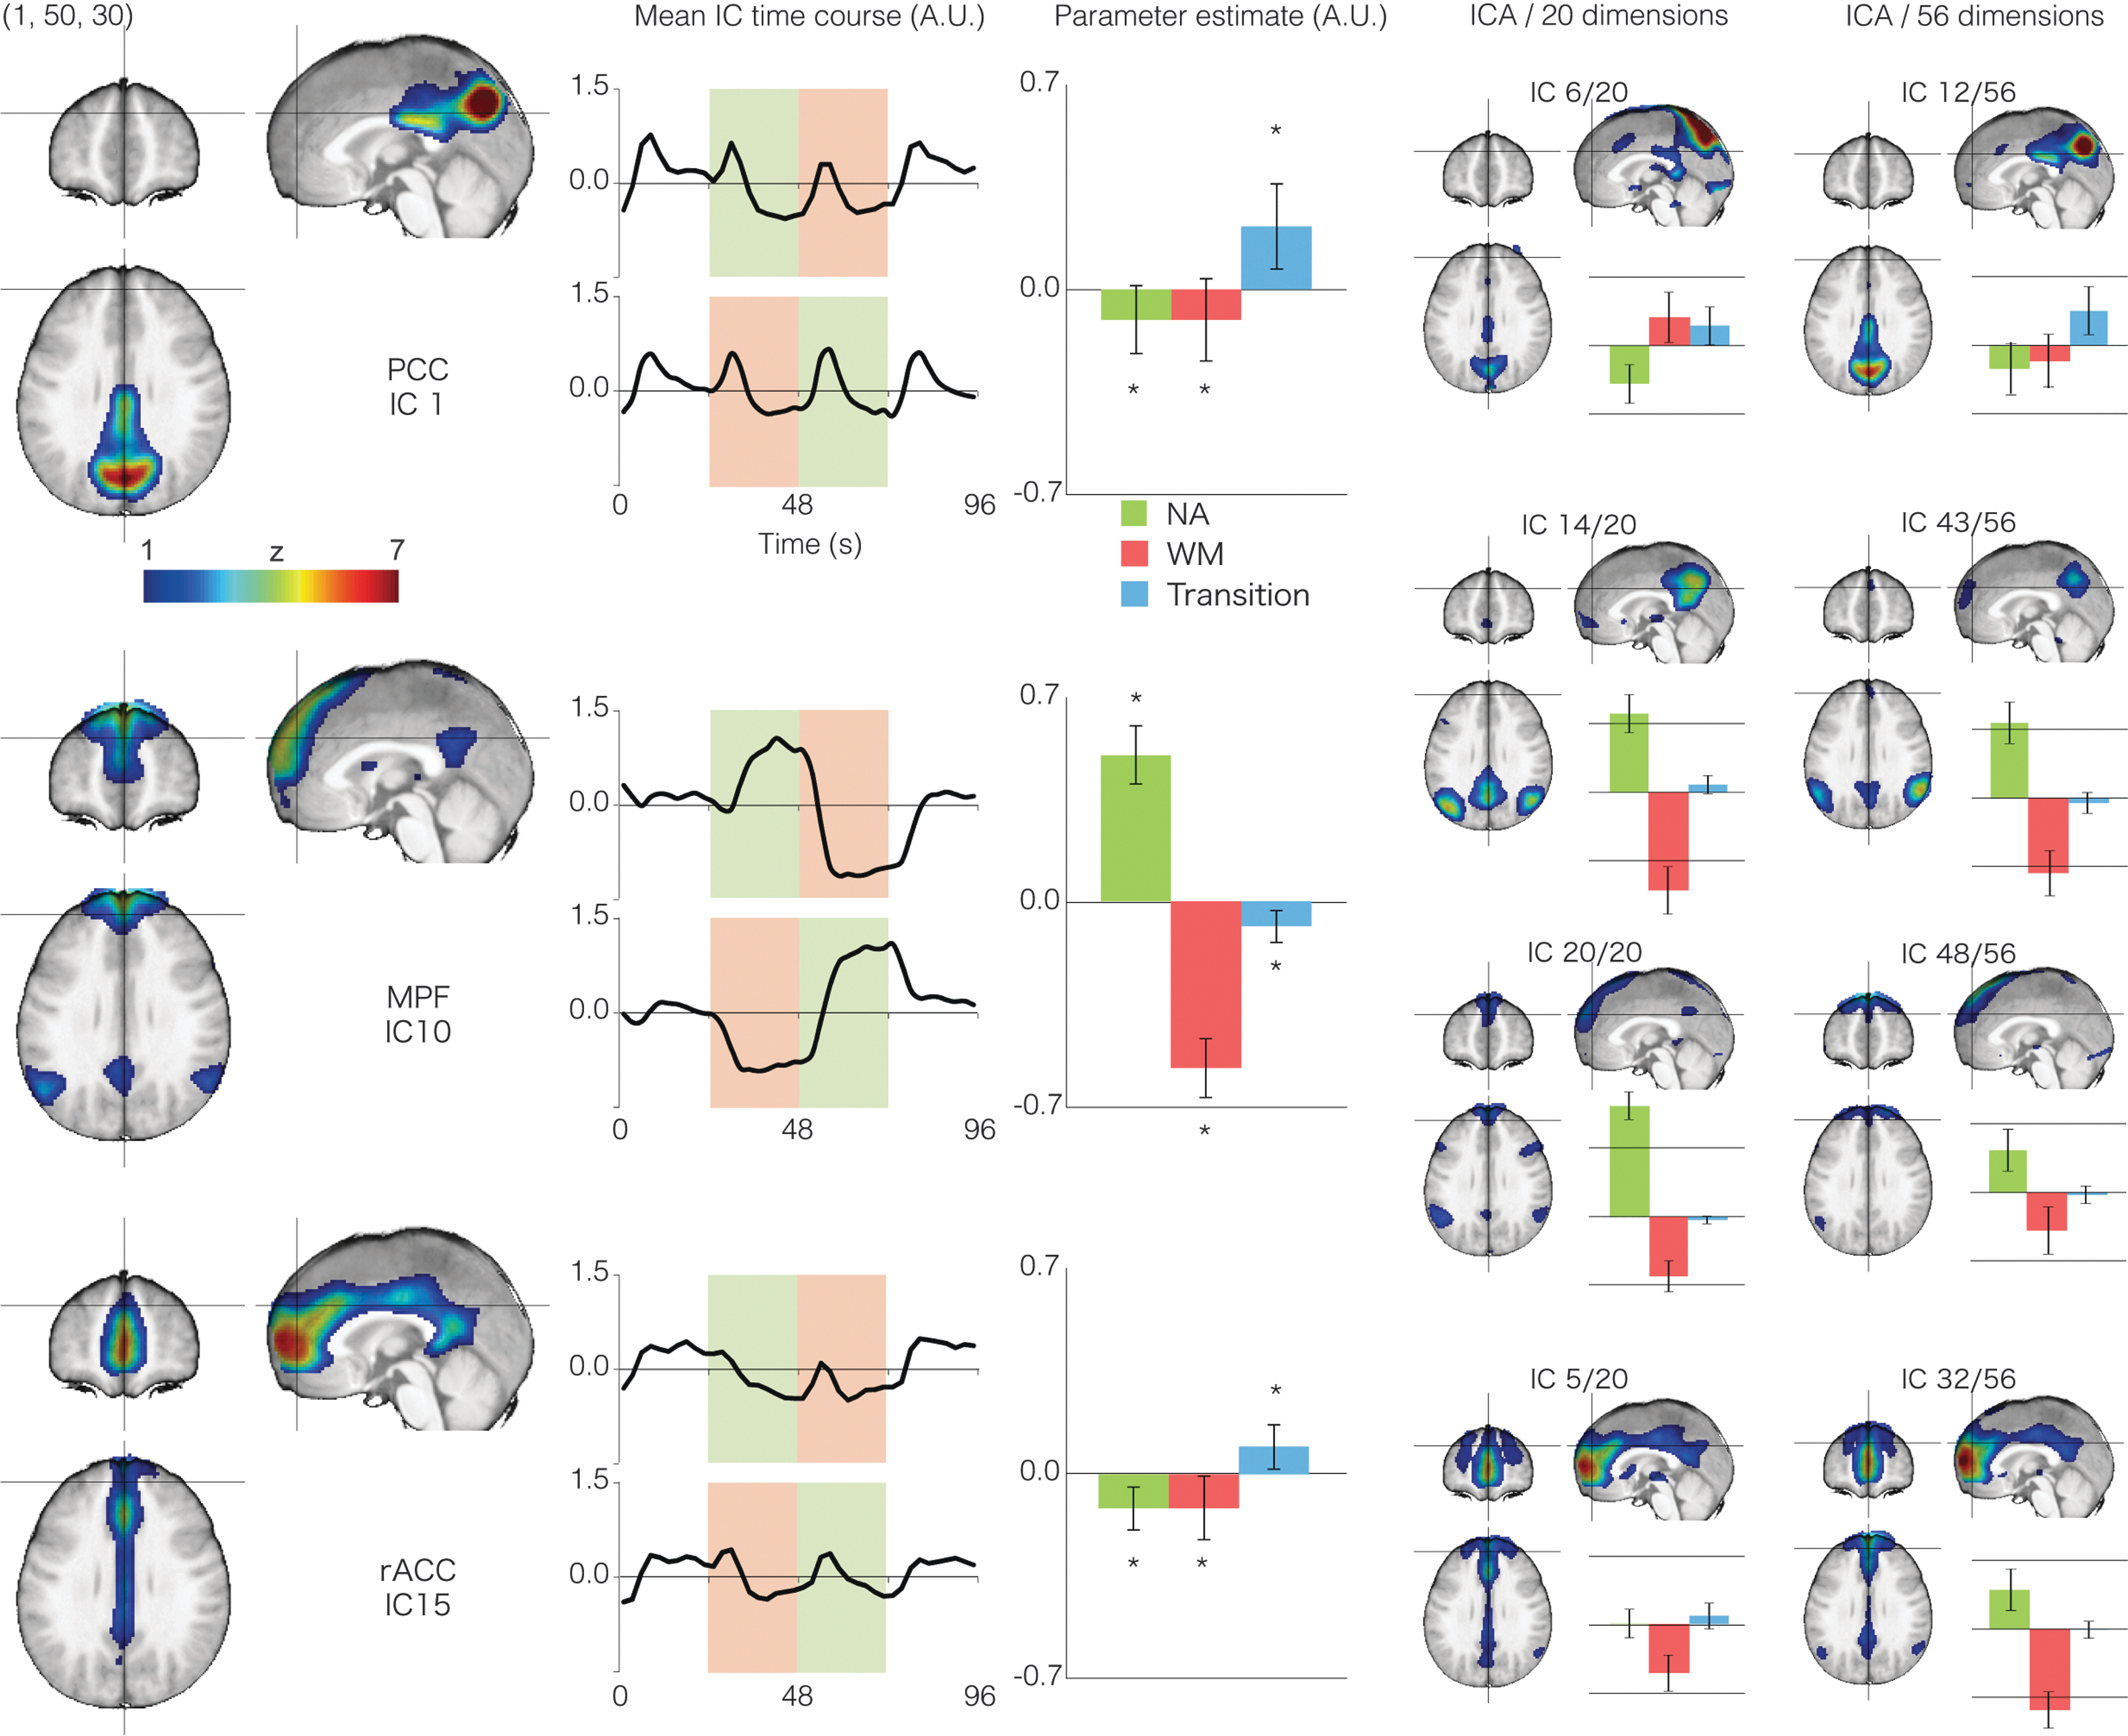
Results of independent component analysis (ICA). From the top to bottom, ICs with the highest contribution to PCC, MPF, and rACC are shown. All of the three components more or less involve the PCC. Next to each spatial map, the IC time course is plotted after averaging over trials (where NA and WM blocks occurred successively). To confirm the task engagement of the ICs, bar graphs show association parameter estimates to the three regressors for NA, WM blocks, and block transitions. The error bars are standard deviations and the asterisks indicate significant difference from zero (two-tailed, p<0.001). These overlapping ICs within the DMN were preserved in the other two ICA results using model order of 20/56, supporting the existence of functional connectivity patterns found here. IC, independent component.
Additional whole-DMN template matching revealed that the three DMN components from the ICA-20 corresponded to the top three best-fit ICs to the core DMN. On the other hand, from the ICA-30, there was one DMN-like component with better goodness-of-fit than the IC1 and IC15 (Supplementary Fig. S2, top left). This component may indicate a unique connectivity of the PCC with the anterior part of the precuneus and the TPJ, although the time course was scarcely distinguishable from the core DMN (Fig. 4). Out of 4 ICs from the ICA-56 that exceeded IC12 and 48 inthe goodness-of-fit, one component was discarded as an artifact judging from its distribution along the superior sagittal sinus. Among the other three ICs (Supplementary Fig. S2), IC52 explained the signals in the left TPJ (extending dorsally to the left inferior parietal lobule) exhibiting a time course compatible with the main GLM (NA>rest and WM<rest). The IC17 was also a local component close to the cistern of the great cerebral vein with a noisy time course (Dagli et al., 1999). Finally the IC56 represented bilateral lower TPJ, whose time course is consistent with the GLM map of NA-related regions (Fig. 2, green regions), but neither deactivated by WM nor connected to the MPF, PCC, or rACC. None of these components had sufficient strength or consistency to support another unique network edge.
Discussion
The primary finding of this study is that the majority of DMN components, which exhibit typical three activity levels in response to the tasks they used, coincide with the minor fraction of the cerebral cortex that remains almost silent in response to a block transition. This transition response was dissociable from the motion artifacts according to their distribution patterns and the delay from the actual transition, consistent with the hemodynamic response. One study showed that DMN is not necessarily suppressed at a detectable level by a passive task that evokes only weak activation either (Greicius and Menon, 2004). Their findings differed from the present results because in our results, (1) deactivation was weak but activation was strong despite (2) a brief duration of block transition event in these experiments. We observed strong transition responses in multiple networks other than DMN; this situation is suggestive of a significant cognitive load in the transition process.
This block transition event can be considered a task switching, involving numerous brain regions (Monsell, 2003). A previous study demonstrated a broad response to a block transition centered on TPN, dissociable from the continuous task-specific responses (Fox et al., 2005a). Although they used divergent task sets similar to these, they evaluated only the positive response and the DMN behavior during the transition has never been documented to the best of the authors' knowledge. Because DMN deactivation has been reported to occur even in response to a short event (Singh and Fawcett, 2008), their finding appears to be new and requires explanation. In fact, a transient blood oxygenation level dependent (BOLD) signal increase at the task onset (and offset) was once modeled as uncoupling caused by a hemodynamic-response property of some brain regions (Obata et al., 2004). As Fox et al. (2005) already argued in their report, such transient responses are not likely to be purely hemodynamic in origin, but we still cannot rule out the possibility of neurovascular uncoupling. Because we selected a pair of completely unrelated tasks intermixed with random instances of rest epochs, the response can involve an arousal-causing systemic response such as fluctuation in respiration and heart rate (Birn, 2012; Wise et al., 2004).
It is noteworthy that even if an uncoupling truly is taking place, that is, a nonneuronal contamination by an artifact, the question remains why only the core DMN is spared from such a global event. The same argument should be valid for the effects of head motion. If these regions selectively have different susceptibility to those artifacts, this situation is by itself problematic because such a mechanism would also contribute to the DMN connectivity. These phenomena need further research because of the limitations of the present study using only fMRI.
On the other hand, the present results allow for a reasonable interpretation on the basis of neuronal activity. This slow-response property of DMN is in good agreement with the network's presumed role by some authors in stimulus-independent thought or processing of highly abstract information, distant from both sensory input and motor output (Northoff and Panksepp, 2008; Schooler et al., 2011). Besides, those subregions exhibit high reproducibility among other components and are included in most DMN studies. Therefore, the authors speculate that the unresponsiveness to the transition events is likely to be one of the defining attributes of the core DMN.
The two subnetworks
Using ICA, we also found that the precuneus and the rACC (plus the orbitofrontal cortex) positively respond to this transition and are dissociable from the core DMN, whereas still being connected to it. These regions are certainly synchronized with PCC, but presumably through a group of neurons different from the core DMN. It is widely accepted that each DMN node has a unique function, and, therefore, the connectivity should change depending on the brain state (Bluhm et al., 2011). Such local activities are believed to interfere with connectivity to other regions in some cases, leading to negative correlation between brain function and connectivity (Hawellek et al., 2011). The present finding implies that such regional activities are also contributing to other subnetworks behaving independently from the core network, still certainly reflecting intrinsic connectivity.
The role of these two areas in arousal or cognitive control has been studied in depth (Allman et al., 2001; Cavanna and Trimble, 2006). Although there is an argument that the precuneus should be excluded from DMN, a recent study attributed a special role to the precuneus as a control center of the network function (Utevsky et al., 2014). The controversy appears to be centered on the definition, but because of functional inhomogeneity, we consider that exclusion of the precuneus may reduce confusion in some cases. A similar argument would apply to the explicit inclusion of the rACC in DMN by some authors but not others.
Although identical datasets were fed into ICA and GLM, one may notice that the IC spatial maps have high smoothness for the complex, task-related functional parcellation (Fig. 2). According to a recent study, the fMRI signal connectivity has two components: a local component from spin density and a distant one from the T2* effect (Wu et al., 2012). The former is sensitive to a local circulatory system through variation in intravascular signals, which is relatively independent of neuronal activity (Peltier and Noll, 2002). Presumably, the core DMN anatomy we defined in this study is spatially extended by the spreading effects of this mechanism in some cases.
Conclusion
Using a very simple experimental setting and a combination of model-based and model-free analytical methods, we uncovered heterogeneity in edges connecting the network nodes within DMN. While the core DMN exhibits unresponsiveness to a transient global event, the precuneus/rACC strongly responded and yet connected to the PCC. These multiple modes of the DMN connectivity would account for the robust detection of the network with significant variation in its anatomy.
Footnotes
Acknowledgments
The authors thank Eriko Takahashi for the Japanese–English translation. This work was supported by a grant from the Japan Society for the Promotion of Science (Grant-in-Aid for Scientific Research C, 25461817) and Smoking Research Foundation.
Author Disclosure Statement
None of the authors have competing financial interests.
References
Supplementary Material
Please find the following supplemental material available below.
For Open Access articles published under a Creative Commons License, all supplemental material carries the same license as the article it is associated with.
For non-Open Access articles published, all supplemental material carries a non-exclusive license, and permission requests for re-use of supplemental material or any part of supplemental material shall be sent directly to the copyright owner as specified in the copyright notice associated with the article.